Pergamon Mechanics Research Communications, Vol. 21, No. 2, pp. 131-138, 1994
Copyright © 1994 Elsevier Science Lid Printed in the USA. All rights reseawed
0093-6413/94 $6.00 + .00
IMPACT PRESSURE MEASUREMENTS IN A HIGH SPEED RAREFIED FLOW
Channa Raju, A.K. Sreekanth and Job Kurian Department of Aerospace Engineering, Indian Institute of Technology, Madras-600 036, India
(Received 26 February 1993; accepted for print 6 January 1994)
1. In t roduct ion
The pitot probes are primary and often complementary tools in flight and laboratory measurements. In continuum flow the Mach number can be determined from the ratio of impact to static pressure using the well known Rayleigh formula in supersonic flow, and isentropic relation in subsonic flow. At low Reynolds numbers the pressure measured using conventional pitot tubes will have large departures from that calculated using the above mentioned relations due to various rarefaction ef- fects, generally termed as viscous effects at low densities. At a Reynolds number of the order of 10 the measured pressure using a pitot tube at a Mach number of 2.0 can depart by a order of 200 percent, depending on the geometry of the probe, and larger departures at higher Mach numbers.
The performance of pressure probes has been studied by a large number of investigators [1,2,3] and the correction factors to be applied to the measured values of pressure as a function of Reynolds number based on probe diameter and Mach number are available in the form of curves and tables [4]. The process is cumbersome and the viscous correction factors are available only to a limited Mach number range up to 8.0 and many methods are suggested to calculate the same for higher Mach numbers. Therefore even the most careful measurements of pressure will become question- able if not interpreted properly.
Recently, Sankovich [5] based on the static pressure survey in a circular tube introduced a new design of an impact probe whose performance is free of rarefaction effects. Since the concept is new and promising for the low density research, verification of its utility in well known flow situations is desirable. This paper presents an experimental study on the various aspects performance of this probe.
2. Experimental Investigation
2.1 Experimental Facility
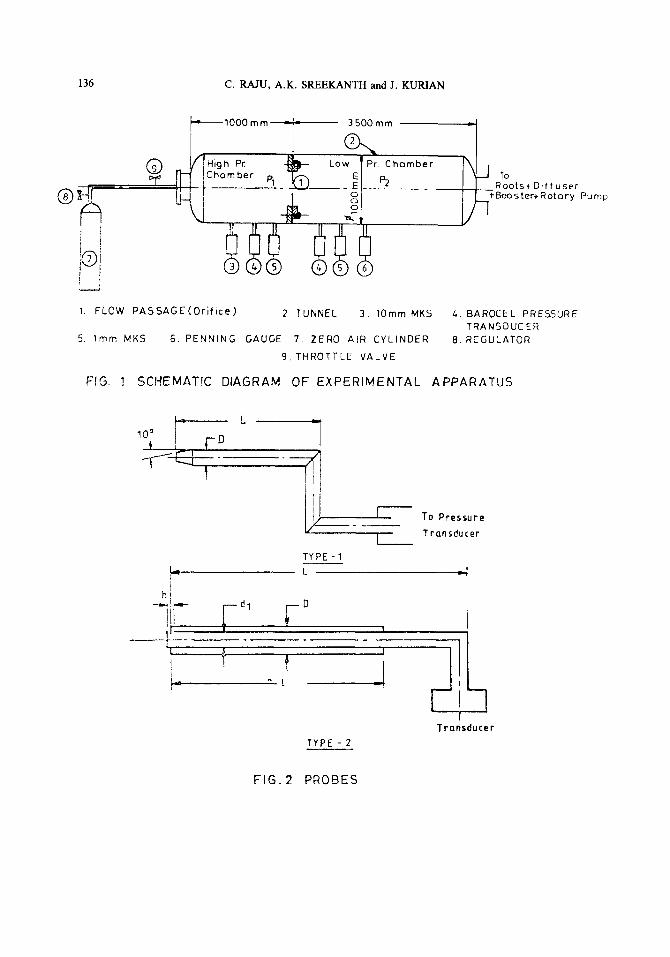
The facility consisted of a low density wind tunnel together with its accompanying instrumentation. The continuous flow tunnel has an upstream stagnation chamber, nozzle support unit and down- stream plenum chamber and is evacuated by a vane type rotary pump, Roots pump and a pair of vapour diffusion pumps. A schematic representation of the experimental apparatus is shown in Fig. [1]. The instrumentation included pressure sensors of MKS make of 1 torr and 10 tort ranges with the accuracy of 0,08% of the reading and Barocel electronic sensors for measuring upstream, probe and downstream chamber pressures. The probe pressure was measured by two high
131
132 C. RAJU, A.K. SREEKANTH and J. KURIAN
Time Response of Probes
After connecting to the transducer unit, each probe was tested for its time response to a very rapid
rise in the chamber pressure from a fraction of micron to about 100 microns. The pressure was
measured using the instrumentation described. The time required to record 99.9 percent of the
pressure increase varied from few seconds to about 2 minutes with the longest probe.
2.3 Experimental Procedure
The tunnel was made ready for experiments by evacuating to a pressure less than 10 -5 torr and well
outgassed for several hours using an Edwards diffstak pump. At room temperature dry air from
compressed cylinders was admitted to the stagnation chamber through a constant pressure regula-
tor and a throttle valve. The probe along with the transducer was fixed on the vertical flange of a
three axes traversing mechanism, operated remotely. Once the steady flow was set for a given up-
stream pressure, the probe was moved along the axis of the jet and the pressure values recorded at
close intervals. The same was repeated for different upstream pressures.
3. Results and Discussion
The axisymmetric jets issued from circular orifices expanding to very low pressures have been
studied by Sherman and Ashkenas [6] and their empirical relations were used for comparisons.
The measured pitot pressures on the axis were converted to Mach numbers using normal shock
relations. Birds parameter 'p' calculated using upstream conditions and measured Mach numbers,
was used for knowing the onset of departure from continuum flow.
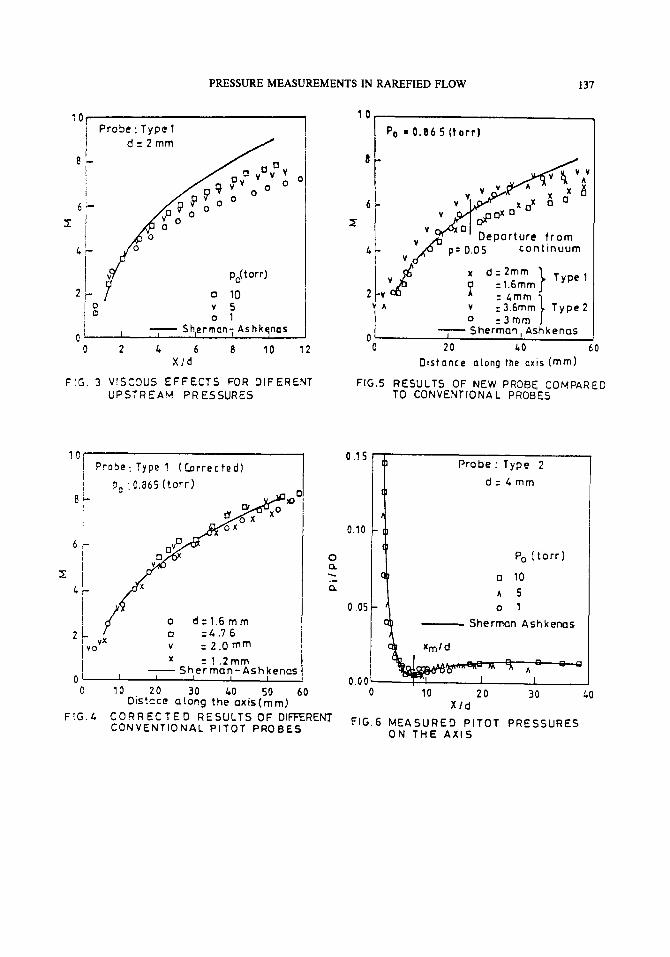
The results of one of the type 1 probes for three upstream conditions are given in Fig. [3]. It shows
that beyond a x /d value of about 3.5 on the axis of the jet large departures of measured pressures
from those given by Sherman-Ashkenas relation occur. At large x/d large departures occur and at
lower upstream pressures the corrections involved are higher. The results of all the type 1 probes for
one of the upstream pressure is presented in Fig. [4] and the results agree quite well after applying
the appropriate correction factors.
The results of all the three type 2 probes are compared with the results of two of type 1 probes in Fig.
[5]. The results of type 1 are uncorrected for viscous effects and it is seen that the correction
required for the probe of 1.6 mm diameter are slightly larger due to lower probe Reynolds number
than that of probe with the diameter 2 mm, which is a well known result. In the case of type 2 probes,
PRESSURE MEASUREMENTS IN RAREFIED FLOW 133
accuracy MKS 170 series temperature controlled transducers of 1 torr and 10 torr. These gauges
could be used inside the vacuum chamber mounted on a three axes traversing mechanism along
with the probe, and had an accuracy of 0.05% of the reading.
The free jet issued from a circular sonic orifice of diameter 6.8mm (made out of a thin aluminum
sheet, I/d = 0.015) was used for studying the performance of the probes.
2.2 Details of Probes
For comparison two kinds of probes were fabricated and used.
The first set of 4 probes, which are conventional pitot tubes similar to those used by Enkenhus [1]
and Ashkenas [4] and the second set consisting of 3 probes of Sankovich [5] type. These two
sets are referred to as type 1 and type 2 respectively for identification. The constructional details
are shown in Fig. [2].
The salient features of the probes are described below:
TYPE 1 PROBE
a. 10 degree external chamfer
b. Ratio of O.D to I.D = 1.25
c. Ratio of length to O.D = 50
The outer diameter of the four probes were: 1.2mm ([1]), 1.6mm, 2mm and 4.76mm.
TYPE 2 PROBE
The probe essentially consists of two concentric tubes, the inner tube having an orifice whose
center coincides with the edge of the outer tube. The outer tube was sealed at the rear end as
shown in Fig. [2]. The three probes had diameters 'D' (O.D of outer tube) of 4mm, 3mm and 3.6mm,
the first two had a length 'L' of 50mm and the length of the third one was 75mm. The diameter of
the inner tube 'd' was 2mm and the orifice width 'h' was O.5mm, and these were kept constant for all
the probes.
Leak Testing
All the probes were leak tested thoroughly before installation using a helium mass spectrometer type
leak detector. The entire pressure measuring system and the jet source assembly was also tested
similarly for possible leaks.
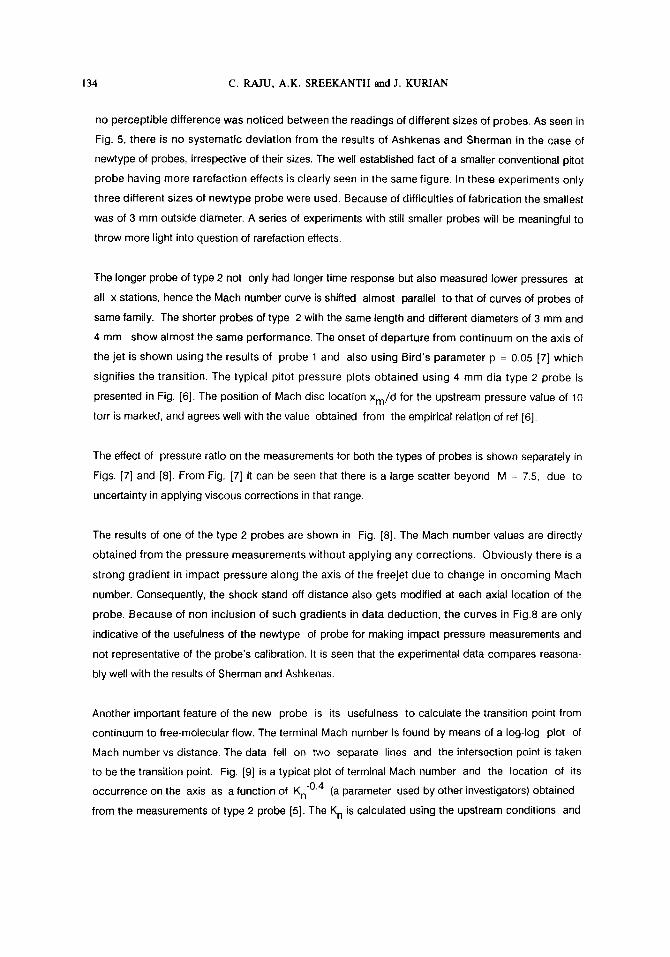
134 C. RAJU, A.K. SREEKANTH and J. KURIAN
no perceptible difference was noticed between the readings of different sizes of probes. As seen in
Fig. 5, there is no systematic deviation from the results of Ashkenas and Sherman in the case of
newtype of probes, irrespective of their sizes. The well established fact of a smaller conventional pitot
probe having more rarefaction effects is clearly seen in the same figure. In these experiments only
three different sizes of newtype probe were used. Because of difficulties of fabrication the smallest
was of 3 mm outside diameter. A series of experiments with still smaller probes will be meaningful to
throw more light into question of rarefaction effects.
The longer probe of type 2 not only had longer time response but also measured lower pressures at
all x stations, hence the Mach number curve is shifted almost parallel to that of curves of probes of
same family. The shorter probes of type 2 with the same length and different diameters of 3 mm and
4 mm show almost the same performance. The onset of departure from continuum on the axis of
the jet is shown using the results of probe 1 and also using Bird's parameter p = 0.05 [7] which
signifies the transition. The typical pitot pressure plots obtained using 4 mm dia type 2 probe is
presented in Fig. [6]. The position of Mach disc location Xm/d for the upstream pressure value of 10
torr is marked, and agrees well with the value obtained from the empirical relation of ref [6].
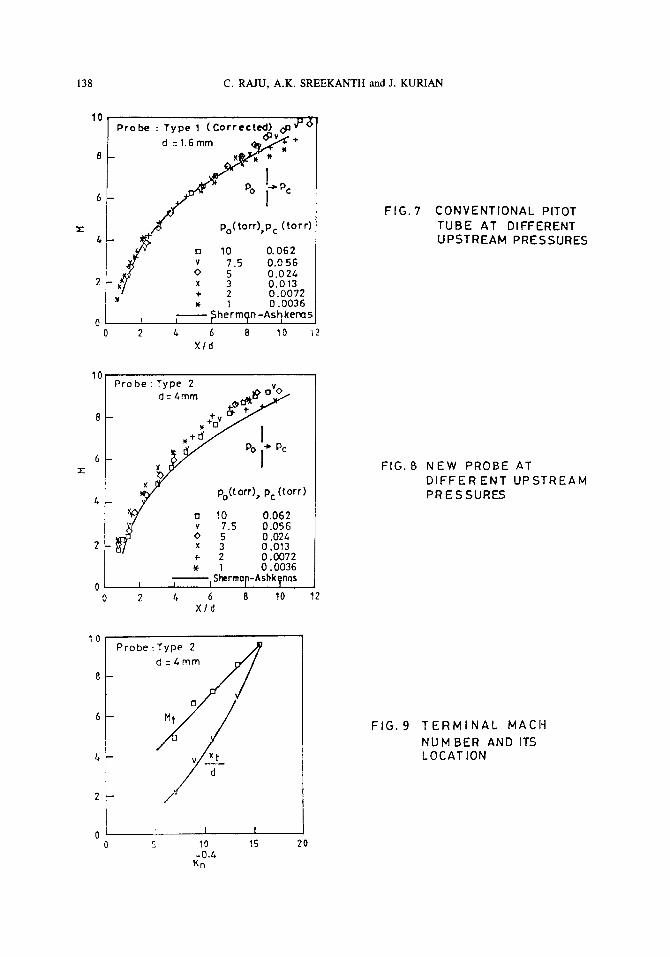
The effect of pressure ratio on the measurements for both the types of probes is shown separately in
Figs. [7] and [8]. From Fig. [7] it can be seen that there is a large scatter beyond M = 7.5, due to
uncertainty in applying viscous corrections in that range.
The results of one of the type 2 probes are shown in Fig. [8]. The Mach number values are directly
obtained from the pressure measurements without applying any corrections. Obviously there is a
strong gradient in impact pressure along the axis of the freejet due to change in oncoming Mach
number. Consequently, the shock stand off distance also gets modified at each axial location of the
probe. Because of non inclusion of such gradients in data deduction, the curves in Fig.8 are only
indicative of the usefulness of the newtype of probe for making impact pressure measurements and
not representative of the probe's calibration. It is seen that the experimental data compares reasona-
bly well with the results of Sherman and Ashkenas.
Another important feature of the new probe is its usefulness to calculate the transition point from
continuum to free-molecular flow. The terminal Mach number is found by means of a log-log plot of
Mach number vs distance. The data fell on two separate lines and the intersection point is taken
to be the transition point. Fig. [9] is a typical plot of terminal Mach number and the location of its
occurrence on the axis as a function of Kn -04 (a parameter used by other investigators) obtained
from the measurements of type 2 probe [5]. The K n is calculated using the upstream conditions and
PRESSURE MEASUREMENTS IN RAREFIED FLOW 135
the orifice diameter. Ref. [3] suggests that the transition region can be regarded to a good approxi-
mation as a surface of freezing where the terminal Mach number is calculated. The figure indicates
that at higher values of K n the transition from continuum to free molecular flow occurs close to orifice
exit.
Exper imental Error
A typical experiment was repeated several times using a sample probe of both the types and from the
repeatability data of these experiments it was found that the maximum error in determination of
Mach number was less than 3%.
4. Conclusions
The performance of the new probe is certainly promising. It offers a new and a more direct method
of determination of pitot pressures in a low density flow. The theoretical aspects of such a probe in
eliminating rarefaction effects in impact pressure measurements warrant further investigation. It is felt
that this probe can be a handy tool for low density research.
References
1,
2.
3.
K.R. Enkenhus, "Pressure probes at very low density", UTIA Rep. No.43, 1957.
K. Rogers, J.B. Wainwright and K.J. Touryan, "Impact and static pressure measurements in
high speed flows with transitional Knudson numbers", 4th RGD, 1964.
J.B. Anderson, R.P. Andres, J.B. Fenn and G. Maise, "Studies on low density supersonic jets",
4th RGD, 1964.
H.I. Ashkenas, JPL Space Programs Summary No.37-15.
V.M. Sankovich, "Stagnation pressure porbefor supersonic rarefied gas flows", 15th RGD
1986.
H.I. Ashkenas and F. Sherman, "The structure and utilisation of supersonic free jets in low
density wind tunnels", 4th RGD, 1964.
G.A. Bird, "Break-down of continuum flow in free jets and rocket plumes", 12th RGD, 1980.
136 C. RAJU, A.K. SREEKANTH and J. KURIAN
1oi
® ~o lOOOmm == 350Omm
h Pr ~ L o w ~ Pr. Chamber
gi
1. FLOW PASSAGE(Ori f ice) 2 TUNNEL 3. 10mm MKS
5. Imm MKS 6. PENNING GAUGE 7. ZERO AIR CYLINDER
9. THROTTLE VALVE
4. BAROCEL PRESSURE TRANSDUCER
8. REGULATOR
FrG. ! SCI4EMAT!C DIAGRAM OF EXPERIMENTAL APPARATUS
[ . . . . . L
10 ° { -
F
I
F.
- d l F-"
,! " t
j TYPE - 1
L
TYPE - 2
I To Pressure
I-- Transducer
' 1 F- I
Tralsducer
F I G . 2 PROBES
PRESSURE MEASUREMENTS IN RAREFIED FLOW 137
10 Probe : Type 1
d : 2 m m
8 - J ~ a v a V a V
~o~¢vo° o o
"7
Z, ! ~ / o PO (t°rr)
2 F o 10 I O v 5 i ~ o 1 ti I I Shlerman ~ Ashkl~na$
0 0 2 /,, 6 8 10 12
X/d
FIG. 3 VISCOUS EFFECTS FOR DIFERENT UPSTREAM PRESSURES
10 l Po " O . E 6 S l t o r r }
6 v "1~ - ~ xax o a
t, v o / ~ p= O.O5 uu
c~ x d : 2mm "1 2 v vc~ ~ : l .6mm]" Type l
: 4mm ") v ^ v :3.6ram }, Type2
o :3 ram J 0 I Sherman I Ashkenas 0 20 ~.0 60
Distance along the axis (mm)
FIG.S RESULTS OF NEW PROBE COMPARED TO CONVENTIONAL PROBES
! Probe:Type ! (C.orrecfed) I t Po ' 0.865 ( to r r )
6j o
!
/+ i 1 5 o d = l . 6 m m ,L / a : 4 .? 6
2 vX v : 2.0 mm
FIG.4
vo x : 1.2mm -- Sher man- Ashkenos
0 t i I i I 0 10 20 30 1.0 50 60
Distace atong the axis(ram)
CORRECTED RESULTS OF DIFFF_REIV]" CONVENTIONAL PITOT PROBES
0.1 S
O r t
13.
0.10 - {~
0 .05
0.00 0
Probe : Type 2
d:4mm
Po (torr)
:,o o 1
Sherman Ashkenas
c~ Xmld
q~~J:~^~. -~, ^l = o ,,
10 20 30 ~,0 Xld
FIG.6 MEASURED PITOT PRESSURES ON THE AXIS
138 C. RAJU, A.K. SREEKANTH and J. KURIAN
:E
lOlpr°be8 : dType_--1.6mml f ~ " ~(C°rrected)vOt3~ . . ~ ' ~ ÷
6- f ~ Po
.,~' Po(torr),Pc (tor) l,
, , ~ cJ IO 0.062 j ~ v 7.5 0.056
~" O 5 0.024 2 ~/ x 3 O.013
+ 2 0.0072 1 0.0036
0 t I ~herm~n -Ashkems 0 2 Z~ 6 8 10 ~2
XId
FIG.? CONVENTIONAL PITOT TUBE AT DIFFERENT UPSTREAM PRESSURES
10 Pro be : 7_% L oVo.
, Y / Y Po(t °rr)" Pc ('°rr)
/ . 1 0:00326 0 } I ; I Shermnp-Ashkl~ n°s
0 2 /* 6 8 10 Xld
12
FIG. B NEW PROBE AT DIFFERENT UPSTREAM PRESSURES
10 Probe:Type 2 / I ~
J/ d=4mm
8
6 - 1 3 ~
2
0 I I I 0 5 10 15
-0.4 ~n
20
FIG. 9 TERMINAL MACH NUMBER AND ITS LOCATION
Recommended