
This event is live as of XYZ
ACAView: Impact of the Affordable Care Act on Providers
Dan HaleyVP, Government Affairs
Josh GrayVP, athenaResearch

August 2014: Depends on who you ask…
2

March 2015: Depends on who you ask…
3
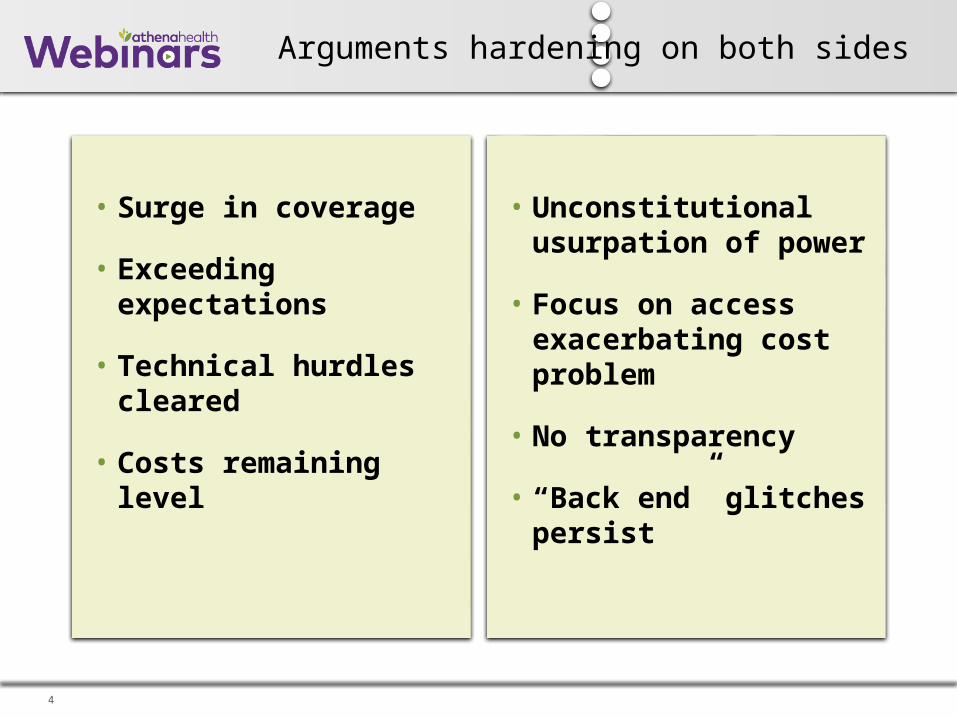
Arguments hardening on both sides
4
• Surge in coverage
• Exceeding expectations
• Technical hurdles cleared
• Costs remaining level
• Unconstitutional usurpation of power
• Focus on access exacerbating cost problem
• No transparency
• “Back end” glitches persist
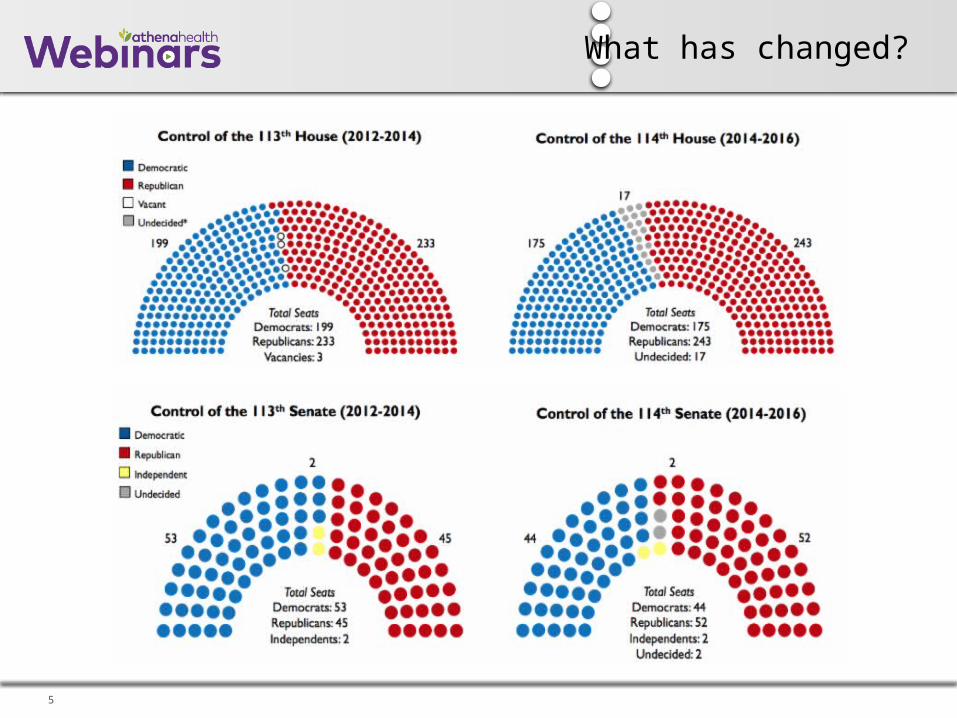
What has changed?
5

And this crew gets another say soon
6

And this crew gets another say soon
7
King v. Burwell
• Challenge to legality of federal subsidies
• Statute provides for subsidies via exchanges set up “by the state
• 5 million patients in more than 30 states
• Decision expected early summer

We have a lot more data than we had in August…
So what does it show?
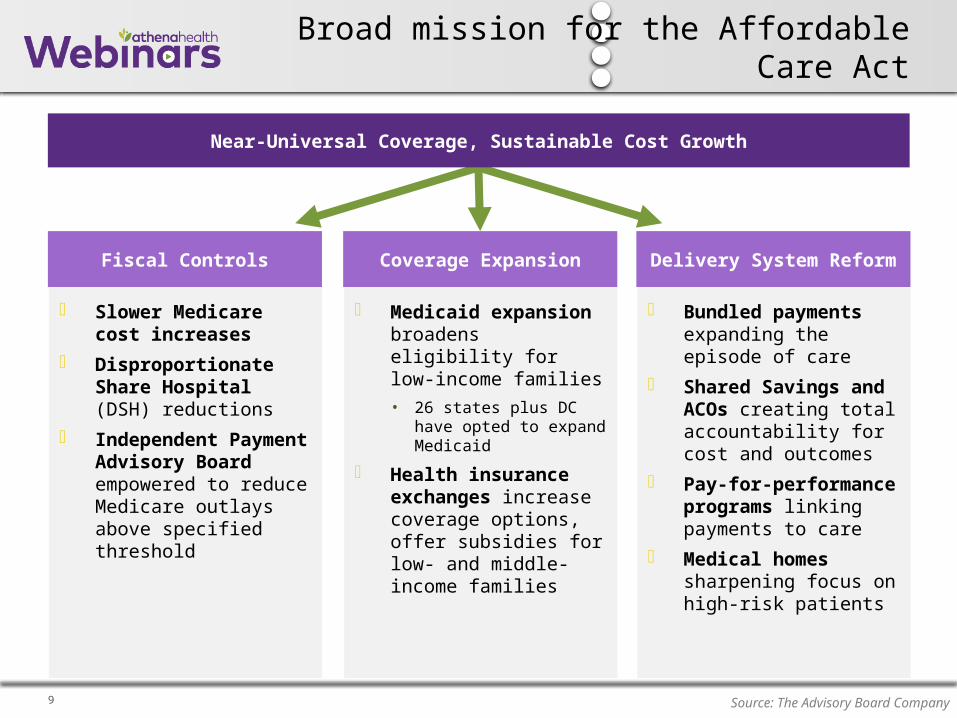
9 Source: The Advisory Board Company
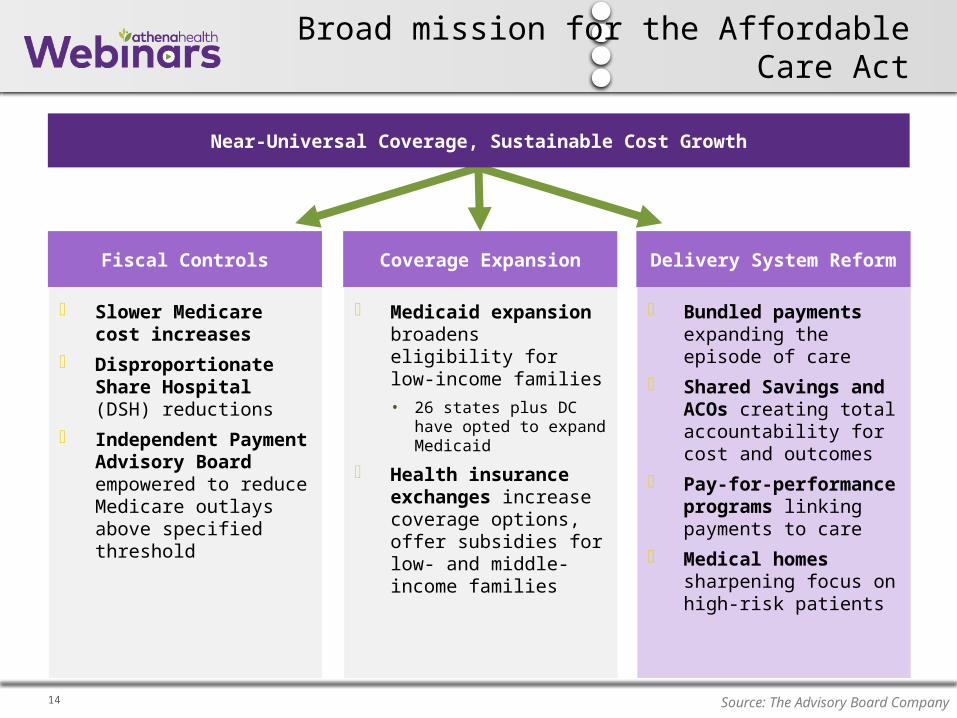
Fiscal Controls
Slower Medicare cost increases
Disproportionate Share Hospital (DSH) reductions
Independent Payment Advisory Board empowered to reduce Medicare outlays above specified threshold
Coverage Expansion
Medicaid expansion broadens eligibility for low-income families• 26 states plus DC have
opted to expand Medicaid
Health insurance exchanges increase coverage options, offer subsidies for low- and middle-income families
Delivery System Reform
Bundled payments expanding the episode of care
Shared Savings and ACOs creating total accountability for cost and outcomes
Pay-for-performance programs linking payments to care
Medical homes sharpening focus on high-risk patients
Near-Universal Coverage, Sustainable Cost Growth
Broad mission for the Affordable Care Act
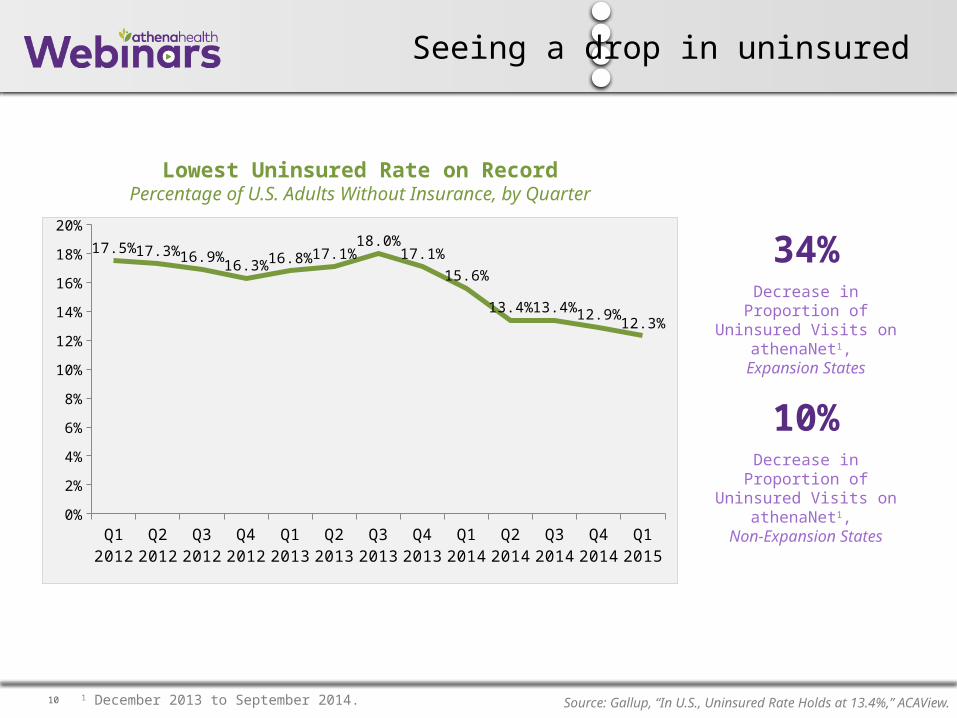
Seeing a drop in uninsured
10
Q1 2012
Q2 2012
Q3 2012
Q4 2012
Q1 2013
Q2 2013
Q3 2013
Q4 2013
Q1 2014
Q2 2014
Q3 2014
Q4 2014
Q1 2015
0%
2%
4%
6%
8%
10%
12%
14%
16%
18%
20%
17.5%17.3%16.9%16.3%16.8%17.1%
18.0%17.1%
15.6%
13.4%13.4%12.9%12.3%
Decrease in Proportion of Uninsured Visits on
athenaNet1, Expansion States
34%
Lowest Uninsured Rate on RecordPercentage of U.S. Adults Without Insurance, by Quarter
Decrease in Proportion of Uninsured Visits on
athenaNet1, Non-Expansion States
10%
Source: Gallup, “In U.S., Uninsured Rate Holds at 13.4%,” ACAView.1 December 2013 to September 2014.

11
Expanding Medicaid
28States plus DC
ConsideringExpansion
5States
Not Expanding Medicaid
17States
Source: The Advisory Board Company.
Still a split on Medicaid
12
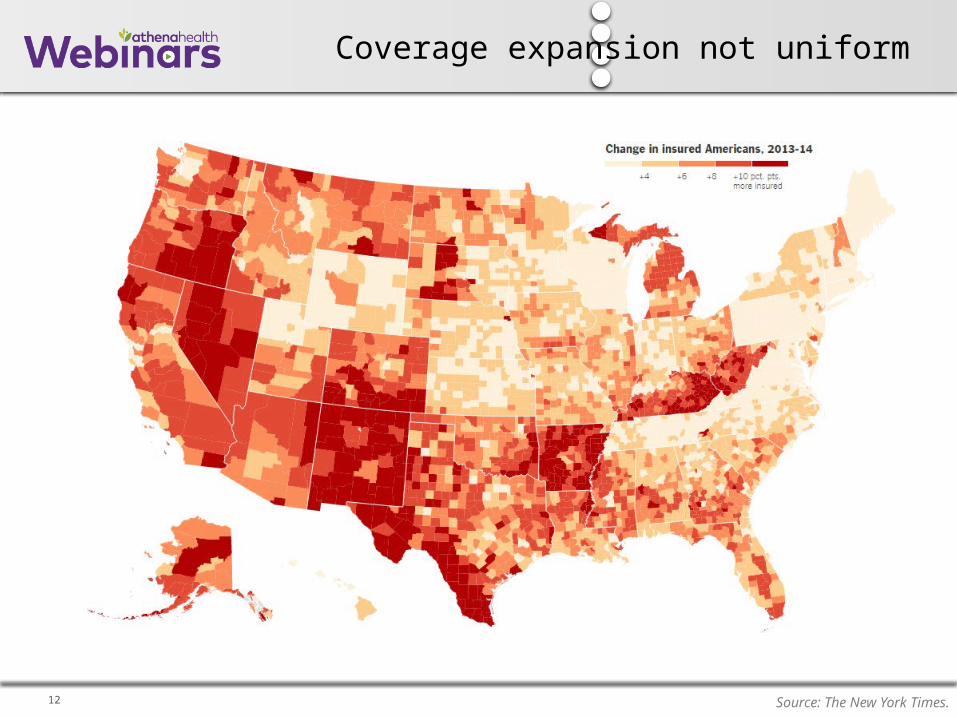
Coverage expansion not uniform
Source: The New York Times.

13
Coverage expansion transformational in some areas, a non-event in others
CountyUninsured Rate
Relative Reduction2013 2014
Los Angeles, CA
21% 12% 43%
Cook Country, IL
17% 10% 41%
King Country, WA
11% 7% 36%
Miami-Dade, FL 28% 19% 32%
Houston, TX 27% 19% 30%
Dekalb, GA 22% 16% 27%
Cumberland, ME
11% 10% 9%
York County, PA 12% 12% 0%Hampshire, WV
2013: 22%2014: 11%
Reduction: 50%
Frederick, VA
2013: 11%2014: 10%
Reduction: 9%
Source: The New York Times.
14 Source: The Advisory Board Company
Fiscal Controls
Slower Medicare cost increases
Disproportionate Share Hospital (DSH) reductions
Independent Payment Advisory Board empowered to reduce Medicare outlays above specified threshold
Coverage Expansion
Medicaid expansion broadens eligibility for low-income families• 26 states plus DC have
opted to expand Medicaid
Health insurance exchanges increase coverage options, offer subsidies for low- and middle-income families
Delivery System Reform
Bundled payments expanding the episode of care
Shared Savings and ACOs creating total accountability for cost and outcomes
Pay-for-performance programs linking payments to care
Medical homes sharpening focus on high-risk patients
Near-Universal Coverage, Sustainable Cost Growth
Broad mission for the Affordable Care Act

15
Shifting Risk for an Episode of CareCharges for an Illustrative Knee Replacement
Pre-Admission
Inpatient Surgery Post-Discharge Readmission
Fee-f
or-
Serv
ice
Bundled PaymentSingle Rate for Entire Episode of Care
Part B
Part B
Part A
Part B
Ortho. visit Operating room and surgical supplies
Surgeon’s professional
fee
Diagnostic imaging
Surgical consult
Follow-up ortho. visit
Outpatient rehab
Revision of knee
replacement
Surgeon’s professional
fee
Part B
Part B Part A
Part B Part B
Bundled payments shift risk for episodes of care

16 Source: Centers for Medicare and Medicaid Services.
Medicare Moving Quickly
National initiative launched in 2011 by the Center for Medicare and Medicaid Innovation (CMMI)
Offers 48 standardized bundles, including cardiac surgeries, orthopedics, diabetes, and CHF
Covers pre-admission, inpatient, and (in some cases) post-discharge care
Several hundred actively participating, 6,000 more have expressed interest
Bundled Payments for Care Improvement
Example Medical Bundles
Diabetes Sepsis Urinary tract infection Congestive heart failure Atherosclerosis Renal failure COPD Acute myocardial infarction
Example Surgical Bundles
Spinal fusion Major joint replacement of the lower
extremity Pacemaker Coronary artery bypass graft (CABG) Major cardiovascular procedures Percutaneous coronary intervention
(PCI) Cardiac valve
Bundled Payment Off to a Solid Start
17
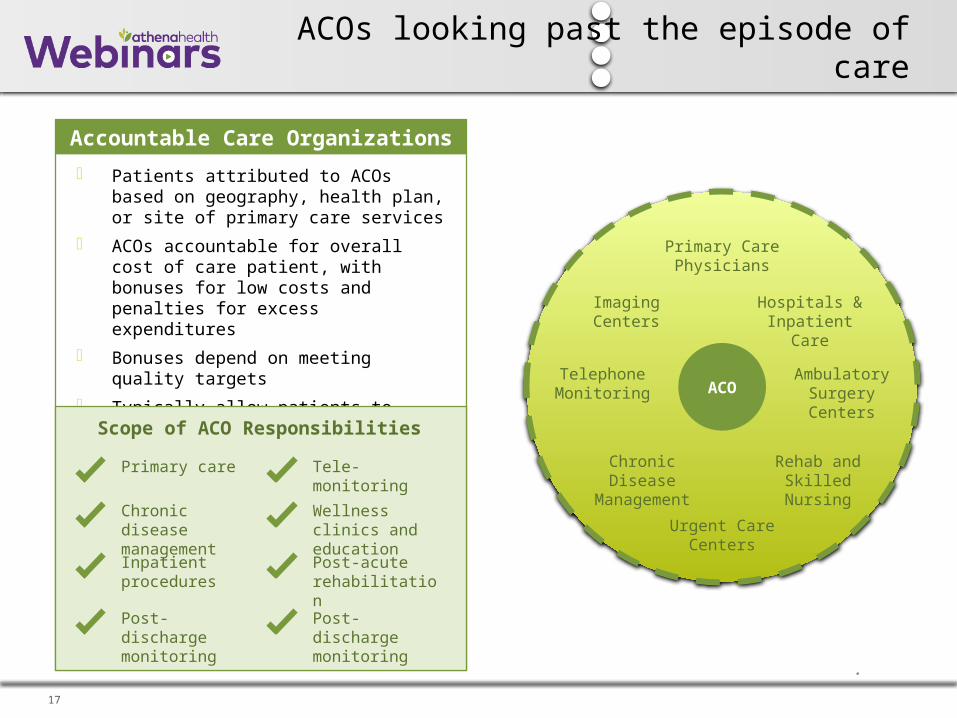
ACOs looking past the episode of care
.
ACOACO
Primary Care Physicians
Urgent Care Centers
Rehab and Skilled Nursing
Chronic Disease
Management
ImagingCenters
Hospitals & Inpatient Care
Ambulatory Surgery Centers
Telephone Monitoring
Accountable Care Organizations
Patients attributed to ACOs based on geography, health plan, or site of primary care services
ACOs accountable for overall cost of care patient, with bonuses for low costs and penalties for excess expenditures
Bonuses depend on meeting quality targets
Typically allow patients to access wider network, often transparent to patientsScope of ACO Responsibilities
Chronic diseasemanagement
Primary care
Inpatient procedures
Post-dischargemonitoring
Wellness clinics and education
Tele-monitoring
Post-acute rehabilitation
Post-dischargemonitoring
18
0
100
200
300
400
500
600
700
41 65 81
97
138
146
208
334356
458
479489
606
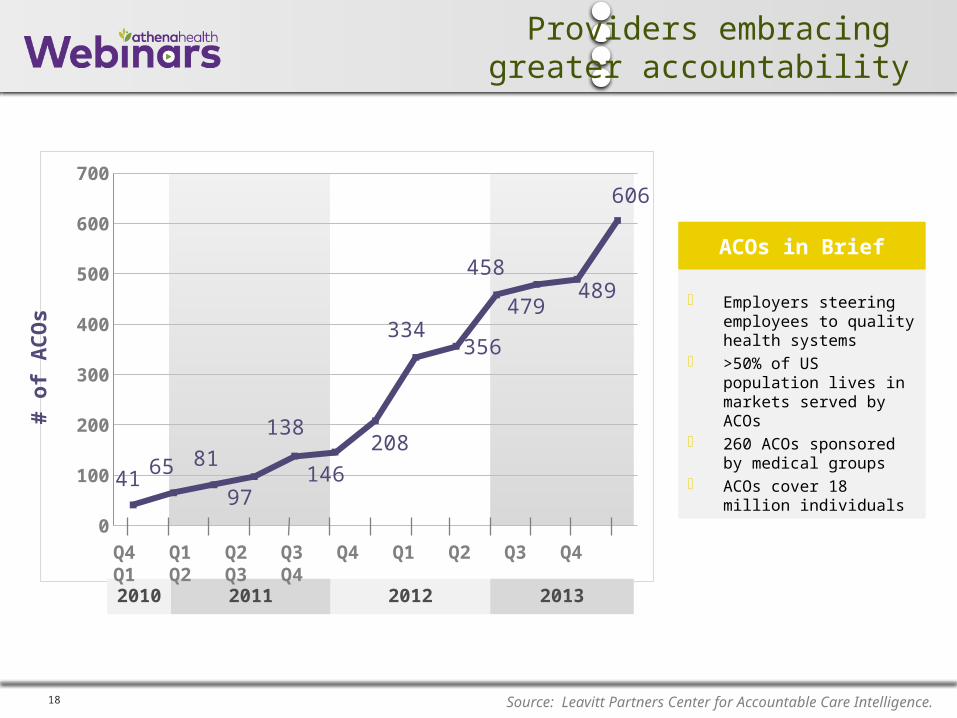
Providers embracing greater accountability
Employers steering employees to quality health systems
>50% of US population lives in markets served by ACOs
260 ACOs sponsored by medical groups
ACOs cover 18 million individuals
Source: Leavitt Partners Center for Accountable Care Intelligence.
ACOs in Brief
2010 2011 2012 2013
# o
f A
CO
s
Q4 Q1 Q2 Q3 Q4 Q1 Q2 Q3 Q4 Q1 Q2 Q3 Q4

Introducing
ACAView

athenahealth provides five integrated cloud-based services
Improved clinical care and patient outcomes
Population Health Management
Revenue cycle management
Documentation and workflow efficiency
athenaCommunicator®
Patient Engagement
athenaCollector® Revenue Cycle Performance
athenaClinicals®
Clinical Performance
athenaCoordinator®
Care Coordination
Epocrates®
Point of Care Medical Applications
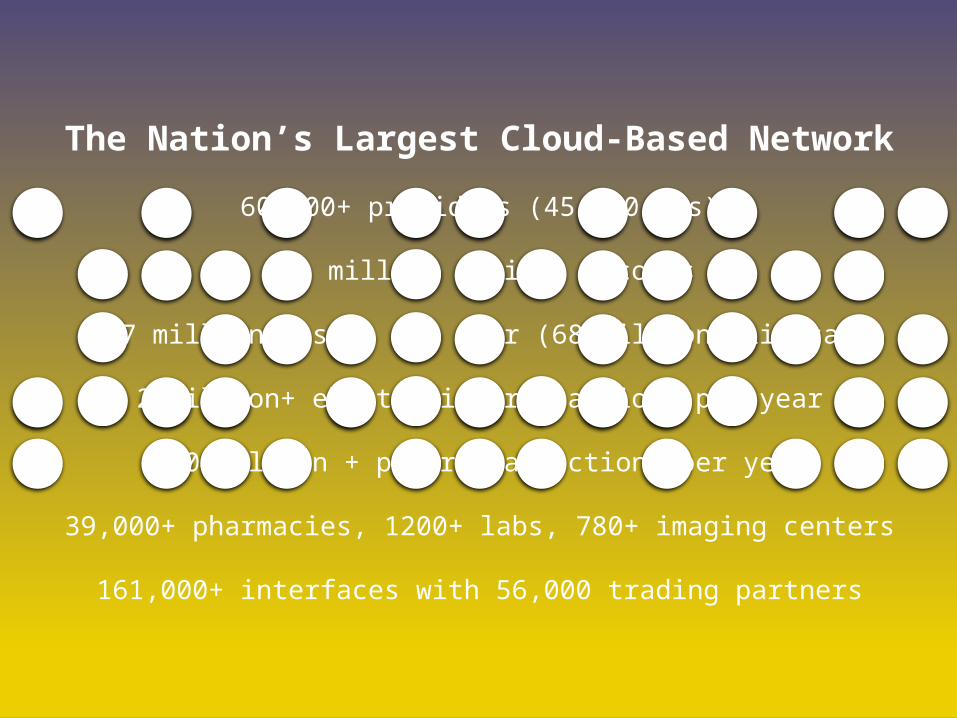
The Nation’s Largest Cloud-Based Network
60,000+ providers (45,000 MDs)
60+ million patient records
107 million visits per year (68 million clinical)
2 billion+ electronic transactions per year
670 million + payer transactions per year
39,000+ pharmacies, 1200+ labs, 780+ imaging centers
161,000+ interfaces with 56,000 trading partners
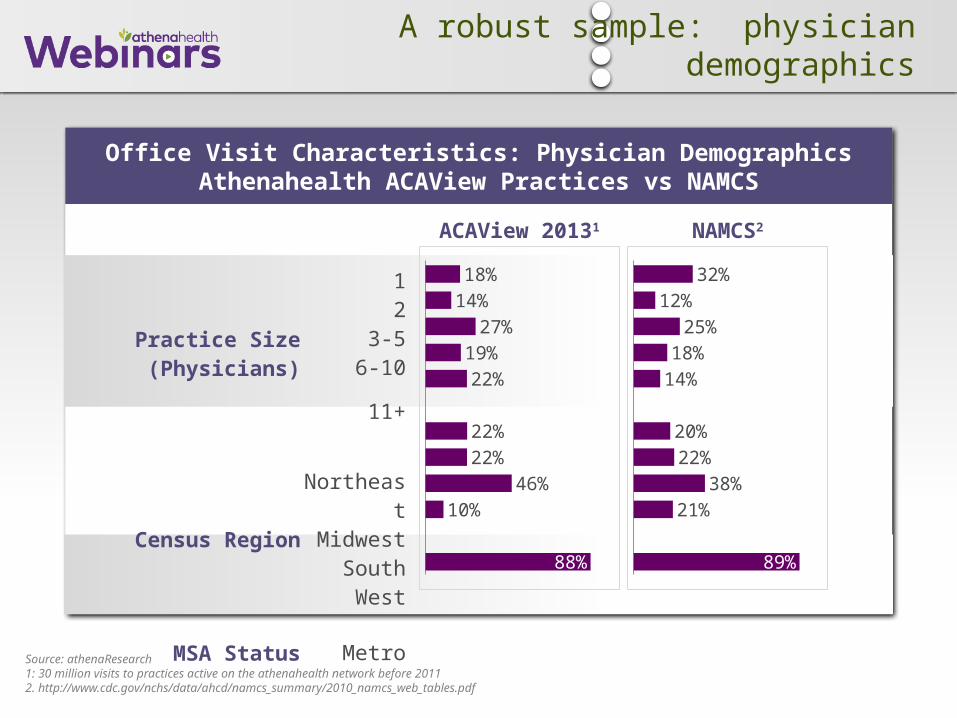
Office Visit Characteristics: Physician DemographicsAthenahealth ACAView Practices vs NAMCS
Practice Size (Physicians)
12
3-56-10
11+
Census Region
Northeast
MidwestSouthWest
MSA Status Metro
32%12%
25%18%
14%
20%22%
38%21%
89%
18%14%
27%19%22%
22%22%
46%10%
88%
ACAView 20131 NAMCS2
Source: athenaResearch1: 30 million visits to practices active on the athenahealth network before 20112. http://www.cdc.gov/nchs/data/ahcd/namcs_summary/2010_namcs_web_tables.pdf
A robust sample: physician demographics
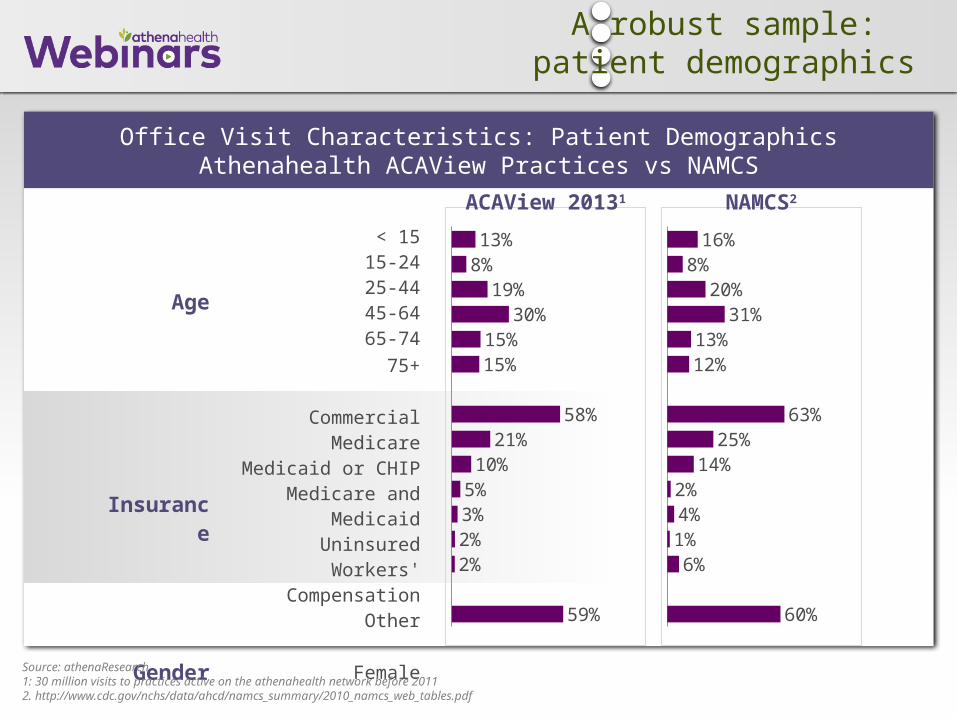
Office Visit Characteristics: Patient DemographicsAthenahealth ACAView Practices vs NAMCS
Age
< 1515-2425-4445-6465-74
75+
Insurance
CommercialMedicare
Medicaid or CHIPMedicare and
MedicaidUninsured
Workers' Compensation
Other
Gender Female
16%8%
20%31%
13%12%
63%25%
14%2%4%1%6%
60%
13%8%
19%30%
15%15%
58%21%
10%5%3%2%2%
59%
ACAView 20131 NAMCS2
Source: athenaResearch1: 30 million visits to practices active on the athenahealth network before 20112. http://www.cdc.gov/nchs/data/ahcd/namcs_summary/2010_namcs_web_tables.pdf
A robust sample: patient demographics
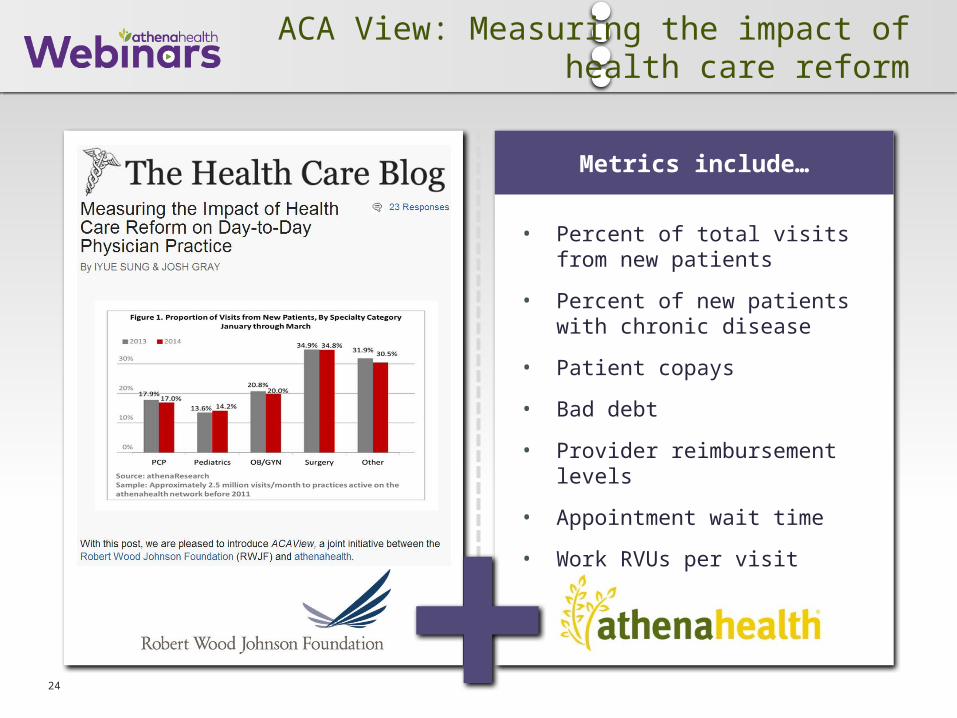
ACA View: Measuring the impact of health care reform
24 +
Metrics include…
• Percent of total visits from new patients
• Percent of new patients with chronic disease
• Patient copays
• Bad debt
• Provider reimbursement levels
• Appointment wait time
• Work RVUs per visit
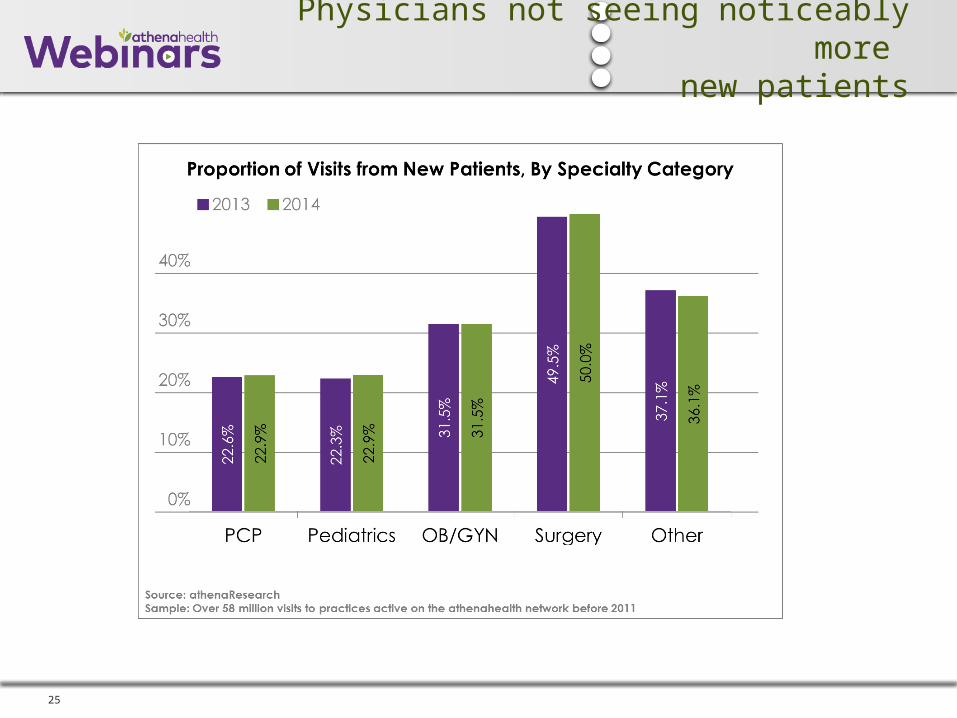
25
Physicians not seeing noticeably more new patients

26
Only modest changes in acuity of new patients
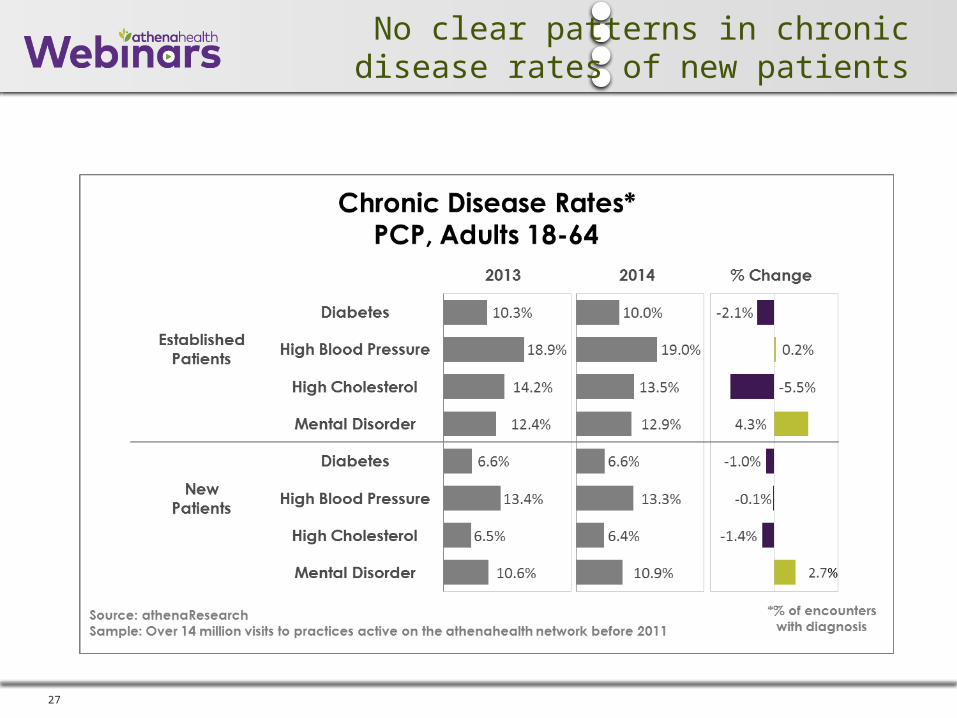
27
No clear patterns in chronic disease rates of new patients
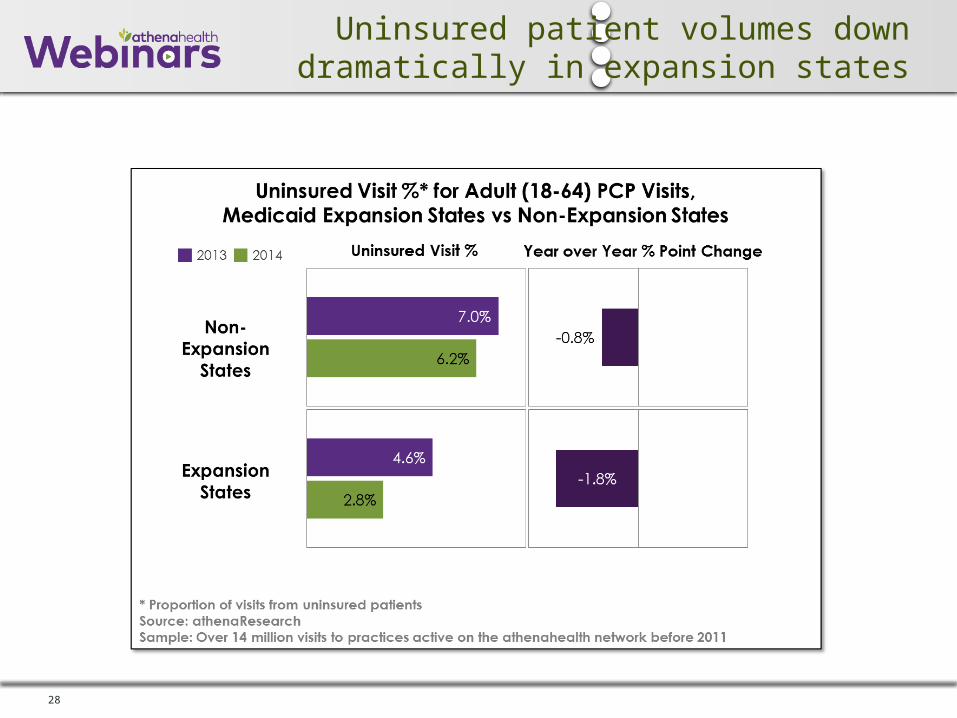
28
Uninsured patient volumes down dramatically in expansion states

29
Different payer-mix shifts in expansion versus non-expansion states
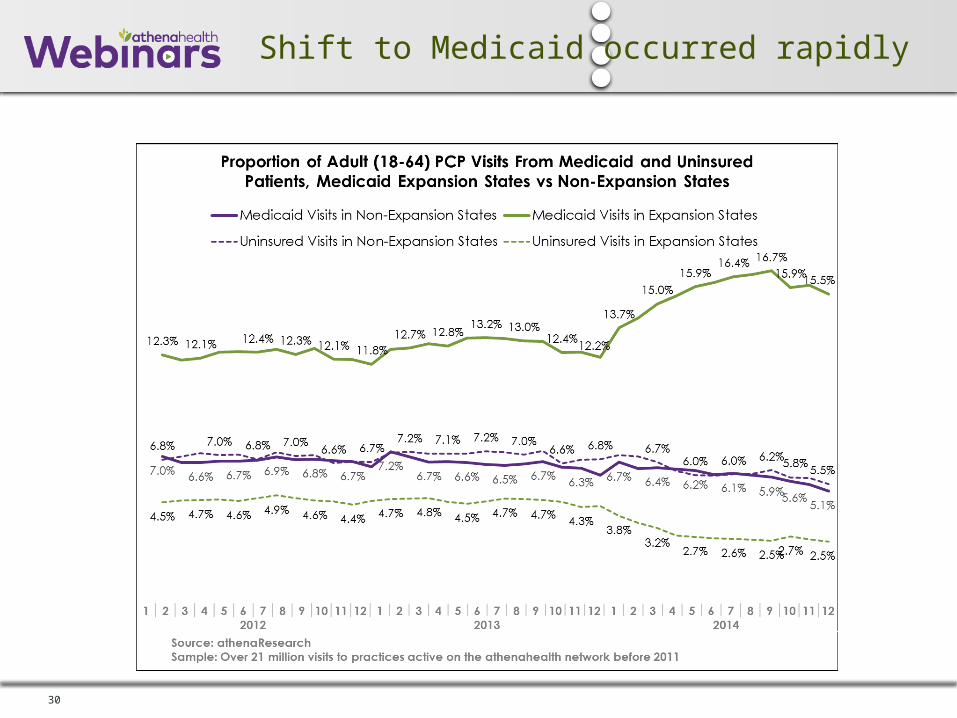
30
Shift to Medicaid occurred rapidly

Many more existing patients obtaining insurance
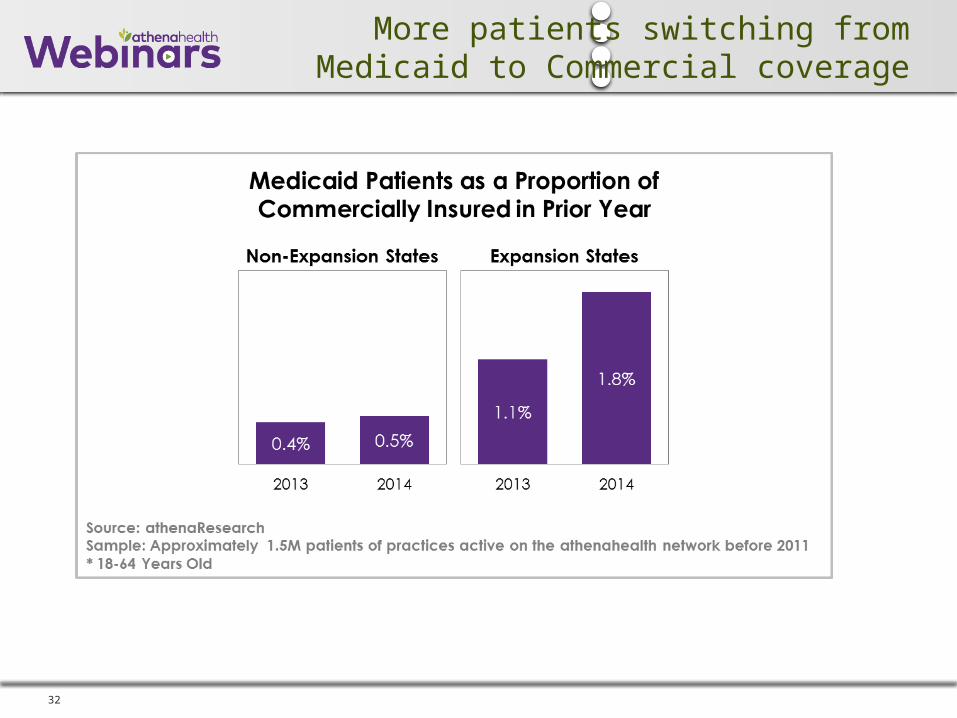
32
More patients switching from Medicaid to Commercial coverage

33
Next steps in ACAView research
What is happening to patient financial obligations?
What is the net effect of the ACA on physician reimbursement levels?
What are the health characteristics and utilization patterns of patients that have received coverage through the health insurance exchanges?
Are patients who switch insurance migrating to plans with higher patient obligations and lower physician reimbursement?

34
athenahealth’s award-winning services can help you thrive through change
“2014 Best in KLAS Awards: Software & Services,” January, 2015. © 2015 KLAS Enterprises, LLC. All rights reserved. www.KLASresearch.com
#1 Practice
Management System
(1-10, 11-17 physicians)
#2 Practice
Management System
(over 75 physicians)
#2 EHR
(over 75 physicians)
#2 Patient Portal
#2 Overall
Physician Practice Vendor
2014 Best in KLAS
• 62,000+ providers on athenaNet®
• Clients ranging from 1 to 5,000+ providers
• 50 states and 112 medical specialties
• $14 billion in client collections per year
• Acquired Epocrates March, 2013

Questions?
Recommended