September 2018
Impact Evaluation of Ductless Heat Pumps and Prescriptive Duct Sealing
B O N N E V I L L E P O W E R A D M I N I S T R A T I O N

THANK Y U! BIG THANKS to the UTILITIES & SMEs who PROVIDED UTILITY DATA (we know it’s hard work to gather)
& REVIEW (on the programs, methodology, and initial findings, you’ve done a lot of work to get us here)
2
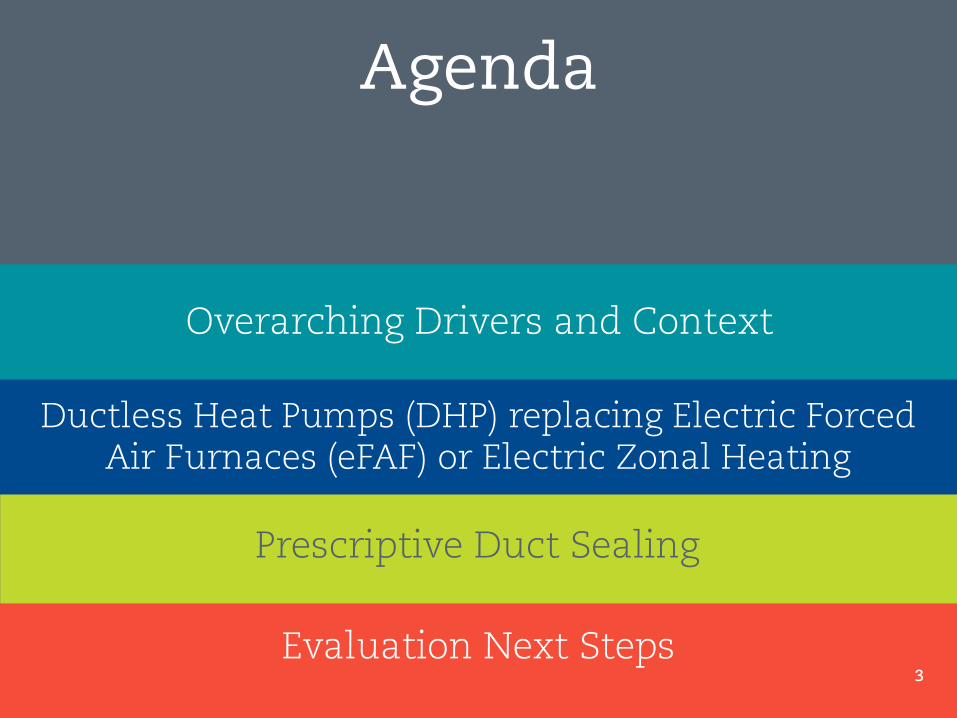
Agenda
Overarching Drivers and Context
Prescriptive Duct Sealing
Ductless Heat Pumps (DHP) replacing Electric Forced Air Furnaces (eFAF) or Electric Zonal Heating
Evaluation Next Steps 3

Why Evaluation?
4

What do we all want?
Energy efficiency programs that save customers money and energy.
To be trustworthy stewards of their money.
5

6
What did we achieve?
& How do we improve?
Evaluation

7
Impact Evaluation
Savings reliability with independent verification
Program improvement opportunities +

Residential Impact Evaluation
Background
8

Assess cost-
effective-ness
Evaluate energy savings for
consistency with savings claimed
Provide feedback to
enhance programs
Objectives
9

10
Source: Summarized from BPA’s IS2.0 database, accessed Dec 2017
20.30 aMW, Residential
24%
41%
5%
13%
17%
HVAC makes up a consistent 24% of the UES contribution
FY2016

How Did We Get Here?
Measure Selection Navigant and BPA
systematically identify measures to include in a new billing analysis in 2016 evaluation plan.
Methods Development Navigant and BPA develop
an approach through collaboration with
stakeholders and pilot approach using 2013
PTCS dataset.
Impact Evaluation (Phase I) Request billing data &
perform billing analysis for residential windows and
insulation measures (FY14/15 data). Analyze Heat
Pump conversions and performance DS using PTCS
dataset (FY09-11 data).
Impact Eval (Phase II) Perform billing analysis on Prescriptive Duct Sealing,
Ductless Heat Pump eFAF & DHP Zonal measures using FY14/15
data, opt-in data, installation forms and participant surveys.
Early 2015 Late
2015
2016
2017-2018
11

Impact Evaluation
Study Measure Group
Billing Analysis
Base Models & Exploratory
Models
Install Forms
Survey Utility
Specific Results
Phase I (Winter
2017/2018)
PTCS Performance DS - - -
HP Conversions - - -
Wx Insulation - - Windows - -
Phase II (September
2018)
Res. HVAC
Prescriptive DS - - DHP Zonal - DHP eFAF
Evaluation Activities by Measure Group
12
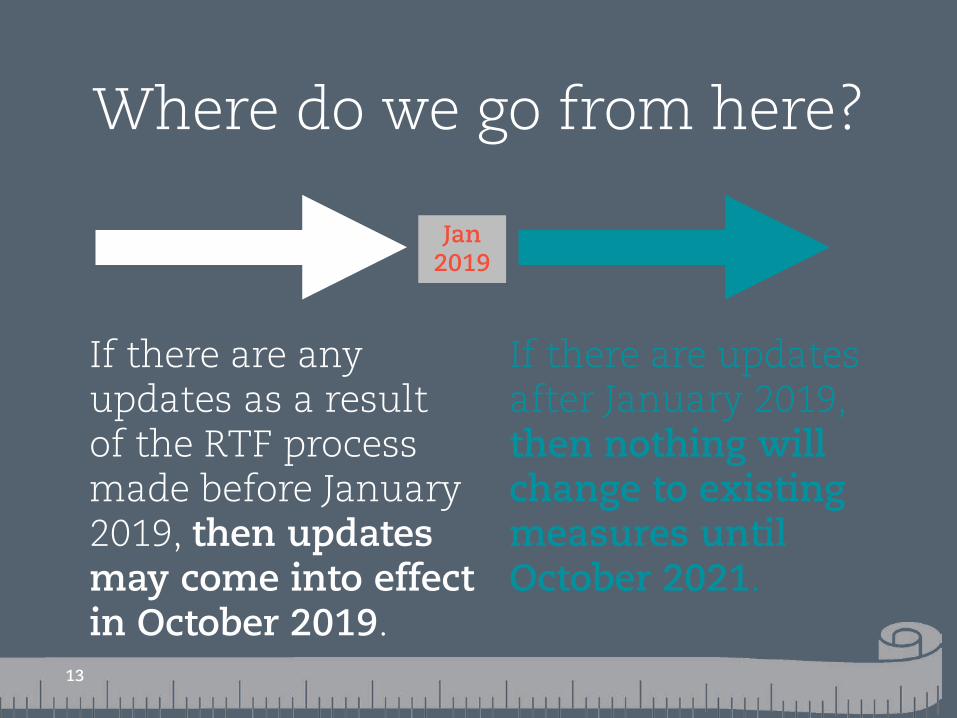
Where do we go from here?
If there are any updates as a result of the RTF process made before January 2019, then updates may come into effect in October 2019.
If there are updates after January 2019, then nothing will change to existing measures until October 2021.
13
Jan 2019

• Program managers review findings and strategize on possible changes
Programs
• RTF reviews findings and combines with regional research and updates UES as needed
• BPA adopts most recent UES before each program year
UES
• Identify areas for additional research to support programs
• Identify promising new or adjusted measures
Research Support
Where do we go from here?
14
Replacing eFAF and Zonal with DHP
15

Count of Sites Included in Final Results
Home Type Heat Zone
DHP eFAF DHP zonal
Single Family
1 266 1708
2 38 17
3 8 1
Manufactured Homes
1 240 2
2 37 1
3 14 0
Sampled Utilities Central Electric Clallam Clark Columbia River Inland Mason Peninsula Port Angeles Seattle Snohomish Tacoma Central Lincoln Cowlitz Eugene Flathead Grays Harbor Lewis Lincoln Midstate Northern Wasco Tillamook
16
DHP survey & site information

Major Findings: DHP survey (replacing eFAF)
Life changes and major renovations do not often coincide with DHP installations (about 8% of respondents for each)
17
Customers use DHPs such that savings may be lower than current UES This is the case if customers:
• Continue to use eFAF • Displace non-electric heating • Increase AC use • Switch from programmable
to manual thermostats

Major Findings: DHP installation forms
(replacing eFAF and Zonal)
but there were many units with two or more heads
18
More than half of units were installed in homes smaller than 1,500 sq. ft.
Most installations were single-head
units
2
3+
1

Major Findings: DHP billing analysis
(replacing eFAF and Zonal)
19
Ductless Heat Pumps replacing
eFAF
• Savings are 50% of current UES
• Findings appear to be driven by: o Use of eFAF after DHP installation o Displacement of non-electric heat
Ductless Heat Pumps replacing
Zonal • Savings are 84% of current UES
• There is no clear driver of findings

Main Findings: DHP replacing eFAF
20

Billing Analysis Activities
Measure Group Base Models
Exploratory Models
Install Forms
Survey
DHP eFAF DHP zonal
21
Data: FY14/15 data, opt-in data, installation forms and participant surveys
21
Evaluation Activities by Measure Group

15%
88%
0%
10%
20%
30%
40%
50%
60%
70%
80%
90%
100%
Perc
ent
of R
esp
ond
ents
usi
ng
AC
Pre-DHP Post-DHP
eFAF to DHP: Survey results on AC Use
Installing a DHP led to an increase in AC use Note that 85% of sites did not have AC before installing the DHP
22

Contrary to the survey results, billing analysis suggests no cooling load increases on average
eFAF to DHP: Savings related to AC
0
100
200
300
400
500
Esti
mat
ed S
avin
gs (
kWh
/mon
th)
Savings are highest in the winter months and savings in summer are not statically different than 0kWh
Increased AC use is not a clear driver of lower savings and whether cooling impacts are negative or positive, they appear to be small relative to heating
23

Full eFAF displacement is defined as customers who previously used an electric furnace as their primary heating source and
completely stopped using the furnace after the DHP was installed
eFAF to DHP: Survey results
24
Full eFAF Displacement,
44%
Partial eFAF Displacement,
39%
Little-to-No eFAF
Displacement, 18%
% of all respondents who still live in home

Savings vary by survey savings groups
eFAF to DHP: Savings related to displacement
0
1000
2000
3000
4000
5000
6000
Little-to-No eFAF Displacement
Partial eFAF Displacement
Full eFAF Displacement
Savi
ngs
(kW
h/y
ear)
Estimated Savings Most Recent UES
Savings are highest when eFAF is fully displaced
Displacement of non-electric heat may play a large role in driving savings down, use of eFAF after DHP installation may play a large role in driving savings down
25

Savings may vary by home size
eFAF to DHP: Savings related to size of home
0
1000
2000
3000
4000
5000
6000
Less than 1500 sq. ft. More than 1500 sq. ft.
Savi
ngs
(kW
h/y
ear)
Estimated Savings Most Recent UES
Savings in homes larger than 1500 sq ft are slightly higher than smaller homes
Home size may not be driving savings
26

eFAF to DHP: Savings related to number of heads
0
1000
2000
3000
4000
5000
6000
Single Head Multi-Head
Savi
ngs
(kW
h/y
ear)
Estimated Savings Most Recent UES
27
It’s unclear if savings vary by the number of heads In agreement with UES, savings from single head units are higher than from multi-head units
It does not appear that multi-head systems save more than single head, however this may be a result of a small multi-head sample size

Main Findings: DHP replacing Zonal
28

Billing Analysis Activities
Measure Group Base Models
Exploratory Models
Install Forms
Survey
DHP eFAF DHP zonal
29
Data: FY14/15 data, opt-in data, installation forms, and participant surveys
29
Evaluation Activities by Measure Group

Cooling impacts and total cooling load are low
DHP Zonal: Billing analysis results related to AC
0
100
200
300
400
Esti
mat
ed S
avin
gs (
kWh
/mon
th)
30

DHP Zonal: Savings related to Number of Heads
0
500
1000
1500
2000
2500
3000
Single Head Multi-Head
Savi
ngs
(kW
h/y
ear)
Estimated Savings Most Recent UES 31
Savings may vary by number of heads

DHP Next Steps
32

BPA will consider these evaluation results in our future residential HVAC program strategy and
measure offerings.
BPA will engage utility customers on the results and future strategy.
DHP Next Steps
BPA will be working with the RTF to provide these
results for use in measure updates.
33

Main Findings: Prescriptive Duct Sealing
34

Billing Analysis Activities
Measure Group
Base Models Exploratory Models
Prescriptive Duct Sealing Data: FY14/15 Billing Data, Opt-In Data (FY14/15/16)
Evaluation Activities by Measure Group
35

Count of Sites Included in Final Results
Home Type Heat Zone Prescriptive Duct Sealing
Single Family
1 20
2 5
3 0
Manufactured Homes
1 453
2 4
3 3
Sampled Utilities Clark Columbia River
Inland
Tacoma
Blachly-Lane
Central Electric
Central Lincoln
Clallam
Eugene
Flathead
Glacier
Grays Harbor
Klickitat
Tillamook
Snohomish
36
Prescriptive Duct Sealing survey & site information

Main Findings: Prescriptive Duct Sealing
0
100
200
300
400
500
600
Savi
ngs
(kW
h/y
ear)
Estimated Savings Most Recent UES
Results are variable and unclear
The available information does indicate that additional research is warranted
Navigant suggests site visits for future impact research, which could include pre/post sub-metering, site testing, or ride-alongs

Prescriptive Duct Sealing next steps
38

The RTF will consider this information in an update to
duct sealing measures in September.
BPA will document our findings to inform
methodological decisions for any future prescriptive duct sealing studies in the region.
BPA will engage utility customers on any future activity around this measure.
Prescriptive Duct Sealing Next Steps
39

What’s next?
40

Navigant’s DHP & Prescriptive Duct Sealing Evaluation
Brown bag
Receive comments from external stakeholders
Revise report (if necessary)
Sep 11
Sep 19
Sep 28
41
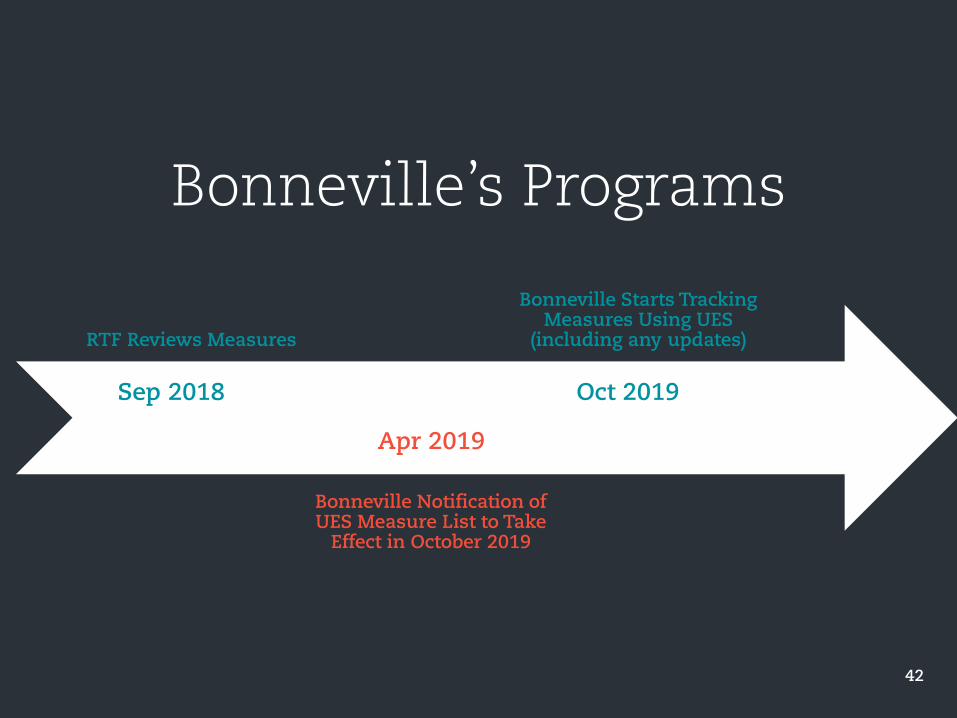
RTF Reviews Measures
Bonneville Notification of UES Measure List to Take
Effect in October 2019
Bonneville Starts Tracking Measures Using UES
(including any updates)
Bonneville’s Programs
Sep 2018
Apr 2019
Oct 2019
42

Looking Forward
43
Bonneville is taking several actions for ductless heat pumps that we believe will improve the reliability of these measures:
1. Researching control methodologies to ensure that the DHP is the primary heating source where a FAF is retained in the home
2. Creating parity for incentives for DHPs and air source heat pumps. We hope that with an aligned incentive structure, homeowners will focus on the best solution for their home – which may be an air source heat pump when a forced air system already exists
3. Considering whether we need to align incentives for single and multi-head DHP installations
Bonneville will continue to monitor evaluation results for prescriptive duct sealing and look for opportunities to improve the measure (e.g., tighten criteria and specifications to include only sites with higher savings potential).

Cost Effectiveness
45
These evaluation findings will go through a process including RTF measure updates and an evolving BPA strategy for residential HVAC measures
BPA measures cost effectiveness at the Technology Activity Practice (TAP) level for the whole DHP portfolio weighted to program activity, BPA does not
measure cost effectiveness at the individual measure level
It is unknown how the RTF will decide to use the findings from this evaluation
BPA recently conducted an analysis of how energy efficiency measures benefit the BPA system as part of its Resource Program
Resource Program findings indicate that residential heating and cooling measures are valuable to the BPA system
Recommended