Imaging clinically localized prostate cancerRajveer S. Purohit, MD, MPH*, Katsuto Shinohara, MD,
Maxwell V. Meng, MD, Peter R. Carroll, MDDepartment of Urology, 400 Parnassus Avenue, A632, University of California–San Francisco,
San Francisco, CA 94143–0738, USA
For men residing within the United States,prostate cancer is second only to lung cancer in
cancer mortality and second in incidence tononmelanomatous skin cancers. The introductionin the 1980s of prostate-specific antigen (PSA) asa part of cancer screening protocols increased
detection of clinically significant (and insignifi-cant) prostate cancer, which has led to earlieridentification of prostate cancer, at more treatable
stages [1]. Given the substantial stage migrationthat has occurred, prostate cancer is rarelya systemically detectable disease at presentation.
Therefore, clinicians have gone from using imag-ing-based staging to using clinical variables incombination (ie, serum PSA, T stage, Gleasonscore, and extent of disease on biopsy) as a more
efficient means of assessing the likely extent ofdisease and the best initial treatment. Thus, thereis significant controversy with regard to the
optimal treatment of prostate cancer and the roleof imaging in staging prostate cancer. This articleexplores the current literature with regard to the
accuracy and utility of transrectal ultrasound(TRUS), modifications of TRUS, MRI andmagnetic resonance spectroscopy (MRS), radio-
labeled antibody imaging (ProstaScint) (Cytogen,Princeton, NJ), and CT in staging clinicallylocalized prostate cancer.
Importance of imaging in staging
More accurate pretreatment staging of pros-
tate cancer permits the appropriate selection oftherapy and increases the likelihood of a favorable
treatment outcome. Although there are manyimaging techniques available to help assess stage,
there is no clear standard modality that is uni-formly accurate, sensitive, and specific, yet remainsminimally invasive and cost effective.
An analysis of patients in the Cancer of the
Prostate Strategic Urologic Research Endeavor(CaPSURE) registry—a longitudinal database ofmen with various stages of cancer—revealed that
although utilization of imaging techniques between1995 and 2001 has decreased, up to half of patientswith clinically intermediate-risk tumors (PSA level
between 10.1 and 15 ng/mL, Gleason score of 7, orclinical stage T2b) and a quarter of low-riskpatients (PSA level less than 10 ng/mL, Gleasonscore less than 7, and clinical stage T1 or T2a)
continue to undergo unnecessary radiographicexaminations [2]. These findings underscore theimportance of the critical evaluation of available
data to reduce unnecessary utilization of resources.Long-term cancer-free survival is determined
by both the clinical extent of disease at the time of
treatment and the type of treatment delivered.Understaging occurs in 30% to 60% of patientswho undergo surgery for clinically localized
disease [3]. The risk of understaging may be lessthan that noted previously, due to stage migration[4]. Therefore, an important goal of imaging is todistinguish those patients with either organ-
confined prostate cancer (<pT2c) or limitedextracapsular extension (ECE) from those withmore advanced disease (Table 1).
Digital rectum examination (DRE) alone isinsufficient for detecting the presence or extent ofcancer [5]. This was noted by Jewett et al [6], who
reported that 50% of palpable prostatic noduleswere benign. Additionally, DRE alone has poorspecificity in predicting pathologic stage of
* Corresponding author.
E-mail address: [email protected] (R.S. Purohit).
0094-0143/03/$ - see front matter � 2003, Elsevier Science (USA). All rights reserved.
doi:10.1016/S0094-0143(02)00184-2
Urol Clin N Am 30 (2003) 279–293
disease, especially in patients with a low PSA.
Over 60% of tumors staged by DRE alone areunderstaged [7].
Similarly, PSA alone has poor sensitivity and
specificity in predicting tumor stage, particularlyin patients who present with a PSA of less than20 ng/mL. The accuracy of pretreatment staging is
only moderately increased when PSA is combinedwith DRE [8]. The most accurate methods ofestimating pathologic stage utilize PSA, DREfindings, and Gleason grade on prostate biopsy.
By incorporating Gleason grade in preoperativestaging, a good correlation can be made betweenclinical staging and pathologic staging through
the recently updated Partin staging nomograms[9]. Data from CaPSURE suggests that incorpo-ration of percent-free biopsies can increase the
accuracy of preoperative staging in all risk groupscompared with the use of serum PSA, T stage, andGleason score [4].
Imaging may complement the use of clinicalcriteria as outlined above. Imaging aims toestablish the local extent of disease and quantifyother features of tumor that predict outcome,
such as cancer location, volume, and grade [10].The ideal imaging technique should be affordableand minimally invasive, with little variability in
interobserver interpretation. In addition, the testshould be able to predict tumor stage, volume,
and location with high specificity and sensitivity.Although such a test does not currently exist forprostate cancer, many modalities are available
that may provide valuable information that couldimpact clinical care.
Imaging techniques
Ultrasound
Gray-scale ultrasoundAlthough conventional gray-scale ultrasound
imaging of the prostate can be performed in
a variety of ways, TRUS provides the clearestview of the prostate. TRUS is the most commonimaging test for the local staging of prostate
cancer because it is used almost universally toassist in obtaining initial systematic and directedbiopsies of the prostate. Additionally, manyurologists have familiarity with this imaging
technique, and the potential side effects of TRUSimaging and biopsy—although not uncommon—tend to be minor [11].
The optimal technique for TRUS involvesplacing the patient in a lateral decubitus positionand obtaining axial and sagittal sections with a
7.5 MHz transducer. Any abnormality should beimaged in two planes and gland volume cal-culated. Benign prostatic hyperplasia (BPH) cancomplicate the TRUS image by compressing the
peripheral zone where tumors are typically bestvisualized by TRUS. Tumors can appear hypo-echoic (60%–70%), isoechoic (40%), or hyper-
echoic (rare) [12]. They may appear as a nodule,an infiltrating mass, or a combination of both oras benign processes such as prostatitis, focal
atrophy, or prostatic infarcts. It has been shown,for example, that granulomatous prostatitis canappear as a focal hypoechoic area with a nodular
appearance similar to prostate cancer [13]. Thereare some TRUS findings that are suggestive of thepresence of extracapsular cancer extension. Pro-tuberance and irregular borders at the capsule
suggest the presence of ECE (T3 disease). The fatplane posterior to the prostate also can bevisualized by TRUS and assessed for invasion
by tumor. Additionally, invasion of the seminalvesicles (T3b disease) usually appears as a poste-rior thickening or loss of bulging of the seminal
vesicle on gray-scale images. Unfortunately, ECEby small microscopic clusters of tumor cells maybe impossible to see on TRUS.
TRUS images give limited information about
the histology of prostate cancer; however, some
Table 1
TNM staging of prostate cancer
T stage: tumor
T2: tumor confined to prostate
T2a: tumor involves one lobe
T2b: tumor present in both lobes
T3: tumor extends through prostatic capsule
T3a: extracapsular extension present
T3b: tumor invades seminal vesicle
T4: tumor invades adjacent tissue
N stage: node status
Nx: nodal status cannot be assessed
N0: no regional node disease present
N1: single node; 2 cm or less at largest point
N2: single node, 2–5 cm at largest point, or multiple
nodes no larger than 5 cm
N3: metastasis larger than 5 cm in any node
M stage: metastatic disease
Mx: metastasis cannot be assessed
M0: no metastasis present
M1: distant metastasis present
M1a: distant lymph nodes involved
M1b: distant bony metastasis
M1c: other distant site
280 R.S. Purohit et al / Urol Clin N Am 30 (2003) 279–293
infrequently encountered tumors have character-istic appearances on TRUS. Comedocarcinomaappears as a multiple, small, hyperechoic lesionswithin a larger hypoechoic area [14], whereas
lymphomas tend to appear as hypoechoic areaswithin the transition and peripheral zones [15].
TRUS alone has a relatively poor ability to
detect palpable and nonpalpable prostate cancer[12] and predict disease outcome [16]. Its utility isaffected by a number of factors. First, TRUS is
operator dependent and, despite technical refine-ments, conventional ultrasound remains limitedby the ability of the operator to distinguish subtle
findings such as differences in gray scale [17].Second, there are significant differences betweenthe various ultrasound probes still commonly inuse: older 3.5/4-MHz transducers do not depict
zonal anatomy as well as do newer 5-MHz and7.5-MHz transducers.
The ability of ultrasound to stage prostate
cancer is influenced significantly by the pretestprobability of local extension of the disease asdetermined by PSA, T stage, and cancer grade. In
one series [18], patients with a PSA greater than10 ng/mL had a risk approaching 50% of capsularpenetration. Additional predictors of pathologic
stage include PSA velocity (>0.75 ng/mL peryear) [19], free-to-total PSA ratio, and PSAdensity (>0.1 ng/mL per milliliter of prostate).TRUS has a high specificity [20] and good
interobserver reliability in estimating prostatevolume [21]. Babaian et al [22] have shown thatalthough the smaller tumors (defined as 0.51 cm3
to 1.5 cm3) tend to be less likely to have extra-prostatic extension, a significant number (32%) ofthese small-volume tumors can have extraprostatic
extension. Estimation of tumor volume may beuseful clinically for brachytherapy, to aid in plan-ning for prostatic shape and size [23]. Of interest,Ukimura et al [24] has suggested that the length of
tumor in contact with the prostatic capsule byTRUS correlates with the likelihood of ECE.
Despite an initially positive report by Salo et al
[25], subsequent data on TRUS for staging pros-tate cancer have been variable (Table 2). In 43patients studied using a 4.0-MHz transducer,
Hardeman et al [26] found a sensitivity of 54%,a specificity of 58%, a PPV of 62%, and a negativepredictive value (NPV) of 50% (calculated from
data presented) in predicting ECE. TRUS hada sensitivity of 60%, a specificity of 89%, a PPVof 67%, and an NPV of 86% (calculated fromdata) in predicting seminal vesicle invasion (SVI).
In a multi-institutional, prospective trial of 230
patients [27], TRUS had a sensitivity of 66%,
a specificity of 46%, a PPV of 63%, and an NPVof 49% in predicting ECE; and a sensitivity of22% and 88% in predicting SVI. The poor utility
was confirmed by Bates et al [28], who founda sensitivity of 23% and 33% in predicting ECEand SVI, respectively; and by Presti [29] whofound that gray-scale TRUS had a sensitivity of
48%, a specificity of 71%, a PPV of 50%, and anNPV of 69% in predicting ECE; and 75%, 98%,75%, 98%, respectively, in predicting SVI. In
a prospective, multi-institutional study funded bythe National Institutes of Health of 263 patientswho underwent radical prostatectomy [30], pre-
operative clinical staging by TRUS and DRE wascompared with pathologic staging. The stagingaccuracy of TRUS was correlated, in a nonstatisti-cally significant manner, to tumor volume. Over-
all, TRUS was not significantly better than wasDRE in predicting ECE. TRUS was noted to bebetter at staging posterior tumors than anterior
ones [30].In conclusion, although TRUS is useful for
performing prostatic biopsies and providing a
general anatomic assessment (eg, prostate volume),the overall low accuracy makes TRUS alone animprecise technique for the local staging of pros-
tate cancer [31].
Table 2
Utility of transrectal ultrasound in the literature
Author Sensitivity Specificity PPV NPV Accuracy
Bates
et al [28]
ECE 23 86 — — —
SVI 33 100 — — —
Presti
et al [29]
ECE 48 71 50 69 —
SVI 75 98 75 98 —
Rifkin
et al [27]
ECE 66 46 63 49 58
SVI 22 88 — — —
Hardeman
et al [26]
ECE 54 58 62 50 56
SVI 60 89 67 86 82
Salo
et al [25]
ECE 86 94 92 89 90
SVI 29 100 100 75 77
Abbreviations: ECE, extracapsular extension; SVI,
seminal vesicle invasion; PPV, positive pedictive value;
NPV, negative predictive value.
281R.S. Purohit et al / Urol Clin N Am 30 (2003) 279–293
Color Doppler, power Doppler,and contrast agents
Modifications to TRUS have attempted to
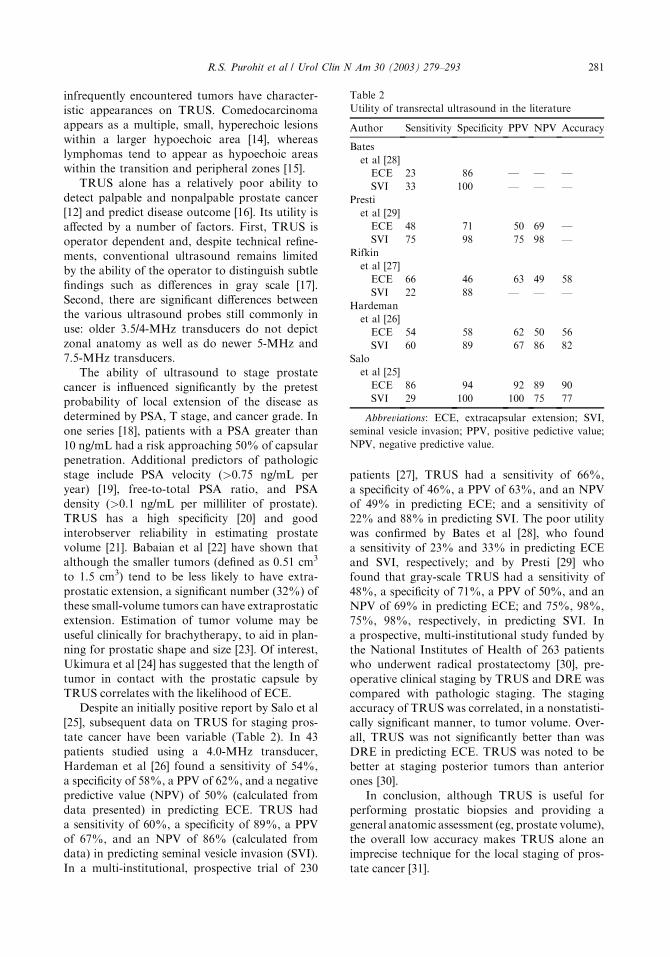
increase its utility. Color Doppler TRUS (CDUS),which was described in 1993 as a means ofdifferentiating cancer from benign growth, utilizesreflected sound waves to evaluate blood flow
through prostatic vessels. Early studies showedthat cancers that are not revealed in gray scale,such as in isoechoic hypervascular tumors, may be
visualized by imaging vascular flow (Fig. 1).Initial enthusiasm was heightened by research onangiogenesis that indicated that prostate cancer
tissue has a higher microvessel density than doesbenign prostatic tissue [32].
Unfortunately, there is little data on the abilityof CDUS to stage localized disease. Color signals
from vessels in CDUS can obscure the gray-scaleimage of the capsule, making local stagingdifficult. Only one study has presented data on
staging by CDUS; Cornud et al [33] evaluated 94patients with T1c prostate cancer who underwentradical prostatectomy and found that ECE and
SVI were present more often in tumors that couldbe visualized by CDUS than in those that couldnot be visualized. The data of Cornud et al [33],
however, did not compare the CDUS withconventional gray-scale ultrasound. Nonstagingdata has shown that CDUS may not detect moretumors than gray-scale ultrasound [34]; however,
Kelly et al [35] found that only 1 patient out of158 had a tumor detected by CDUS that was notfound on conventional TRUS. Other studies
[36,37] have shown better utility for CDUS indetecting prostate cancer when accounting fortraditional predictors of pathologic stage such asGleason grade.
In cases of incongruent findings between colorDoppler and conventional Doppler, other con-ditions (such as prostatitis, which can show
increased flow on CDUS), should be considered[38]. Of interest, preliminary studies have sug-gested that CDUS may predict the behavior and
aggressiveness of cancer (Gleason grade and rateof relapse) [39] as well as the growth of prostatecancer after hormonal therapy [40]. Additionalstudies are required to assess the true utility of
CDUS over conventional techniques.Other modifications of ultrasound that attempt
to increase the specificity of TRUS include power
Doppler, 3-dimensional (3D) Doppler, and theuse of new contrast agents. Power Dopplerimaging (PDI) detects small differences in blood
flow and can image alterations in flow in verysmall tumor vessels [41]. PDI has a threefold tofourfold higher sensitivity compared with color
Doppler alone [42]. There is no data on PDI forstaging prostate cancer. In detecting tumors,Okihara et al [43] reported a sensitivity of 98%and an NPV (98%) that was superior to
Fig. 1. (Left) Conventional gray-scale TRUS of prostate. The solid arrow points to area of prostate cancer. (Right)
Doppler Color ultrasound shows significant hypervascularity of this area as indicated by the solid arrow. Assessment of
extracapsular extension is difficult. Directed biopsy of this region showed intermediate grade adenocarcinoma.
282 R.S. Purohit et al / Urol Clin N Am 30 (2003) 279–293
conventional TRUS, but a PPV of 59%, whichwas not superior to conventional gray-scale
TRUS. In a separate paper, Okihara et al [44]found that PDI better detected tumor vascularityin Japanese men than in American men. They
hypothesized that this was secondary to theJapanese men having smaller prostates and pro-portionately larger tumors than did the Americanmen. Moreover, they found that PDI added little
new information to increase the efficacy ofbiopsies compared with standard gray-scaleTRUS [44].
3D color Doppler permits a 3D image to beconstructed from a series of 2D images bya computer algorithm. It may decrease the
interobserver and intraobserver interpretive vari-ability of conventional 2D TRUS and providemore accurate information with regard to the site,
size, and extent of cancer [45]. In a pilot study of3D TRUS (without color or power Doppler) in 36patients with newly diagnosed prostate cancer,Garg et al [46] found that 3D ultrasound had an
overall sensitivity of 80%, a specificity of 96%,a PPV of 90%, and an NPV of 96% in predictingECE. The staging accuracy of 94% compared
favorably with 72% for conventional 2D TRUS;the 22% improvement in staging accuracy wasstatistically significant (P < 0.05). The advantage,
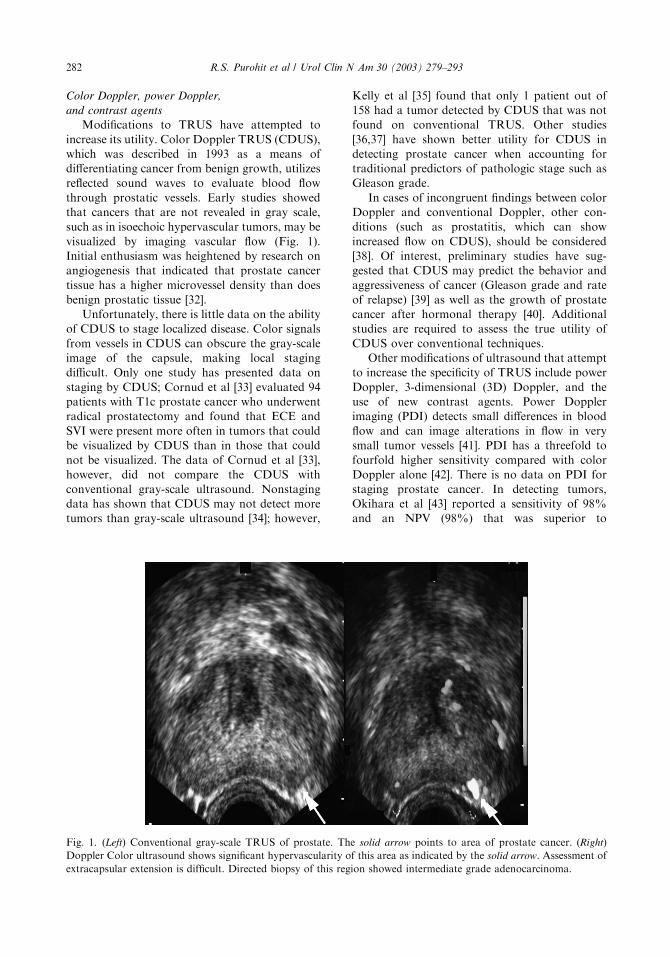
Fig. 2. CT scan demonstrating T4 adenocarcinoma of
the prostate. Biopsy confirmed the presence of high-
grade cancer. Of note, a suprapubic tube is in place to
manage urinary retention.
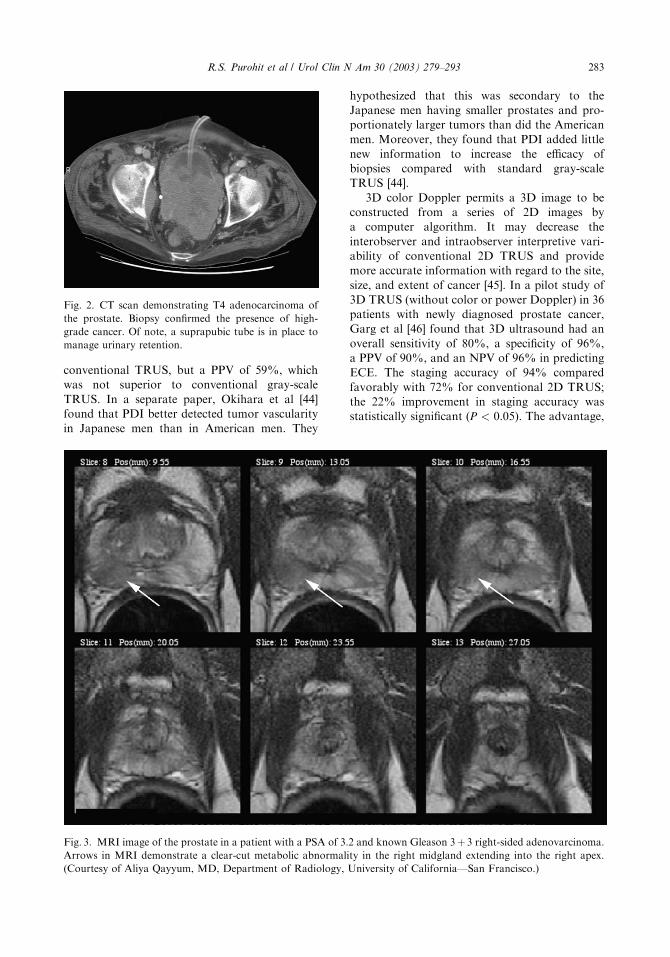
Fig. 3. MRI image of the prostate in a patient with a PSA of 3.2 and known Gleason 3þ 3 right-sided adenovarcinoma.
Arrows in MRI demonstrate a clear-cut metabolic abnormality in the right midgland extending into the right apex.
(Courtesy of Aliya Qayyum, MD, Department of Radiology, University of California—San Francisco.)
283R.S. Purohit et al / Urol Clin N Am 30 (2003) 279–293
they noted, was present only when tumors were
hypoechoic [46]. The study, although well de-signed, was hampered by the relatively smallnumber of subjects. Additionally, their study did
not include power or color Doppler ultrasoundtechniques, which are likely to be used in futureapplications. Some data have suggested a modest
improvement in yield of biopsies with 3D Doppler[47]. Other data have shown that 3D ultrasoundmay increase sensitivity at the cost of a significantdecrease in specificity, with cancer correctly
identified by two experts 49% and 57% of thetime, respectively [48].
Attempts to place contrast into the prostate to
enhance visualization of cancer have been mod-erately successful. A microbubble contrast agentin the prostate, with a mean half-life of 5 to 10
minutes, has been created by injecting an in-travenous aqueous fluorocarbon that releases2-micron to 5-micron microbubbles that traverse
prostatic capillaries in proportion to blood flow.These microbubbles may improve the signal-to-noise ratio in Doppler sonography and enhancevisualization of smaller vessels that would other-
wise not be seen by Doppler alone [49]. Pre-
liminary data indicate that microbubbles mayenhance the sensitivity (to around 80%) andpossibly the specificity of cancer detection by
power Doppler [50,51] A prospective study of 230patients by Frauscher et al [52] evaluated theefficacy of contrast-enhanced color Doppler rela-
tive to conventional gray-scale TRUS for cancerdetection. Patients underwent both a conventionalTRUS with 10 systematic biopsies and colorDoppler imaging (CDI) with contrast using five
or fewer directed biopsies. The rate of cancerdetection was statistically equivalent: 24.6% bycontrast-enhanced CDI and 22.4% by conven-
tional TRUS. Each contrast-enhanced CDI-di-rected biopsy was 2.6 times more likely to containtumor than was a conventional systematic TRUS
biopsy [52]. There are no similarly well-designedstudies on the ability of contrast-enhanced TRUSto improve cancer staging. Future TRUS direc-
tions may include image enhancement by elastog-raphy—which calculates differential propertiesof tissues (eg, prostate cancer and normal pros-tatic tissue) under strain (through the use of a
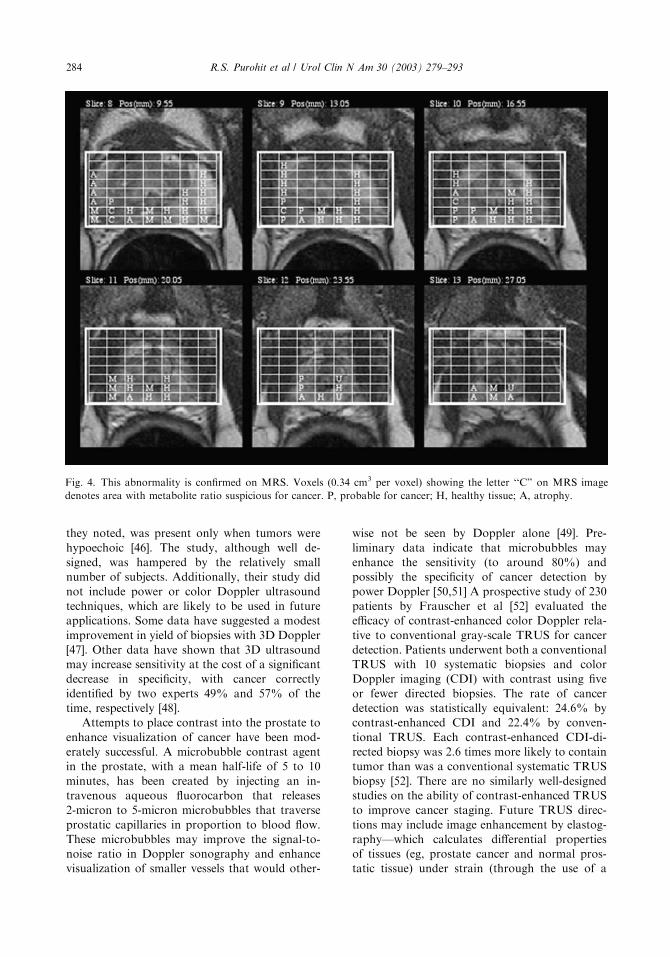
Fig. 4. This abnormality is confirmed on MRS. Voxels (0.34 cm3 per voxel) showing the letter ‘‘C’’ on MRS image
denotes area with metabolite ratio suspicious for cancer. P, probable for cancer; H, healthy tissue; A, atrophy.
284 R.S. Purohit et al / Urol Clin N Am 30 (2003) 279–293
transrectal balloon) [53]—and further mechanicalrefinements to improve image clarity.
CT
Abdominopelvic CT scans were evaluated forstaging of prostate cancer and were found to be oflittle value in low-risk and intermediate-risk
patients. Problems included a lack of visualizationof the prostatic capsule, the inability to accuratelydistinguish BPH nodules from cancer, and poor
soft tissue resolution. Staging for locally advancedcancer may be possible when tumor invadesperiprostatic fat. In 1997, the National Compre-
hensive Cancer Network recommended using CTto help in the assessment of stage for patients withclinical stage T3 and T4 disease (Fig. 2) [54]. In
patients with stage B and C prostate cancer,however, Hricak et al [55] found little difference in
the accuracy of CT (65%) over clinical staging(61%) when comparing the results with patholog-ic findings after radical prostatectomy. In a study
published in 1987 of 38 patients who underwenta radical prostatectomy, Salo et al [25] foundpreoperative CT to have a sensitivity, a specificity,
a PPV, and an NPV of 25%, 89%, 67%, and59%, respectively. In ECE, the ability of CT topredict SVI was slightly better: 36%, 96%, 80%,
and 76%, respectively [25]. Other studies [56,57]have found sensitivities ranging from 2.5% to75% and specificities ranging from 60% to 92% inpredicting ECE, and sensitivities ranging from
5.8% to 33% and specificities ranging from 60%to 99% in predicting the presence of SVI. Datahave shown that CT adds little in the way of
preoperative staging for patients with clinicallylow-stage disease [58–60]. Even in higher riskpatients, CT scans may have limited clinical utility
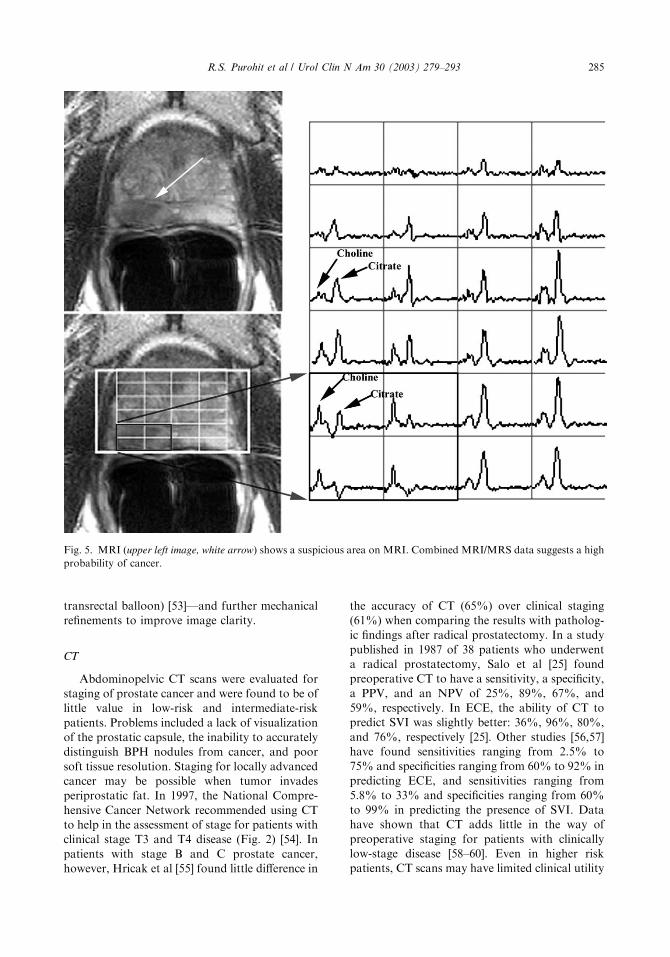
Fig. 5. MRI (upper left image, white arrow) shows a suspicious area on MRI. Combined MRI/MRS data suggests a high
probability of cancer.
285R.S. Purohit et al / Urol Clin N Am 30 (2003) 279–293
in predicting nodal involvement by tumor [57].
Levran et al [59] showed that only 1.5% of 861patients with a PSA level of more than 20 ng/mLwere noted to have suspicious lymph nodes on
CT. Although CT scans may have little utility forpreoperative staging in low-risk patients, radia-tion oncologists often use CT for pretreatment
radiation dosage planning [61] and CT-guidedbrachytherapy [62].
MRI/MRS
MRI has been used to improve staging in low-grade to intermediate-grade tumors. Endorectal
MRI utilizes a magnetic coil placed in the rectum
to better visualize the zonal anatomy of theprostate and better delineate tumor location,volume, and extent (stage). Patients are imaged
in a whole-body scanner using a pelvic phasedarray coil combined with an inflatable, balloon-covered, endorectal surface coil positioned in therectum. Both T1-weighted and T2-weighted spin-
echo MRI images are required to evaluateprostate cancer. The prostate appears homoge-nous on T1-weighted images; on T2-weighted
images, cancer appears as an area of lower signalintensity surrounded by a normal area of higherintensity. The prostatic capsule often can be
visualized by MRI. Distinctions between normaland pathologic tissue may be hampered bypostbiopsy hemorrhage, which can appear asa high-signal intensity area on T1-weighted im-
aging. MRS has been used with MRI to in-crease the accuracy of radiographic assessment.MRS detects metabolic activity and may differ-
entiate normal from cancerous prostate tissuebased on the ratios of creatine, choline, and citrateproduction and consumption (Figs. 3–5).
The data on the ability of MRI alone to predictstage are variable (Table 3). Presti et al [29] foundendorectal MRI to be 91% and 50% sensitive and
49% and 94% specific in predicting ECE and SVI,respectively. Rifkin et al [27] presented similardata showing a sensitivity of 77% and 28% anda specificity of 57% and 88% in predicting ECE
and SVI, respectively. Bartolozzi et al [60]evaluated 73 patients who underwent endorectalMRI and radical prostatectomy. MRI had a -
sensitivity of 95% and a specificity of 82% indiagnosing the presence of ECE; analysis of thedata presented showed a PPV of 90% and an
NPV of 92% for ECE [60]. Perrotti et al [63]found endorectal MRI to have a sensitivity of22% and a specificity of 84% in predicting ECE.Ikonen et al [64] also found that endorectal MRI
was much more likely to detect tumors over10 mm in size (89% detection) than those that were5 mm in size (5% detection) and was more specific
than sensitive (97% versus 13%) in predictingECE. These differences have been attributed tothe lack of diagnostic criteria and interobserver
variability in scan interpretation. May et al [65]found significant differences in MRI accuracybetween two radiologists whose training was not
specified (93% by one and 56% by another); theauthors also reported that MRI had a lowerspecificity but a better sensitivity than did TRUS.
More careful selection of patients may increase
the utility of MRI. Using a multivariate analysis
Table 3
Utility of MRI in the literature
Author Sensitivity Specificity PPV NPV Accuracy
Tuzel
et al [84]
ECE 37.5 87 75 69 65
SVI 20 92 50 73 70.5
Ikonen
et al [64]
ECE 13 97 — — 91
SVI 59 84 — — 80
Deasy
et al [85]
ECE 55 91 — — 77
SVI 83 96 — — 94
Presti
et al [29]
ECE 91 49 51 90 —
SVI 50 94 40 96 —
Bartolozzi
et al [62]
ECE 95 82 — — 82
SVI 80 93 — — —
Perrotti
et al [63]
ECE 22 84 — — 64
SVI 23 93 — — 77
Rifkin
et al [27]
ECE 77 57 71 63 69
SVI 75 98 75 98 —
(MRIþMRS)
Yu
et al [86]
ECE 46–54 93–96 65–81 85–88 —
SVI — — — — —
Abbreviations: ECE, extracapsular extension; SVI,
seminal vesicle invasion; PPV, positive predictive value;
NPV, negative predictive value.
286 R.S. Purohit et al / Urol Clin N Am 30 (2003) 279–293
of 336 high-risk patients (greater than three corespositive on sextant biopsy, positive DRE, andPSA level> 10 ng/mL) who underwent radical
prostatectomy, Cornud et al [66] found that MRIalone yielded a specificity of 95% and a sensitivityof 50% to 69% for detecting pT3 disease. Asexperience among radiologists grows, it is likely
that MRI will be used more often, but at this timethere are no data to suggest that it should be usedroutinely to assess prostate cancer.
In 1996, Kurhanewicz et al [67] reported onsignificant differences among BPH, prostate can-cer, and normal prostate tissue that were seen on
MRS of metabolites. Cancer is associated withproportionately lower levels of citrate and higherlevels of choline and creatine compared with BPH
or normal prostate tissue [68]. The combinedmetabolic and anatomic information provided byMRI and MRS may allow for a more accurateassessment of cancer location and stage than does
MRI alone. MRS is currently undergoing techni-
cal refinements to increase its resolution, in thehopes of increasing accuracy. Yu et al [69]examined 53 patients who had undergone com-
bined MRI/MRS prior to radical prostatectomyand observed that MRS reduced intraobservervariability and increased staging accuracy. Com-bined MRI/MRS had a sensitivity of 46% to
54%, a specificity of 93% to 96%, a PPV of 65%to 81%, and an NPV of 85% to 88% (the range ofvalues reflects differences between two different
readers) in predicting the presence of ECE [69].The numbers of patients in the series was smalland a larger follow-up study is needed to confirm
these results.Of interest, there is some evidence that MRI/
MRS also may predict higher grade of cancer. It
has been reported that early enhancement maysignal more aggressive tumors, with poorly dif-ferentiated tumors showing the earliest andmost rapid enhancement [70]. Additionally, in-
creasing the staging capability of MRI/MRS may
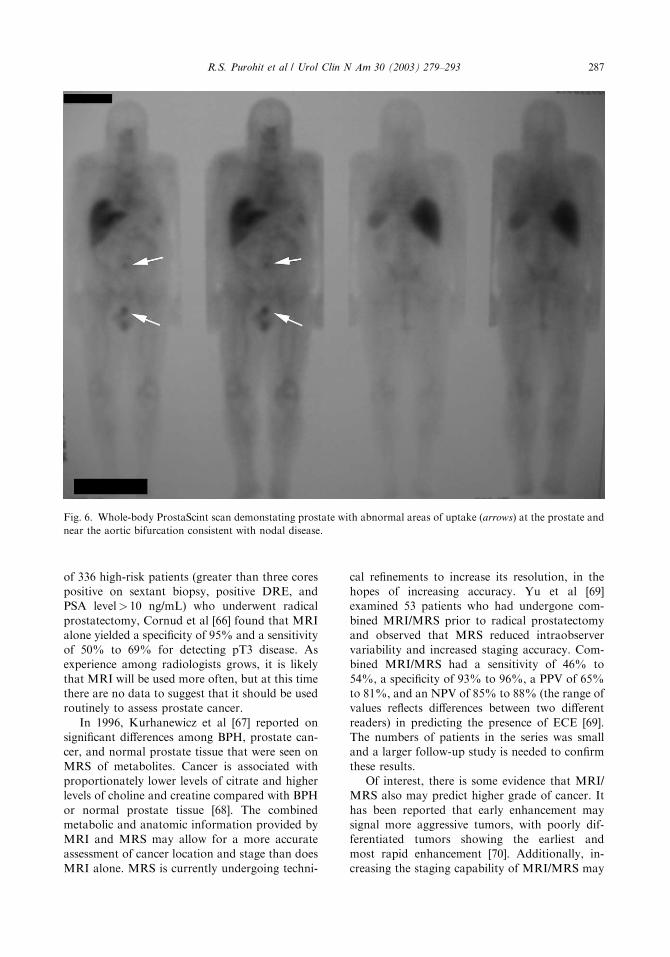
Fig. 6. Whole-body ProstaScint scan demonstating prostate with abnormal areas of uptake (arrows) at the prostate and
near the aortic bifurcation consistent with nodal disease.
287R.S. Purohit et al / Urol Clin N Am 30 (2003) 279–293
have some utility for preoperative selection andtreatment planning in patients undergoing bra-chytherapy [71].
Antibody imaging
ProstaScint is a murine monoclonal antibody
to an intracellular component of the prostate-specific membrane antigen that is conjugated to111 indium. After infusion of the antibody, single
photon emission CT images usually are obtainedat 30 minutes to access vasculature and at 72 to
120 hours. ProstaScint has been approved by theFood and Drug Administration for use in theevaluation of patients prior to undergoing treat-ment for their primary disease and for detecting
the site of recurrent disease in patients who havebiochemical relapse after radical prostatectomy(Fig. 6). Three possible clinical uses for Prosta-
Scint have been enumerated by Lange [72]: thedetection of lymph node metastases, the site ofrelapse in those with a detectable PSA after
prostatectomy, and detecting occult metastasisprior to primary therapy. In his 2001 editorial, he
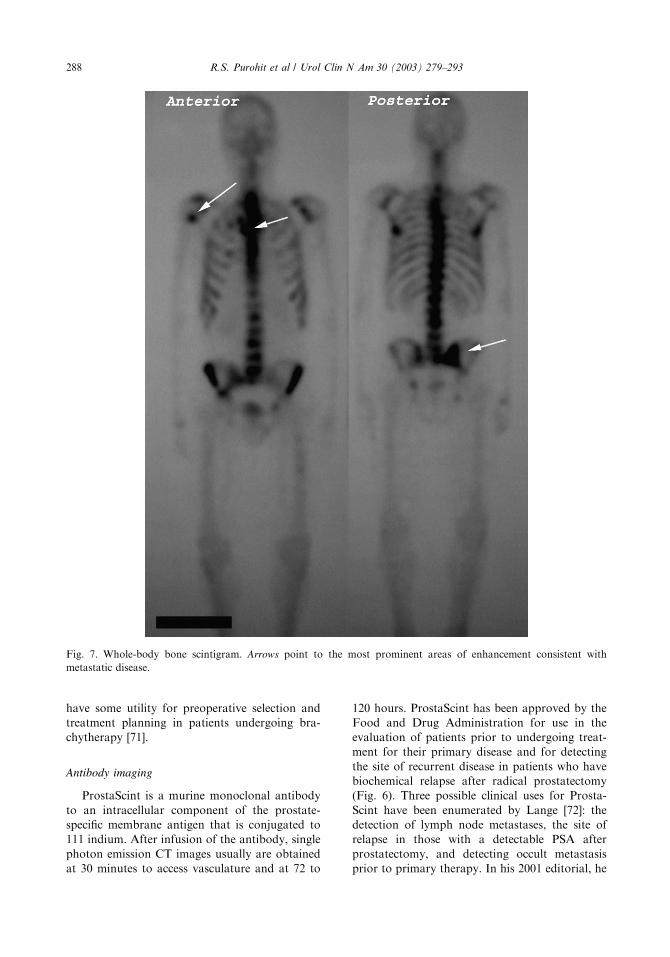
Fig. 7. Whole-body bone scintigram. Arrows point to the most prominent areas of enhancement consistent with
metastatic disease.
288 R.S. Purohit et al / Urol Clin N Am 30 (2003) 279–293
noted that prior studies have shown only a 60% to70% sensitivity and specificity in predicting nodal
disease. Other studies [73] have indicated thatProstaScint may serve as a useful adjunct withPSA levels, Gleason score, and bone scan in
predicting stage of disease. In a study of 275patients receiving treatment for prostate cancerwith nodal disease or metastatic disease deter-mined by either surgery or bone scan, respectively,
Murphy et al [74] found that incorporation ofProstaScint, PSA level, and bone scan results intoartificial neural networks indicated that Prosta-
Scint results were a significant prognostic variablefor nonlocalized cancer. In the same study [74],however, ProstaScint did not have any significant
value for local (T) staging of disease. In another
study, Elgamal et al [75] evaluated 100 patients,with an average PSA level of 55.9 ng/mL, whounderwent definitive local treatment and devel-oped local recurrence; ProstaScint correctly iden-
tified only 43% of local recurrences and 49% ofnodal disease. ProstaScint’s utility for predictingnodal disease was reported by Polascik et al [76],
who evaluated 198 patients and found thatcompared with pathologic findings, ProstaScinthad a sensitivity of 67%, a specificity of 80%,
a PPV of 75%, and an NPV of 73%. Combiningthe clinical algorithms with the results of Pros-taScint improved the PPV of lymph node in-
volvement [76].Although ProstaScint results may reinforce the
predictive capacity of the other clinical tests suchas PSA level, the significance of an incongruent
positive or negative result is not clear. At thistime, ProstaScint does not appear to be animportant part of the initial assessment of most
patients; certainly those with low-risk to interme-diate-risk profiles and most with even high-riskfeatures.
Other tests
Traditionally, radionuclide bone scintigraphy(bone scans) has been utilized for the initial
staging of prostate cancer and was reported to bea sensitive method of detecting metastatic lesionsin bone (Fig. 7) [77]. Analysis of CaPSURE
data indicates high utilization rates even amongmen in low-risk (18.6%) and intermediate-risk(50.9%) categories [2], despite the findings ofOesterling [78] that less than 1% of men with
a PSA level of less than or equal to 20 ng/mL havepositive scans. In a study of 111 Dutch patientswho had positive bone scans, Wymenga et al [79]
noted that bone scans may initially be more usefulif patients present with elevated alkaline phos-phatase levels (>90 U/L) or bone pain. In
Table 4
Imagine recommendations
Modality Recommendation
Transrectal
ultrasound
All patients eligible for biopsy
Assessment of volume
Consider color Doppler
for directed biopsies
Bone Scan PSA> 15 ng/mL
High-risk patients
Elevated alkaline phosphatase
Bony pain
CT Negative bone scan
in very high-risk patients
MRI/MRS Select intermediate
and high-risk patients
Low risk: PSA<10 ng/mL or clinical stage T1c, T2a-
disease, or Gleason grade 2–6 with no component over 3.
Intermediate risk: PSA between 10 and 20, Gleason 7,
or T2b disease.
High risk: PSA> 20 ng/ml, Gleason> 7 or clinical
T2c, T3 disease or higher.
Abbreviation: MRS, magnetic resonance spectroscopy;
PSA, prostate - specific antigen.
Table 5
Summary of data on prediction of extracapsular extension
Imaging test Sensitivity Specificity PPV NPV
Transtrectal ultrasound 23%–91% 46%–71% 50%–63% 49%–90%
Color Doppler No data No data No data No data
Power Doppler No data No data No data No data
3D Doppler 80% 96% 90% 96%
MRI 13%–95% 49%–97% 51%–90% 63%–92%
MRI+MRS 45%–54% 93%–96% 65%–81% 85%–88%
CT scan 2.5%–89% 25%–92% 67% 59%
ProstaScint No data No data No data No data
Abbreviations: PPV, positive predictive value; NPV, negative predictive value;MRS, magnetic resonance spectroscopy.
289R.S. Purohit et al / Urol Clin N Am 30 (2003) 279–293
a multivariate analysis of 631 patients who hada bone scan and prostate biopsy, Lee et al [80]found that bone scans were not useful as an initial
staging tool but could assist in determining theexistence of metastatic disease in men witha Gleason grade greater than 7, a PSA level ofgreater than 50 ng/mL, or clinical stage greater
than T3 disease. Although in their study, Lee et al[80] had defined high risk as patients with a PSAlevel of greater than 50 ng/mL, a PSA level of
greater than 15 to 20 ng/mL is more commonlycategorized as the cutoff point for obtaininga bone scan.
Data have shown that positron emissiontomography (PET) scan, occasionally used fordepicting metastasis in prostate cancer, does not
have utility for the routine staging of prostatecancer [81]. The development of new tracers forPET scan—such as labeled 11C-choline [82] and11C-acetate [83]—may assist in detecting and
staging prostate cancer, although data on this iscurrently lacking.
Summary
At this time there is no highly sensitive andspecific widespread radiographic test for local
staging of prostate cancer. Future developmentswill likely require a combination of imagingmodalities with utilization guided by risk-stratifi-
cation models (Table 4). Staging data for allimaging tests discussed in this article are summa-rized in Tables 5 and 6.
Clinically, conventional gray-scale TRUS re-
mains the most frequently used tool because of itsutility in guiding prostatic biopsies. Modificationsof TRUS—including power and color Doppler,
3D imaging, and new ultrasound contrast agentsand elastography—show promise in increasing theaccuracy of ultrasound.
Endorectal MRI may have some value forstaging selected patients. The addition of prostaticMRS, which images the differential activity of
metabolites, may increase the specificity of MRI.Newer techniques with finer voxel resolution mayprove to be clinically useful. A large well-designedstudy evaluating the utility of MRI/MRS is
currently being planned.Cross–sectional imaging of the pelvis with
either MRI or CT should be used selectively
as should radionuclide bone scans. Similarly,ProstaScint scans should be ordered selectively,either before or after primary therapy, rather than
routinely in all patients.
References
[1] Gilliland FD, Hunt WC, Key CR. Improving
survival for patients with prostate cancer diagnosed
in the prostate-specific antigen era. Urology 1996;
48:67–71.
[2] Cooperberg MR, Lubeck DP, Grossfeld GD, et al.
Contemporary trends in imaging test utilization
for prostate cancer staging: data from the cancer of
the prostate strategic urologic research endeavor.
J Urol 2002;168:491–5.
[3] Mukamel E, Hanna J, deKernion JB. Pitfalls in
preoperative staging in prostate cancer. Urology
1987;30:318–21.
[4] Grossfeld GD, Latini DM, Lubeck DP, et al.
Predicting disease recurrence in intermediate and
high-risk patients undergoing radical prostatec-
tomy using percent positive biopsies: results from
CaPSURE. Urology 2002;59:560–5.
[5] Schroder FH, van der Maas P, Beemsterboer P,
et al. Evaluation of the digital rectal examination
as a screening test for prostate cancer. Rotterdam
section of the European Randomized Study of
Screening for Prostate Cancer. J Natl Cancer Inst
1998;90:1817–23.
[6] Jewett HJ, Bridge RW, Gray Jr GF, Shelley WM.
The palpable nodule of prostate cancer. Results 15
years after radical excision. JAMA 1968;203:403–6.
Table 6
Summary of data on prediction of seminal vesicle invasion
Imaging test Sensitivity Specificity PPV NPV
Transrectal ultrasound 22%–75% 88%–100% 67%–75% 86%–98%
Color Doppler No data No data No data No data
Power Doppler No data No data No data No data
3D Doppler No data No data No data No data
MRI 20%–83% 92%–98% 40%–75% 73%–98%
MRI+MRS No data No data No data No data
CT scan 5.8%–96% 36%–99% 80% 76%
ProstaScint No data No data No data No data
Abbreviations: PPV, positive predictive value; NPV, negative predictive value;MRS, magnetic resonance spectroscopy.
290 R.S. Purohit et al / Urol Clin N Am 30 (2003) 279–293
[7] Thompson IM, Ernst JJ, Gangai MP, et al.
Adenocarcinoma of the prostate: results of routine
urological screening. J Urol 1984;132:690–2.
[8] Rees MA, Resnick MI, Oesterling JE. Use of
prostate-specific antigen, Gleason score, and digital
rectal examination in staging patients with newly
diagnosed prostate cancer. Urol Clin North Am
1997;24:379–88.
[9] Partin AW, Mangold LA, Lamm DM, et al.
Contemporary update of prostate cancer staging
nomograms (Partin Tables) for the new millennium.
Urology 2001;58:843–8.
[10] Stamey TA, McNeal JE, Yemoto CM, et al. Bio-
logical determinants of cancer progression in men
with prostate cancer. JAMA 1999;281:1395–400.
[11] Rodriguez LV, Terris MK. Risks and complications
of transrectal ultrasound. Curr Opin Urol 2000;
10:111–6.
[12] Shinohara K, Wheeler TM, Scardino PT. The
appearance of prostate cancer on transrectal ultra-
sonography: correlation of imaging and patholog-
ical examinations. J Urol 1989;142:76–82.
[13] Terris MK, Macy M, Freiha FS. Transrectal
ultrasound appearance of prostatic granulomas
secondary to bacillus Calmette-Guerin instillation.
J Urol 1997;158:126–7.
[14] Lile R, Thickman D, Miller GJ, et al. Prostatic
comedocarcinoma: correlation of sonograms with
pathologic specimens in three cases. AJR Am J
Roentgenol 1990;155:303–6.
[15] Varghese SL, Grossfeld GD. The prostatic gland:
malignancies other than adenocarcinomas. Radiol
Clin North Am 2000;38:179–202.
[16] Liebross RH, Pollack A, Lankford SP, et al.
Transrectal ultrasound for staging prostate carci-
noma prior to radiation therapy: an evaluation
based on disease outcome. Cancer 1999;85:1577–85.
[17] Aarnink RG, Beerlage HP, De La Rosette JJ, et al.
Transrectal ultrasound of the prostate: innovations
and future applications. J Urol 1998;159:1568–79.
[18] Catalona WJ, Smith DS, Ratliff TL, et al.
Measurement of prostate-specific antigen in serum
as a screening test for prostate cancer. N Engl J
Med 1991;324:1156–61.
[19] Carter HB, Pearson JD, Metter EJ, et al. Longitu-
dinal evaluation of prostate-specific antigen levels in
men with and without prostate disease. JAMA
1992;267:2215–20.
[20] Littrup PJ, Williams CR, Egglin TK, et al. De-
termination of prostate volume with transrectal US
for cancer screening. Part II. Accuracy of in vitro
and in vivo techniques. Radiology 1991;179:49–53.
[21] Sech S, Montoya J, Girman CJ, et al. Interexaminer
reliability of transrectal ultrasound for estimating
prostate volume. J Urol 2001;166:125–9.
[22] Babaian RJ, Troncoso P, Steelhammer LC, et al.
Tumor volume and prostate specific antigen:
implications for early detection and defining a win-
dow of curability. J Urol 1995;154:1808–12.
[23] Porter AT, Blasko JC, Grimm PD, et al. Brachy-
therapy for prostate cancer. CA Cancer J Clin 1995;
45:165–78.
[24] Ukimura O, Troncoso P, Ramirez EI, et al. Prostate
cancer staging: correlation between ultrasound de-
termined tumor contact length and pathologically
confirmed extraprostatic extension. J Urol 1998;
159:1251–9.
[25] Salo JO, Kivisaari L, Rannikko S, et al. Comput-
erized tomography and transrectal ultrasound in the
assessment of local extension of prostatic cancer
before radical retropubic prostatectomy. J Urol
1987;137:435–8.
[26] Hardeman SW, Causey JQ, Hickey DP, et al.
Transrectal ultrasound for staging prior to radical
prostatectomy. Urology 1989;34:175–80.
[27] Rifkin MD, Zerhouni EA, Gatsonis CA, et al.
Comparison of magnetic resonance imaging and
ultrasonography in staging early prostate cancer.
Results of a multi-institutional cooperative trial.
N Engl J Med 1990;323:621–6.
[28] Bates TS, Gillatt DA, Cavanagh PM, et al. A
comparison of endorectal magnetic resonance
imaging and transrectal ultrasonography in the
local staging of prostate cancer with histopatholog-
ical correlation. Br J Urol 1997;79:927–32.
[29] Presti JC Jr, Hricak H, Narayan PA, et al. Local
staging of prostatic carcinoma: comparison of
transrectal sonography and endorectal MR imag-
ing. AJR Am J Roentgenol 1996;166:103–8.
[30] Smith JA Jr, Scardino PT, Resnick MI, et al.
Transrectal ultrasound versus digital rectal exami-
nation for the staging of carcinoma of the prostate:
results of a prospective, multi-institutional trial.
J Urol 1997;157:902–6.
[31] Gustafsson O, Carlsson P, Norming U, et al. Cost-
effectiveness analysis in early detection of prostate
cancer: an evaluation of six screening strategies in
a randomly selected population of 2,400 men.
Prostate 1995;26:299–309.
[32] Bigler SA, Deering RE, Brawer MK. Comparison
of microscopic vascularity in benign and malignant
prostate tissue. Hum Pathol 1993;24:220–6.
[33] Cornud F, Hamida K, Flam T, et al. Endorectal
color doppler sonography and endorectal MR
imaging features of nonpalpable prostate cancer:
correlation with radical prostatectomy findings.
AJR Am J Roentgenol 2000;175:1161–8.
[34] Rifkin MD, Sudakoff GS, Alexander AA. Prostate:
techniques, results, and potential applications of
color Doppler US scanning. Radiology 1993;186:
509–13.
[35] Kelly IM, Lees WR, Rickards D. Prostate cancer
and the role of color Doppler US. Radiology
1993;189:153–6.
[36] Newman JS, Bree RL, Rubin JM. Prostate cancer:
diagnosis with color Doppler sonography with
histologic correlation of each biopsy site. Radiology
1995;195:86–90.
291R.S. Purohit et al / Urol Clin N Am 30 (2003) 279–293
[37] Shigeno K, Igawa M, Shiina H, et al. The role of
colour Doppler ultrasonography in detecting pros-
tate cancer. BJU Int 2000;86:229–33.
[38] Patel U, Rickards D. The diagnostic value of colour
Doppler flow in the peripheral zone of the prostate,
with histological correlation. Br J Urol 1994;74:
590–5.
[39] Ismail M, Petersen RO, Alexander AA, et al. Color
Doppler imaging in predicting the biologic behavior
of prostate cancer: correlation with disease-free
survival. Urology 1997;50:906–12.
[40] Okihara K, Watanabe H, Kojima M. Kinetic study
of tumor blood flow in prostatic cancer using power
Doppler imaging. Ultrasound Med Biol 1999;25:
89–94.
[41] Sakarya ME, Arslan H, Unal O, et al. The role of
power Doppler ultrasonography in the diagnosis
of prostate cancer: a preliminary study. Br J Urol
1998;82:386–8.
[42] Rubin JM, Bude RO, Carson PL, et al. Power
Doppler US: a potentially useful alternative to mean
frequency-based color Doppler US. Radiology
1994;190:853–6.
[43] Okihara K, Kojima M, Nakanouchi T, et al.
Transrectal power Doppler imaging in the detection
of prostate cancer. BJU Int 2000;85:1053–7.
[44] Okihara K, Miki T, Babaian RJ. Clinical efficacy
of prostate cancer detection using power Doppler
imaging in American and Japanese men. J Clin
Ultrasound 2002;30:213–21.
[45] Tong S, Cardinal HN, McLoughlin RF, et al. Intra-
and inter-observer variability and reliability of
prostate volume measurement via two-dimensional
and three-dimensional ultrasound imaging. Ultra-
sound Med Biol 1998;24:673–81.
[46] Garg S, Fortling B, Chadwick D, et al. Staging of
prostate cancer using 3-dimensional transrectal
ultrasound images: a pilot study. J Urol 1999;162:
1318–1321.
[47] Moskalik A, Carson PL, Rubin JM, et al. Analysis
of three-dimensional ultrasound Doppler for the
detection of prostate cancer. Urology 2001;57:
1128–32.
[48] Sedelaar JP, van Roermund JG, van Leenders GL,
et al. Three-dimensional grayscale ultrasound:
evaluation of prostate cancer compared with benign
prostatic hyperplasia. Urology 2001;57:914–20.
[49] Ragde H, Kenny GM, Murphy GP, et al. Trans-
rectal ultrasound microbubble contrast angiogra-
phy of the prostate. Prostate 1997;32:279–83.
[50] Bogers HA, Sedelaar JP, Beerlage HP, et al.
Contrast-enhanced three-dimensional power Dopp-
ler angiography of the human prostate: correlation
with biopsy outcome. Urology 1999;54:97–104.
[51] Frauscher F, Klauser A, Halpern EJ, et al.
Detection of prostate cancer with a microbubble
ultrasound contrast agent. Lancet 2001;357:1849–50.
[52] Frauscher F, Klauser A, Volgger H, et al. Com-
parison of contrast enhanced color Doppler tar-
geted biopsy with conventional systematic biopsy:
impact on prostate cancer detection. J Urol 2002;
167:1648–52.
[53] Souchon R, Soualmi L, Bertrand M, et al.
Ultrasonic elastography using sector scan imaging
and a radial compression. Ultrasonics 2002;40:
867–71.
[54] Millikan R, Logothetis C. Update of the NCCN
guidelines for treatment of prostate cancer. Oncol-
ogy (Huntingt) 1997;11:180–93.
[55] Hricak H, Dooms GC, Jeffrey RB, et al. Prostatic
carcinoma: staging by clinical assessment, CT, and
MR imaging. Radiology 1987;162:331–6.
[56] Platt JF, Bree RL, Schwab RE. The accuracy of CT
in the staging of carcinoma of the prostate. AJR
Am J Roentgenol 1987;149:315–8.
[57] Engeler CE, Wasserman NF, Zhang G. Preopera-
tive assessment of prostatic carcinoma by com-
puterized tomography. Weaknesses and new
perspectives. Urology 1992;40:346–50.
[58] Lee N, Newhouse JH, Olsson CA, et al. Which
patients with newly diagnosed prostate cancer need
a computed tomography scan of the abdomen and
pelvis? An analysis based on 588 patients. Urology
1999;54:490–4.
[59] Levran Z, Gonzalez JA, Diokno AC, et al. Are
pelvic computed tomography, bone scan and pelvic
lymphadenectomy necessary in the staging of
prostatic cancer? Br J Urol 1995;75:778–81.
[60] Flanigan RC, McKay TC, Olson M, et al. Limited
efficacy of preoperative computed tomographic
scanning for the evaluation of lymph node metas-
tasis in patients before radical prostatectomy.
Urology 1996;48:428–32.
[61] Gore RM, Moss AA. Value of computed tomogra-
phy in interstitial 125I brachytherapy of prostatic
carcinoma. Radiology 1983;146:453–8.
[62] Bartolozzi C, Menchi I, Lencioni R, et al. Local
staging of prostate carcinoma with endorectal
coil MRI: correlation with whole-mount radical
prostatectomy specimens. Eur Radiol 1996;6:
339–45.
[63] Perrotti M, Kaufman RP Jr, Jennings TA, et al.
Endo-rectal coil magnetic resonance imaging in
clinically localized prostate cancer: is it accurate?
J Urol 1996;156:106–9.
[64] Ikonen S, Karkkainen P, Kivisaari L, et al.
Magnetic resonance imaging of clinically localized
prostatic cancer. J Urol 1998;159:915–9.
[65] May F, Treumann T, Dettmar P, et al. Limited
value of endorectal magnetic resonance imaging
and transrectal ultrasonography in the staging of
clinically localized prostate cancer. BJU Int 2001;
87:66–9.
[66] Cornud F, Flam T, Chauveinc L, et al. Extrapro-
static spread of clinically localized prostate cancer:
factors predictive of pT3 tumor and of positive
endorectal MR imaging examination results. Radi-
ology 2002;224:203–10.
292 R.S. Purohit et al / Urol Clin N Am 30 (2003) 279–293
[67] Kurhanewicz J, Vigneron DB, Hricak H, et al.
Three-dimensional H-1 MR spectroscopic imaging
of the in situ human prostate with high (0.24–0.7-
cm3) spatial resolution. Radiology 1996;198:
795–805.
[68] Koutcher JA, Zakian K, Hricak H. Magnetic
resonance spectroscopic studies of the prostate.
Mol Urol 2000;4:143–53.
[69] Yu KK, Scheidler J, Hricak H, et al. Prostate
cancer: prediction of extracapsular extension with
endorectal MR imaging and three-dimensional
proton MR spectroscopic imaging. Radiology 1999;
213:481–8.
[70] Jager GJ, Ruijter ET, van de Kaa CA, et al.
Dynamic TurboFLASH subtraction technique for
contrast-enhanced MR imaging of the prostate:
correlation with histopathologic results. Radiology
1997;203:645–52.
[71] Clarke DH, Banks SJ, Wiederhorn AR, et al. The
role of endorectal coil MRI in patient selection and
treatment planning for prostate seed implants. Int
J Radiat Oncol Biol Phys 2002;52:903–10.
[72] Lange PH. PROSTASCINT scan for staging
prostate cancer. Urology 2001;57:402–6.
[73] Sodee DB, Malguria N, Faulhaber P, et al.
Multicenter ProstaScint imaging findings in 2154
patients with prostate cancer. The ProstaScint
Imaging Centers. Urology 2000;56:988–93.
[74] Murphy GP, Snow PB, Brandt J, et al. Evaluation
of prostate cancer patients receiving multiple
staging tests, including ProstaScint scintiscans.
Prostate 2000;42:145–9.
[75] Elgamal AA, Troychak MJ, Murphy GP. Prosta-
Scint scan may enhance identification of prostate
cancer recurrences after prostatectomy, radiation,
or hormone therapy: analysis of 136 scans of 100
patients. Prostate 1998;37:261–9.
[76] Polascik TJ, Manyak MJ, Haseman MK, et al.
Comparison of clinical staging algorithms and
111indium-capromab pendetide immunoscintigra-
phy in the prediction of lymph node involvement
in high risk prostate carcinoma patients. Cancer
1999;85:1586–92.
[77] Gerber G, Chodak GW. Assessment of value of
routine bone scans in patients with newly diagnosed
prostate cancer. Urology 1991;37:418–22.
[78] Oesterling JE. Using PSA to eliminate the staging
radionuclide bone scan. Significant economic im-
plications. Urol Clin North Am 1993;20:705–11.
[79] Wymenga LF, Boomsma JH, Groenier K, et al.
Routine bone scans in patients with prostate cancer
related to serum prostate-specific antigen and
alkaline phosphatase. BJU Int 2001;88:226–30.
[80] Lee N, Fawaaz R, Olsson CA, et al. Which patients
with newly diagnosed prostate cancer need a radio-
nuclide bone scan? An analysis based on 631 pa-
tients. Int J Radiat Oncol Biol Phys 2000;48:
1443–1446.
[81] Hofer C, Kubler H, Hartung R, et al. Diagnosis and
monitoring of urological tumors using positron
emission tomography. Eur Urol 2001;40:481–7.
[82] Mathews D, Oz OK. Positron emission tomography
in prostate and renal cell carcinoma. Curr Opin
Urol 2002;12:381–5.
[83] Oyama N, Akino H, Kanamaru H, et al. 11C-
acetate PET imaging of prostate cancer. J Nucl Med
2002;43:181–6.
[84] Tuzel E, Sevinc M, Obuz F, et al. Is magnetic
resonance imaging necessary in the staging of
prostate cancer? Urol Int 1998;61:227–31.
[85] Deasy NP, Conry BG, Lewis JL, et al. Local staging
of prostate cancer with 0.2 T body coil MRI. Clin
Radiol 1997;52:933–7.
[86] Yu KK, Hricak H, Alagappan R, et al. Detection of
extracapsular extension of prostate carcinoma with
endorectal and phased-array coil MR imaging:
multivariate feature analysis. Radiology 1997;202:
697–702.
293R.S. Purohit et al / Urol Clin N Am 30 (2003) 279–293
Recommended