i n v e s t o r p a c k

2
Market Information
JSE Top 40 index position: #22
Free float 41%
Market cap $3.1bn
Daily value traded $6.1m for past 12 months
Annualised turnover 77% of total issued shares
Major shareholders- LNM Group 50.01% (#2 global steel producer)- IDC 8.8%- Institutional 41%
- South Africa 28%- International 13%
Good liquidity and high turnover

3
Company Profile
1928 – Iscor established as parastatal 1989 – Iscor privatised and listed on JSE 1994 – Start of major re-engineering program 2001 – Unbundling of mining division as Kumba Resources 2001 – LNM Holdings N.V. buys initial stake in Iscor 2002 – Iscor enters into BAA with LNM 2004 – LNM/Iscor merger approved; LNM holding goes over 50% 2004 – Name changed to Ispat Iscor Steel industry ranking
- Africa #1 - Global #29
Largest regional steel producer

4
Successful Restructuring History
Major re-engineering 1994-2001- significant headcount reduction (30 000 people)- steel grades down from 302 to 50- inefficient capacity closed (1mtpa)- moved to lowest quartile on global cost curve
Value added products:- Flat 61%- Long 72%
Mining division (Kumba) unbundled November 2001- iron ore mining rights retained to ensure supply at cost
Market value increase* since unbundling (Nov ‘01): 500%
Major value release* Including effect of rights issue in April 2002
5
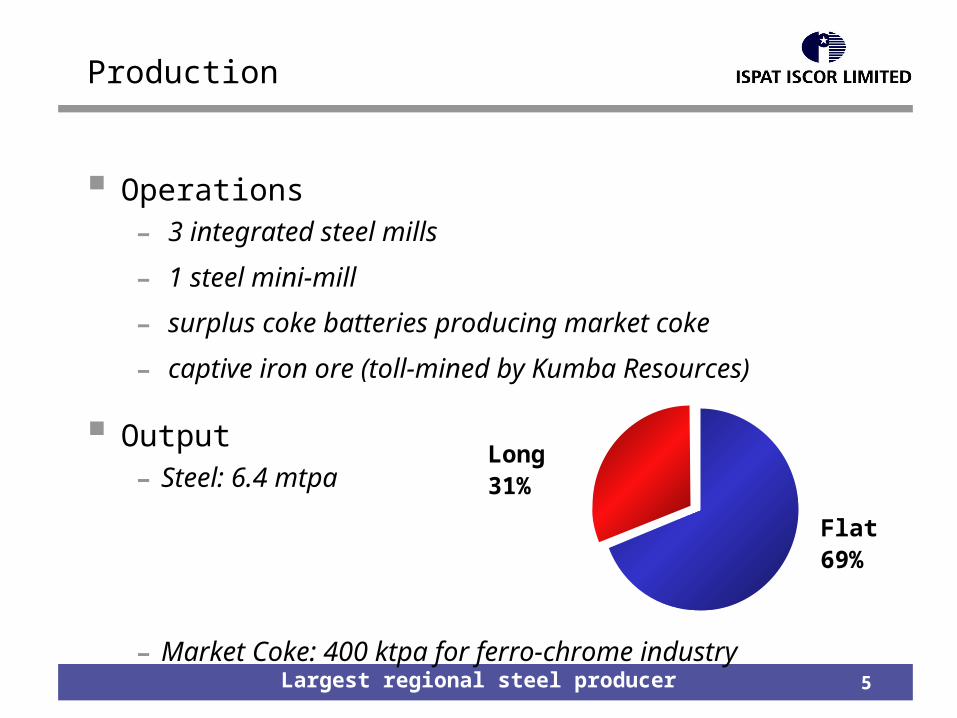
Production
Operations- 3 integrated steel mills
- 1 steel mini-mill
- surplus coke batteries producing market coke
- captive iron ore (toll-mined by Kumba Resources)
Output- Steel: 6.4 mtpa
- Market Coke: 400 ktpa for ferro-chrome industryLargest regional steel producer
Long 31%
Flat 69%

6
Geographic Location
Overview of operations Flat Products Vanderbijlpark
3.1 Mtpa final product Saldanha
1.3 Mtpa final product
Long Products Newcastle
1.7 Mtpa final product Vereeniging
0.3 Mtpa final product
6.4 Mtpa final product
Market Coke Vanderbijlpark and Newcastle
400 ktpa
Iron ore supply at cost + 3% 6.25 Mtpa iron ore from Sishen
2 Mtpa iron ore from Thabazimbi
VereenigingJohannesburg
NewcastleSishen
Vanderbijlpark
Thabazimbi
Saldanha
Cape Town
Durban
South Africa
Southern African location
Steel plants
Captive iron ore source

7
Geographic Sales
Switch to better paying markets
South Africa
Rest of Africa
Total Africa
Far East
European Union
North America
Middle East
Other
% 0 10 20 30 40 50 60 70 80
1H’04
1H’032H’03
8
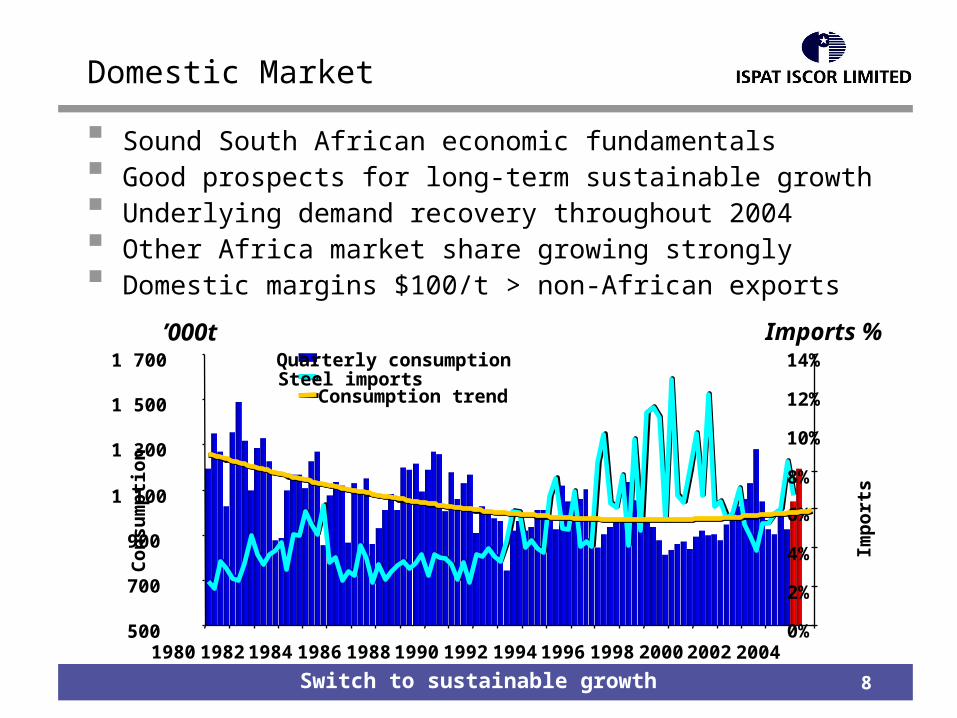
Domestic Market
Sound South African economic fundamentals Good prospects for long-term sustainable growth Underlying demand recovery throughout 2004 Other Africa market share growing strongly Domestic margins $100/t > non-African exports
Switch to sustainable growth
’000t Imports %
Co
nsu
mp
tio
n
Steel importsQuarterly consumption
500
700
900
1 100
1 300
1 500
1 700
1980 1982 1984 1986 1988 1990 1992 1994 1996 1998 2000 2002 20040%
2%
4%
6%
8%
10%
12%
14%
Imp
ort
s
Consumption trend

9
Domestic Pricing Policy
Domestic prices based on International Parity Principle
Downstream industry support programme ($70m pa) through:- export rebates
- strategic concessions
- long-term contracts (auto industry, packaging)
Competition Commission (Feb 2004) ruling that Iscor pricing policy is fair and reasonable: complainants have lodged appeal
Government has asked for review of downstream support programme
Current import duty – 5%- risk of removal considered low
- SA’s duty amongst lowest in world
International parity pricing model

10
Invoiced Export Prices
Record high prices
Source: Ispat Iscor
1994 1995 1996 1997 1998 1999 2000 2001 2002 2003 2004 2005180
230
280
330
380
430
480
530
580
630Hot rolled coilLow carbon wire rod
Based on order book & expectations
US$/t (c&f)
11
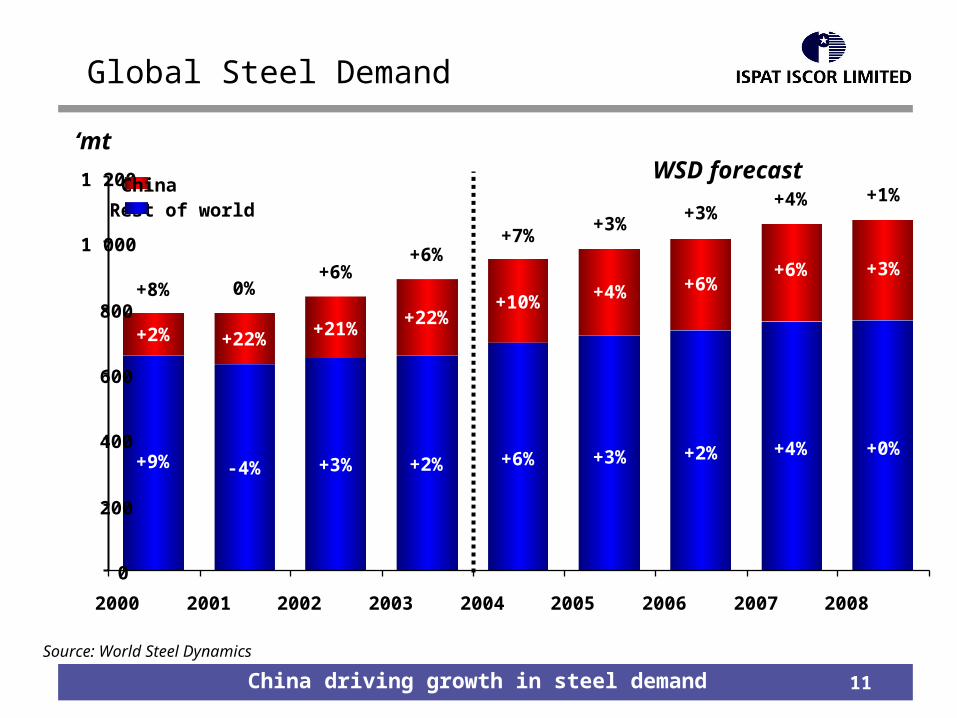
‘mtWSD forecast
Global Steel Demand
Source: World Steel Dynamics
China driving growth in steel demand
+2%
+10%+22%
+21%+22%+2%
+8%
+2% +4% +0%
+3%+6%+6%+4%
-4% +3% +6% +3%+9%
+6%+6%
+7%+3%
+3%+4% +1%
0%
0
200
400
600
800
1 000
1 200
2000 2001 2002 2003 2004 2005 2006 2007 2008
Rest of worldChina

12
‘mt
China – Supply and Demand
China expected to become net exporter
China forecast to become net exporter by 2008
WSD forecast
0
50
100
150
200
250
300
350
2000 2001 2002 2003 2004 2005 2006 2007 2008
ProductionConsumption
Source: World Steel Dynamics

13
World Steel Consumption Trends
Per capita steel demand entering growth phase
Source: Macquarie Research
World Steel Consumption and GDP Per Capita, 1950-2010
China takes off!
1 500
2 000
2 500
3 000
3 500
4 000
4 500
5 000
5 500
6 000
6 500
7 000
50 55 60 65 70 75 80 85 90 95 100 105 110 115 120 125 130 135 140 145 150 155 160
kg steel/capita
$US
/cap
ita
($
1995
)
20021997
1994 1989
1983 1979
19751971
1970
1973
1961First and second oil prices and subsequent recessions led to massive light-weighting of steel-containing products
Post war expansion to 1970 led to predictions of seemingless endless growth
Collapse of USSR led to steel consumption collapse in Eastern Europe
Asian crisis
1954
2004
2010
Phase 1
Phase 3
Phase 2
1999

14
Global Input Price Trends
Global input prices still under pressure
Based to 100 Based to 100
Coking coal - contract (LHS)Iron ore fines - contract (LHS) Coke (RHS)
Freight rates (RHS)
Scrap (RHS)
Source: Ispat Iscor
90
100
110
120
130
140
150
160
170
Jul-01 Jan-02 Jul-02 Jan-03 Jul-03 Jan-04 Jul-04
0
100
200
300
400
500
600
700
800
15
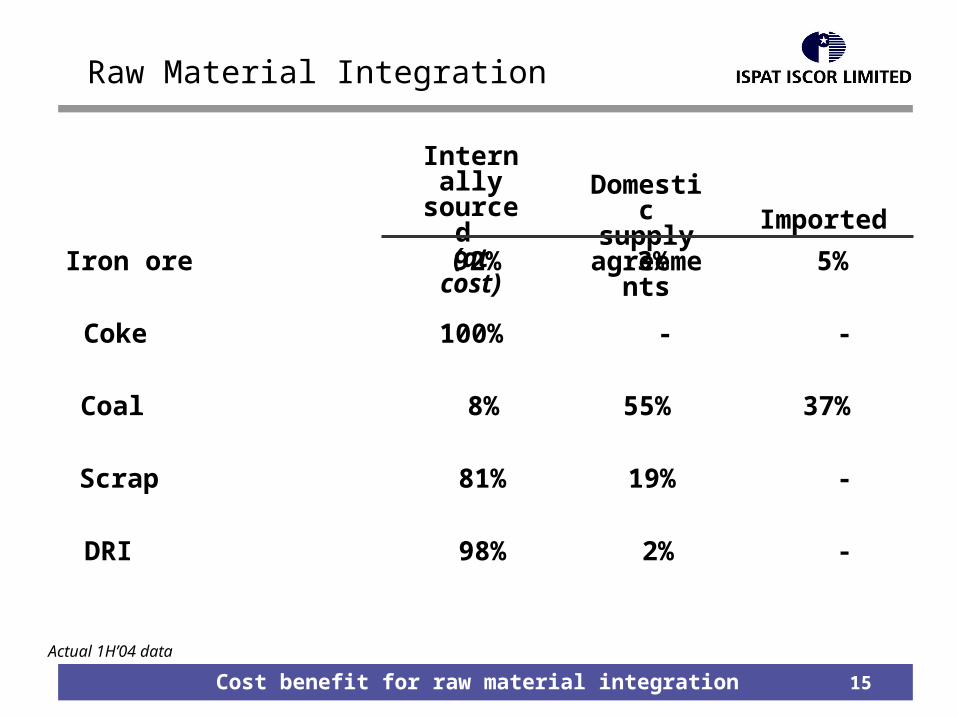
Raw Material Integration
Internally
sourced (at cost) Imported
Domestic
supplyagreement
s
Coke 100% --
Coal 8% 37%55%
Scrap 81% - 19%
Iron ore 92% 5%3%
Cost benefit for raw material integration
DRI 98% - 2%
Actual 1H’04 data
16
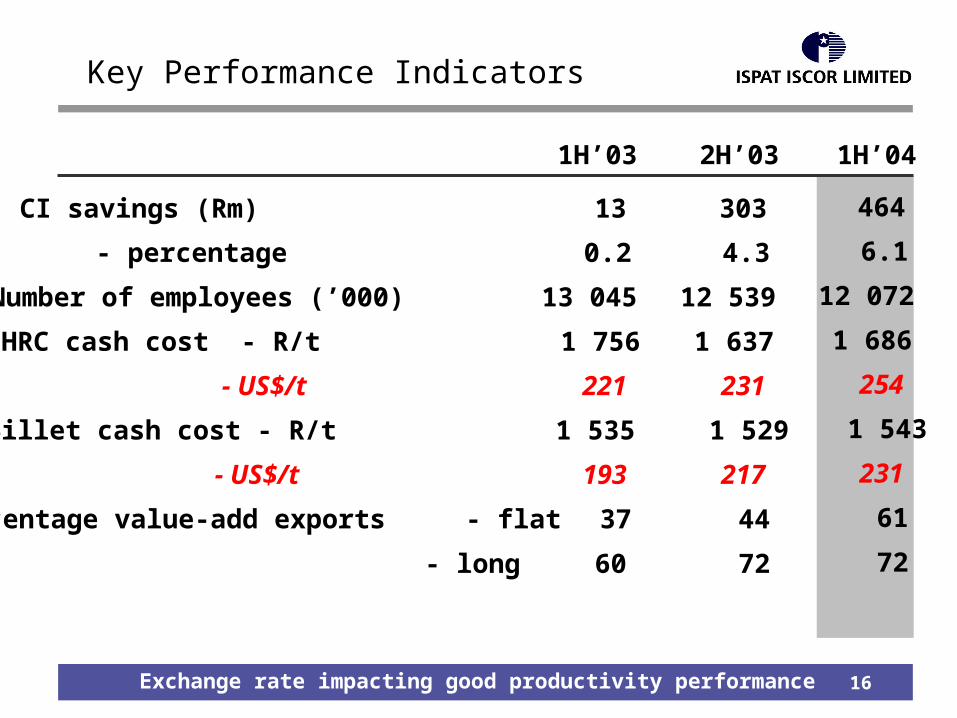
Key Performance Indicators
2H’031H’03 1H’04
Exchange rate impacting good productivity performance
- percentage 4.30.2 6.1
Number of employees (’000) 12 53913 045 12 072
CI savings (Rm) 30313 464
HRC cash cost - R/t 1 637 1 756 1 686
- US$/t 231221 254
Billet cash cost - R/t 1 5291 535 1 543
- US$/t 217193 231
Percentage value-add exports - flat 44 37 61
- long 7260 72

17
Headline Earnings
Record earnings
Rm 2H’031H’03 1H’04
* After tax
Headline earnings 462 1 143
Comparable operating profit Financing cost - net interest expense
TaxEquity earnings*
Revenue
Minority interest
Comparable earnings
BAA remuneration*Restructuring costs*Power contract settlement*
- in US$m
1 504 1 871 (16)(31)
(492) (608)67 48
9 175 9 312
(3)1
1 007 1 253
(429) (116)
(110)
145 156
2 948(14)
(914)179
1 551
10 544
(4)
2 062
(511)
311
- long-term provision top-up (53)(28) (133)
# Lower discount rate accounts for R100m
#

18
Comparable Headline Earnings Trend
Steel cycle overshadows Rand strength
0
150
300
450
600
750
900
1 050
1 200
0
30
60
90
120
150
180
Rand million US$ million
657
1Q’03
596
2Q’03
352
3Q’03
655
4Q’03 1Q’04
669
2Q’04
1 393
2101 350
1 500 240
79
1Q’03R8.32/$
77
2Q’03R7.73/$
48
3Q’03R7.40/$
97
4Q’03R6.72/$
1Q’04
99
R6.75/$
2Q’04
212
R6.57/$* Average R/US$ spot rate *

19
Key Result Drivers
HRC cash cost per tonne (Rands) -4%
Domestic sales volume +22%
HRC US$ price +40%
Exchange rate +21%
Operating margin* 20% 28%
Positive Negative1H’04 vs 1H’03
* Excluding BAA remuneration (1H’04) & power contract settlement (1H’03)
Strong Rand only negative factor

20
Sensitivity Analysis
Significant gearing to major variables
VariableHeadline
Earnings*Operating
Income*EPS
(SAc)*Change
Domestic sales 127187 29±10%
International steel price 134197 30±$10/tonne
Exchange rate 79 ±10c 116 18
* Based on impact for full six months forecast July-December 2004

21
Financial Ratios
Margins approaching cyclical peak levels
2H’031H’03 1H’04
Revenue/invested capital (times) 1.3 1.3 1.4
Net cash/equity (%) 5.8 0.2 9.7
Return on equity (%) - on comparative basis (%)
18 720 16
2330
Operating margin (%) - on comparative basis (%)
18 820 16
2128
EBITDA margin (%) - on comparative basis (%)
23 1325 22
2633

22
Distribution to Shareholders
In view of our strong cash flow:
Current distribution policy being reviewed
Capital reduction proposal to be put to shareholders before
end-2004
Programme of capital reduction to be instituted
Current stated capital R14/share
No interim dividend declaration
Surplus capital to be returned to shareholders

23
3-Year Focus
Further quantum reduction in costs
Increase production from current assets by 1mtpa
Focus on value-add projects
Lowest quartile producer (delivered EU cost basis)
Defer South African steel industry consolidation
Join select group of steel companies earning in excess of WACC

24
Outlook for 2004
Positive steel business environment- ongoing global consumption growth
- prices increasing from current levels
- continued strength in domestic demand
Operations- ongoing cost reduction
- increased throughput
Earnings- Q3 up on Q2
Positive outlook
25
Investment Case
Competitive producer- vertically integrated- lowest cost quartile focus- part of major global steel group- naturally protected domestic market
Growth potential- growing, more profitable regional market- sweat current assets for extra 1mtpa- expansion of market coke operations- domestic steel industry consolidation
Gearing to Chinese growth- steel market fortunes dependent on continued Chinese growth- Ispat Iscor revenue directly linked to international steel prices
Competitive low-cost producer

M a r k e t D a t a

27
Steel Equity Performance
Ispat Iscor amongst best performers
Source: Bloomberg
0
500
600
Jun ‘02
Aug ‘02
Oct ‘02
Dec ’02
Feb ‘03
Apr ‘03
Jun ‘03
Aug ‘03
Oct ‘03
Dec ‘03
Feb ‘04
Apr ‘04
Jun ‘04
100
200
300
400China Steel
Gerdau
CSN
POSCO
Severstal
Ispat Iscor
Bluescope
Arcelor
Nucor
US Steel
Aug ‘04
Base to 100, all prices in US$

28
Steel Equity P/E’s (Forward)
Ispat Iscor still attractively valued
Source: Bloomberg, 24 August 2004
0
2
4
6
8
10
12
14
POSCOCST
SEVERSTAL
ISPAT IS
COR
ARCELOR
US STEEL
STEEL DYNAM
ICS
SAIL
INT’L
STEEL
CHINA S
TEEL
GERDAU
NUCORCSN
TISCO
BLUESCOPE S
TEEL
BAOSHAN
THYSSENKRUPP
VOESTALPIN
E
ONESTEEL LI
MIT
ED

29
Steel Equity Price/Book
Ispat Iscor still attractively valued
Source: Bloomberg, 24 August 2004
0
0.5
1.0
1.5
2.0
2.5
3.0
3.5
CST
VOESTALPIN
E
ARCELOR
THYSSENKRUPP
POSCO
ONESTEEL
LIM
ITED
ISPAT IS
CORCSN
USIMIN
AS SA
CHINA S
TEEL
SEVERSTAL
STEEL DYNAM
ICS
BAOSHAN
NUCOR
INT’L
STEEL
GERDAU
US STEEL
TISCO

30
Steel Equity Market Capitalisation
Mid-sized market cap
Source: Bloomberg, 24 August 2004
US$m
0
2 000
4 000
6 000
8 000
10 000
12 000
14 000
ONESTEEL
LIM
ITED
STEEL
DYNAMIC
S
VOESTALPIN
ECST
TISCO
INTERNATIO
NAL
STEEL
ISPAT IS
COR
USIMIN
AS SA
SEVERSTAL
BLUESCOPE S
TEEL
US STEEL
CSN
GERDAU
NUCOR
CHINA S
TEEL
BAOSHAN
THYSSENKRUPP
ARCELOR
POSCO
e x t r a s l i d e s

32
Relationship with LNM
Iscor’s long-term desire to link-up with a major steel group
Business assistance agreement signed with LNM (Jan ‘02)- remuneration linked to performance - target cost savings (excl. labour + first 1%) R350m to R700m pa - LNM reward: 5-10% Iscor issued shares or cash equivalent
Sustainable savings to June 2004 – R1 326m per annum- cost savings target exceeded by 132%- R613m (value of 25.7m shares) paid to LNM Dec ‘03- R731 (value of 18.9m shares) paid to LNM Aug ’04
BAA expires at end-2004- allowance for renegotiation- approval of minority shareholders required
Value from international tie-up
33
Business Assistance Agreement
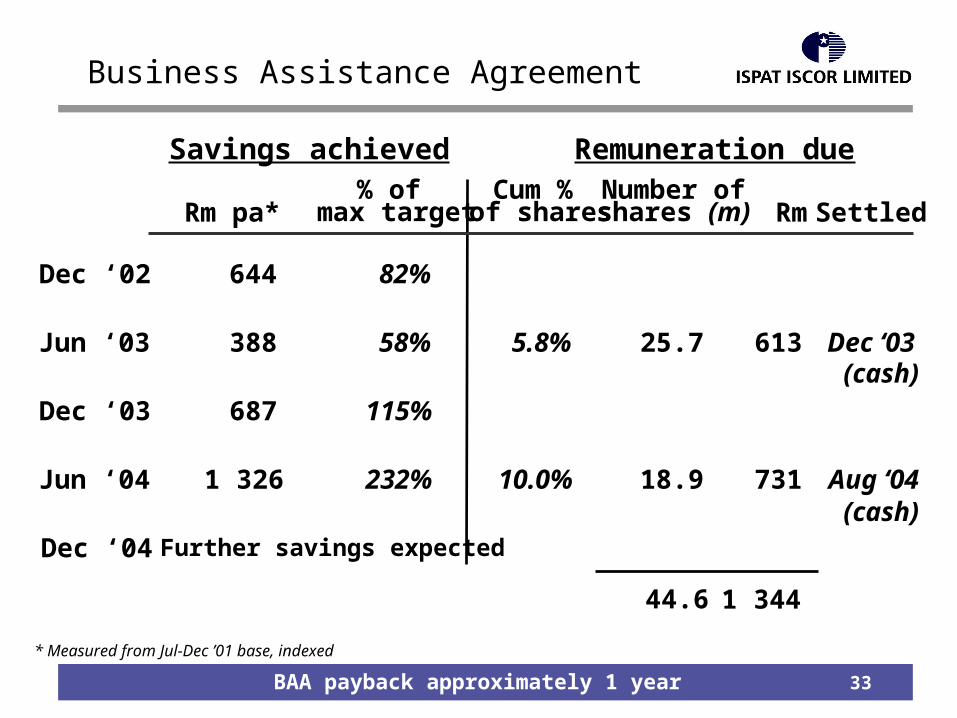
BAA payback approximately 1 year
Savings achievedCum %
of shares
Remuneration due
Settled
* Measured from Jul-Dec ’01 base, indexed
Rm pa*% of
max target
Dec ‘03 687 115%
Dec ‘02 644 82%
Number ofshares (m) Rm
Jun ‘03 5.8% 388 613 Dec ‘0358% 25.7
Jun ‘04 731 10.0% 1 326 232% 18.9 Aug ‘04
1 34444.6
Dec ‘04 Further savings expected
(cash)
(cash)

34
BAA Savings Analysis
BAA savings spread over group operations
By Savings Annualised Savings (Rm) %
Total BAA Savings 1 326 100%
Procurement 468 35%
Vanderbijlpark 506 38%
Saldanha 251 19%
Newcastle 378 29%
Efficiencies 858 65%
By Plant
Vereeniging 190 14%
Total BAA Savings 1 326 100%
Annualised Savings (Rm) %
35
Currency Strength
Rand has strengthened 37% against US$ over past 24 months
Rand relatively stronger than currencies of competitor countries
Costs 65% Rand-based
Focus to maintain position on cost curve
3-yr programme - restructuring
- improvement projects
- efficiency programmes
Pro-active initiatives to counter strong Rand
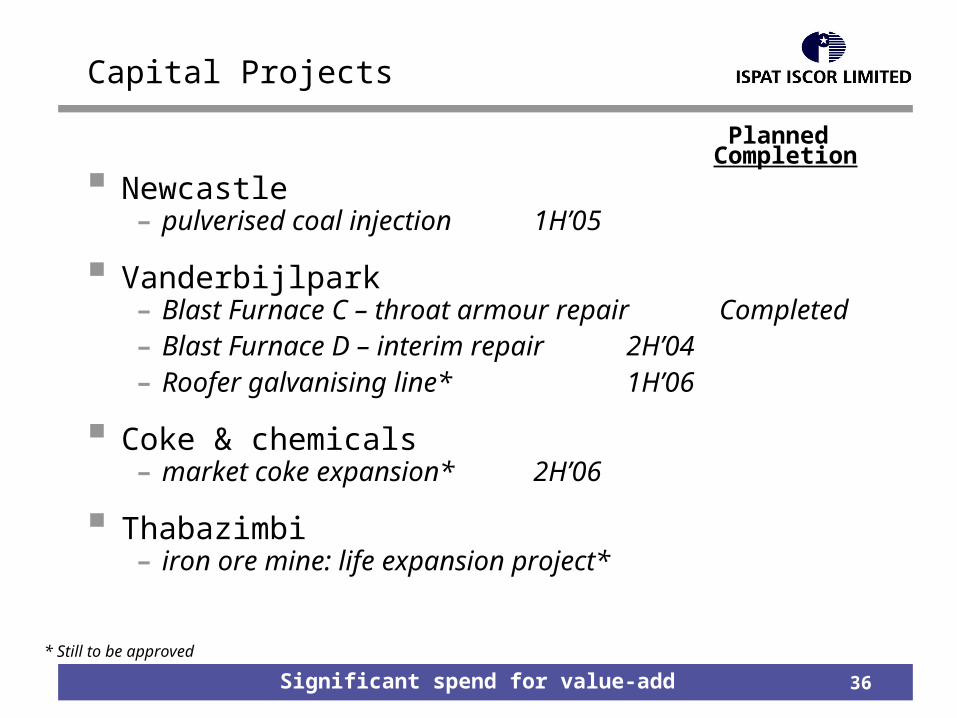
36
Newcastle - pulverised coal injection 1H’05
Vanderbijlpark- Blast Furnace C – throat armour repair
Completed- Blast Furnace D – interim repair 2H’04- Roofer galvanising line* 1H’06
Coke & chemicals- market coke expansion* 2H’06
Thabazimbi - iron ore mine: life expansion project*
Significant spend for value-add
Planned Completion
* Still to be approved
Capital Projects

37
Environmental
Environmental master plans approved
All steel operations ISO 14001 certified
Major environmental projects in progress- Vanderbijlpark
- main water treatment plant
- coke oven gas & water cleaning
- Newcastle
- reverse osmosis water treatment plant
Focus on environmental compliance

38
Cash Flow
Strong cash flow
Rm 2H’031H’03 1H’04
BAA remuneration (613)
Capex (499)(780) (405)
Asset sales 46 41 13
Working capital (292)(48) (1 069)
Finance cost (9) (96) (22)
Tax (1 032)(55) (273)
Dividends (446) (446) (334)
Net cash flow (823)918 1 362
Cash generated by operations 2 022 2 302 3 452

39
Capital Expenditure
Increased value-add and environmental spend
Rm 1H’03 1H’042H’03 2H’04Fcast
Replacement 300 452 267 352
Environmental 75 109 56 130
Total 499 780 405 860
Depreciation 469 451 478 519
Value adding 124 219 82 378
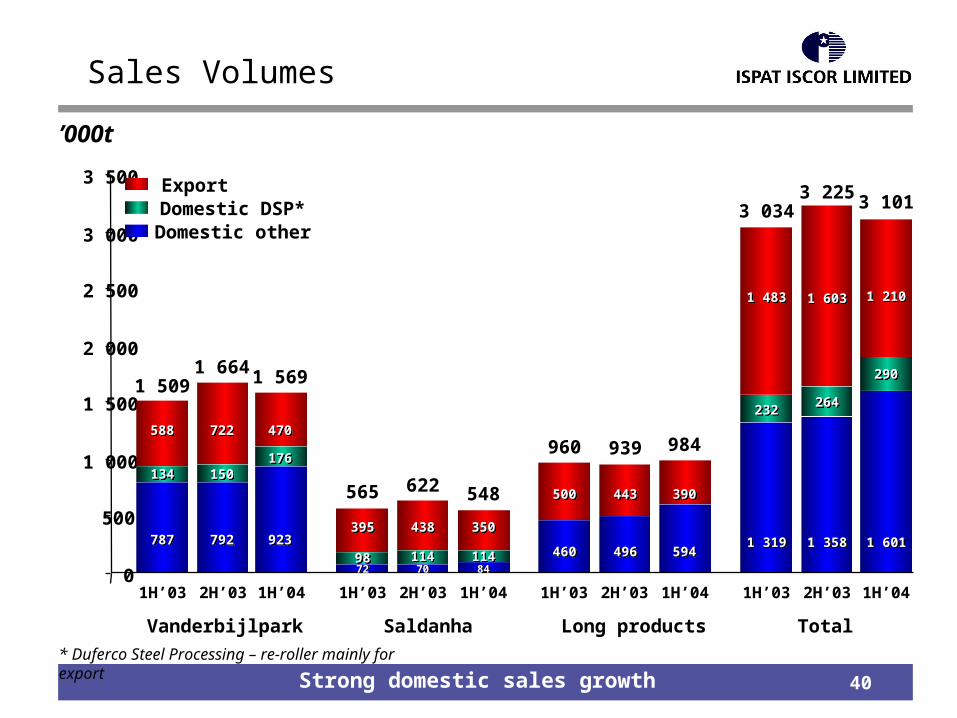
40
Sales Volumes
Strong domestic sales growth
’000t
Vanderbijlpark Saldanha Long products
2H’031H’03 1H’04
Total
2H’031H’03 1H’04 2H’031H’03 1H’040
500
1 000
1 500
2 000
2 500
3 000
3 500
588588 722722
787787 792792395395 438438
500500 443443
460460 496496
1 5091 664
565 622
960 939134134
9898 114114
150150
7272 7070
470470
923923
1 569
176176
350350
548
1141148484
390390
594594
984
1H’03
1 4831 483
1 3191 319
3 034
232232
2H’03
1 6031 603
1 3581 358
3 225
264264
3 101
1H’04
1 2101 210
1 6011 601
290290
* Duferco Steel Processing – re-roller mainly for export
Domestic DSP*Export
Domestic other

41
Liquid Steel Production
Production affected by Saldanha breakout
’000t
0
500
1 000
1 500
2 000
2 500
3 000
3 500
4 000
Vanderbijlpark Saldanha Long products
2H’031H’03 1H’04
Total
2H’031H’03 1H’04 2H’031H’03 1H’04 2H’031H’03 1H’04
1 811 1 870
606 645
1 073 1 080
1 829
563
1 085
3 4903 595
3 477
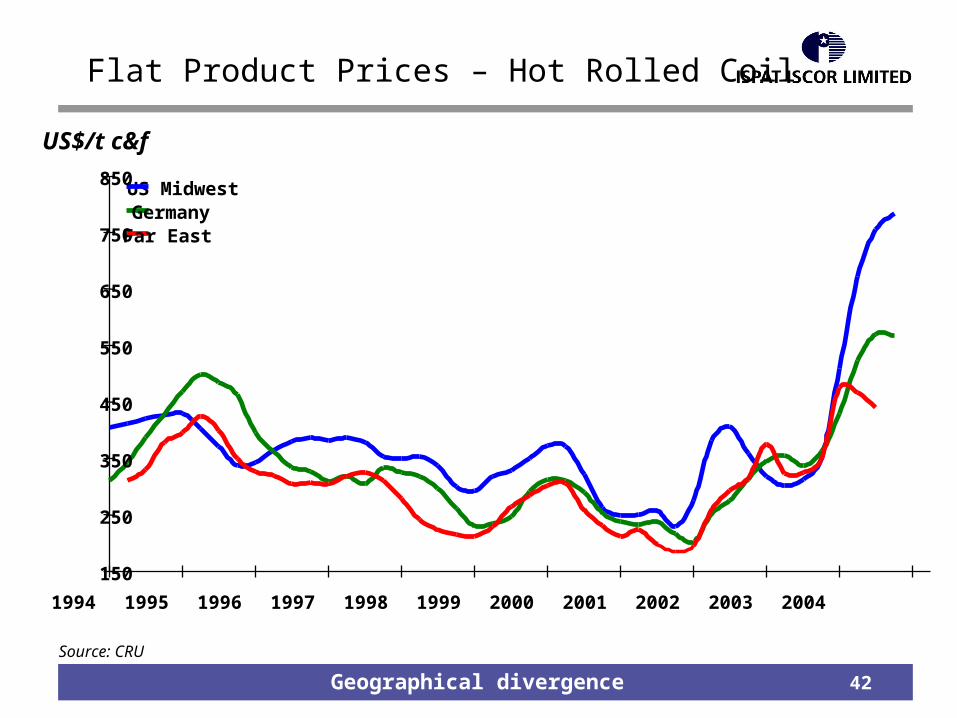
42
Flat Product Prices – Hot Rolled Coil
Geographical divergence
Source: CRU
US$/t c&f
US MidwestGermany
150
250
350
450
550
650
750
850
1994 1995 1996 1997 1998 1999 2000 2001 2002 2003 2004
Far East

43
Long Product Prices - Wire Rod
Geographical divergence
Source: CRU
US$/t c&f
150
250
350
450
550
650
750
1994 1995 1996 1997 1998 1999 2000 2001 2002 2003 2004
US MidwestGermanyFar East

44
Ispat Iscor Cash Cost Base
Cash cost breakdown
Iron ore7%
Coal : Local7%
Coal : Import7%
Scrap/DRI/Pellets6%
Other raw material4%
Alloys & coating9%
Refractories4%Transport
10%
Spares & repairs
8%
Electricity, gas & petroleum
10%
Consumables4%
Services3%
Labour15%
General6%
Total production cost base H1 2004: R6.5 billion

45
Raw Material and Energy Impact
Iscor’s cost push relatively mutedSource: World Steel Dynamics
Coking coal Coke Iron ore/sinter/pellets Pig iron Scrap DRI Energy
US Integrated plant – with coke
+$81/ton
US Integrated plant – without coke
+$135/ton
US Minimill –flat products
+$199/ton
Ispat Iscor
+$40/ton
0
50
100
150
200
250
300
350
Q1 02 Q2 04
$/to
n
0
50
100
150
200
250
300
350
Q1 02 Q2 04
$/to
n
0
50
100
150
200
250
300
350
400
Q1 02 Q2 04
$/to
n
0
50
100
150
200
250
300
350
Q3 02 Q2 04
$/to
n
Recommended