Hydrogen production by steam reforming
of biodiesel
August 2014
Gaurav Anil Nahar
Submitted in accordance with the requirements for the degree of
Doctor of Philosophy
The University of Leeds
Energy Research Institute
School of Chemical and Process Engineering

Hydrogen production by steam reforming of biodiesel
i
List of Publications
The candidate confirms that the work submitted is his/her own, except where work
which has formed part of jointly-authored publications has been included. The
contribution of the candidate and the other authors to this work has been explicitly
indicated below. The candidate confirms that appropriate credit has been given within
the thesis where reference has been made to the work of others. Chapter 3 includes
some parts from publications 1 and 3.
1. Nahar G. and V. Dupont, Hydrogen production from simple alkanes and
oxygenated hydrocarbons over ceria-zirconia supported catalyst: review.
Renewable and sustainable energy reviews, 2014. 32(0): p. 777-796.
Contribution of Authors: Gaurav Nahar wrote the paper and Valerie Dupont
provided advice and edited the paper.
2. Nahar G and V Dupont, Recent advances in hydrogen production via
autothermal reforming (ATR) process: a review of patents and research
articles. Recent patents on chemical engineering, 2014. 6(1): p. 8-42.
Contribution of Authors: Gaurav Nahar wrote the paper and Valerie Dupont
provided advice and edited the paper.
3. Nahar G and V Dupont, Hydrogen via steam reforming of liquid bio feedstock.
Biofuels, 2012.3(2): p.167-191.
Contribution of Authors: Gaurav Nahar wrote the paper and Valerie Dupont
provided advice and edited the paper.
4. Nahar G, V Dupont, M. Twigg and E Dvininov, Feasibility of hydrogen
production from steam reforming of biodiesel (FAME) feedstock on Ni-
supported catalysts- Submitted to Applied catalysis B.
Gaurav Nahar-Designed the experimental setup and performed the experiments
and wrote the paper.
Valerie Dupont- editing.

Hydrogen production by steam reforming of biodiesel
ii
Martyn Twigg- Editing and provided catalyst for the study.
Emiliana Dvininov- Editing and provided catalyst support for the study.
This copy has been supplied on the understanding that it is copyright material and that
no quotation from the thesis may be published without proper acknowledgement.
The right of Gaurav Nahar to be identified as author of this work has been asserted by
him in accordance with the Copyright, Designs and Patents Act 1988.
© 2014, The University of Leeds and Gaurav Nahar.

Hydrogen production by steam reforming of biodiesel
iii
Acknowledgement
I would like to thank all who have been directly or indirectly responsible in
completion of this work. All the people have helped and supported me in their own
way and I would like to convey my gratitude to all of them.
Firstly I would like to thank “Lord Moraya” and my Guru Dr. Ashok Marathe. This
work was completed only as a result of their guidance, direction and blessings. I
would like to express my sincere gratitude to my supervisor Dr. Valerie Dupont, for
her support guidance, advice and her valuable help and encouragement throughout the
course of this research. She was always there when I needed her and always had good
ideas and most important she had time to discuss them.
I would like to thank my friends and colleagues namely Dr. Abha Saddawi, Dr.
Nikolaos Giannakeas, Zaheer Abbas and Cheng Feng for their help, support,
encouragement and valuable discussions which were extremely helpful during the
completion of this research.
I would also like to thank Dr. Emiliana Dvininov, MEL Chemical UK for providing
the catalyst support essential in completion of this work. The help of all the technical
staff at University of Leeds, namely Edmund Woodhouse, Mathew Buckley, Simon
Lloyd, Susanne Patel, Tarsem Hunjan is greatly appreciated.
Words are very few to express my appreciation for my parents Anil and Shobha
Nahar, and my wife Sharda Nahar, in addition to my sister Pranjal Gohad for their
dedication, love, encouragement, patience, persistent confidence in me, which helped
me in the successful completion of this undertaking.

Hydrogen production by steam reforming of biodiesel
iv
Abstract
An experimental set up was designed and commissioned for the steam reforming of
biodiesel. The performance of the reactor was evaluated by varying molar
steam/carbon ratio in the feed (S/C) , temperature, residence time, catalyst and
biodiesel characteristics, at constant input of 1.50 10-5
mol of C/s. The effect of
temperature was examined in the range of 600-800°C with S/C from 2 to 3. The
weight hourly space velocity (a measure of inverse residence time in the reformer) was
varied from 3.52 to 2.85 h-1
. The experimental results were compared with their
chemical equilibrium counterparts in order to determine the efficiency of the
processes. The process outputs were measured using a micro-gas chromatograph and
material balances were performed to determine the parameters such as H2 yield,
biodiesel and steam conversions, and selectivity to carbon gases such as CO, CO2,
CH4, C2H4, C2H6, C3H6 and C3H8. An elemental carbon balance was performed taking
into account the carbon converted to C-containing gases, C deposited on the catalyst
and C present in the condensate.
Commercial Ni on alumina supported catalysts and in house prepared Ni catalysts
were used for the steam reforming evaluation. Nickel catalysts supported on two
different kinds Ce/Zr supports (Zr rich and Ce rich) were formulated in house. The Ce
rich catalyst supports were prepared by sol gel synthesis employing tamarind seed
polysaccharide as a gelling agent. The Zr support was provided by a commercial
manufacturer. The Ni was loaded on the supports by impregnation using nitrate salts.
Three kinds of biodiesels i.e. commercial, palm and in house prepared biodiesel were
used for hydrogen production. The in house made biodiesel was prepared by acid-base
transesterification of waste cooking oil obtained from a local fish and chip shop.
It was found that among the three types of biodiesels tested, commercial biodiesel
exhibited higher biodiesel and water conversion resulting in higher H2 yield. The

Hydrogen production by steam reforming of biodiesel
v
highest hydrogen yield and biodiesel conversion was found in the temperature range
of 650-700°C with S/C of 3. The optimum residence time to achieve high biodiesel
and steam conversion was 3.18 h-1
. The selectivity to the main carbon containing
gases (CO, CO2 and CH4) and to H2 was very close to its chemical equilibrium value
for all the catalysts. The commercial Ni/Al2O3 and Zr-rich Ce/Zr supported Ni
catalyst were effective for steam reforming and should lower carbon formation as
compared to the Ni supported on Ce rich Ce/Zr support. The highest YH2 of 27.8 wt%
of biodiesel, i.e. 96% of the chemical equilibrium value, was measured for the Ni/Ce-
Zr catalyst using commercial biodiesel. Biodiesel and steam conversions of 96% and
41.3% were responsible for providing such high H2 yield. The catalyst also exhibited
very high H2 selectivity (99%). Among the carbon CO2 selectivity was highest 63.6%
followed by CO which 33% and finally CH4 which was a mere 2.1%. Using the
catalyst Ni/Ce-Zr, a C balance closure within 2.5% was obtained which corresponded
to a carbon deposition of 1.25% of the carbon feed.
H2 production using autothermal reforming was attempted, i.e. where a source of
oxygen, here in the form of air, is introduced in the biodiesel/steam feed to encourage
exothermic partial oxidation reactions intended to neutralise the heat demand in the
reformer. The experimental set up designed indicated that further optimisation would
be required for this process due to large amount of carbon forming at the reactor inlet,
in addition to the carbon deposited on the catalyst surface, significantly affecting the
process efficiency. Despite this, conditions 12% close to autothermality, as reflected in
the ratio of enthalpy balance on the isothermal reactor at 650 °C to the total enthalpy
output, were obtained for the condition S/C of 2 for O2/C of 0.38 and WHSV of 3.23
h-1
on the Ni/Ca-Al catalyst, this corresponded to a YH2 that was 69.2 % of the
chemical equilibrium value.
Hydrogen production by steam reforming of biodiesel
vi
Table of Contents
Acknowledgement..........................................................................................................iii
Abstract .......................................................................................................................... iv
List of Tables................................................................................................................... x
List of Figures .............................................................................................................. xiv
List of Abbreviation .................................................................................................... xxii
Nomenclature .............................................................................................................. xxv
Formulas .................................................................................................................... xxvii
Introduction ..................................................................................................................... 1
1. Global warming and energy crises .......................................................................... 1
1.1 Effects of global warming ................................................................................ 4
1.2 Energy from fossil fuels ................................................................................. 10
1.3 Renewable and alternative energy ................................................................. 17
1.3.1 Solar energy .......................................................................................... 17
1.3.2 Wind...................................................................................................... 17
1.3.3 Tidal ...................................................................................................... 18
1.3.4 Geothermal............................................................................................ 18
1.3.5 Biomass ................................................................................................. 19
1.4 Hydrogen energy and fuel cells...................................................................... 25
1.4.1 Fuel cells ....................................................................................... 25
1.4.2 Hydrogen energy road map .......................................................... 30
1.4.3 Hydrogen properties and safety .................................................... 33
2. Use of vegetable oil as diesel fuel ......................................................................... 35
2.1 Demerits of vegetable oil as fuel .................................................................... 37
3. Biodiesel: An alternative diesel fuel ..................................................................... 41
3.1 Advantages of biodiesel ................................................................................. 44
3.1.1 Carbon monoxide emissions ................................................................. 48
3.1.2 Hydrocarbon emissions......................................................................... 49
3.1.3 Particulate Matter emissions ................................................................. 49

Hydrogen production by steam reforming of biodiesel
vii
3.1.4 Effect of biodiesel type on engine emissions........................................ 51
3.2 Hydrogen production from biodiesel ............................................................. 53
3.3 Hydrogen production processes ..................................................................... 57
3.3.1 Partial oxidation .................................................................................... 59
3.3.2 Autothermal reforming ......................................................................... 60
3.3.3 Conclusion ............................................................................................ 61
3.4 Hydrogen production catalysts ....................................................................... 63
3.4.1 Nickel catalysts ..................................................................................... 64
3.4.2 Ceria as catalyst support ....................................................................... 67
3.4.3 Bimetallic catalyst................................................................................. 70
3.5 Research Rational........................................................................................... 72
3.6 Aim and Objective ......................................................................................... 74
4. Methodology experimental methods and materials .............................................. 76
4.1 Reactor design and experimental setup building ........................................... 76
4.2 Gas chromatograph ........................................................................................ 88
4.3 Biodiesel and catalyst preparation ................................................................. 90
4.3.1 Biodiesel preparation ............................................................................ 90
4.3.2 Biodiesel characterisation ..................................................................... 92
4.3.2.1 Elemental Analysis ....................................................................... 92
4.3.2.2 Thermogravimetric analysis (TGA) ............................................. 92
4.3.2.3 Composition analysis ................................................................... 93
4.3.2.4 Acid value and free fatty acid determination ............................... 94
4.3.2.5 Bomb calorimetry ......................................................................... 94
4.3.3 Catalyst preparation .............................................................................. 95
4.3.3.1 Preparation Ni supported on Zr rich supports .............................. 97
4.3.3.2 Preparation Ni supported on Ce-rich supports ............................. 99
4.3.4 Catalyst characterisation ..................................................................... 102
4.3.4.1 Surface area analysis (BET) ....................................................... 102
4.3.4.2 X ray powder diffraction (XRD) ................................................ 108
4.3.4.3 Elemental analysis ...................................................................... 109
4.3.4.4 TGA-FTIR and TOC analysis .................................................... 109

Hydrogen production by steam reforming of biodiesel
viii
4.3.4.5 Scanning Electron Microscopy analysis (SEM) and Energy
Dispersive X-ray (EDX) ............................................................................... 110
5. Characterisation of biodiesel and catalysts ......................................................... 113
5.1 Biodiesel Characterisation ........................................................................... 113
5.2 Catalyst Characterisation ............................................................................. 117
5.2.1 Surface area analysis ........................................................................... 117
5.2.2 X-ray diffraction analysis ................................................................... 125
5.2.3 Scanning Electron Microscopy analysis (SEM) and Energy Dispersive
X-ray (EDX)....................................................................................................... 135
6. Steam reforming of biodiesel .............................................................................. 140
6.1 Reactions involved ....................................................................................... 140
6.2 Experimental procedure ............................................................................... 142
6.3 Process outputs and elemental balances ....................................................... 143
6.4 Results and discussions ................................................................................ 148
6.4.1 Thermodynamics of biodiesel steam reforming ................................. 148
6.4.2 Effect of temperature .......................................................................... 152
6.4.3 Effect of biodiesel preheating ............................................................. 159
6.4.4 Effect of catalyst ................................................................................. 160
6.4.4.1 Alumina supported catalysts ...................................................... 161
6.4.4.2 Alumina supported catalyst ........................................................ 162
6.4.4.3 Ceria-zirconia supported catalysts .............................................. 165
6.4.5 Effect of WHSV.................................................................................. 171
6.4.6 Effect of biodiesel ............................................................................... 173
6.4.7 Effect of molar S/C ratio ..................................................................... 175
6.5 Catalyst Characterisation ............................................................................. 179
6.5.1 Surface area......................................................................................... 179
6.5.2 X-ray diffraction analysis ................................................................... 182
6.5.3 TGA-FTIR and SEM analysis ............................................................ 185
6.6 Conclusion ................................................................................................... 201
7. Autothermal reforming........................................................................................ 203
7.1 Experimental procedure and reactions involved .......................................... 203

Hydrogen production by steam reforming of biodiesel
ix
7.2 Results and discussion ................................................................................. 206
7.3 Energy Balance: ........................................................................................... 211
7.4 Conclusion ................................................................................................... 215
8. Conclusion and future work ................................................................................ 216
9. References ........................................................................................................... 221
10. Appendices .......................................................................................................... 237
10.1. Appendix A: Gas chromatograph calibration .......................................... 237
10.2. Appendix B: Equilibrium calculations ................................................... 243
10.3. Appendix C: Carbon balance calculation ................................................ 247
10.4. Appendix D: Vaporiser details ................................................................ 249
10.5. Appendix E: Energy balance coefficients ............................................... 252
10.6. Appendix F: Plug flow calculations ........................................................ 254

Hydrogen production by steam reforming of biodiesel
x
List of Tables
Table 1.1 :Effects of global warming on ice melts around the world [29]. ............... 9
Table 1.2: Biomass resources categorised base on their origin [54]. ...................... 20
Table 1.3: Construction and operation summary of various fuel cells [82]. ........... 28
Table 1.4: Performance of comparison of various fuel cells [71, 83]. .................... 29
Table 1.5: Properties of H2 and some other fossil fuels [72]. ................................. 34
Table 2.1: Fatty acid composition (wt %) observed in edible, non-edible oils and
animal fat [103-105]. ..................................................................................... 39
Table 2.2: Long term and short term problems associated with use of vegetable oil
as a diesel engine fuel [95]. ............................................................................ 40
Table 3.1: EU biodiesel production from 2009-2011. Units: thousand tonnes [113].
........................................................................................................................ 43
Table 3.2: Physical properties of edible vegetable oils [105, 117, 118]. ................ 46
Table 3.3: Physical properties of non-edible vegetable oil [43, 104, 119]. ............. 47
Table 3.4: Chemical structures of common methyl esters. ..................................... 48
Table 3.5: Comparison of reforming technologies [176]. ....................................... 62
Table 5.1: Gas chromatograph composition of three different biodiesels. ........... 114
Table 5.2: Elemental and proximate analysis of 5 biodiesel samples. .................. 115
Table 5.3: Comparison of calculated and experimental GCV of commercial and in
house prepared biodiesel. ............................................................................. 116
Table 5.4: Free fatty acid and acid values of commercial and in house prepared
biodiesel. ...................................................................................................... 117
Table 5.5: Surface area of fresh commercial and Ce-Zr catalysts. ........................ 118
Hydrogen production by steam reforming of biodiesel
xi
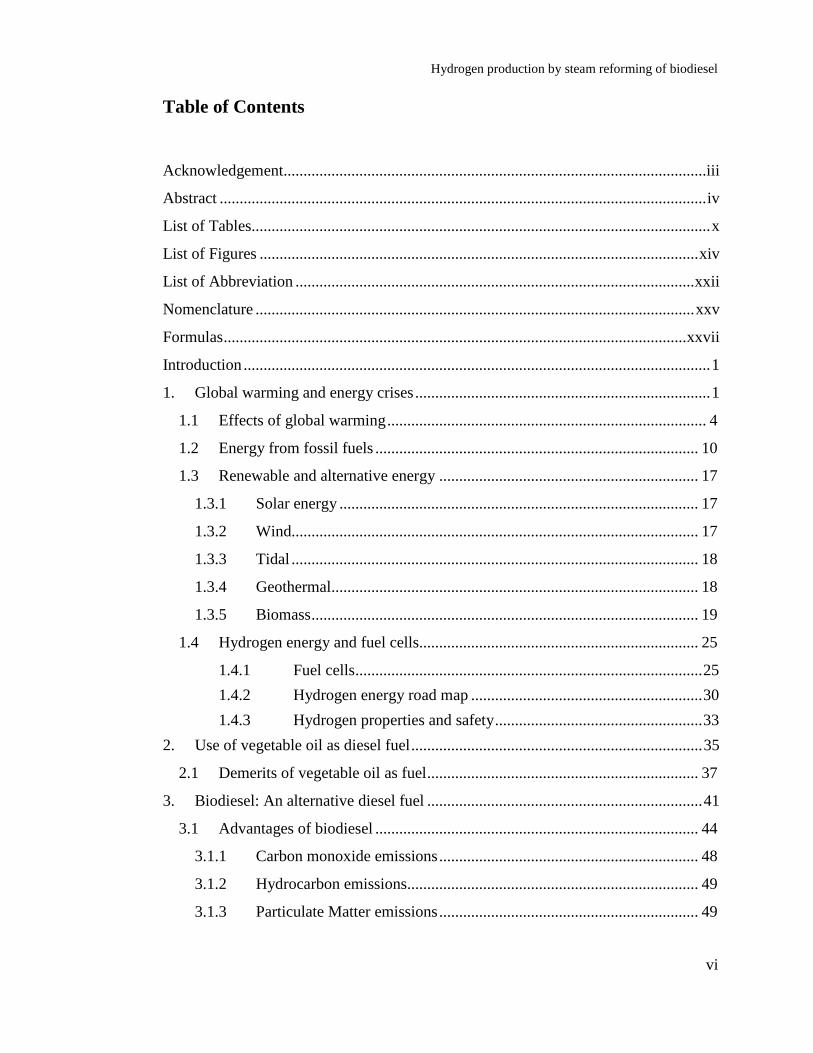
Table 5.6: Surface area of fresh Ce-Zr-3/1 supports prepared by sol gel synthesis
and catalyst prepared by impregnation method using Ni salts. ................... 123
Table 5.7: Rietveld refinement results of the catalysts prepared using in house
calcined Ce-Zr support. ................................................................................ 128
Table 5.8: Rietveld refinement results of the catalysts prepared using pre calcined
Ce-Zr support. .............................................................................................. 128
Table 5.9: Comparison of crystallite sizes obtained using wet and dry impregnation
methods employing in house calcined Ce-Zr support. ................................. 129
Table 5.10: Crystallite sizes of NiO catalysts prepared using wet impregnation of
the pre calcined Ce-Zr support. .................................................................... 129
Table 5.11: Properties of Ce-Zr- 3/1 and Ce-Al-3/1 mix oxides. .......................... 133
Table 6.1: Molar carbon balance of CSR of commercial biodiesel using Ni/Al
catalyst at S/C of 3 at WHSV of 3.52h-1
and 170°C as water vaporiser
temperature. The balance based on total input mol of C (=1.08 ×10⁻¹
) over
duration of experiment (7200 s) minus mol C converted to gases, volatiles in
the condensate and deposited on catalyst. .................................................... 158
Table 6.2: Effect of biodiesel preheating temperatures on CSR of biodiesel using
Ni/Al catalyst at 650 °C, WHSV of 3.52 h-1
and S/C of 3. Water vaporiser
was set to 170 °C. ........................................................................................ 159
Table 6.3: Molar carbon balance of CSR of commercial biodiesel using alumina
and Ce-Zr supported catalysts at S/C of 3 at WHSV of 3.18 h-1
. The biodiesel
and water vaporiser were set to 190 and 170 °C. The balance is based on total
input mol of C (=1.08 ×10⁻¹
) over duration of experiment (7200 s) minus mol
C converted to gases, volatiles in the condensate and deposited on catalyst.
Superscript (a) - sand addition. .................................................................... 170
Table 6.4: Molar carbon balance of CSR experiments using Ni/Ca-Al catalyst. The
biodiesel and water vaporiser were set to 190 and 170 °C. The balance is
based on total input mol of C (=1.08 ×10⁻¹
) over duration of experiment
(7200 s) minus mol C converted to gases, volatiles in the condensate and
deposited on catalyst. ................................................................................... 178

Hydrogen production by steam reforming of biodiesel
xii
Table 6.5: The BET results of used Al2O3 supported catalysts used in CSR of
biodiesel at S/C of 3. The water vaporiser temperature for these experiments
was set to 170°C. ......................................................................................... 179
Table 6.6: Surface area results of Ce-Zr supported catalysts used in CSR of
commercial biodiesel at S/C of 3 at 650 °C. The biodiesel and water
vaporiser temperature for these experiments was set to 190 and 170 °C. ... 181
Table 6.7: Rietveld refinement results of the used Al2O3 and Ce-Zr (pre calcined)
supported catalysts. ...................................................................................... 184
Table 7.1: Molar carbon balance of ATR of commercial biodiesel using Ni/Ca-Al
catalyst. The biodiesel and water vaporiser were set to 190 and 170°C. The
balance is based on total input mol of C (=1.08 ×10⁻¹
) over duration of
experiment (7200 s) minus mol C converted to gases, volatiles in the
condensate, deposited on catalyst and carbon formed in the reactor. .......... 211
Table 7.2: Enthalpies of inlet reactants, calculated at isothermal conditions of 650
°C and 1 atm. In the Table 3-3.23-0.38 represents the experimental
conditions. The first value represents S/C, the second value shows the WHSV
(h-1
) and the last value is O2/C. The enthalpy calculation was performed for
duration of 7200 s. ....................................................................................... 212
Table 7.3: Enthalpies of outlet products, calculated at isothermal conditions of 650
°C and 1 atm. In the Table 3-3.23-0.38 represents the experimental
conditions. The first value represents S/C, the second value shows the WHSV
(h-1
) and the last value is O2/C. The enthalpy calculation was performed for
duration of 7200 s. ....................................................................................... 213
Table 10.1: Inlet molar composition used for equilibrium calculations for SR of
commercial biodiesel at S/C of 3 and WHSV of 3.18 h
-1. ........................... 243
Table 10.2: Outlet molar composition used for equilibrium calculations for SR of
commercial biodiesel at S/C of 3 and WHSV of 3.18 h
-1. ........................... 244
Table 10.3: Equilibrium mass balance calculations of SR of commercial biodiesel
at S/C 3 and WHSV of 3.18 h-1
.................................................................... 245
Table 10.4: Flowrates used for vaporizer design. ................................................. 250
Table 10.5: Specific heat constants for water and enthalpy calculation. .............. 250

Hydrogen production by steam reforming of biodiesel
xiii
Table 10.6: Specific heat constants for steam and enthalpy calculation. .............. 250
Table 10.7: Enthalpy calculation for phase change. ............................................. 251
Table 10.8: Area and length calculation for the vaporizer. ................................... 251
Table 10.9: NASA coefficients for reactants used in energy balance calculations.
...................................................................................................................... 252
Table 10.10: NASA coefficients for products used in energy balance calculations.
...................................................................................................................... 253

Hydrogen production by steam reforming of biodiesel
xiv
List of Figures
Figure 1.1: CO2 emissions and temperature changes in last 1000 years [4]. ............. 2
Figure 1.2: Worldwide CO2 emissions, 2011 [8]. ................................................... 3
Figure 1.3: Carbon dioxide emissions prediction for 2035 [10]. .............................. 4
Figure 1.4: Effects of global warming [17]. .............................................................. 6
Figure 1.5: Global energy scenario[33]. .................................................................. 11
Figure 1.6: Dry natural gas consumption worldwide in 2012. ................................ 13
Figure 1.7: Predicted world oil prices in dollars per barrel [39]. ............................ 15
Figure 1.8: LCOE and weighted averages for renewable generation technologies,
2012 [62]. ....................................................................................................... 22
Figure 1.9: Schematic representation of a polymer electrolyte membrane fuel cell
[75]. ................................................................................................................ 26
Figure 1.10: European H2 energy road map [85]. ................................................... 32
Figure 2.1: Molecular structure of triglyceride molecule. ....................................... 35
Figure 3.1: Global biodiesel projection by 2020 [57]. ............................................ 44
Figure 3.2: Schematic illustration of the chemo- or bio-catalyzed synthesis of
biodiesel by methanolysis of triolein (glyceryl trioleate). ............................. 53
Figure 3.3: Schematic of the SMR process [158]. .................................................. 59
Figure 3.4: Schematics synthesis gas production over Ni/Ce-ZrO2 catalyst. .......... 70
Figure 4.1: Schematic of vaporiser assembly. ......................................................... 77
Figure 4.2: Schematic of up flow reactor with reactor at the side. In the Figure the
first vapouriser on the left hand side was used for biodiesel. ........................ 79
Figure 4.3: Schematic of up flow reactor inlet. ....................................................... 79
Figure 4.4: Schematic of the copper coil used for N2 preheating. ........................... 80

Hydrogen production by steam reforming of biodiesel
xv
Figure 4.5: Modified reactor setup with up flow reactor at the top. In the Figure the
first Vapouriser on the left hand side was used for biodiesel. ....................... 82
Figure 4.6: Schematic of valve assembly used in the modified reactor. ................. 83
Figure 4.7: Process and instrumentation diagram of the down flow experimental set
up. In the figure the green lines represents signal connections and the black
are the processes connections. ....................................................................... 84
Figure 4.8: Schematic of un-insulated down flow reactor. ..................................... 85
Figure 4.9: Arrangement of mass flow controllers and schematic of the controller
box.................................................................................................................. 86
Figure 4.10: Condenser and gas drying schematic connected to the micro gas
chromatograph. .............................................................................................. 87
Figure 4.11: Insulated vaporisers and heating tape arrangement. ........................... 88
Figure 4.12: Micro gas chromatograph used for gas analysis. ................................ 89
Figure 4.13: Acid- base catalysed transesterification set up. .................................. 91
Figure 4.14: Parr instruments bomb calorimeter .................................................... 95
Figure 4.15: Commercial NiO/Ca-Al (a) and NiO/Al (b) catalysts. ....................... 96
Figure 4.16: Ce-Zr support supplied by MEL chemicals, UK. ............................... 97
Figure 4.17: Nickel catalysts (NiO/Ce-Zr (a), NiO-K2O/Ce-Zr (b) and NiO-
SnO/Ce-Zr (c)) prepared by wet impregnation of pre calcined Ce-Zr support.
........................................................................................................................ 99
Figure 4.18: Viscous gel obtained during sol gel synthesis of Ce-Zr (3/1) support.
...................................................................................................................... 101
Figure 4.19: IUPAC classification of gas physical adsorption isotherms [233]. .. 104
Figure 4.20: Quanta-chrome Instruments NOVA 2200e Surface Area and Pore Size
Analyser ....................................................................................................... 107
Figure 4.21: Hitachi SU8230 cold finger SEM. .................................................... 111
Figure 4.22: SEM sample stubs. ............................................................................ 112

Hydrogen production by steam reforming of biodiesel
xvi
Figure 4.23: Ozone decontaminator for Hitachi SU8230 SEM. ........................... 112
Figure 5.1: TGA analysis of the biodiesel samples. .............................................. 116
Figure 5.2: N2 adsorption-desorption isotherms of NiO/Ce-Zr catalyst prepared by
wet impregnation method using in-house calcined support. ........................ 119
Figure 5.3: N2 adsorption-desorption isotherms of NiO/Ce-Zr catalyst prepared by
dry impregnation method using in-house calcined support. ........................ 120
Figure 5.4: N2 adsorption-desorption isotherms of NiO/Ce-Zr catalyst prepared by
wet impregnation method using pre calcined Ce-Zr support. ...................... 120
Figure 5.5: Pore-size distribution of NiO/Ce-Zr catalysts prepared using wet
impregnation of in house calcined Ce-Zr support........................................ 121
Figure 5.6: Pore-size distribution of NiO/Ce-Zr catalysts prepared using wet
impregnation of pre calcined Ce-Zr support. ............................................... 122
Figure 5.7: N2 adsorption-desorption isotherms of NiO/Ce-Al catalyst prepared by
wet impregnation method using pre calcined support. ................................ 124
Figure 5.8: Pore-size distribution of NiO/Ce-Al catalyst prepared using wet
impregnation of Ce-Al support prepared using sol gel synthesis. ............... 124
Figure 5.9:Pore-size distribution of Ni/Ce-Zr-3/1 catalyst, prepared by wet
impregnation of Ce-Zr -3/1, support obtained using sol gel synthesis. ....... 125
Figure 5.10: X-ray diffraction of NiO/Ce-Zr catalysts prepared using wet
impregnation method using in house calcined Ce-Zr support. In the Figure (+)
represents the Ce-Zr and (o) represents NiO. .............................................. 125
Figure 5.11:X-ray diffraction of NiO/Ce-Zr catalysts prepared using dry
impregnation method using in house calcined Ce-Zr support. In the figure (+)
represents the Ce-Zr and (o) represents NiO. .............................................. 126
Figure 5.12: X-ray diffraction of NiO/Ce-Zr catalysts prepared using wet
impregnation method employing pre-calcined Ce-Zr support. In the Figure
(+) represents the Ce-Zr and (o) represents NiO. ........................................ 127
Figure 5.13: X-ray diffraction of NiO/Al and NiO-K2O/Al catalysts. In the figure
(*) represents the Al2O3 support and (o) represents NiO. ............................ 131
Hydrogen production by steam reforming of biodiesel
xvii
Figure 5.14: X-ray diffraction of Ce-Zr-3/1 prepared by sol-gel synthesis
employing TSP as a gelling agent using 10 wt% alcohol and 10 wt% sugar in
the preparation. ............................................................................................ 131
Figure 5.15: X-ray diffraction of Ce-Zr-3/1 and Ce-Al-3/1 prepared by sol-gel
synthesis using 17 wt % ethanol in sol gel synthesis employing TSP and
gelling agent. ................................................................................................ 133
Figure 5.16: X-ray diffraction of NiO/Ce-Zr-3/1 prepared by sol-gel synthesis using
17 wt% ethanol in sol gel synthesis employing TSP and gelling agent. In the
Figure (+) represents the Ce-Zr-3/1 support and (o) represents NiO. ......... 134
Figure 5.17: X-ray diffraction pattern of NiO/Ca-Al catalyst. In the Figure (+)
represents the Ce-Zr-3/1 support and (o) represents NiO. In the Figure (×) Ca-
Al, (*) represents Al2O3 and (o) represents NiO.......................................... 134
Figure 5.18: A SEM image of NIO/Ce-Zr prepared using wet impregnation of pre
calcined Ce-Zr support with 50 K mag. ....................................................... 135
Figure 5.19 A SEM image of NiO-SnO/Ce-Zr prepared using wet impregnation of
...................................................................................................................... 136
Figure 5.20 A SEM image of NiO-K2O/Ce-Zr prepared using wet impregnation of
pre calcined Ce-Zr support with 50 K mag. ................................................. 136
Figure 5.21: Elemental dispersion of the NiO/Ce-Zr prepared by wet impregnation
of the precalcined Ce-Zr support. ................................................................ 137
Figure 5.22: Elemental dispersion of the NiO-SnO /Ce-Zr prepared by wet
impregnation of the precalcined Ce-Zr support. .......................................... 138
Figure 5.23: Elemental dispersion of the NiO-K2O/Ce-Zr prepared by wet
impregnation of the precalcined Ce-Zr support ........................................... 139
Figure 6.1: Effect of temperature on equilibrium H2 yield (YH2) and CH4 (SC-CH4)
selectivity in steam reforming of commercial biodiesel at different S/C ratios,
and 1 atm. ..................................................................................................... 149
Figure 6.2: Effect of temperature on equilibrium selectivity to CO (SC-CO) and CO2
(SC-CO2) in SR of commercial biodiesel at different S/C ratios, and 1atm... 150
Figure 6.3: Effect of temperature on equilibrium selectivity to CH4 ((SC-CH4) in SR
of commercial biodiesel at different S/C ratios, and 1atm. .......................... 151
Hydrogen production by steam reforming of biodiesel
xviii
Figure 6.4: Effect of temperature on CSR of commercial biodiesel at S/C of 3 and
WHSV of 3.52 h-1
using 365 and 170°C biodiesel and water vaporiser
temperatures. ................................................................................................ 153
Figure 6.5: Effect of temperature on H2 yield (YH2) and selectivity (SH-H2) in CSR
of commercial biodiesel using same conditions as Figure 6.4 ..................... 154
Figure 6.6: Effect of temperature of selectivities on carbon products (SC) in CSR of
commercial biodiesel using same conditions as Figure 6.4. ........................ 155
Figure 6.7: Biodiesel (Xbiod) and steam (XH2O ) conversions during CSR using same
conditions as Figure 6.4. .............................................................................. 157
Figure 6.8: Performance of various alumina supported Ni catalysts in CSR of
commercial biodiesel at 650 °C and constant S/C of 3 and WHSV of 3.18 h-1
with biodiesel and water vaporisers set to 190 and 170 °C. ........................ 162
Figure 6.9: Yield of H2 (YH2) and selectivity (SH-H2) for H2 with selectivities of
carbon gases in CSR of commercial biodiesel over alumina supported
catalysts, at same conditions as Figure 6.8. ................................................. 165
Figure 6.10: Performance of various ceria based Ni catalysts in CSR of commercial
biodiesel at 650 °C and constant S/C of 3 and WHSV of 3.18 h-1
with
biodiesel and water vaporisers were set to 190 and 170 °C. In this Figure, 1.5
and 1g of catalysts were mixed with appropriate amount of quartz sand to
make 2.0506 g catalyst bed. ......................................................................... 168
Figure 6.11: Yield (YH2) and selectivity (SH-H2) to H 2 with selectivity to carbon
gases in CSR of commercial biodiesel over Ce-Zr supported catalysts, at
same conditions as Figure 6.10. ................................................................... 169
Figure 6.12: Effect of WHSV on the performance of Ni/Ca-Al catalyst in CSR of
commercial biodiesel at 650 °C and S/C of 3. In this investigation biodiesel
and water vaporisers were set to 190 and 170 °C respectively. ................... 171
Figure 6.13: Effect of WHSV on yield (YH2) and selectivity (SH-H2) to H2 with
selectivities of carbon gases in CSR of commercial biodiesel over Ni/Ca-Al
catalyst, at 650 °C and constant S/C of 3. .................................................... 172
Figure 6.14: Effect of biodiesel origin on CSR process using Ni/Ca-Al catalyst at
650 °C and constant S/C of 3 with constant WHSV of 3.18 h-1
. The biodiesel
and water vaporisers were set to 190 and 170 °C. In this Figure 1.5 and 2

Hydrogen production by steam reforming of biodiesel
xix
wt% represents the amount of KOH catalyst used for biodiesel preparation.
...................................................................................................................... 173
Figure 6.15: Effect of biodiesel origin on yield (YH2) and selectivity (SH-H2) to H2
with selectivity to carbon gases (SC) in CSR process over Ni/Ca-Al catalyst,
at same conditions as Figure 6.14. ............................................................... 175
Figure 6.16: Effect of molar S/C on CSR process using Ni/Ca-Al catalyst at 650 °C
and constant WHSV of 3.18 h-1
. The biodiesel and water vaporisers were set
to 190 and 170 °C. ....................................................................................... 176
Figure 6.17: Effect of S/C on yield (YH2) and selectivity (SH-H2) to H2 with
selectivity to carbon gases (SC) in CSR process over Ni/Ca-Al catalyst, at
same conditions as Figure 6.16. ................................................................... 177
Figure 6.18: N2 adsorption-desorption isotherms of used Ni catalysts supported on
the pre calcined Ce-Zr support. The performance of the catalyst was
examined at 650 °C and S/C of 3 with WHSV of 3.18 h-1
. The vaporiser
temperatures for biodiesel and water were set to 190 and 170 °C. .............. 181
Figure 6.19: Pore-size distribution of used Ni/Ce-Zr catalysts prepared with wet
impregnation of pre calcined Ce-Zr support. The performance of the catalyst
was examined at 650 °C and S/C of 3 with WHSV of 3.18 h-1
. The vaporiser
temperatures for biodiesel and water were set to 190 and 170 °C respectively.
...................................................................................................................... 182
Figure 6.20: X ray diffraction patterns of used Ni catalysts supported on Ce -Zr
(pre-calcined) supports. Ni peaks are marked with (×) and Ce-Zr supports are
marked by (+). .............................................................................................. 183
Figure 6.21: X ray diffraction patterns of used Ni/Al and Ni-K/Al catalysts. Ni
peaks are marked with (×) and Al2O3 supports are marked by (*). .............. 184
Figure 6.22: The TPO of Ni/Al catalyst examined in CSR of commercial biodiesel
using constant S/C of 3 and WHSV of 3.52 h-1
in the temperature range of
600-800°C. The vaporiser temperature of biodiesel and water were set to 365
and 170°C respectively. ............................................................................... 186
Figure 6.23: The TPO of pre calcined Ce-Zr catalysts examined in CSR of
commercial biodiesel at constant S/C of 3 and WHSV of 3.18 h-1
with 650
°C. The vaporiser temperature of biodiesel and water were set to 190 and 170
°C respectively. ............................................................................................ 187
Hydrogen production by steam reforming of biodiesel
xx
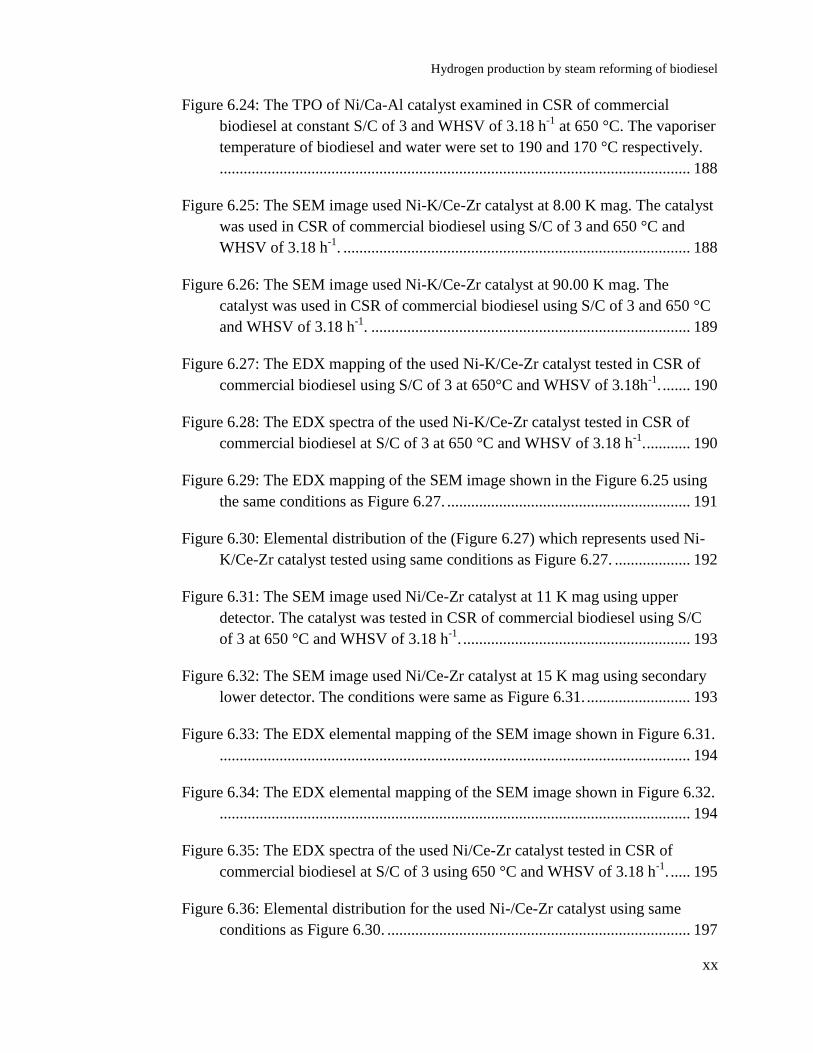
Figure 6.24: The TPO of Ni/Ca-Al catalyst examined in CSR of commercial
biodiesel at constant S/C of 3 and WHSV of 3.18 h-1
at 650 °C. The vaporiser
temperature of biodiesel and water were set to 190 and 170 °C respectively.
...................................................................................................................... 188
Figure 6.25: The SEM image used Ni-K/Ce-Zr catalyst at 8.00 K mag. The catalyst
was used in CSR of commercial biodiesel using S/C of 3 and 650 °C and
WHSV of 3.18 h-1
. ....................................................................................... 188
Figure 6.26: The SEM image used Ni-K/Ce-Zr catalyst at 90.00 K mag. The
catalyst was used in CSR of commercial biodiesel using S/C of 3 and 650 °C
and WHSV of 3.18 h-1
. ................................................................................ 189
Figure 6.27: The EDX mapping of the used Ni-K/Ce-Zr catalyst tested in CSR of
commercial biodiesel using S/C of 3 at 650°C and WHSV of 3.18h-1
. ....... 190
Figure 6.28: The EDX spectra of the used Ni-K/Ce-Zr catalyst tested in CSR of
commercial biodiesel at S/C of 3 at 650 °C and WHSV of 3.18 h-1
. ........... 190
Figure 6.29: The EDX mapping of the SEM image shown in the Figure 6.25 using
the same conditions as Figure 6.27. ............................................................. 191
Figure 6.30: Elemental distribution of the (Figure 6.27) which represents used Ni-
K/Ce-Zr catalyst tested using same conditions as Figure 6.27. ................... 192
Figure 6.31: The SEM image used Ni/Ce-Zr catalyst at 11 K mag using upper
detector. The catalyst was tested in CSR of commercial biodiesel using S/C
of 3 at 650 °C and WHSV of 3.18 h-1
. ......................................................... 193
Figure 6.32: The SEM image used Ni/Ce-Zr catalyst at 15 K mag using secondary
lower detector. The conditions were same as Figure 6.31. .......................... 193
Figure 6.33: The EDX elemental mapping of the SEM image shown in Figure 6.31.
...................................................................................................................... 194
Figure 6.34: The EDX elemental mapping of the SEM image shown in Figure 6.32.
...................................................................................................................... 194
Figure 6.35: The EDX spectra of the used Ni/Ce-Zr catalyst tested in CSR of
commercial biodiesel at S/C of 3 using 650 °C and WHSV of 3.18 h-1
. ..... 195
Figure 6.36: Elemental distribution for the used Ni-/Ce-Zr catalyst using same
conditions as Figure 6.30. ............................................................................ 197

Hydrogen production by steam reforming of biodiesel
xxi
Figure 6.37: The SEM image of used Ni-Sn/Ce-Zr catalyst at 11 K mag. The
catalyst was tested for CSR of commercial biodiesel using S/C of 3 at 650 °C
and WHSV of 3.18 h-1
. ................................................................................ 198
Figure 6.38: The EDX elemental mapping of the SEM image shown in Figure 6.37.
...................................................................................................................... 198
Figure 6.39: Elemental distribution for the used Ni-Sn/Ce-Zr catalyst using same
conditions as Figure 6.38. ............................................................................ 199
Figure 6.40: Elemental distribution for the used Ni-Sn/Ce-Zr catalyst using same
conditions as Figure 6.37. In the figure (A) is elemental mapping of the
catalyst and (B) is the Ni mapping for the catalyst. ..................................... 200
Figure 6.41: The EDX spectra of the used Ni-Sn/Ce-Zr catalyst tested in CSR of
commercial biodiesel using S/C of 3 at 650 °C and WHSV of 3.18 h-1
...... 201
Figure 7.1: Char formed in the reactor inlet during ATR experiments. ................ 206
Figure 7.2: Performance Ni/Ca-Al catalyst in ATR of commercial biodiesel at
650°C with biodiesel and water vaporisers set to 190 and 170°C respectively.
In the Figure 3-3.23-0.38 represents the experimental conditions. The first
value represents S/C, the second value shows the WHSV (h-1
) and the last
value is O2/C. ............................................................................................... 207
Figure 7.3: Yield (YH2) and selectivity for H2 (SH-H2) with selectivity’s of carbon
gases (Sc) in ATR of commercial biodiesel over Ni/Ca-Al catalyst at 650°C
with biodiesel and water vaporisers set to 190 and 170°C respectively. In the
Figure 3-3.23-0.38 represents the experimental conditions. The first value
represents S/C, the second value shows the WHSV (h-1
) and the last value is
O2/C.............................................................................................................. 208
Figure 7.4: Reaction contribution in ATR of commercial biodiesel over Ni/Ca-Al
catalyst at 650°C with biodiesel and water vaporisers set to 190 and 170°C
respectively. In the Figure 3-3.23-0.38 represents the experimental
conditions. The first value represents S/C, the second value shows the WHSV
(h-1
) and the last value is O2/C. .................................................................... 210
Figure 7.5: Enthalpy balance of the ATR reforming experiments. ...................... 215
Figure 10.1: Channel 1, N2 calibration for the GC. ............................................... 237

Hydrogen production by steam reforming of biodiesel
xxii
Figure 10.2: Channel 1, H2 calibration for the GC. ............................................... 238
Figure 10.3: Channel 1, CO calibration for the GC. ............................................. 238
Figure 10.4: Channel 1, CO2 calibration for the GC. ............................................ 239
Figure 10.5: Channel 2, O2 calibration for the GC. ............................................... 239
Figure 10.6 Channel 2, CH4 calibration for the GC. ............................................. 240
Figure 10.7 Channel 2, C2H4 calibration for the GC. ............................................ 240
Figure 10.8: Channel 2, C2H6 calibration for the GC. ........................................... 241
Figure 10.9: Channel 2, C3H6 calibration for the GC. ........................................... 241
Figure 10.10: Channel 2, C3H8 calibration for the GC. ......................................... 242
Figure 10.11: Engineering drawing of the vaporisers. .......................................... 249
Figure 10.12: Schematic of the reactor used in the experiments. .......................... 254
List of Abbreviation
ACR- autothermal Cyclic Reforming
AFC- alkaline fuel cell
ASTM- American Society for Testing and Materials
ATR- autothermal reforming
BET- Brunauer-Emmett-Teller
BJH- Barrett, Joyner and Halenda
BP-British Petroleum
BoP- Balance of plant
CCS- carbon capture and storage
CHP- combined heat and power
CLR- chemical looping steam reforming

Hydrogen production by steam reforming of biodiesel
xxiii
CNG- Compressed natural gas
COD-Chemical oxygen demand
COX- Complete oxidation
CSR -Catalytic steam reforming
DME- Dimethyl Ether
EDX- Energy Dispersive X-ray
EEA- European Environmental Agency
EIA- Energy Information Administration
EU- European Union
FAME- fatty acid methyl esters
FCC- fluid catalytic cracking
FFA- Free fatty acids
GC- Gas chromatograph
GCV- Gross calorific value
GHSV- Gas hourly space velocity
LCOE- Levelised cost of electricity
LHSV- Liquid hourly space velocity
IPCC- Intergovernmental Panel on Climate Control
IUPAC- International union of pure and applied chemistry
OECD- Organisation for Economic Co-operation and Development
OPEC- Organization of the Petroleum Exporting Countries
OSC- Oxygen storage capacity
MCFC- Molten carbonate fuel cell
MSW-Municipal solid waste
PAFC- Phosphoric acid fuel cell
PEMFC- Proton exchange membrane fuel cell
PM- Particulate matter

Hydrogen production by steam reforming of biodiesel
xxiv
POX- Partial oxidation
P/P0- relative pressure
PSA- Pressure swing adsorber
R&D- Research and development
S/C- Steam-to-carbon
SEM- Scanning Electron Microscopy analysis
SEM-EDX- Scanning Electron Microscopy- Energy dispersive X-ray
SESR- Sorption enhanced steam reforming
SMR- Steam methane reforming
SOFC- Solid oxide fuel cells
SR- Steam reforming
SRA- Steam reforming of acetic acid
SRE- Steam reforming of ethanol
SSA- Specific surface area
TAG- Triacylglycerol
TC- Temperature controller
TCD- Thermal conductivity detectors
TGA-Thermogravimetric analysis
TGA-FTIR- thermo gravimetric- Fourier transforms infra red spectroscopy
TOC-Total organic carbon
TPO- Temperature programmed oxidation
TSP- Tamarind seed polysaccharide
TWC- Three-way catalysis
VOC- Volatile organic carbon
WBFR- Water-biodiesel molar feed ratio
WGS- Water gas shift reaction
WHSV- Weighted hourly space velocities

Hydrogen production by steam reforming of biodiesel
xxv
XRD- X ray powder diffraction
Nomenclature
Symbol Full form Unit
A Area occupied by an absorbed
gas molecule
Β Full width at half maximum
Bnl Billion litres l
C Concentration mol/l
CnHmOk
Elemental formula for
oxygenated hydrocarbons
(biodiesel) where n, m, k are
molar number of C,H and O in
the compound
dc Diameter of particles nm
dn/dt Rate of accumulation of a
species
dnc/dt
Accumulation of moles of
carbon element over the dt
period of time
F Form factor depending on the
meniscus
K Dimensionless shape factor
(typical values about 0.9)
LHVH2 Lower heating values of H2 kJ/mol
LHVbiod Lower heating values of
biodiesel
kJ/mol
M mass g or kg
ṅ Molar flow rate mol/s
N Avogadro’s number 1/mol
ṅCOX
Molar flowrate of biodiesel
reacted using complete
oxidation reaction
mol/s
ṅPOX
Molar flowrate of biodiesel
reacted using partial oxidation
reaction
mol/s
ṅCSR Molar flowrate of biodiesel mol/s

Hydrogen production by steam reforming of biodiesel
xxvi
reacted using complete steam
reforming
ṅout, dry Dry gas molar flowrate mol/s
P Equilibrium pressures atm
Po Saturation pressures atm
R Universal gas constant m3atm/molºK
rp Radius of the pore nm
SBET BET surface area m2/g
Sc Selectivities for the carbon
containing gases %
SC-CO Selectivities of CO w.r.t
containing gases %
SH-H2 Selectivities for the H2 %
SC-i Selectivities to carbon
containing products %
SH-i Selectivities to H2 containing
products %
T Film thickness nm
V Volume cm3
V Volumetric flowrate m3/s
Vm Molar volume of adsorbate mol/cm3
W Molar mass kg/mol
X biod Biodiesel conversion %
X H2O Steam conversion %
ẏ Elemental N in biodiesel %
YH2, eff H2 yield efficiency %
YH2 H2 yield wt %
yi Mole fraction of i in the dry
gas output
Γ Surface temperature of the
adsorbate at temperature T ºC or K
Θ Angle of contact equal to 0 º
Λ Wave length of the X rays Å
ρ Density kg/m3

Hydrogen production by steam reforming of biodiesel
xxvii
Formulas
Symbol Full form
As Arsenic
B Boron
Ba Barium
Bi Bismuth
C2H5OH Ethanol
C3H8O3 Glycerol
Ca Calcium
Ce-Zr- 3/1 Zirconia doped ceria with ceria/zirconia ratio with 3:1
Ce-Zr Zirconia doped ceria
Ce-Al-3/1 Alumina doped ceria with ceria/alumina ratio with 3:1
CeO2 Cerium oxide
CH3OH Methanol
CH4 Methane
CO Carbon monoxide
CO2 Carbon dioxide
Co Cobalt
Cu Copper
Cu/Al2O3 Copper on alumina
Fe Iron
Fe/Al2O3 Iron on alumina
Ge Germanium

Hydrogen production by steam reforming of biodiesel
xxviii
H2 Hydrogen
HC Hydrocarbon
H2O Water
Hg Mercury
K Potassium
KNO3 Potassium nitrate
KWh Kilo Watt hour
Li Lithium
Mg Magnesium
MJ/kg Mega Joule/ Kilo gram
Mn Manganese
NH3 Ammonia
Ni-K/Al Potassium doped 18 wt% NiO doped with 1.67 wt% K2O
supported on Alumina.
NOx Nitrous oxide
Ni Nickel
NiO Nickel oxide
Ni/Ce-Zr 10 wt % Ni supported on pre calcined Ce-Zr mix oxide.
The support was provided by MEL Chemicals, UK
Ni-K/Ce-Zr 10 wt % Ni and 2 wt % K supported on pre calcined Ce-
Zr mix oxide. The support was provided by MEL
Chemicals, UK
Ni-Sn/Ce-Zr 10 wt % Ni and 2 wt % Sn supported on pre calcined Ce-
Zr mix oxide. The support was provided by MEL
Chemicals, UK
Ni/Ce-Zr-3/1 10wt% Ni supported on zirconium doped ceria with
Ce/Zr ratio of 3:1 prepared by sol gel method using TSP
Ni/YSZ Nickel supported on yttria stabilised zirconia.

Hydrogen production by steam reforming of biodiesel
xxix
O2 Oxygen
P Phosphorus
Pb Lead
S Sulphur
Sn Tin
SO2 Sulphur dioxide
SOx Sulphur oxide
Zn Zinc

Introduction
1. Global warming and energy crises
Greenhouse gases such as water vapour and carbon dioxide plays a very vital role in
regulating the heat emitted by Earth, in order to keep its surface warm and sustain life.
Water vapour causes about 36–70% of global warming; with CO2 9–26%; CH4 4–9%;
and ozone 3–7% [1]. The absence of GHG’s would have resulted in much colder Earth (-
6oC) and life would have been completely different. This natural phenomenon helps to
raise the temperature of Earth surface by 20oC, which would have maintained the average
surface temperature to 14oC [2]. This delicate balance has been disturbed due to human
activities, resulting in average temperature rise Earth’s climate (global warming).
Figure 1.1 shows the changes in Earth’s temperature and its relation to CO2 emissions
since last 1000 years. There is a consensus that increased land and fossil fuel usage has
resulted in warming of the world, due to increased CO2 emissions [3, 4] in the last 200
years. Global temperature are estimated to rise from 1.1 to 6.4oC over 21
st century [5] on
top of 0.6oC rise observed in the last century [3]. The increased amount of CO2 due to
anthropogenic sources is believed to be one of the main cause of global warming [6]. The
Intergovernmental Panel on Climate Control (IPCC) performed a detailed and rigorous
study on climate change and reported that global warming is, to a high degree of
certainty, caused mainly as a result of human activities after industrial revolution. Since
the industrial revolution, atmospheric concentration of CO2 is reported to have increase
by 31% as compared to the values observed prior to it [7]. Fossil fuel fired conventional
power plants used for electricity production are considered as the main source of CO2
emissions in the world. Sector wise distribution of CO2 emissions is shown in Figure 1.2.
The energy sector comprising of power plants and transportation emit 64% of the CO2
emissions. Fossil fuels such as coal and natural gas are predominantly used in these
power plants. The use of liquid fuels is mainly associated with the industrial and

Hydrogen production by steam reforming of biodiesel
2
transportation sectors. In some countries having non-uniform power generation and
distribution grids, liquid fuels are also used in small scale power generation.
Figure 1.1: CO2 emissions and temperature changes in last 1000 years [4].
The rise in carbon dioxide emissions is a result of several factors, i.e. increase in world
population, increased industrialization and global trade, increased land use and
deforestation. The increased population and industrialization of the world has caused
enormous increase in energy demand, which could be linked to rise in CO2 emissions. A
56% rise in world’s energy consumption is predicted by the Energy Information
Administration (EIA). According to the EIA, energy consumption will rise from
552×1015
kJ in 2010 to 664 and 865×1015
kJ by 2020 and 2040 respectively. There is a
wide variation in energy consumption of OECD and non OECD countries. The variation
in the energy consumption is governed by various factors such as economic and
population growth. Non OECD countries like China and India are the two fastest growing
economies for the last 2 decades growing at a rate of 7.4 and 6% in the first quarter of
2014.

Hydrogen production by steam reforming of biodiesel
3
Figure 1.2: Worldwide CO2 emissions, 2011 [8].
The increased economic and population growth in these non OECD countries has resulted
in steep rise in energy consumption. On the other hand, OECD countries such as US are
matured energy consumers as a result of slower economic growth and negligible or no
population growth.
According to the latest statistics released by British Petroleum (BP) in January 2014,
global CO2 emissions are predicted to reach 45×1012
tonnes by 2035 (Figure 1.3). In the
Figure 1.3, the dotted line represents the emission path required to restrict the global CO2
concentration to 450 ppm, which would maintain a rise of 2oC. The IEA predicts that
such rise would lead to the catastrophic 6oC increase in the atmosphere’s global
temperature. EIA’s prediction matches with BP’s and according to them the major
contributor to global CO2 rise will come from non-OECD countries, due to strong
economic growth and reliance on fossil fuels [9]. The non OECD share to CO2 emissions
is predicted to exceed OECD’s by 127% by 2040. China alone will be responsible for
one quarter of the increase in CO2 emissions (3.6×10¹²
tonnes), which would bring its
emissions to 6.7×10¹²
tonnes by 2030 [3]. Regional emissions per capita in China are
expected to rise from 3 to 10 tonnes of CO2 by end of 2035. In India the emissions per
Industry 21%
Transport 22%
Electricity and heat 42%
Residential 6%
Other 9%

Hydrogen production by steam reforming of biodiesel
4
capita are expected to increase from 1 to 3 tonnes of CO2 by end of 2035. On the other
hand per capita emissions in EU and US are expected to decrease by 2035.
Figure 1.3: Carbon dioxide emissions prediction for 2035 [10].
1.1 Effects of global warming
The increased emissions could cause catastrophic effects on life. Figure 1.4 shows the
potential effects of global warming on the environment Climate change will result in, rise
in number of very hot days and heat waves, rising sea levels, more frequent intense
precipitation events, and also increase in hurricane intensity. Developing countries will
be affected more by climate change as compared to developed countries. As climate in
many developing countries is already warm as compared to developed countries,
increased temperature would result in increased frequency of famines, floods and disease
outbreaks.
Increased flood risks by 2080 are reported to affect 80 million people, with 60 likely to
be among the poorest parts of South East Asia [3]. Considering Bangladesh, which is
situated on the junction of three big rivers of the subcontinent (Ganges, Brahmaputra and
Hydrogen production by steam reforming of biodiesel
5
Meghna); as a result of increased temperature, monsoon precipitation has increased
resulting in two catastrophic and exceptional floods during the period 1980–1999. The
1998 flood submerged 70% of the country and was reported to affect about 31 million
people in 52 out of the 64 districts. An estimated 2.4 million houses were completely or
partially destroyed [11]. The frequency of such devastating floods is predicted to increase
in the future.
In an opposite scenario, climate change will result in regional scarcity of water and
frequent occurrence of famines and droughts. Average seasonal rainfall during the period
of 1901 to 2010 over India has reduced by 10% compared to its long period average,
resulting in 17% of the years to be drought years [12]. Over 1 billion people are
predicted to be affected by fresh water poverty in West Asia and North Africa as a result
of global warming by 2030 [13].
The shortage or excess rain will have dire consequences on agriculture dependent
countries, by affecting crop yields and food prices. A 3.5°C rise in temperature with 7%
precipitation increase is predicted to result in 30-40% yield loss in India resulting in 7-
17% revenue loss, by the end of 21st century [14]. As a result of wet or dry conditions,
soil moisture content and growing seasons would be affected, reducing the productivity
of crops. Increased temperature might be beneficial for some crops but might have
adverse effects on others [15]. Plants could grow faster as a result of increased
temperature but the higher rate of maturation may alter crop rotation cycles, affecting
feasibility and profitability. Faster growth may create smaller plants, because soil may
not be able to supply water or nutrients at the required rates, thereby reducing grain,
forage, fruit, or fiber production. Similarly pollination of plants would be affected by
high temperatures altering the yield, or increasing the risk of failure [16]. The effects on
agriculture could lead to severe food shortages and price fluctuations, affecting billions
across the globe.

Hydrogen production by steam reforming of biodiesel
6
Figure 1.4: Effects of global warming [17].

Hydrogen production by steam reforming of biodiesel
7
The bulk of population is concentrated along or near coastal areas of the world. Coastal
zones account 60% of the global population with one third of cities that have over 1
million inhabitants [18]. In US, alone 8 million people live in coastal areas [19], while in
China 60% of the population reside in coastal provinces [20]. Rising sea level due to
climate change would have serious effects on the coastal areas of the world. Sea level is
predicted to rise by 20 cm to 2 m by end of 21st century [21]. The magnitude, frequency
and duration of flooding during storms will be increased as a result of rise in sea level.
Storm surge caused by high winds bring water inland during storms and hurricanes. As a
result of elevated sea level these surges can reach farther inland damaging homes and
infrastructure. Increased sea level would also submerge low lying coastal areas,
drastically affecting populations. Inland intrusion of salt water due to the rising sea level
will affect the salinity of coastal fresh water [22]. Coastal wetlands comprise of salt
marshes, mangroves and intertidal areas, which are affected by increased sea level.
Global wetlands are lost at the rate of 1% every year. These areas have number of
important functions such as flood protection, waste assimilation, nursery areas for
fisheries and nature conservation. Therefore, wetland loss will ultimately have significant
high human cost [23].
Disappearance of Earth’s ice cover is one of the outcomes of the global change in surface
temperature. The ice cover helps to reflect large part of sun’s heat back into space,
preventing overheating of the planet. Loss of ice cover will not only affect the
temperature around the world, but could result in rising sea level; causing regional
flooding, damaged ecosystems and habitats, endangering human and animal life on the
planet. Effect of climate change on ice melts around the globe is listed in the Table 1.1.
East Antarctic, West Antarctic, and Greenland ice sheets combined contain
approximately 70 m of sea-level equivalence. They have serious potential to affect global
climate by altering the ocean circulating patterns. The increased volume of water due to
the ice melts will significantly affect global sea level [24]. Large amount of fresh water
could be dumped into North Atlantic as a result of melting of arctic ice, disrupting the

Hydrogen production by steam reforming of biodiesel
8
ocean currents that enable warm Gulf stream in the north [25]. This could affect parts of
EU and eastern US.
Shrinkage of the mountain glaciers have already affected 500 million people in Northern
India, who rely on the glacial-fed Indus and Ganges rivers for irrigation and drinking.
Shrinkage and retreating of glaciers is increasing the size and number of glacial lakes
[26]. The melting of the glaciers have increased river run off, reducing the future
availability of fresh water. Counting formation, merging, and expansion of glacial lakes
to the stage of glacial outburst floods, 32 records of such events have been recorded in
Nepal, Tibet Autonomous Region of China and Bhutan [27]. These could affect other
parts of the world which rely on glacial fed rivers for the supply of fresh water.
Approximately 3344×109 tons of organic carbon is contained within the permafrost
worldwide [28]. Climate change can accelerate the degradation of the organic carbon by
permafrost thawing, resulting in substantial amount of CH4, release in the atmosphere,
which will accelerate global warming of the planet.
It can be summarised that climate change would have irreversible changes to our planet.
It would not only affect human beings but animal and plant life too. In addition to the
obvious pollution issues, current energy production and consumption patterns would have
economic and environmental repercussions.

Hydrogen production by steam reforming of biodiesel
9
Table 1.1 :Effects of global warming on ice melts around the world [29].
Name Location Measured loss
Arctic sea ice Arctic ocean
Has shrunk by 6 percent since
1978, with a 14% loss of
thicker, year-round ice. Has
thinned by 40% in less than 30
years.
Greenland ice sheet Greenland
Ice has thinned by more than a
meter a year on its southern and
eastern edges since 1993.
Columbia, Glacier
Alaska, United States
Has retreated nearly 13
kilometres since 1982. In 1999,
retreat rate increased from 25 to
35 m/day.
Tien Shan Mountains Central Asia
Twenty-two percent of glacial
ice volume has disappeared in
the past 40 years.
Antarctic Sea Ice
Southern Ocean
Ice to the west of the Antarctic
Peninsula decreased by some 20
% between 1973 and 1993, and
continues to decline.
Pine Island Glacier West Antarctica
Grounding line (where glacier
hits ocean and floats) retreated
1.2 km/y between 1992 and
1996. Ice thinned at a rate of 3.5
m/yr.
Dokriani Bamak Glacier
Himalayas, India
Retreated by 20 meters in 1998,
compared with an average
retreat of 16.5 m over the
previous 5 years.

Hydrogen production by steam reforming of biodiesel
10
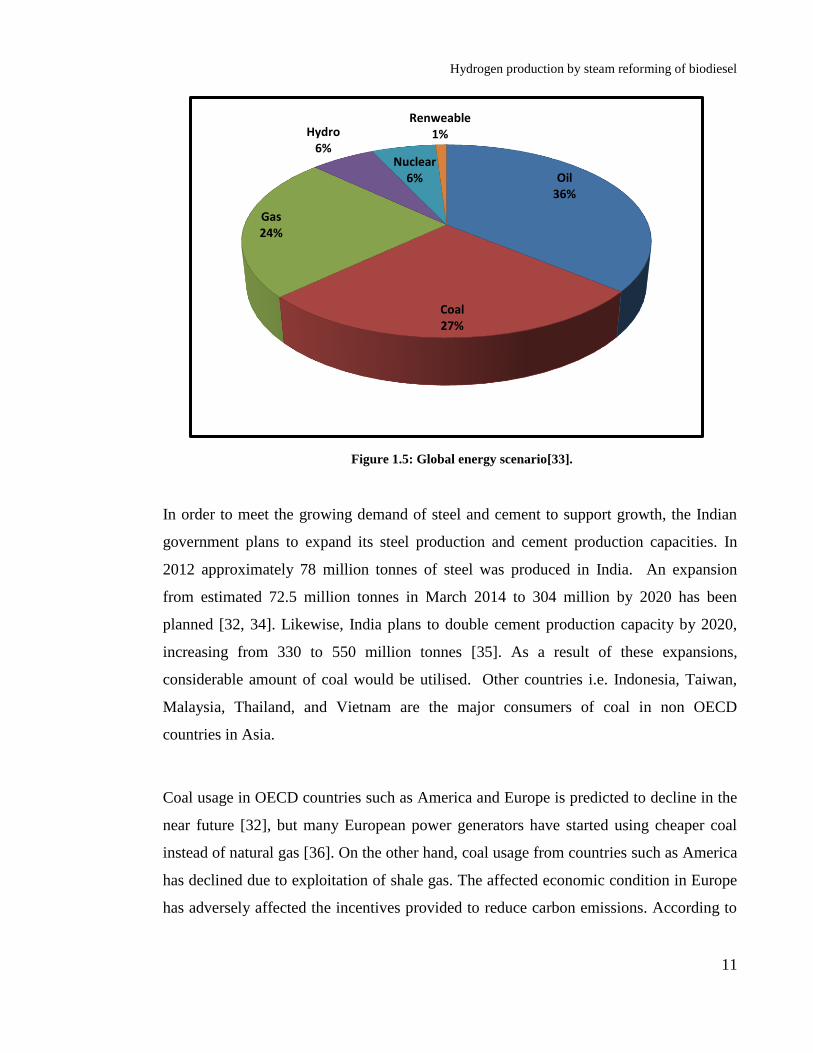
1.2 Energy from fossil fuels
The majority of world’s energy requirement is fulfilled by means of burning non-
renewable fossil fuels such as coal, oil and natural gas. Burning of these fossil fuels has
created serious environmental degradation and ecological disturbance (caused by climate
change and global warming). Global energy generation scenario is shown in Figure 1.5.
Fossil fuel resources usage comprises of 87% of the total energy consumed today, while
other sources of energy i.e. hydro, nuclear and renewable sources of energy comprise the
rest 13%.
Coal accounts for the 28% of world’s energy consumption. Coal is the primary means of
generating power in most of the countries. World coal consumption increases on an
average by 1.3 and 1.9% per year from 2010 to 2100 in OECD and non OECD countries
respectively. Since 2000 to 2010 world coal consumption has increased by 59% mainly
due to increased energy demand, by flourishing Chinese economy. In China, coal
supplies 74% of the total energy usage [30]. Based on projections, China would consume
57% of the world’s coal consumption by 2025.
Although major coal usage in China is associated with power generation, a substantial
amount is also used in the production of pig iron and crude steel. In 2012, 717 and 658
million tonnes of crude steel and pig iron were produced [31]. These amounts of steel and
pig iron manufacture would consume huge amount of the coal mined in China.
In addition to China and US, India is currently the third largest consumer of coal in the
world. The power sector was the largest consumer of coal in India. In 2010 about 68% of
the country coal produced was used in power generation, while the rest was used in
industrial sector in production of iron and steel, and cement production [32].
Hydrogen production by steam reforming of biodiesel
11
Figure 1.5: Global energy scenario[33].
In order to meet the growing demand of steel and cement to support growth, the Indian
government plans to expand its steel production and cement production capacities. In
2012 approximately 78 million tonnes of steel was produced in India. An expansion
from estimated 72.5 million tonnes in March 2014 to 304 million by 2020 has been
planned [32, 34]. Likewise, India plans to double cement production capacity by 2020,
increasing from 330 to 550 million tonnes [35]. As a result of these expansions,
considerable amount of coal would be utilised. Other countries i.e. Indonesia, Taiwan,
Malaysia, Thailand, and Vietnam are the major consumers of coal in non OECD
countries in Asia.
Coal usage in OECD countries such as America and Europe is predicted to decline in the
near future [32], but many European power generators have started using cheaper coal
instead of natural gas [36]. On the other hand, coal usage from countries such as America
has declined due to exploitation of shale gas. The affected economic condition in Europe
has adversely affected the incentives provided to reduce carbon emissions. According to
Oil 36%
Coal 27%
Gas 24%
Hydro 6%
Nuclear 6%
Renweable 1%
Hydrogen production by steam reforming of biodiesel
12
Fabio Marchetti, head of government affairs in Brussels for the Italian energy
company ENI, power plants operating on natural gas are going to be dismantled by 2015
and replaced by coal fired power plants. Other countries such as Australia, New Zealand,
Latin American and African countries will continue to increase the use of coal in the
future. The predicted enormous usage of coal in the growing economies such as China
and India will be affected by government policies, infrastructure modernisation and
development, availability and procurement of coal for power plants etc.
In addition to coal, natural gas is the second major fossil fuel used in power generation.
As compared to coal, natural gas is a lot cleaner and is preferred by power companies, as
a result of its low carbon intensity and lower capital investments for new plants. The
natural gas is the fastest rising fossil fuel in the world. The consumption of natural gas
will increase from 3.2×10¹²
in 2010 to 5.2×10¹²
cubic meters in 2040 [37]. Figure 1.7
shows the natural gas consumption in 2012 [38]. In this Figure, non OECD European
countries are counted in Eurasia and similarly OECD Asian countries are classed in Asia
and Oceania. America was the biggest consumer of natural gas, followed by Asia and
Oceania, Eurasia and Europe.
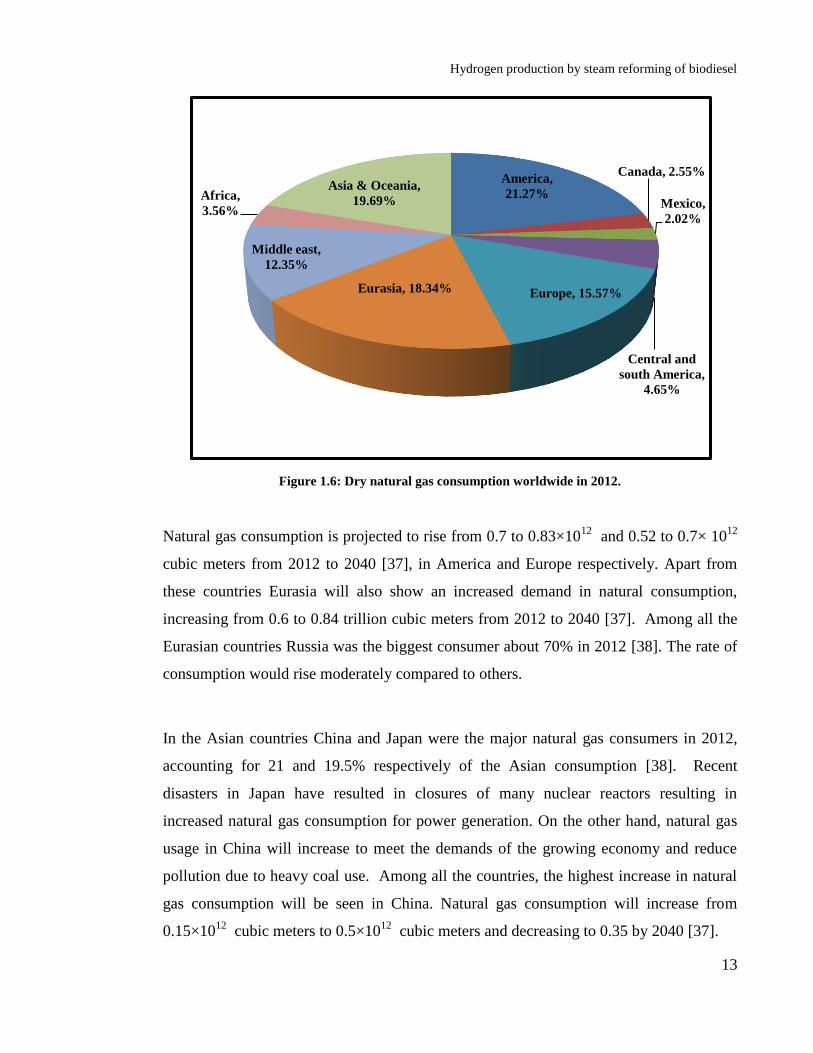
Hydrogen production by steam reforming of biodiesel
13
Figure 1.6: Dry natural gas consumption worldwide in 2012.
Natural gas consumption is projected to rise from 0.7 to 0.83×10¹²
and 0.52 to 0.7× 10¹²
cubic meters from 2012 to 2040 [37], in America and Europe respectively. Apart from
these countries Eurasia will also show an increased demand in natural consumption,
increasing from 0.6 to 0.84 trillion cubic meters from 2012 to 2040 [37]. Among all the
Eurasian countries Russia was the biggest consumer about 70% in 2012 [38]. The rate of
consumption would rise moderately compared to others.
In the Asian countries China and Japan were the major natural gas consumers in 2012,
accounting for 21 and 19.5% respectively of the Asian consumption [38]. Recent
disasters in Japan have resulted in closures of many nuclear reactors resulting in
increased natural gas consumption for power generation. On the other hand, natural gas
usage in China will increase to meet the demands of the growing economy and reduce
pollution due to heavy coal use. Among all the countries, the highest increase in natural
gas consumption will be seen in China. Natural gas consumption will increase from
0.15×10¹²
cubic meters to 0.5×10¹²
cubic meters and decreasing to 0.35 by 2040 [37].
America,
21.27%
Canada, 2.55%
Mexico,
2.02%
Central and
south America,
4.65%
Europe, 15.57% Eurasia, 18.34%
Middle east,
12.35%
Africa,
3.56%
Asia & Oceania,
19.69%

Hydrogen production by steam reforming of biodiesel
14
In Middle East, the consumption will increase by 0.3×10¹²
cubic meters from 2012 to
2040 [37, 38]. Like China, natural gas consumption in Africa will increase significantly,
increasing from 0.12 to 0.24×10¹²
cubic meters from 2012 to 2040 [37, 38]. Growth in
consumption of Central and South American countries would not be significant,
increasing from 0.15 in 2012 to 0.17 by 2040 [37, 38]. Among the central and South
American countries, Argentina, Brazil and Venezuela were the major consumers of
natural gas [38].
Natural gas and coal are the fossil fuels which are associated mainly with power
generation. The largest use of fossil fuels is in the transportation sector. America is the
largest consumer of liquid fuels in the OECD countries. The slower economic growth
along with stagnant or lower population growth would decline the use of liquid fuels in
OECD countries. The share of non OECD countries to growth of liquid fuel consumption
is largest. More than 70% growth in liquid fuel demand from 2010 to 2040 will be as a
result of non OECD countries. Non OECD countries i.e. China and India are the major
consumers of liquid fuels in the non OECD countries as result of strong economic growth
and population increase. The Chinese consumption of liquid fuels is twice that of India’s
and will supersede America’s consumption by 2035 [39]. In addition to China and India,
increase in population and per capita income growth in the Middle East will also
influence the consumption of liquid fuels. The higher consumption of liquids in the
chemical sector will play a role in the consumption of liquids [39].
EIA has developed two scenarios to predict crude oil’s price up to 2040 (Figure 1.8).
Low oil prices case was formulated assuming low oil prices and liquid fuel demand,
taking into account cheaper non OPEC liquid fuel supply. On the other hand, high price
considers higher economic world economic growth and use of less abundant and costlier
non OPEC liquid fuel supply. These cases took into account the following factors for
predicting the prices.
1. The economics of petroleum liquids supply from non-OPEC countries

Hydrogen production by steam reforming of biodiesel
15
2. OPEC investment and production decisions
3. The economics of other non-petroleum liquids supply
4. World demand for petroleum and other liquids
Figure 1.7: Predicted world oil prices in dollars per barrel [39].
As per the high oil price scenario, the price of crude oil is predicted to increase from
96$/barrel in 2013 to 237$/barrel in 2040. This can be reflected in increased consumption
by growing economies of China and India. The scarcity of oil reserves in these countries
makes them heavily reliant on oil imports from OPEC countries [40]. The Indian crude
oil consumption is estimated to double from 2012 to 2040. EIA estimates that Chinese
consumption will exhibit highest growth in demand from 2010 to 2040 (10 million
barrels/ day) [39, 41]. India would be the second largest consumer predicting a growth of
5 million barrels/day from 2010 to 2040 [40, 42]. At the current rate of oil consumption,

Hydrogen production by steam reforming of biodiesel
16
based on conservative estimates, crude oil production in non OPEC countries is estimated
to peak from 2020 and will decline after that.
It is can be summarised that fossil fuels are being consumed at much higher rates than
being produced especially crude oil. It is estimated that world crude oil reserves will
vanish at the rate of 4 billion tons a year, and at the rate of current consumption crude oil
reserves will be exhausted by 2050 [43]. Although coal reserves are predicted to be
available up to 2081 [44], usage of coal associated with power generation is a highly
polluting affair and results in high level of CO2 production. It is also a source of other
highly toxic pollutants such as Hg, trace metals and nitrogen and sulphur oxides etc.
Similarly coal production and processing has severe direct and indirect environmental
effects. These reasons have promoted reduction of coal usage for power generation in
many countries [45]. The increased natural gas production could be useful in filling the
gap but these would only provide some breathing space up till 2060 [43]. Consequently a
global energy crisis has forced the world in search of alternative energy sources.

Hydrogen production by steam reforming of biodiesel
17
1.3 Renewable and alternative energy
Energy crises and climate change has resulted in the exploration of various alternative
energy sources. Renewable energy technologies make use of various natural phenomena
to generate usable energy. Solar, wind, flowing water (hydro), plant growth (biomass),
gravitational force (tidal) and geothermal are used to produce energy. These energy
resources have a gained potential and could easily dominate the equivalent fossil energy
resources. Despite many challenges, R&D in this field has progressed in the last few
decades. Some of these resources are governed by factors such as accessibility,
intermittent nature, and regional variations giving rise to technical and economical along
with institutional challenges.
1.3.1 Solar energy
Solar energy can be applied on large scale in the countries with abundant sunshine for
most of the part of the year. Presence of cloudy skies in countries such as UK restricts
the use due to lower efficiency. It also requires large amount of land for capturing energy
and the energy produced has to be stored for future use requiring large scale
infrastructure. The cost of the cells used in the collectors is expensive. The energy
produced has to be used in the same location where generated, restricting its distribution.
1.3.2 Wind
Generation location is also an important factor in case of wind energy. The areas having
sufficient wind strength to rotate the wind turbine are less, which restrict their application
to hilly and coastal areas of any countries. Countries with large flat ground and smaller
coastline cannot make large use of wind energy. Power quality is affected by speed
fluctuations due to air movement as a result of several climatological phenomena. The

Hydrogen production by steam reforming of biodiesel
18
intermittent power generation may lead to imbalance power demand, leading to adverse
voltage variations [46]. Wind mill may also adversely affect wildlife and are known to be
quite noisy, which again impairs their installations near residential areas.
1.3.3 Tidal
They can only be located in the countries with large coastline and availability of suitable
generating sites. Like wind energy, tidal power generation will be affected by
climatological factors such as high and low tide. Power could be generated only during
high tide which accounts only for certain part of the day. This means, these forms of
energy have to be associated with some form of energy storage installation for successful
applications. Tidal energy output is patchy and variable, increase in variable generation
increases the cyclic operation of the tidal generators, which would increase in wear and
tear on the machines shortening of the life span of the units [47]. Substantial upfront
investment is required for the construction of tidal energy infrastructure [48]. Recent
research has shown that harnessing tidal energy may also affect residual and transitional
oceanic currents over vast distances, indirectly affecting sediment transport rates,
pollutant dispersion and nutrient concentrations, thus affecting marine environment [49].
1.3.4 Geothermal
Like solar, tidal and wind energy, geothermal energy is also restricted on the basis of site
location. As this form of energy is not widely used, it lacks the availability of
infrastructure and staff for the installation of these plants. It also has high initial cost of
installation affecting the cost of power produced. The location of the sites can also affect
the construction and exploitation of the energy source. Toxic and harmful gases can be
released from geothermal sites. Lastly energy generated cannot be transported due to the
location of the sites.

Hydrogen production by steam reforming of biodiesel
19
1.3.5 Biomass
Biomass as a renewable energy source, is derived from biological material obtained from
living organism i.e. plants or plant derived materials. The European Commission
specified that there are large varieties of biomass available such as by-products,
agricultural, forestry residue, related industries, as well as the non-fossil, biodegradable
parts of industry and municipal solid waste (MSW) [50]. Biomass and biomass energy
systems are suggested to become one of the important contributors to sustainable energy
systems and sustainable development in developed as well as developing countries in
near future [51]. Table 1.2 shows biomass resources categorised based on their origin.
Biomass can be the most suitable form of renewable energy source among the various
renewable sources due to its various advantages. Biomass can be produced abundantly in
most part of the world. Continuous supply can be assured based on constant production.
It is important to note that the annual production may vary, depending on the type of
biomass grown. It is relatively cheaper to produce and some types of the biomass
obtained as by-products are almost free. According to the European Environmental
Agency (EEA), 13% of the total energy consumption by 2020, would be provided by
biomass [52].
Biomass can also be directly used in the existing power generating infrastructure.
Specially grown energy crops and other kinds of biomass can be co-fired with coal to
generate electricity. The net energy available from biomass combustion ranges from
about 8 MJ/kg for green wood, to 20 MJ/kg for dry plant matter to 55 MJ/kg for CH4, as
compared to 27 MJ/kg for coal [53]. Biomass contains fewer amounts of sulphur and
nitrogen in comparison to coal, which in turns reduces the formation of toxic and GHG
such as SO2 and NOx.

Hydrogen production by steam reforming of biodiesel
20
Table 1.2: Biomass resources categorised base on their origin [54].
Categories Source Representative material
Productive
Terrestrial
Carbohydrate
Starch
Cellulose
Hydrocarbon
Grease
Sugar cane, corn, sweet sorghum
Maize, cassava and sweet potato
Tropical grasses, poplar and sycamore
Eucalyptus, green coral
Sunflower, rapeseed, palm and other oil
producing plants
Aquatic
Fresh water
Ocean
Micro-organisms
Water hyacinth
Large Kelp
Green algae and photosynthetic bacteria
Unused biomass
Agriculture, forestry and fishery
residues
Animal husbandry
Forestry
Wheat straw, rice straw and husk
Vegetable and processing residues
Animal manure
Farm residues
Secondary forest
Woodland remnants
Crippled materials in plants
Waste
Fisheries
Municipal waste
Garbage
Jettisoned and dead fish
Municipal pulp sludge and sewage
Family garbage

Hydrogen production by steam reforming of biodiesel
21
In addition to this, biomass contains less amount of ash and higher amount of volatile
matter and fixed carbon in comparison to coal. As result biomass can be ignited and
gasified or oxidised easily [55]. It also contains oxygen which is non-existent in coal.
These properties result in effective combustion of biomass compared to coal. But the
higher content of oxygen also reduces the calorific value of biomass. The cost of
electricity generated using biomass is often competitive with fossil fuel based power.
Figure 1.9 shows the cost effectiveness of electricity generated from various renewable
sources. In this Figure, large coloured bars represent the typical levelised cost of
electricity (LCOE) range by technology and the coloured horizontal lines the weighted
average LCOE by country/region if enough individual project data are available. In the
case of biomass, electricity can be produced very cheaply, with prices ranging from USD
0.06/kWh and 0.02/kWh in OCED and developing countries respectively. But the cost
will depend on onsite availability of low cost biomass feedstocks.
The use of biomass could augment and complement the current shortage of fossil fuel. It
will also help reduce atmospheric concentration of CO2, as CO2 produced from biomass
can be counter balanced by the amount absorbed during its growth. Cultivation and
burning of Miscanthus (an energy crop) was predicted to reduce 9% of the total European
carbon emissions in 1990 [56]. The use of waste biomass will also help mitigate the CH4
generated from decaying organic matter. By making use of the sugar cane bagasse for
electricity production, more than 100 % reduction in GHG emissions compared to
gasoline/diesel, was reported with sugar cane ethanol [57].
Biomass can be converted from one form to another. For e.g. agricultural residue such as
wheat straw or rice straw can be converted to biogas a mixture of (CH4 and CO2). This in
turn could help reduce landfills and increase availability of land for other uses. Likewise
liquid fuels such as biodiesel and bio ethanol can also be produced from sugar containing
biomass [58, 59] by fermentation processes. Next generation biofuels such as butanol can
also be produced from these biomass sources [60]. Complex fuels such as bio-oil can also
be generated by pyrolysis of biomass [61].

Hydrogen production by steam reforming of biodiesel
22
Figure 1.8: LCOE and weighted averages for renewable generation technologies, 2012 [62].
Use of non-food based biomass known as energy crops, can help utilise unused land.
Energy crops can be grown in arid or highly erosive land, preventing the utilisation of
fertile land allocated for food production [55, 63]. Switch grass is one of the herbaceous
perennial energy crops which can be utilised in power generation. This kind of crops
offer variety of advantages such as sustainable agriculture as a result of crop
diversification, reduction in soil erosion [64] and lastly they also help in improving
quality of water [65]. Non-food oil crops such as jatropha, tobacco, karanja, rice bran,
rubber seed, and Mahua along with many others can be used in production of oil which
could be converted to biofuel [43]. The bio residue left behind after oil extraction could
be used as animal feed or could be used for the generation of biogas [66, 67].

Hydrogen production by steam reforming of biodiesel
23
The wide variety of biomass available can meet the requirements of the different
conversion processes such as combustion, gasification, pyrolysis, fermentation or
mechanical extraction of oils. Fuel wood, forestry residues, bagasse and MSW can be
directly used in conventional power plants for generating electricity via combustion.
Wood is also preferred for pyrolysis and gasification processes for the production of
liquid (bio oil) and gaseous fuels (bio syn gas). Energy crops such as switch grass are
mainly grown with the intention of utilisation in ethanol production via fermentation for
blending with gasoline. Sugar cane is also grown for ethanol production using the same
processes. Soya bean, rapeseed corn, palm and canola are grown for oil extraction for
production of biodiesel. Agricultural residues, municipal solid waste (MSW), and animal
waste are preferred feedstocks for anaerobic digestion to produce biogas.
In addition to the above advantages, biomass will play an important role in rural
development by developing an integrated sustainable and flexible system of food, energy
and employment, mainly in developing countries such as India. In rural India, fire wood
and chips have been the main source of energy for cooking [68]. To promote biomass use
in other aspects of day-to-day life, several projects were implemented for utilisation of
biomass for energy production [69]. For e.g. animal dung was used for generating biogas
a clean fuel for domestic and water heating in Tunkur district, Karnataka, India.
Production of non-edible oils such as Pongamia seed oil was collected and used for
generating power for illumination and pumping drinking and irrigation water in
Kaggenahalli and surrounding villages, Karnataka, India. Biogas generation and
utilisation for electricity production for pumping drinking water were implemented in
few villages in the Hassan district, Karnataka, India. A Biomass gasifier running on wood
chips for generating electricity for pumping household water was installed in the Tunkur
district. Use of biogas as a cooking fuel is very popular in rural China and
4.54 × 10⁵ household-sized biogas digesters, 5 medium and large scale biogas projects
were installed in the Gansu province of China alone, with 87% of the facilities
operational and well maintained up till 2012 [70]. These programs have helped improve
the energy independence of the rural population and improved the quality of life in these
parts of the world.

Hydrogen production by steam reforming of biodiesel
24
Price and availability of renewable resources would be an important factor in selections
of the source. Global application of certain forms of renewable energy is restricted due
specific requirements. Renewable energy sources such as wind, tidal, geothermal are
often located in remote locations which hamper their ability to transfer the energy from
the generation to the utilisation locations. Also, the energy generation from sources such
as wind, solar and tidal are governed by metrological conditions resulting in intermittent
power production. Considering only on availability basis, biomass is far abundant
anywhere in the world than other sources. One can say that the power generated using
wind, tidal or solar is free, but the infrastructure cost is higher. Cost of biomass is
relatively very cheap and is almost free. Biomass can be used in the existing power
generation infrastructure, giving it an advantage over others.
Biomass energy can be converted from one form to another and it is easily adapted to end
use application. For example, solid biomass can be adopted for power generation, or can
be converted to gases which can also be used for power generation or can be fed to gas
grids for domestic applications. Liquid biofuels such as ethanol, butanol and biodiesel are
produced from biomass and are used as transportation fuels. It can be concluded, that
biomass is a versatile renewable energy source with significant potential for securing
independence from a fossil based economy.
Hydrogen production by steam reforming of biodiesel
25
1.4 Hydrogen energy and fuel cells
As seen above, the energy demand of the world is going to increase. The highest
requirement of energy demand would be in the form of electricity. Generation of clean
and sustainable power is the major concern for today’s world, as the current methods of
power generation i.e. combustion of fossil fuels is unsustainable and highly polluting. H2
as an energy carrier has been widely researched over the world for power generation and
propulsion applications. \
1.4.1 Fuel cells
One of the widely studied methods of utilisation of H2 is fuel cells [71, 72]. Technically,
fuel cells can be described as electrochemical energy conversion devices that convert H2
and O2 into H2O and in the process produce electricity [73]. Their mode of operation is
similar to that of a battery. Unlike a battery, a fuel cell does not store energy and instead
converts chemical energy to electrical energy, without an intermediate conversion steps
into heat and then mechanical power, which is required in combustion technologies [74].
Construction of a polymer electrolyte fuel cell is shown in Figure 1.10.
A fuel cell consists of an anode, cathode and an electrolyte. The electrolyte is in intimate
contact with the porous anode and cathode. Fuel which is H2 or a mixture of H2 rich gas
is introduced at the anode surface, and oxidant is fed at cathode. They react
electrochemically in the three-phase-boundary region established at the gas-electrolyte-
electrode interface. In a proton exchange membrane fuel cell (PEMFC), H2 gas splits at
the anode to form two positively charged protons by releasing two negative electrons, the
protons travels to the cathode through the electrolyte and react with oxygen to form
water, and completing the circuit.

Hydrogen production by steam reforming of biodiesel
26
There are 5 basic types of fuel cells under investigations, classified on the basis of the
type of electrolyte used. Table 1.3 and 1.4 summarises the construction and operation
parameters of different types of fuel cells.
Figure 1.9: Schematic representation of a polymer electrolyte membrane fuel cell [75].
Efficiency exhibited by fuel cells is twice that observed in internal combustion engines
and turbines, making them one of the promising energy conversion devices [76]. They
can be used in association with other devices such as turbines further increasing their
efficiency up to ~70% [77]. PEMFC and solid oxide fuel cells (SOFC) are the two most
promising fuel cells. The PEMFC has a polymer based electrolyte such Nafion which
provides excellent resistance to gas crossover. The PEMFC’s low operating temperature
allows rapid start-up and, with the absence of corrosive cell constituents, the use of the
exotic materials required in other fuel cell types, both in stack construction and in the
BoP (Balance of plant) is not required [72]. Another advantage compared to alkaline fuel
cell (AFC), molten carbonate fuel cell (MCFC) and phosphoric acid fuel cell (PAFC)
Hydrogen production by steam reforming of biodiesel
27
includes significantly reduced corrosion problems due to the limited operating
temperature and the use of a solid electrolyte.
The other big advantage of PEMFC over other fuel cells is its size, weight and compact
nature, making it ideal in the cases where size is key parameter for the application. The
high power density of these fuel cells makes them ideal for applications in laptops,
automotive power, computers and mobile phones. In recent years some of the major
drawbacks such as life of the fuel cell and cost of the power generated have been
resolved, but further cost improvements are necessary in order to compete with the
commercialised internal combustion technologies [78]. One of the key aspects of
PEMFC, which need addressing, is its tolerance to impurities in fuel and oxidant, as these
affect the performance and expedite degradation. PEMFC fuel cells are extremely
vulnerable to CO in the fuel, which poisons the platinum catalysts.
On the other hand, SOFC’s are versatile fuel cells with high electrical efficiency of 55%
[79]. As a result of their high operating temperatures, SOFCs can be effectively
combined with other new energy technologies such as micro turbines to enable the
development of electricity generation products with ~70% efficiency [77]. They can also
be used in combined heat and power systems (CHP) to provide electricity and heat for
applications in cold areas of the world. SOFCs are made from commonly available
ceramic materials and have no moving parts or corrosive liquid electrolytes. Therefore
they should lead to highly reliable electricity generation systems which require low
maintenance [71, 79-81]. The manufacturing process for SOFCs is based on well-known
equipment that is widely available and well proven in the manufacture of electronic
ceramic components. SOFCs do not require expensive catalysts for their operation, and
they can operate directly on CH4 or natural gas, which avoids expensive and difficult fuel
reforming to generate pure H2.

Hydrogen production by steam reforming of biodiesel
28
Table 1.3: Construction and operation summary of various fuel cells [82].
FC PEMFC AFC PAFC MCFC SOFC
Electrolyte
Hydrated
Polymeric Ion
Exchange
Membranes.
Mobilized or
immobilised
KOH in
asbestos
matrix.
Immobilised
liquid
H3PO4 in SiC.
Immobilised
liquid
molten
carbonate
in
LiAlO2
Ceramics
Electrodes Carbon Transition
metals Carbon
Nickel and
Nickel Oxide
Perovskite
and
perovskite /
metal cermet
Catalyst Platinum Platinum Platinum Electrode
Material
Electrode
Material
Interconnect Carbon or
Metal Metal Graphite
Stainless
steel
or Nickel
Nickel,
ceramic, or
steel
Operating
Temp 40 – 80°C 65°C – 220 °C 205°C 650°C 600-1000°C
Charge
Carrier H
+ OH
- H
+ CO3
= O
=
External
reformer
use
Yes Yes Yes
No,
for some
fuels
No, for some
fuels and
cell designs
External
shift
conversion
Yes, plus
purification
to
remove
CO traces
Yes, plus
purification
to remove
CO& CO2
Yes No No
Prime cell
components
Carbon
Based
Carbon
based
Graphite
based
Stainless
Based Ceramic
Water
management Evaporative Evaporative Evaporative Gaseous
Product
Gaseous
Product
Product
heat
management
Process Gas +
Liquid
Cooling
Medium
Process Gas +
Electrolyte
Circulation
Process Gas +
Electrolyte
Circulation
Internal
Reforming +
Process Gas
Internal
Reforming +
Process Gas
Where, FC- fuel cell, PEMFC- Polymer electrolyte membrane fuel cell, AFC- Alkaline
fuel cell, PAFC- Phosphoric acid fuel cell, MCFC- Molten carbonates fuel cell, Temp-
Temperature and SOFC- Solid oxide fuel cell.

Hydrogen production by steam reforming of biodiesel
29
Table 1.4: Performance of comparison of various fuel cells [71, 83].
FC PMFC AFC PAFC MCFC SOFC
SO 1-250 KW 10-100 KW 50KW-
1MW 1KW-1MW 1 KW-3MW
Eff
Elc
53-58%
25-35% 60% 32-38% 45-47% 35-43%
Appl
BPW,
PPW
and TP
Military and
space DG,
Electric
utility,
large DG
MPW,
electric
utility
& large scale
DG
Adv
Solid
Electrolyte
reduces
corrosion.
quick start
Cathode
reactions
are
faster.
Higher
performance
Increased
tolerance to
impurities in
H2.
Higher
overall
efficiency
with CHP’s
High efficiency,
fuel
flexibility,
can use
variety of
catalysts,
suitable
for CHP’s.
High
efficiency,
fuel &catalyst
flexibility,
solid electrolyte
reduces electrolyte
management
problems,
suitable
for CHP’s
hybrid GT cycle
Disadv
Requires
expensive
catalyst,
highly
sensitive to
impurities
in fuel,
low
Temp
waste
heat not
suitable
for CHP’s
Expensive
removal
of CO2
from
air & fuel
is
required
to
prevent
electrolyte
degradation.
Requires
expensive
catalyst,
low current
&power
produced,
large size
& weight.
Temp speeds
corrosion &
break
down of cell
components, complex
electrolyte
mgmt &
slow start up.
Temp
speeds
corrosion &
break
down of
cell components,
slow start up
& brittleness
of ceramic
electrolyte
with cycling.
Where, Adv- Advantages, Appl- Applications, BPW- Backup power CHP- Combined
heat and power, DG- Distributed generation, Disadv- Disadvantages, Eff- Efficiency,
Elc-Electrical, FC- Fuel cell, PPW- Portable power, Temp- Temperature, TP-
Transportation and SO- System output.
Hydrogen production by steam reforming of biodiesel
30
The high operation temperature of the SOFC also has its drawbacks. There are thermal
expansion mismatches among materials, and sealing between cells is difficult in the flat
plate configurations. The high operating temperature places severe constraints on
materials selection and results in difficult fabrication processes. However, the
commercialisation of SOFCs has not been fully demonstrated due to its initial cost of
fabrication, degradation in reliability and durability during its prolonged operation. All
these problems have originated from the high temperature operation of the SOFCs, which
is higher than 900°C. Recent R&D has tended to focus on reduced-temperature SOFCs
because of their cost advantages (since they use low cost metallic interconnect plates) and
their thermal cycle abilities [84].
1.4.2 Hydrogen energy road map
Figure 1.11 shows the European H2 energy road map for 2050. The road map is a
program for bridging the technological gaps in different areas of H2 energy which
includes production, storage, transportation and delivery, applications, safety. Following
are the key challenges which need to be tackled for successful implementation of H2
economy.
Reducing cost of production to conventional fuels such as gasoline.
Generation of renewable and sustainable CO2 free H2.
Construction of efficient, reliable and nationally linked H2 delivery and refuelling
infrastructure.
Development of feasible H2 storage for automotive and stationary applications.
Considerable decrease in cost and significant increase in life of fuel cells.
The use and handling of pure H2 for fuel cell application is risky, due to the formation of
explosive mixtures of H2 and air which can cause serious damage especially during

Hydrogen production by steam reforming of biodiesel
31
accidents. Further H2 has to be liquefied and stored at high pressures which also
introduce another risk factor. H2 is a fuel that has a high gravimetric energy density but
also a low volumetric energy density, in both gaseous and liquid states. As a result to
store same energy content, larger tanks are required for H2 as compared to other fuels.
Tank size has been a problem for car integration. This storage technique requires a high
amount of energy and is therefore a source of considerable environmental impact. New
storage methods such as metal hydrides are being explored; they are currently limited by
the weight of the system. According to US department of Energy, both cryogenic and
high-pressure H2 storage options can meet the mid-term targets [85]. Safer, efficient,
compact systems, with low weights are needed for automotive as well as stationary
applications. Along with fuelling stations, H2 delivery and distribution network
(including H2 pipelines) will need to be developed for the successful implementation of a
H2 economy to replace the current fossil fuel based economy.
Currently most of the H2 produced comes from fossil fuels such as natural gas, oil and
coal. The processes are energy intensive and consume large amount of energy producing
CO2 as a by-product. H2 production technologies from fossil fuels (steam reforming,
partial oxidation, and gasification) are mature and widely used, although some of them
need to be optimised for large-scale production from the point of view of energy
efficiency, environmental impact, safety and above all, costs. The release of CO2 can be
managed by use of carbon capture and storage (CCS), which involves storing of CO2 in
depleted natural gas and oil wells or in geological formations. However the CCS
technology is not commercial proven yet and there are too many unknowns. These
technologies need to be connected to the production infrastructure in order to reduce the
environmental impacts. New processes such as electrolysis, photo-electrolysis, high-
temperature decomposition and photo-biological water splitting are being evaluated.
Production of H2 and pure carbon via high temperature pyrolysis of hydrocarbons,
biomass and municipal sewage waste are also under investigations. Fossil fuel generated
H2 would be the primary source of H2 up to 2020 [85]. The new technologies which are
in development stages could become available during the transitory phase. H2 based on

Hydrogen production by steam reforming of biodiesel
32
renewable resources will become commercially viable in the long run and will replace the
fossil generated H2 (natural gas or coal).
Figure 1.10: European H2 energy road map [85].

Hydrogen production by steam reforming of biodiesel
33
1.4.3 Hydrogen properties and safety
The element H2 is abundantly available in the nature and is a building block of the
universe. Following are some of the advantages of H2 gas as a fuel.
H2 is the lightest element occurring in nature, the H2 molecule contains a large
amount of energy in its chemical bond.
Combustion of H2 generates pure water and no harmful greenhouse gases such as
CO2.
It can be generated from both renewable (solar, wind, geothermal and biomass)
and non-renewable sources (coal, natural gas and nuclear).
H2 gas is nontoxic, which cannot be said in case of other fuels such as gasoline or
coal. Table 1.5 shows some properties of H2 gas in comparison to other fuels.
Properties of H2 are crucial in determining its usage in the H2 economy. The boiling point
of H2 is -252.7°C. Being in gaseous form no energy can be lost in vaporisation, if it is
utilised in internal combustion engines. Lowest specific heat among the fuels, suggest
comparatively less amount of energy would be required if preheating operations are
involved in the power generation processes. Heat of combustion for H2 was highest
compared to other fuels, and is clean only producing H2O. One might assume that H2
would be a dangerous fuel compared to conventional ones such as gasoline. It can be seen
that gasoline and alcohols such as ethanol would ignite quicker than H2. H2 is stable and
coexists harmlessly with free oxygen (O2) until an input of energy drives the exothermic
reaction that forms H2O [86]. It is much lighter than other fuels as a result of its low
density, dispersing very quickly, which could prevent formation of explosive mixtures in
ventilated areas. It also has very low radiative energy in comparison to CH4 and as a
result, at fixed distance away from H2 fires, temperature will be lower indicating cooler
region as compared to that at the centre [87]. Nevertheless care must be taken while
handling and using H2.

Hydrogen production by steam reforming of biodiesel
34
Table 1.5: Properties of H2 and some other fossil fuels [72].
Properties H2 CH4 NH3 CH3OH C2H5OH Gasoline
Molecular weight
kg/kmol 2.01 16.04 17.03 32.04 46.07 114.2
Freezing point
(°C) -259.2 -182.5 -77.7 -98.8 -114.1 -56.8
Boiling point (°C) -252.7 -161.5 -33.4 64.7 78.3 125.7
Enthalpy of
combustion at
25oC (MJ/kg)
141.80 55.50 22.5 22.7 29.7 47.30
Heat of
vaporisation
(kJ/kg)
445.6 510 1371 1129 839.3 368.1
Liquid density
(kg/m3)
77 425 674 786 789 702
Specific heat at
STP (kJ kg-1
K-1
) 14..3 2.22 2.2 2.56 2.72 2.22
Flammability limit
in air (%) 4-77 4-16 5-28 6-36 4-10 1-6
Autoignition
temperature (°C) 571 632 651 464 423 220
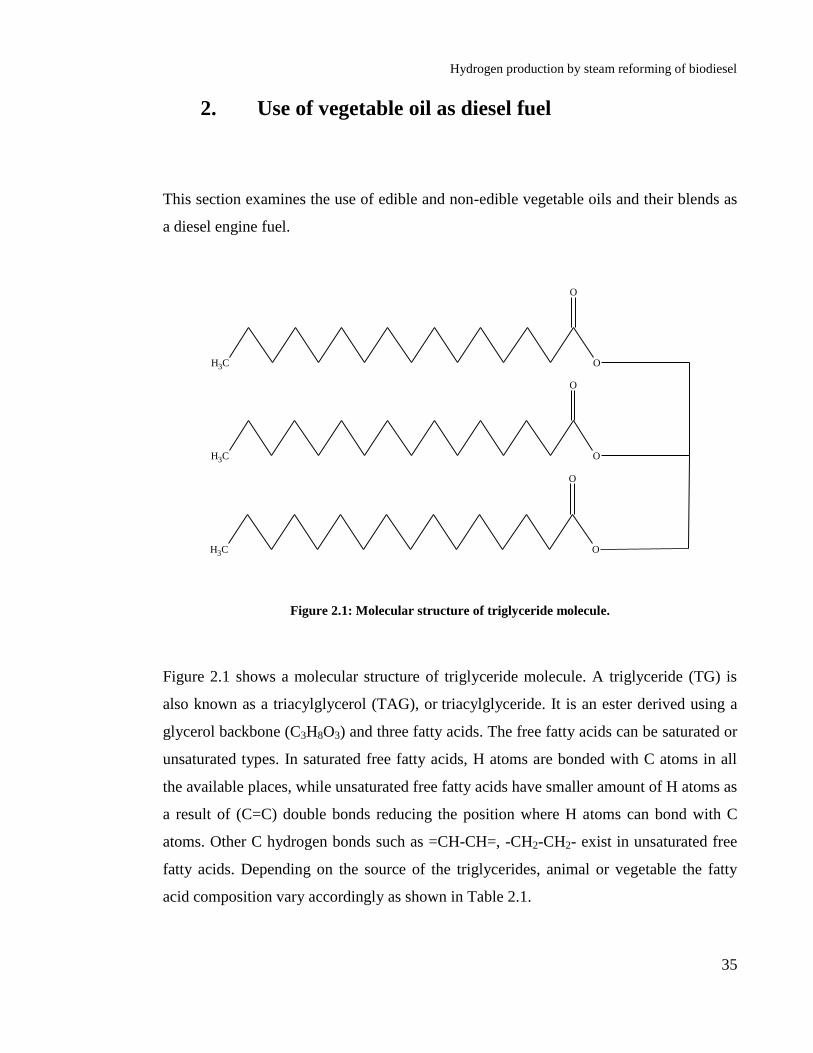
Hydrogen production by steam reforming of biodiesel
35
2. Use of vegetable oil as diesel fuel
This section examines the use of edible and non-edible vegetable oils and their blends as
a diesel engine fuel.
CH3 O
O
CH3 O
O
CH3 O
O
Figure 2.1: Molecular structure of triglyceride molecule.
Figure 2.1 shows a molecular structure of triglyceride molecule. A triglyceride (TG) is
also known as a triacylglycerol (TAG), or triacylglyceride. It is an ester derived using a
glycerol backbone (C3H8O3) and three fatty acids. The free fatty acids can be saturated or
unsaturated types. In saturated free fatty acids, H atoms are bonded with C atoms in all
the available places, while unsaturated free fatty acids have smaller amount of H atoms as
a result of (C=C) double bonds reducing the position where H atoms can bond with C
atoms. Other C hydrogen bonds such as =CH-CH=, -CH2-CH2- exist in unsaturated free
fatty acids. Depending on the source of the triglycerides, animal or vegetable the fatty
acid composition vary accordingly as shown in Table 2.1.
Hydrogen production by steam reforming of biodiesel
36
The use of vegetable oil as fuel is known to man since end of 18th
century. Peanut oil was
used for the first time in Augsburg, Germany on August 10, 1893 by Rudolf Diesel to
power a 10 feet iron cylinder with a flywheel at its base [88]. In the year 1900 Rudolph
Diesel won the highest prize at the world fair held in Paris for his Diesel Engine running
on peanut oil. In the 1920s diesel engine manufacturers modified their engines to run on
petroleum diesel rather than vegetable oil due to the lower viscosity of the former as well
as higher availability and cheaper cost.
Vegetable oil received importance as an emergency fuel during World War II. Countries
such as Brazil curtailed the export of cotton seed oil in order to substitute petroleum
based diesel [89]. China produced kerosene and gasoline by cracking of Tung oil to be
used as fuel [90]. Similarly use of vegetable oil as a substitute diesel fuel was
investigated in India during World War II, but it suffered the same fate when the scarcity
of the cheaper diesel fuel decreased [89]. Similar attempts to explore the utilization of
vegetable oil as diesel fuel were made by Argentina, France, Italy, Japan and Portugal
during World War II. Rising prices of petroleum fuels and fuel shortage during the war in
United States of America led to investigation of cotton seed and corn oil and its diesel
blends to be used as diesel fuel (Ohio State University, (Columbus, USA) [89]. The
history of investigation of vegetable oil and other origin oils such as fish oil, cotton seed
oil and tallow as diesel fuel has been clearly described in “The Biodiesel Handbook”
[90]. According to the authors, in most of the investigations reported, environmental
concern was not the primary objective, since no emission studies were conducted. The
major focus of the research was investigation of these oils as diesel fuel substitute.
Similarly the effects of use of these oils on the life and long term performance were not
documented. Jones and Peterson [91] documented literature on use of unmodified
vegetable oil as a diesel fuel extender from 1942 to 2000. The authors concluded that
short term evaluations of substitution of diesel with any percentage of vegetable oil were
successful, but long term evaluations of blends with higher amount of vegetable oil in the
blends led to engine damage or created maintenance problems.

Hydrogen production by steam reforming of biodiesel
37
2.1 Demerits of vegetable oil as fuel
In recent years energy security and environmental concerns have become a driving force
to promote the utilization of vegetable oil- based diesel fuels. As mentioned above raw
vegetable and other oils have been shown to work as a fuel for diesel engines since
historic times, they exhibit various disadvantages. Raw or refined vegetable oil, or
recycled greases have significantly different composition and their properties making
them acceptable for use in modern diesel engines. Raw vegetable oil and fats have higher
viscosity, and lower volatility fats have been shown to cause problems in a number of
areas [92]. Higher viscosity and lower volatility have shown to reduce the brake thermal
efficiency of vegetable oil fuelled engine compared to diesel engine resulting in higher
HC and CO emissions [93, 94]. The other draw backs are listed below
piston ring sticking
injector and combustion chamber deposits.
fuel system deposits.
reduced power
reduced fuel economy and increased exhaust emissions.
Use of unprocessed oils or fats as neat fuels or blending stock lead to excessive fuel
condensation and corresponding dilution of the engine’s lubricating oil that may result in
sludge formation [95]. Any or all of these conditions may result in reduced engine life,
increased maintenance costs, or catastrophic engine failure. The significantly higher
viscosity of raw vegetable oils (27 - 54 mm2/s) compared to petroleum diesel fuel (2.6
mm2/s) has shown to alter fuel injector spray patterns and spray duration, adds stress on
fuel injection systems, and results in incomplete combustion and high dilution of the
engine lubricating oil [96]. Changes in the fuel injector spray patterns, duration, etc.
results in poor engine performance and high emissions levels, caused by ineffective
combustion processes. Fuel dilution of engine lubricating oil increases as a result of
incomplete combustion leading to sludge development [97, 98]. Nwafor et al. [99, 100]
reported that low cetane number of vegetable oil resulted in knocking in diesel engine at

Hydrogen production by steam reforming of biodiesel
38
low load and cylinder temperature. Undesirable deposits on pistons, piston rings, fuel
injectors, valves occur as result of polymerization of glycerides in raw vegetable oils and
animal fats during the combustion processes [95, 101, 102]. Table 2.2 summaries the
effects of vegetable oil utilization in a diesel engine. It can be clearly seen that non
modified or raw vegetable oil seriously affect the performance of diesel engine in both
long and short term use.
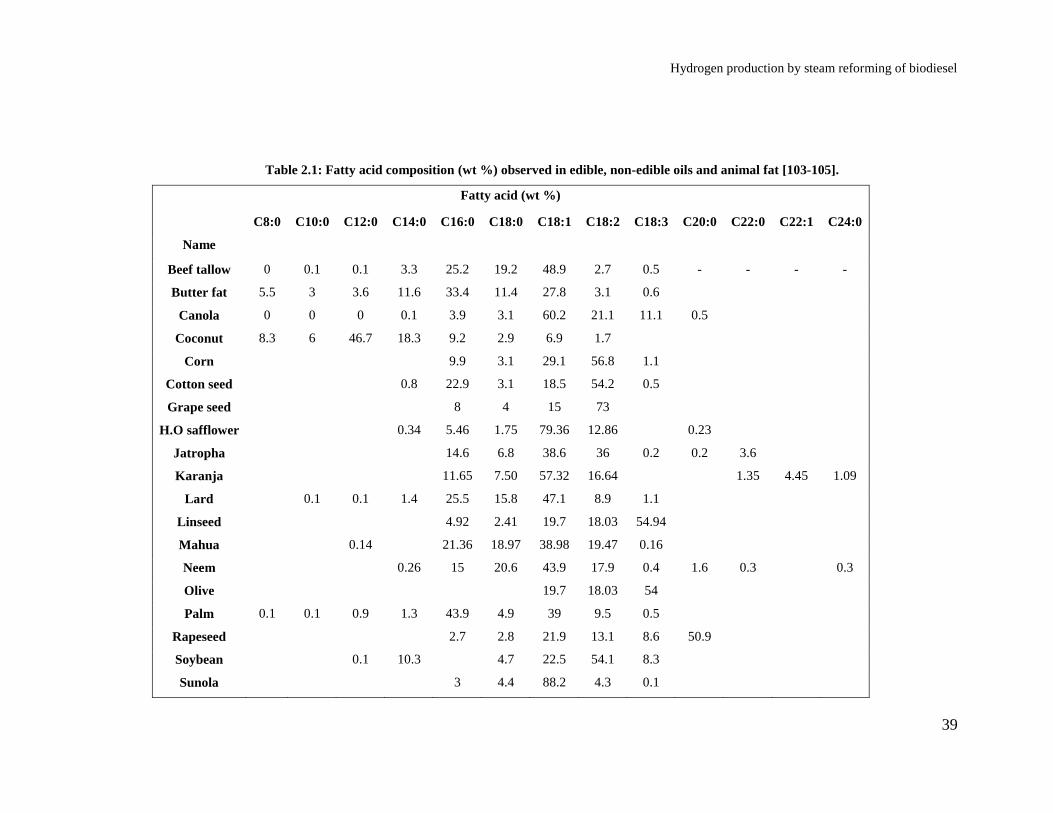
Hydrogen production by steam reforming of biodiesel
39
Table 2.1: Fatty acid composition (wt %) observed in edible, non-edible oils and animal fat [103-105].
Fatty acid (wt %)
Name
C8:0 C10:0 C12:0 C14:0 C16:0 C18:0 C18:1 C18:2 C18:3 C20:0 C22:0 C22:1 C24:0
Beef tallow 0 0.1 0.1 3.3 25.2 19.2 48.9 2.7 0.5 - - - -
Butter fat 5.5 3 3.6 11.6 33.4 11.4 27.8 3.1 0.6
Canola 0 0 0 0.1 3.9 3.1 60.2 21.1 11.1 0.5
Coconut 8.3 6 46.7 18.3 9.2 2.9 6.9 1.7
Corn 9.9 3.1 29.1 56.8 1.1
Cotton seed 0.8 22.9 3.1 18.5 54.2 0.5
Grape seed 8 4 15 73
H.O safflower 0.34 5.46 1.75 79.36 12.86 0.23
Jatropha 14.6 6.8 38.6 36 0.2 0.2 3.6
Karanja 11.65 7.50 57.32 16.64 1.35 4.45 1.09
Lard 0.1 0.1 1.4 25.5 15.8 47.1 8.9 1.1
Linseed 4.92 2.41 19.7 18.03 54.94
Mahua 0.14 21.36 18.97 38.98 19.47 0.16
Neem 0.26 15 20.6 43.9 17.9 0.4 1.6 0.3 0.3
Olive 19.7 18.03 54
Palm 0.1 0.1 0.9 1.3 43.9 4.9 39 9.5 0.5
Rapeseed 2.7 2.8 21.9 13.1 8.6 50.9
Soybean 0.1 10.3 4.7 22.5 54.1 8.3
Sunola 3 4.4 88.2 4.3 0.1

Hydrogen production by steam reforming of biodiesel
40
Table 2.2: Long term and short term problems associated with use of vegetable oil as a diesel engine
fuel [95].
Sr No Problem Nature Probable cause
1 Cold weather starting Short term High viscosity, low flash point
and low cetane number
2 Plugging and gumming of filter, lines
and injectors Short term
Natural gums (phosphatides) in
vegetable oil. Ash.
3 Engine Knocking
Short term
Very low cetane of some oils.
Improper injection timing.
4 Coking of injectors and C deposits on
piston and head of engine Long term
High viscosity of vegetable oil,
incomplete combustion of fuel.
Poor combustion at part load.
5 Excessive engine wear Long term
Possibly free fatty acids in
vegetable oil. Dilution of
engine lubricating oil due to
blow-by of vegetable oil.
6 Failure of engine lubricating oil due to
polymerization Long term
Collection of poly-unsaturated
vegetable oil blow-by in crank-
case to the point where
polymerization occurs.
Hydrogen production by steam reforming of biodiesel
41
3. Biodiesel: An alternative diesel fuel
As discussed in the previous chapter, the use of vegetable oil as diesel fuel is restricted by
the viscosity of the oil or its blends. Several attempts to lower the viscosity by increasing
the temperature of the vegetable oil [99] or its blends have been investigated widely [106-
109]. Some of the investigations reported negative effect of the preheating of the oils.
According to Agarwal and Rajamanoharan [107] preheated and cold Karanja oil showed
similar CO emissions, smoke opacity and hydrocarbon emissions. Blends with
concentration of 50 (v/v) % could be used directly with or without preheating, but CO,
hydrocarbon and smoke emissions were shown to be higher for these blends, questioning
their use as blends.
A different approach to reduce the viscosity of the vegetable oil for use in diesel engine
was proposed in 1937 by G. Chavanne [110] from the University of Brussels who
patented a process called transesterification of vegetable oil. The inventor used ethanol
(C2H5OH) in order to separate the fatty acids from the glycerol backbone by replacing it
with shorter chain linear alcohols. The term biodiesel was used for the first time then to
define the products obtained from the process. Biodiesel i.e. fatty acid methyl esters
(FAME) are defined as monoalkyl esters of fatty acids.
In 1977, the first patent for industrial process of biodiesel manufacture was applied by
Expedito Parente, a Brazilian scientist, with research on biodiesel production from
sunflower oil commencing in 1979 [89, 111]. The first pilot plant was established by
Gaskoks in 1987, with first manufacturing plant in 1989. Since then several industrial
scale biodiesel manufacturing plants were established worldwide depending on the type
of oil feedstock, with soybean in America, canola in Canada, rapeseed oil in Europe and
UK and palm oil in Malaysia.
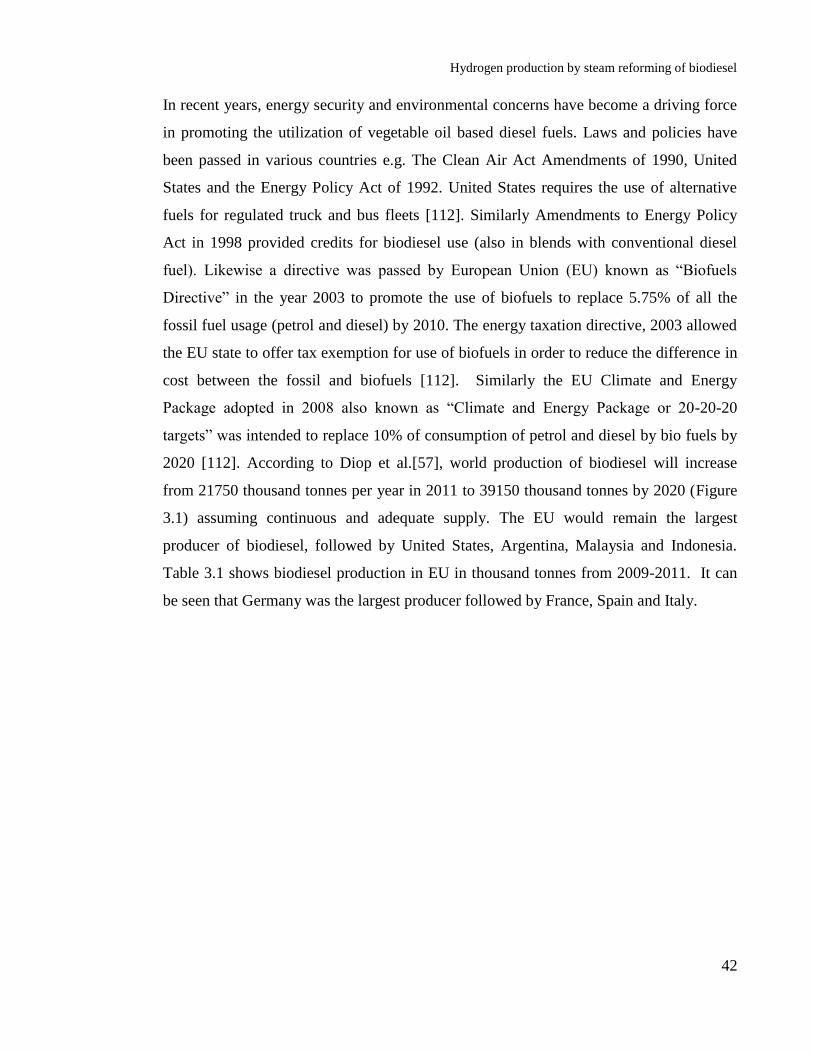
Hydrogen production by steam reforming of biodiesel
42
In recent years, energy security and environmental concerns have become a driving force
in promoting the utilization of vegetable oil based diesel fuels. Laws and policies have
been passed in various countries e.g. The Clean Air Act Amendments of 1990, United
States and the Energy Policy Act of 1992. United States requires the use of alternative
fuels for regulated truck and bus fleets [112]. Similarly Amendments to Energy Policy
Act in 1998 provided credits for biodiesel use (also in blends with conventional diesel
fuel). Likewise a directive was passed by European Union (EU) known as “Biofuels
Directive” in the year 2003 to promote the use of biofuels to replace 5.75% of all the
fossil fuel usage (petrol and diesel) by 2010. The energy taxation directive, 2003 allowed
the EU state to offer tax exemption for use of biofuels in order to reduce the difference in
cost between the fossil and biofuels [112]. Similarly the EU Climate and Energy
Package adopted in 2008 also known as “Climate and Energy Package or 20-20-20
targets” was intended to replace 10% of consumption of petrol and diesel by bio fuels by
2020 [112]. According to Diop et al.[57], world production of biodiesel will increase
from 21750 thousand tonnes per year in 2011 to 39150 thousand tonnes by 2020 (Figure
3.1) assuming continuous and adequate supply. The EU would remain the largest
producer of biodiesel, followed by United States, Argentina, Malaysia and Indonesia.
Table 3.1 shows biodiesel production in EU in thousand tonnes from 2009-2011. It can
be seen that Germany was the largest producer followed by France, Spain and Italy.

Hydrogen production by steam reforming of biodiesel
43
Table 3.1: EU biodiesel production from 2009-2011. Units: thousand tonnes [113].
Year 2009 2010 2011
Germany 2539 2861 2800
France 1959 1910 1559
Spain 859 925 604
Italy 737 706 479
Belgium 416 435 472
Poland 332 370 370
Netherlands 323 368 363
Austria 310 289 287
Portugal 250 289 226
Finland 233 288 225
Denmark/Sweden 220 246 225
Czech Republic 164 181 218
Hungary 137 149 154
UK 133 145 150
Slovakia 101 88 103
Lithuania 98 85 101
Romania 77 70 79
Latvia 44 43 78
Greece 29 33 56
Bulgaria 25 30 26
Ireland 24 28 26
Slovenia 17 22 6
Cyprus 9 6 0
Estonia 9 3 0
Malta 1 0 0
Luxemburg
Total
0
9046
0
9570
0
8607
Hydrogen production by steam reforming of biodiesel
44
Figure 3.1: Global biodiesel projection by 2020 [57].
3.1 Advantages of biodiesel
The advantages of using biodiesel as a diesel engine fuel are listed below [114-116].
1. Provides a domestic and renewable energy supply.
2. Bio-diesel does not affect GHG emissions, due to balance as a result of balance
between the amount of CO2 emissions and the amount of CO2 absorbed by the
vegetable oil plants.
3. Biodiesel usage in diesel engine improves engine efficiency.
4. Biodiesel can be directly used in diesel engines without any modifications.
5. The physical properties of biodiesel are much closer to diesel compared to
vegetable oil. The viscosity of the biodiesel is much lower than vegetable oil and
comparable to diesel. Biodiesel higher cetane number compared to diesel or
vegetable oil (Table 3.3).
Hydrogen production by steam reforming of biodiesel
45
6. Biodiesel can act as a lubricant and helps in preventing premature engine wear
and failure. All diesel engine use fuel injection pumps and fuel injectors. These
consists moving parts, which undergo wear and corrosion due to metal-to-metal
contact as a result of lower lubricity of diesel fuel. Higher lubricity of biodiesel
reduces wears and prolongs engine life.
7. Hydrocarbon fuels typically form a layer of deposits on the inside of tanks, hoses,
etc. Bio-diesel blends loosen these deposits. It also reduces carbon deposits on
injectors.
8. Bio-diesel contains no sulphur hence does not produce toxic sulphur dioxide.
9. It does not require new infrastructure of refuelling stations.
10. Biodiesel is safe to store, due to its high flash point.
11. The emissions of polyaromatic hydrocarbons and nitro-polyaromatic hydrocarbon
compounds are substantially lower with bio-diesel compared to conventional
diesel fuel [111].
12. It can be used with heavy duty applications. It can work in conjunction with any
new vehicle program (i.e. CNG, new and existing vehicles).
13. When ethyl esters are used as fuel the advantage of totally recyclable CO2 cycle is
obtained since C2H5OH can be completely of vegetable origin.
14. Biodiesel results in lower soot and PM formation.
Tables 3.2 and 3.3 summarise few physical properties of biodiesel i.e. methyl esters of
the various edible and non-edible vegetable oils respectively. As seen in the tables the
calorific values of methyl esters i.e. biodiesel are comparable to those of vegetable oil
and diesel. The viscosity and cetane number of methyl esters is higher than their
respective oils but have much lower viscosity. Similarly the density of biodiesel i.e. esters
is lower than virgin oils but is comparable with that of diesel.
Biodiesel consists of shorter chain compounds compared to vegetable oils. Depending on
the type of oil edible or non-edible, the composition of the biodiesel varies accordingly.
Table 3.4 shows the chemical structure of common fatty acid methyl esters. The

Hydrogen production by steam reforming of biodiesel
46
feedstock nature and composition of the oils used for biodiesel production differs from
location to location depending on geographical locations. There are more than 350
varieties of oil-producing crops from canola, peanut, safflower, soybean, sunflower and
rapeseed. Non edible oils such as Calophyllum inophyllum, Moringa oleifera, Sterculia
foetida, Madhuca indica (Mahua), Croton megalocarpus and Pongamia pinnata have
become popular worldwide as a result reduce food competition and biodiesel cost
reduction. It is very important for biodiesel feedstock to be as cheap as possible in order
to reduce the cost of biodiesel production, in order to compare with relatively cheaper
diesel. Typical composition of various oils based on edible, non-edible oils and animal fat
are included in Table 2.1.
Table 3.2: Physical properties of edible vegetable oils [105, 117, 118].
Fuel Calorific vale
(kJ/kg)
Density
(kg/m3 )
Viscosity (mm2/s) Cetane number
Olive oil 37,000(lower) 925 32 39
Olive oil methyl
ester 37,200(lower) 888 4.70 61
Peanut oil 39,900 888 22.72 41.8
Peanut oil methyl
ester 40,100 848.5 4.42 53.9
Rapeseed oil 37,620 914 39.2 37.6
Rapeseed oil
methyl ester 37,625 882.2 4.63 54.1
Soybean oil 37,000 925 33 38
Soybean oil methyl
ester 39,760 872 4.29 37
Sunflower oil 39,575 918 58.5 37.1
Sunflower oil
methyl ester 40,000 878 4.70 45.5
Safflower oil 39,519 914.4 31.3 41.3
Safflower oil
methyl ester 40,155 883.8 4.10 51.8
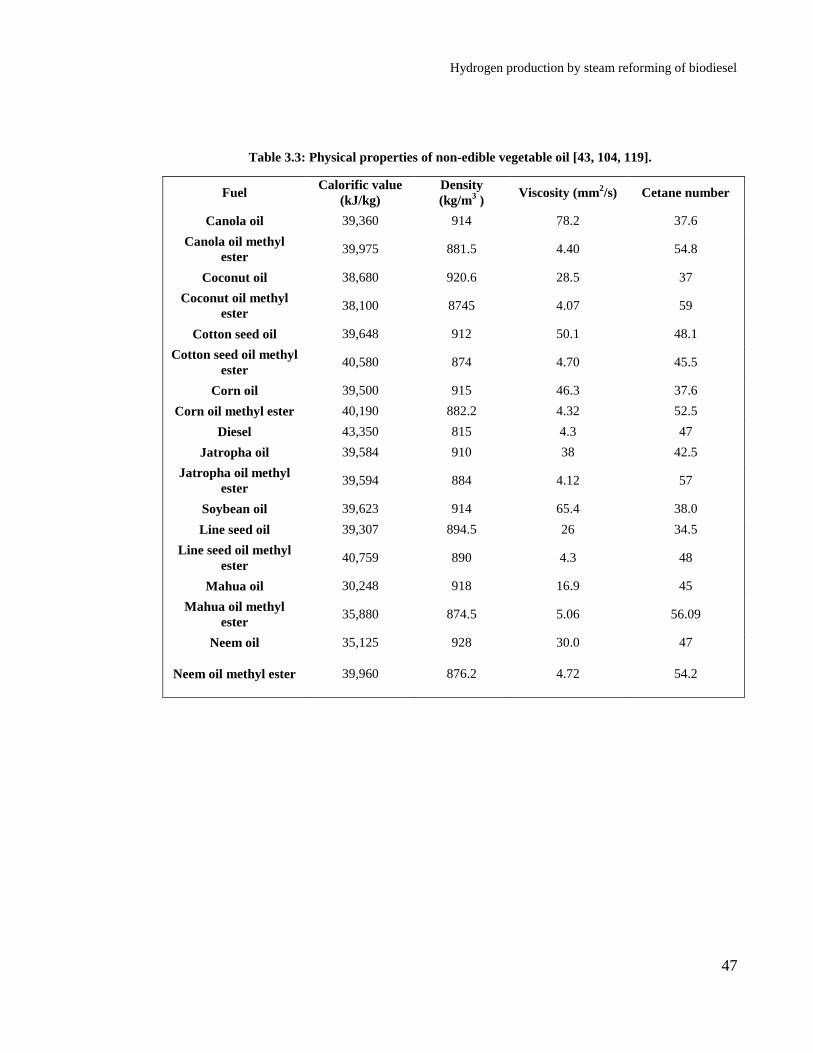
Hydrogen production by steam reforming of biodiesel
47
Table 3.3: Physical properties of non-edible vegetable oil [43, 104, 119].
Fuel Calorific value
(kJ/kg)
Density
(kg/m3 )
Viscosity (mm2/s) Cetane number
Canola oil 39,360 914 78.2 37.6
Canola oil methyl
ester 39,975 881.5 4.40 54.8
Coconut oil 38,680 920.6 28.5 37
Coconut oil methyl
ester 38,100 8745 4.07 59
Cotton seed oil 39,648 912 50.1 48.1
Cotton seed oil methyl
ester 40,580 874 4.70 45.5
Corn oil 39,500 915 46.3 37.6
Corn oil methyl ester 40,190 882.2 4.32 52.5
Diesel 43,350 815 4.3 47
Jatropha oil 39,584 910 38 42.5
Jatropha oil methyl
ester 39,594 884 4.12 57
Soybean oil 39,623 914 65.4 38.0
Line seed oil 39,307 894.5 26 34.5
Line seed oil methyl
ester 40,759 890 4.3 48
Mahua oil 30,248 918 16.9 45
Mahua oil methyl
ester 35,880 874.5 5.06 56.09
Neem oil 35,125 928 30.0 47
Neem oil methyl ester 39,960 876.2 4.72 54.2
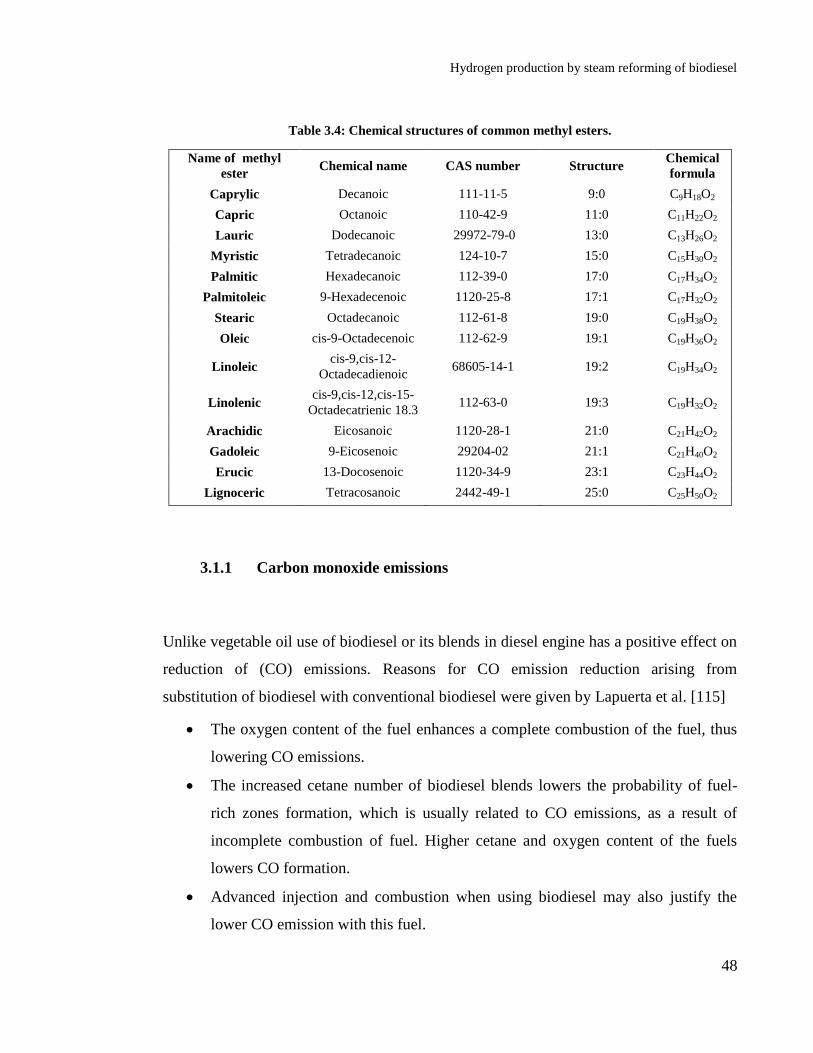
Hydrogen production by steam reforming of biodiesel
48
Table 3.4: Chemical structures of common methyl esters.
Name of methyl
ester Chemical name CAS number Structure
Chemical
formula
Caprylic Decanoic 111-11-5 9:0 C9H18O2
Capric Octanoic 110-42-9 11:0 C11H22O2
Lauric Dodecanoic 29972-79-0 13:0 C13H26O2
Myristic Tetradecanoic 124-10-7 15:0 C15H30O2
Palmitic Hexadecanoic 112-39-0 17:0 C17H34O2
Palmitoleic 9-Hexadecenoic 1120-25-8 17:1 C17H32O2
Stearic Octadecanoic 112-61-8 19:0 C19H38O2
Oleic cis-9-Octadecenoic 112-62-9 19:1 C19H36O2
Linoleic cis-9,cis-12-
Octadecadienoic 68605-14-1 19:2 C19H34O2
Linolenic cis-9,cis-12,cis-15-
Octadecatrienic 18.3 112-63-0 19:3 C19H32O2
Arachidic Eicosanoic 1120-28-1 21:0 C21H42O2
Gadoleic 9-Eicosenoic 29204-02 21:1 C21H40O2
Erucic 13-Docosenoic 1120-34-9 23:1 C23H44O2
Lignoceric Tetracosanoic 2442-49-1 25:0 C25H50O2
3.1.1 Carbon monoxide emissions
Unlike vegetable oil use of biodiesel or its blends in diesel engine has a positive effect on
reduction of (CO) emissions. Reasons for CO emission reduction arising from
substitution of biodiesel with conventional biodiesel were given by Lapuerta et al. [115]
The oxygen content of the fuel enhances a complete combustion of the fuel, thus
lowering CO emissions.
The increased cetane number of biodiesel blends lowers the probability of fuel-
rich zones formation, which is usually related to CO emissions, as a result of
incomplete combustion of fuel. Higher cetane and oxygen content of the fuels
lowers CO formation.
Advanced injection and combustion when using biodiesel may also justify the
lower CO emission with this fuel.

Hydrogen production by steam reforming of biodiesel
49
3.1.2 Hydrocarbon emissions
One of the main advantages of using biodiesel or its blends over pure vegetable oils is
reduction of hydrocarbon emissions. Significant reductions in hydrocarbon emissions
were reported by several authors Dhar and Agarwal [120], Dhar et al. [121] , Jindal et
al.[122], Kalligeros et al. [123], Misra and Murthy[124], Shi et al [125]. and Sahoo et al
[109]. Dhar and Agarwal [120, 121] reported that hydrocarbon emissions from Karanja
biodiesel-diesel blends at lower engine loads were higher, but the amount of emissions
decreased with increasing engine load. At lower engine loads the emissions from the
higher biodiesel blends were comparable to diesel. Following reasons were provided for
reduction in hydrocarbons at lower and higher engine loads.
The reduction in hydrocarbons by the use of biodiesel-diesel blends as compared to diesel
at lower engine loads was shown to be the result of the following factors.
1. Reduction in over-mixing at lower engine loads due to poor biodiesel volatility.
2. Reduction in stoichiometric air requirement owing to oxygen from biodiesel,
which enhances diffusion combustion and also increases heat release/gas
temperature as compared to pure diesel.
At higher engine loads, hydrocarbon emissions are caused by deficiency of oxygen in
fuel rich zones, presence of oxygen from biodiesel molecules helps in reduction of
emissions. Reductions in hydrocarbon emissions were shown to vary with biodiesel
concentration, with lower biodiesel showing highest change in the emissions. Reductions
from (7 to 56%) and (4 to 33% ) were observed 10 and 20% Neem biodiesel-diesel
blends [121].
3.1.3 Particulate Matter emissions
One of the important advantages of biodiesel is reduction in particulate matter (PM)
emissions, responsible for serious health effects such as asthma, lung cancer and serious

Hydrogen production by steam reforming of biodiesel
50
respiratory disorders. This section examines the effects of biodiesel on PM reduction and
various factors affecting the emissions will be assessed. According to Kumar et al. [105]
higher cetane number of biodiesel resulting in shorter ignition delay and longer
combustion duration were responsible in lowering PM emissions. Another reason for
reduction in PM was provided by Lapuerta et al. [126], increase in oxygen content of
biodiesel promoted oxidation of local fuel rich zones, reducing PM emissions. According
to Agarwal et al. [127] fuels having higher oxygen content (30-40%) due to the presence
of biodiesel were shown to produce drastic decrease in PM emissions. Reduction in PM
emissions particularly soot was not merely by replacement of diesel but can be due to
discouragement of soot formation or promotion of soot oxidation. Further pyrolytic
reactions in fuel rich regions in the cylinder are suppressed and oxidation reactions due to
the oxygen content from biodiesel are promoted reducing soot formation. In essence the
excess oxygen (from fuel) is supplied for the combustion reaction in contrast to the
oxygen from air, which has no hand to play for the excess oxygen.
The reasons for reduction of PM were compiled by Lapuerta et al. [115] are as follows.
1. Oxygen content of the biodiesel promoting more complete combustion of the fuel
even in fuel rich regions of the combustion chamber. The oxidation promotion of
the formed soot due to the oxygen content of the fuel.
2. The lowering the stoichiometric air requirement in the case of biodiesel
combustion reduces the probability of fuel-rich region formation in the non-
uniform fuel/air mixture, thus affecting soot formation.
3. Absence of soot forming aromatics in biodiesel fuels compared to diesel.
4. Formation of oxidation susceptible soot particles with use of biodiesel in
comparison to diesel soot particles.
5. Absence of sulphur content of biodiesel prevents the formation of sulphates which
is significantly higher in diesel PM. Similarly it prevents the adsorption of
hydrocarbons on the soot surface by preventing the scrubbing effect activation of
sulphur. This effect is known to increase PM emissions.
Hydrogen production by steam reforming of biodiesel
51
6. Lower probability of soot and tar production from difficult to vaporize heavy
hydrocarbon being absent as a result of lower final boiling point, despite its higher
average distillation temperature.
Summarising, biodiesel is a renewable fuel and has significant advantages as diesel fuel
substitute. These advantages are discussed in detail in section 3.1. Apart from them the
biggest benefit of biodiesel usage is reduction in emissions of CO, hydrocarbons,
particulate matter and smoke. The disadvantage of biodiesel is increased NOx formation.
Absence of sulphur in biodiesel eliminates the emissions of sulphur dioxide with 100%
biodiesel usage while it reduces them with use of biodiesel-diesel blends. The reduction
of these emissions is a result of molecular oxygen of the fuel, resulting in complete
combustion of the fuel even in fuel rich zones formed in the engine. The fuel rich zones
are known to result in incomplete combustion increasing CO emissions from the engine.
Similarly the molecular oxygen are shown to reduce soot formation considerably thus
affecting particulate matter emissions drastically. This was also thought to be the reason
for reduction in smoke and hydrocarbon formation.
3.1.4 Effect of biodiesel type on engine emissions
The reduction of emissions is dependent on biodiesel composition which affects
combustion processes. Biodiesel obtained from various sources such as vegetable or
animal sources, depending on the climatic conditions and geography of the region in
which the oil bearing plants are grown. The animal sources of triglyceride will depend on
the nature of livestock reared in the region for meat production. The source of oil or
animal fat used for biodiesel production hence will vary according to the source of raw
material. Higher amount of unsaturated components such as linoleic (C18:2) and
linolenic (C18:3) fatty acid esters in biodiesel lower the cetane number resulting in
inefficient combustion [105, 128]. On the other hand increase in saturated fatty acid
methyl esters such as palmitic (C16:0) and stearic acid (C18:0) improve cetane number
and combustion of biodiesel. Level of unsaturation is the most important parameter that

Hydrogen production by steam reforming of biodiesel
52
determines the cetane number of the biodiesel, presence of long chain saturated ester is
sufficient to provide high cetane number [129]. As biodiesel is made of C, H, O, the ratio
of C/H may vary depending the degree of unsaturation in the source of triglyceride used
to produce biodiesel. The oxygen content of biodiesel varies between 10-12 wt%,
affecting the calorific value of the fuel. Calorific value of biodiesel increases with the
chain length. Increasing chain length of compounds had insignificant effect on the
NOx and PM exhaust emissions, while significant effect was exerted on HC and CO
emissions, the latter being reduced with decreasing chain length [130]. Increase in
unsaturation was shown to increase NOx emissions. Increase in the double bonds within
fatty acid methyl ester, increased PM emissions. Unsaturated fatty acid methyl ester were
shown to produce soot forming precursors such as ethylene and ethyne by thermal
decomposition [131]. The composition of biodiesel (saturated or unsaturated) also affect
other properties such as viscosity and density which are responsible to affect combustion
processes directly by affecting fuel atomization in the combustion chamber in turn
affecting the emissions. It also affects cold flow properties, oxidation stability which in
turn affects the quality of biodiesel. Further type of engine used in the investigation is a
very important factor that would influence the performance of biodiesel or its blends.
In addition to the chemical composition of biodiesel, factors such as blend concentration,
engine parameters such as load, speed, exhaust temperature, engine duty, engine tuning,
and type of diesel affect the emissions. Also type of instruments and techniques used to
study the performance of biodiesel and its diesel blends significantly affect the results
obtained. The main question of food or fuel would still persist with use of edible oil crops
for biodiesel production. Use of non-edible oils, animal fat or other sources of oil such as
algae could be influential to solve the dilemma by providing cheaper source of feedstock
for biodiesel production.
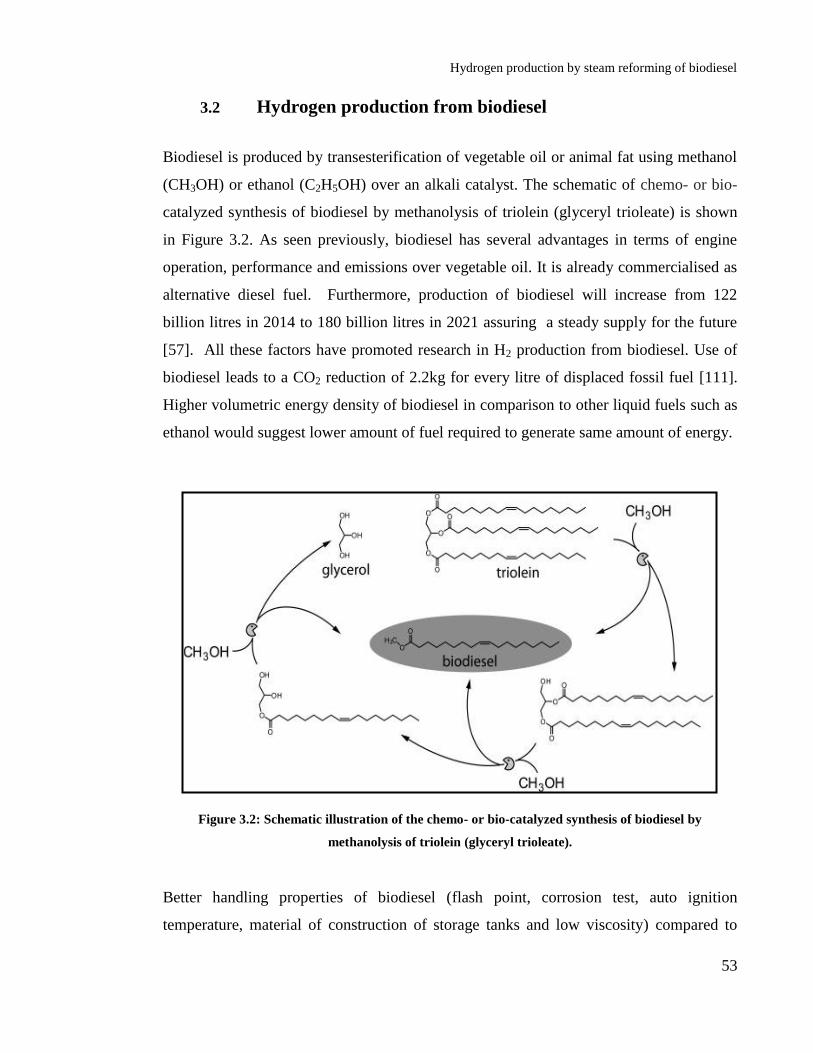
Hydrogen production by steam reforming of biodiesel
53
3.2 Hydrogen production from biodiesel
Biodiesel is produced by transesterification of vegetable oil or animal fat using methanol
(CH3OH) or ethanol (C2H5OH) over an alkali catalyst. The schematic of chemo- or bio-
catalyzed synthesis of biodiesel by methanolysis of triolein (glyceryl trioleate) is shown
in Figure 3.2. As seen previously, biodiesel has several advantages in terms of engine
operation, performance and emissions over vegetable oil. It is already commercialised as
alternative diesel fuel. Furthermore, production of biodiesel will increase from 122
billion litres in 2014 to 180 billion litres in 2021 assuring a steady supply for the future
[57]. All these factors have promoted research in H2 production from biodiesel. Use of
biodiesel leads to a CO2 reduction of 2.2kg for every litre of displaced fossil fuel [111].
Higher volumetric energy density of biodiesel in comparison to other liquid fuels such as
ethanol would suggest lower amount of fuel required to generate same amount of energy.
Figure 3.2: Schematic illustration of the chemo- or bio-catalyzed synthesis of biodiesel by
methanolysis of triolein (glyceryl trioleate).
Better handling properties of biodiesel (flash point, corrosion test, auto ignition
temperature, material of construction of storage tanks and low viscosity) compared to

Hydrogen production by steam reforming of biodiesel
54
vegetable oils and diesel could justify the use of biodiesel as a feedstock for H2
production. Waste cooking oil contains high amount of free fatty acids (FFA),
responsible for initiating cracking reactions at the reforming temperatures leading to
carbon formation and catalyst deactivation [132]. FFA acids are formed due to hemolytic
and hydrolytic reactions which occur in vegetable oil. If triglycerides containing saturated
fatty acids are heated at high temperature (180°C) in the absence of oxygen, they produce
a series of normal alkanes, alkenes, lower fatty acids, symmetric ketones, oxopropyl
esters, CO, and CO2. The steam produced during food preparation can cause hydrolysis
of triglycerides resulting in the formation of FFA, glycerol (C3H8O3) and monoglycerides
[133]. During the biodiesel production process, most of the FFA content is removed by
acid treatment to prevent soap formation and reduction of methyl ester yields. This would
help reduce carbon formation from FFA during the H2 production processes.
Life cycle assessment of biodiesel production using transesterification of waste cooking
oil was reported to have a low C footprint, promoting the use of biodiesel as a H2 carrier
[134] as compared to vegetable oorwaste oil. According to Xuan et al [135], as biodiesel
consists of shorter C chains in comparison to original oils. As a result it would be easier
to convert to H2 as compared to the original oils. The utilisation of biodiesel for H2
production or fuel cell usage is relatively new [136-138] and few catalytic investigations
have been reported [139, 140]. Direct utilisation of biodiesel formulations in solid oxide
fuel cells (SOFC) using Ni/YSZ anodes was reported by Nahar and Kendall [141].
Higher power generation using biodiesel fuelled SOFC over Ni/ScCZ anode was reported
by Tuyen et al [142] in comparison to waste cooking oil fuelled SOFC using CeO2-Rh
anodes by Zhou et al [143].
H2 production via CSR of biodiesel using NiAl2O4/Al2O3-YSZ catalyst was investigated
by Abatzoglou et al. [144]. The authors examined the CSR performance at 700°C and
S/C of 1.9-2.4. A 100% conversion of biodiesel was reported at GHSV of 5500 cm3/g cat
h which decreased to 88% with increase in gas hourly space velocity (GHSV) to 8700
cm3/g cat h at constant S/C of 1.9. H2 production via CSR of biodiesel derived from palm

Hydrogen production by steam reforming of biodiesel
55
oil was investigated by Shiratori et al. [140]. A 12 wt% Ni catalyst supported on paper
based support was prepared using a dual polyelectrolyte retention system and a
subsequent on-paper synthesis. In the synthesis of the catalyst a ceramic fiber suspension
containing catalyst powders were mixed with Al sols. This mixture was poured in pulp
suspension and hand sheets with grammage of 4 to 5 g/m2 were prepared. The sheets
were pressed at 350 kPa for 5 min and dried at 100°C for 30 min followed by calcination
at 350°C for 3 h to remove the organic compounds. The performance of the catalyst was
evaluated at S/C of 3.5 at 800 °C and GHSV of 3900 h-1
. Catalyst supports containing
YSZ and Al fibre in addition to inorganic binders such as Zr or Al sols deactivated after 8
h of operation in a 20 h test. Severe C formation was detected on catalyst containing Al
sol as binder. In order to improve the performance bimetallic catalyst containing 4 wt%
MgO was prepared and the support was also modified by using different binders such as
Ce. The best performance in terms of H2 composition and conversion was observed over
Ni-MgO/ (YSZ+Al) fibre + Ce sol, which exhibited stable performance for about 50 h.
Apart from these few catalytic investigations, conceptual investigations of biodiesel
based fuel processor was investigated by Sgroi et al. [145], Specchia et al. [146] and
Kraaij et al. [136] who proposed various methods for developing a fuel processor based
on biodiesel. Simulations were carried out, and autothermal reforming (ATR) was
selected as the best option in developing a fuel processor for the fuel cell. Similarly
Martin and Wörner [137] showed that the ATR concept with heat integration was
competitive with the SR concept with heat integration in terms of fuel processing
efficiency and overall system efficiency. ATR has been reported to increase H2 yield by
increasing C3H8O3 conversion [147]. In ATR reaction mode, the heating is done directly
by using oxidation reactions. Once the reaction is initiated with effective amount of heat,
the reaction is self sustaining from the reaction products. The thermodynamics ATR of
biodiesel using Gibbs free minimisation method with water-biodiesel molar feed ratio
(WBFR) between 3 to 12, oxygen-biodiesel molar feed ratio (OXBFR) from 0-4.8 and
reaction temperature from 300-800oC was examined by Nahar [138]. From the results
WBFR≥9 and OXBFR=4.8 are the best conditions to operate the ATR reformer at SOFC
Hydrogen production by steam reforming of biodiesel
56
temperature (800 oC). A 68.80 and 91.66% H2 and CO yields with 54.14 and 39.2%
molar composition respectively was predicted. Increasing WBFR to 12 increased the
yield of H2 to 78.17%. Further the simulations revealed transesterification contributed to
increase in H2 and CH4 formation. Alkane selectivity decreased with increase in C
number while coke formation increased with C number. Alkene and alkane selectivity
were found to be lower under ATR as compared to SR conditions.
Although simulations reported ATR to be one of the best option to produce H2 from
biodiesel, successful catalytic investigation were not found in the literature at the time of
this review. Ospinal-Jimenez and Colucci [148, 149] carried out ATR of biodiesel and
C3H8O3 on Pt and Rh based catalysts, with only Pt based catalyst resulting in H2
production above 500 °C. The experiments were performed using O2/C of 0.18-0.6 and
S/C ratio of 2-6 at 371-571 oC. A maximum of 25% (g of H2/g of biodiesel) yield was
obtained using an S/C 3.5 and O2/C ratio of 0.6 at 482oC. The major problem associated
with the process was the formation of coke and much less yield of H2. Heavy organic
solvents below 4500 ppm were detected in the condensate. The solvents consisted of
hexane, benzene, heptane, toluene, isooctane, o-xylene, m-xylene and p-xylene. In
another ATR reforming investigation performed by Lin et al. [139] using S/C of 0.6 and
O/C of 1.47 at 900°C, the authors showed that incomplete vaporisation of biodiesel led to
higher C formation by self pyrolysis before entering the reformer during ATR of
biodiesel. Catalytic partial oxidation (CPO) of biodiesel using Rh/γ-Al2O3 and Rh-
substituted pyrochlore catalyst was examined by Siefert et al. [150]. CPO experiments
were performed at 900 °C with O2/C of 1.2 and GHSV of 25000 cm3g
-1cat h
-1 for 100 h.
The reformed gas contained 37 mol % H2, 34 mol % N2, 23.0 mol % CO, 6 mol % CO2,
0.038 mol % Ar, 0.09 mol % CH4, and <0.0001 mol % higher hydrocarbons.
From the literature examined it can be seen that H2 production from biodiesel is relatively
new and only few successful investigations have been reported. SR was shown to be the
most effective process among the three i.e. SR, CPO and ATR processes examined. The
amount of H2 produced by SR was highest compared to the other two processes, as would

Hydrogen production by steam reforming of biodiesel
57
be expected from the stoichiometry of the reaction, and can be carried out at lower
temperatures as compared to CPO and ATR reforming.
3.3 Hydrogen production processes
In 1926, the first CSR plant was built to convert natural gas into a mixture H2 and CO
(synthesis gas) for NH3 production [151]. Since the SR process was then adopted
worldwide to produce H2 from natural gas, naphtha and heavy oil for utilisation in
refineries and NH3 based fertilisers. In refinery H2 is used in hydrotreating and
hydrocracking process to convert the impure heavier petroleum fractions such as vacuum
distillates into clean gasoline or middle distillates [152, 153], where impurities include S,
N, Ni and V metals in the crude. H2 is also the most costly reagent in the manufacture of
CH3OH [154], NH3 [155] and Fisher Tropsch process [156].
Figure 3.3 shows a schematic of CH4 steam reforming (SMR) process. The process in
performed in a minimum of three main stages i.e. reforming, water gas shift and
purification. The first two may consist of more stages, e.g. pre-reforming (the conversion
of the higher hydrocarbon gases in the feedstock to CH4) and primary reforming (CO and
H2 production from CH4), in NH3 production, secondary reforming is used too, and then
high temperature and low temperature water gas shift. When performing small scale SR
for research purposes on unconventional feedstocks such as biodiesel, primary reforming
of the received feedstock is the most challenging. In the primary reforming stage the
hydrocarbon feedstock is reacted with steam to produce synthesis gas. Here we use CH4
as an example, as it is the most common SR feedstock which makes SMR currently the
single largest producer of H2 in the world. As CH4 is a very stable molecule, severe
temperature and pressure conditions are required for the reaction. Temperature typically
over 800 oC and pressure between 15-30 bars is required for converting it to H2, CO, CO2
and H2O by the following reaction (R-3.1). The reaction is performed in tubular reactors

Hydrogen production by steam reforming of biodiesel
58
called reformers on Ni based catalyst with H2O/CH4 ratio typically between 2 to 5. Alkali
metals are used in the catalyst to accelerate coke removal. Excess steam is used to
prevent thermal cracking and coke formation. When naphtha is used as the feedstock,
conditions are very similar but the catalyst is modified to prevent coking from
decomposition of the higher hydrocarbons. The SR reaction is strongly endothermic, and
reactor designs in SR industrial plants are typically limited by heat transfer, rather than
by reaction kinetics [157].
cat
m n 2 2 , 298K
nC H +mH O mCO+(m+ )H ΔH 0
2f
(3.1)
The excess steam and CO produced in the reformer are reacted with steam in shift
reactors to produce H2 and CO2 by R-3.2. The water gas shift reaction (WGS) is
performed at two different temperatures i.e. high temperature water gas shift (400-300°C)
and low temperature water gas shift (300-200°C). The heat removed while lowering the
temperature of the reformate gas to the WGS temperatures is utilised in preheating of the
feed or generate steam for the reforming reaction. A chromium based catalyst is used for
high temperature WGS in comparison to copper based for to temperature WGS
2 2 2
cat
, 298KO ΔH -41.2. kJ/mol CO+H CO +H COf (3.2)
Finally the gas leaving the WGS reactors can be sent to the purification step which most
commonly consists of pressure swing adsorber (PSA) although other methods are also
used. The PSA process removes trace impurities such as CO, CO2 N2, CH4, and H2O to
deliver high purity H2. In a different type of purification step the H2 rich gas leaving the
shift reactors is feed to amine scrubbing/stripping columns where most of the CO2 is
removed and the other impurities such as CO is removed in the methanation reaction
(reverse R-3.1) and finally H2 gas leaves the methanator. The choice of the purification
method will depend on the end use and the desired purity of H2.

Hydrogen production by steam reforming of biodiesel
59
Figure 3.3: Schematic of the SMR process [158].
Although the SR process is highly efficient it has numerous disadvantages. The SR is a
highly endothermic reaction and requires burning large amount of fossil fuels to supply
the heat required to maintain the reaction. This generates large amount of CO2 and can
cause uneven heating of the reformer tubes leading to hot spots and reduced reformer life.
The uneven heating could also result in formation of C leading to catalyst deactivation.
3.3.1 Partial oxidation
As SR is an energy consuming process, extensive work has been done on an alternative
process for H2 production. Partial oxidation (POX) is a process where O2 is used to react
with hydrocarbons to produce H2 and CO. In POX (R-3.3), using CH4 as a feedstock, an
O2/CH4 molar ratio of 0.5 is used to produce H2/CO of 2. The POX reaction is
exothermic, making it desirable as compared to SR. If higher O2/C is fed, the combustion
reaction (R-3.4) occurs, resulting in the formation of CO2 and H2O instead of the desired
CO and H2. WGS also occurs in POX producing H2 and CO2 from the syngas product via
Hydrogen production by steam reforming of biodiesel
60
(R-3.2). POX is faster than SR and requires smaller reactors and, according to [151],
higher productivity. The major limitation of POX is carrying out the reaction under
flammable and explosive environments. Hot spots can develop, affecting the life of the
catalyst [159]. Under oxidation environments, gas phase reactions lead to the formation
of C on catalyst surface [160]. The POX systems have high energy consumption and less
suitable H2/N2-ratios in the produced synthesis gas to be used in NH3 production and the
energy in the PSA purge gas cannot be fully recovered. The application of POX to
produce H2 from alcohols would lead to lower efficiency due to the oxidation of alcohols
forming CO2 and H2O. Lower conversion and selectivity is reported in POX of alcohols
such as CH3OH on monometallic catalyst [161].
m n 2 2 , 298K
m nC H + O mCO+ H ΔH 0
2 2f (3.3)
m n 2 2 2 , 298KC H +(m+ )O mCO +( )H O ΔH 04 2
f
n n (3.4)
3.3.2 Autothermal reforming
Although SR provides higher efficiency and reformates quality, the reaction is highly
endothermic and requires an external heat source to supply the heat for the reaction.
ATR is a combination of (SR) and (POX) in a single reactor and is overall a slightly
exothermic reaction [157]. Reaction (R-3.5) shows a typical reaction occurring in an
ATR reformer.
m n 2 2 2 f, 298K
m m m nC H + H O+ O mCO+( + )H ΔH -/=0
2 4 2 2 (3.5)
The process was developed by Haldor Topsoe in 1950s [151]. It has been increasingly
accepted as the most appropriate processes for the future fuel cell vehicles and is also
used in chemical processes [162, 163]. The heat generated by the reaction can be
controlled directly by adjusting the proportions of fuel and air/O2 in the feed. In
comparison to SR, POX and ATR processes have the merits of fast start-up times because
of the exothermic nature of the oxidation reaction and lower rate of side reactions and
Hydrogen production by steam reforming of biodiesel
61
fewer by-products. The main characteristics of ATR are a low energy requirement (due to
the complementary SR and POX reactions), low energy consumption, high gas space
velocity (GHSV; at least one order of magnitude greater than traditional SR), and a preset
H2/CO ratio regulated by inlet reactant ratios and CO2 recycling [164]. ATR is considered
to be one of the most attractive options for the on-board reforming of complex
hydrocarbons such as kerosene and diesel [165, 166]. The ATR reaction is more selective
to CO2 than CO making it compatible with PEMFC’s for automotive applications [162,
167].
In spite of all these advantages the technology has not be commercialised yet and further
research has to be carried out for successful application. The ATR process produces
lower H2 yield as compared to SR but higher than POX. When using air as the oxidant,
the inert N2 dilutes the products obtained from the reformer. As ATR incorporates POX
reaction, both the processes require an expensive and complex oxygen separation unit in
order to feed pure oxygen to the reactor in order to prevent product gas dilution with N2.
The use of pure O2 means formation of explosive environments is possible leading to
explosions.
3.3.3 Conclusion
Table 3.5 shows the comparison of various reforming technologies. In all the three
processes, SR is quite successful and has been widely used in H2 production. Highest H2
yield is obtained in SR as compared to POX and ATR processes. For e.g., maximum H2
yield from SMR is 4 mol/mol of CH4 (or 50 wt% of CH4) with a max purity of 80 vol%,
compared to 3 mol/mol (or 37.5 wt%), with a max H2 purity of 75 vol% from POX of
CH4.
The process has been widely researched for H2 production from oxygenated hydrocarbon
such as DME or CH3OH which has to be reformed at much lower temperature (>180°)
[168, 169] and > 500°C for other hydrocarbons such as C2H5OH [170, 171]. Higher and

Hydrogen production by steam reforming of biodiesel
62
much more complex oxygenated hydrocarbon such as sunflower oil [172], rapeseed oil
[173] and waste cooking oil [174] are also converted to H2 using SR processes.
In order to improve the thermal efficiency of the SR, new processes such as chemical
looping reforming (CLR) and sorption enhanced SR have been developed. The
Autothermal Cyclic Reforming (ACR) process was developed by Kumar et al [175],
which is operated in three-step cycle that involves SR of fuel on Ni catalyst (reforming),
oxidation Ni catalyst (air regeneration) to heat the reactor and the reduction of the
catalyst to its original state (fuel regeneration). The process has several advantages as it
incorporates SR over ATR and requires less energy compared to conventional SR. It has
higher efficiency due to lower internal heat generation by fuel oxidation. High purity H2
is obtained due to the absence of N2 in the product gas. The C formed on the catalyst
surface is burnt during the regeneration step, generating the heat required for the
endothermic SR process. The process is already proved to work with complex
hydrocarbons such as waste cooking oil [174].
Table 3.5: Comparison of reforming technologies [176].
Technology Advantages Disadvantages
SR
Most extensive industrial application.
Oxygen not required.
Lowest process temperature.
Best H2/CO ratio for H2 production.
Highest atmospheric emissions.
POX
Decreased desulfurization requirement
No catalyst required.
Low CH4 slip.
Very high processing
temperatures.
Low H2/CO ratio.
Soot formation/handling adds
process complexity. Higher risk
of explosion, requires O2 for
undiluted syngas
ATR Lower process temperature than POX
Low CH4 slip.
Limited commercial experience.
Requires O2 for undiluted
syngas.

Hydrogen production by steam reforming of biodiesel
63
3.4 Hydrogen production catalysts
Generically a catalyst is defined as a material that has the ability to increase the rate of a
chemical reaction without altering its overall Gibbs energy change. The catalyst is not a
reactant or product, but is an intermediate that undergoes a cycle. In a heterogeneous
catalytic system where the catalyst exits in a different phase than reactants or products, it
may form intermediates, but according to definition it should not interfere in a chemical
reaction. The most important parameter to be considered during a catalyst selection is the
activity of the catalyst. The ability of the catalyst to convert reactants into products is
defined as catalyst activity. The second most important parameter to be considered is the
selectivity of the catalyst. Selectivity defines the ability of the catalyst to produce desired
products over undesired products. In addition to these two factors, ‘life’ is another most
important factor to be considered during catalyst selection. The life of the catalyst is
defined as the time for which decent activity and selectivity is maintained.
A SR catalyst must be able to promote the SR reaction and suppress or minimise other
side reactions such as C deposition or the methanation reaction. The catalyst should be
active for WGS reaction which would help to reduce CO and increase H2 selectivity.
Prior to SR reaction, the catalyst has to be reduced in order to catalyse the reaction
between the fuel and steam via SR and WGS reaction. Hence the catalyst should have
complete reduction ability in order to exhibit high SR and WGS activity. The catalyst
should have sufficient mechanical strength and should be able to withstand high
temperature (~800 °C) and pressure for industrial utilisation.
The catalysts used for H2 can be divided into two types: non-precious metal (typically Ni)
and precious metals from Group VIII elements (typically Pt or Rh based). Due to severe
mass and heat transfer limitations, conventional steam reformers are limited to an
effectiveness factor for the catalyst which is typically less than 5%. The effectiveness
factor is the measure of how far the reactant diffuses into a catalyst pellet before reacting.
As a result kinetics and catalyst activity are not the limiting factor for conventional steam
Hydrogen production by steam reforming of biodiesel
64
reformers, so cheaper Ni catalyst are universally used [176]. The spent Ni catalyst can be
recycled and reused easily as compared to noble metals.
3.4.1 Nickel catalysts
Traditionally SMR reforming catalysts are usually deposited on ceramic or metallic
monoliths, based on Ni / NiO or cobalt compositions on foams, or other structured inert
supports. Depending on the refractory Al2O3 or supports such as magnesium Al2O3 spinel
are promoted with alkali or alkali-earth metals to facilitate C removal [177]. The Ni
based catalysts are widely investigated for H2 production from liquid or gaseous
hydrocarbons, oxygenated or not. The applications of Ni based catalysts in SMR process
was reviewed by Giannakeas et al. [178]. The author examined use of various
formulations for SMR and reported that Ni-Co based catalysts as one of the promising
candidate for SMR and chemical looping steam reforming (CLR) of CH4.
The focus of this section is to review the use of Ni catalyst for CSR of oxygenated
hydrocarbons. CSR of four different types of oils rapeseed oil, soybean, corn oil and
sunflower oil using commercial Ni catalyst and a hydrotalcite precursor based Ni (HT)
catalyst was investigated by Marquevich et al. [173]. The experiments were performed in
an isothermal fixed-bed tubular reactor at steam-to-carbon (S/C) ratios of 9, 6, and 3 and
temperatures between 500 and 630 °C and high space velocities of 0.76-1.90 mol C/ (gcat
h). H2 productions were from 0.3 to 7.5 mol H2/ (gNi h) depending on the operating
conditions. The HT catalyst, which was prepared from a hydrotalcite-such as precursor,
seemed promising for CSR of vegetable oils because of its very high activity per gram of
catalyst. The performance of the catalyst at same temperature and S/C ratio was
independent on the type of vegetable oil. The HT catalyst had almost 10 times more
catalytic activity than the commercial catalysts [132, 172, 179]. CSR of waste cooking
oil using Ni based catalyst supplied by United Catalysts was examined by French and
Czernik [180]. At 750 ˚C the highest conversion of 96% was achieved with 70% of the
stoichiometric H2 yield potential for 16 hours of operation.

Hydrogen production by steam reforming of biodiesel
65
CLR of waste cooking oil was studied by Pimenidou et al. [174] using a packed bed
reactor with a Ni/Al2O3 catalyst. The S/C of 4 and temperatures between 600 and 700 oC
yielded the best results. Six cycles at two weighted hourly space velocities (WHSV of
2.64 and 5.28 h−1
) yielded high (>0.74) and low (<0.2) oil conversion respectively.
WHSV of 2.64 h-1
exhibited conversions close to thermodynamic evaluations. Pimenidou
et al. [181] performed sorption enhanced CLR of waste cooking oil with S/C of 4 at 600
°C. Higher fuel and steam conversion were reported in the presence of the sorbent
dolomite than without it. Initially, the dolomite carbonation was very high (100%), and
98% H2 purity was obtained, but the carbonation decreased to around 56% with a H2
purity of 95% respectively in the following cycles. Reduction of the Ni catalyst occurred
along with CSR, WGS and carbonation, with H2 produced continuously under fuel–steam
feeds. Catalyst and CO2-sorbent regeneration was reported, and a long period of
autothermal operation within each cycle was demonstrated.
Ni supported on various supports for CSR of C2H5OH (CSRE) has been widely
investigated by several research groups. Alberton et al. [182] studied the CSRE over Ni
supported Al2O3 catalyst at 600 °C and S/C of 1.5. The effect of type of Al2O3 on the
CSRE was examined. A catalyst supported on α-Al2O3 showed lower catalytic activity in
comparison with catalyst supported on γ-Al2O3 due to lower dispersion of Ni particles.
Chen et al. [183] performed CSR of C3H8O3 over CRG-LHR Johnson Matthey catalyst
containing NiO, Cr2O3, MgO and amorphous silica. The experiments were performed in
the temperature range 400-600 °C, with S/C of 3 and reactant/inert gas of 1/4. The
highest H2 yield of 88.57% with C3H8O3 conversion over >96% were reported at 580 °C
with the above conditions. H2 selectivity was shown to increase with temperature;
reaching 100% at ~580 °C.
The process of sorption enhanced steam reforming (SESR) has been investigated with
pure C3H8O3 and crude C3H8O3 as the feedstock. In this process, a high temperature solid

Hydrogen production by steam reforming of biodiesel
66
CO2 sorbent is introduced within the reformer to modify equilibrium conditions through
the in situ removal of the CO2 gas, resulting in higher H2 yields and purity. Dou et al.
[184, 185] reported complete conversion and 68% H2 purity for crude C3H8O3 in
comparison with 65 vol% for pure C3H8O3 at 600 °C over 18 wt% NiO/Al2O3 catalyst
with S/C of 3 in CSR of C3H8O3 without CO2 removal. But in the presence of the CO2-
sorbent calcined dolomite the H2 purity increased to 90 and 94 vol% for crude and pure
C3H8O3 respectively through the effects of CO2 in situ capture [183]. Likewise complete
conversion and higher H2 purity of 99% with S/C of 3 with 25%-Ni-15%-Co/ HT type
catalyst was reported by He et al [186].
Hu and Lu [187] investigated the CSR of CH3COOH (CSRA) for H2 production over 20
wt% transition metals (Ni, Co, Fe or Cu) supported on Al2O3 catalyst. Ni/Al2O3 and
Co/Al2O3 were reported to have high activity in comparison with Fe/Al2O3 and Cu/Al2O3,
in SRA, The difference in catalytic activity was attributed to the cracking activity of the
metals toward the C–C and C–H bonds of acetic acid. The experiments were carried out
in the temperature range of 300-800°C with S/A of 15, liquid hourly space velocity
LHSV = 8.3 h− 1
and 1 atm. The Ni/Al2O3 exhibited a more stable activity than the
Co/Al2O3 catalyst.
It can be seen from above that Ni based catalysts can widely be applied for different H2
production processes based on CSR. They can be applied for CSR of a variety of simple
and complex oxygenated hydrocarbons from C2H5OH to vegetable oil. These catalysts
can work at various S/C ratio, temperature, Ni loading and residence time successfully.
The main disadvantage of using Ni based catalyst is the formation of C on the catalyst
surface. Several methods are suggested to minimise C formation. One of the few
methods adapted to decrease C formation is the use of bimetallic catalysts or using
modified support.

Hydrogen production by steam reforming of biodiesel
67
3.4.2 Ceria as catalyst support
CeO2 based materials have recently received a lot of attention in a wide range of
applications. CeO2 plays an important role in two of the most important commercial
catalytic processes: three-way catalysis (TWC) in the automotive industry and fluid
catalytic cracking (FCC) [188] in refinery operations. Other applications include diesel
soot oxidation [189], oxidation of volatile organic wastes [190] and fuel cell technology
[191, 192]. In all these applications the unique features are responsible for making CeO2
a promising material for use either as a support or as an active catalyst.
The most important property of a CeO2 based material is its oxygen storage capacity
(OSC) by means of redox shift between Ce3+
and Ce4+
under not only oxidizing but also
reduction environments [193]. The OSC ability of CeO2 helps reduce the formation of C,
during H2 production, CH4 oxidation, CH4 decomposition, and ethylene dehydrogenation.
Further, Ni supported CeO2 based catalysts have exhibited self-decoking capability by
promoting C gasification reaction by oxygen species supplemented from the lattice
oxygen [194]. It is also well known to promote metal activity and dispersion, resulting in
investigations of various catalytic formulations for a wide range of reactions.
CeO2 is widely investigated material as catalyst support for H2 production from various
non oxygenated and oxygenated hydrocarbons. Several investigation involving CSR and
ATR of various liquid [192, 195-197] and gaseous hydrocarbons [198-200] using CeO2
based catalyst have been reported. Similarly H2 production of oxygenates such as
CH3OH, C2H5OH, C3H8O3 and propanol using CeO2 based catalysts have been
investigated [170, 171, 201-203]. However, CeO2 lacks thermal stability and is known to
sinter at temperature above 800 oC [204], leading to catalyst deactivation [205, 206]. At
high temperature the specific surface area of CeO2 decreases drastically which in turn
affects the crucial redox properties i.e. OSC of the material [207]. It was reported that the
of rate of O-2
depends on the surface area of CeO2 as a result the reduction in surface area
Hydrogen production by steam reforming of biodiesel
68
affects O-2
release thus affecting the redox properties of CeO2. Similarly reduction of
surface area reduces the redox sites by affecting the OSC of the material [208]. CeO2 has
weakly bound oxygen species (Frenkel type oxygen defects) in the bulk of the material
rather than to the surface, these weakly bound oxygen species undergo fast exchange with
the environment and provide OSC. The defects are shown to disappear due to high
temperature treatment affecting the OSC of the material [209].
The OSC of pure CeO2 is unsatisfactory for practical applications. The CeO2 crystal
consists of eight oxygen cations coordinated at a corner of cube, each anion being
tetrahedrally coordinated by four cations. This makes its structure more stable and
prevents the conversion of Ce4+
to Ce3+
under reducing conditions. Metal decoration has
been observed for metal catalysts supported on reducible oxides [210]. Degradation of
catalytic activity is also caused by decreases in metal surface area of the supported
catalysts [211].
H2 production via SR is endothermic and has to be carried out at high temperature i.e.
800 oC for CH4 feedstock or higher, resulting in decrease in surface area by ~ 30% with
operation for 10 h [205]. Similarly the increase in the temperature of the CeO2 supported
catalyst in case of exothermic reactions such as PO would result in sintering of the CeO2
and affecting the activity of the catalyst. Improvement of the thermal properties of CeO2
and retention of active surface area at high temperature is thus necessary to exploit the
redox property of CeO2 for H2 production applications via high temperature processes.
Substitution of CeO2 with metal/metal oxide into the CeO2 lattice forms composite
oxides. It can easily form solid solutions with elements belonging to the transition-metal
series. Ionic mobility is modified by replacement of Ce ions by different cations of
varying size and/or charge resulting in the formation of a defective fluorite structured
solid solution. Transition and non transition metal ions such as Al3+
, Si4+
, Ti4+
, and Zr
4+
are introduced into the CeO2 cubic structure [153-157] to counteract these drawbacks.

Hydrogen production by steam reforming of biodiesel
69
This modification of CeO2 lattice confers properties such as resistance to sintering and
high catalytic activity according to [207]. Incorporation of Zr increases the specific
surface area, OSC, redox property, thermal stability and catalytic activity of CeO2 for
variety of reactions from oxidation to H2 production [33-35]. The doped support also
affects the dispersion of metals. Further addition of Zr to CeO2 also helps in mitigating
the formation of C during various H2 production processes [212].
The incorporation of Zr4+
or Hf4+
into the CeO2 lattice was found to facilitate an increase
in the formation of smaller particle sizes. Addition of Zr was found to increase the
support metal interactions between the support and the metal. The presence of Zr
increased the oxygen mobility in the CeO2 lattice and the process of vacancy formation
was promoted [213-215]. As a result the increased oxygen mobility helps in reducing
carbon deposits formed at the metal and support interface and prevent carbon build up on
the catalyst surface, keeping the metal surface clean for reforming reactions. Dong et
al.[216] and Roh et al.[217] found that mobile oxygen species formed in the Ce-ZrO2
supported catalyst via a redox cycle enhanced decoking activity resulting higher SMR
and ATRM activity. Figure 3.4 shows mechanism of CH4 conversion in SMR and ATRM
using Ni/Ce-ZrO2 catalyst. Formations of composite layers of material were thought to be
the reason for high activity. The composite was made of three different layers with top
layer consisting of free Ni species followed by second layer of strongly interacted Ni and
Ce–ZrO2 forming –Ce–Zr–Ox, finally the last layer of Ce–ZrO2 support. The participation
of the lattice oxygen was supplemented by the presence of O2 molecules.
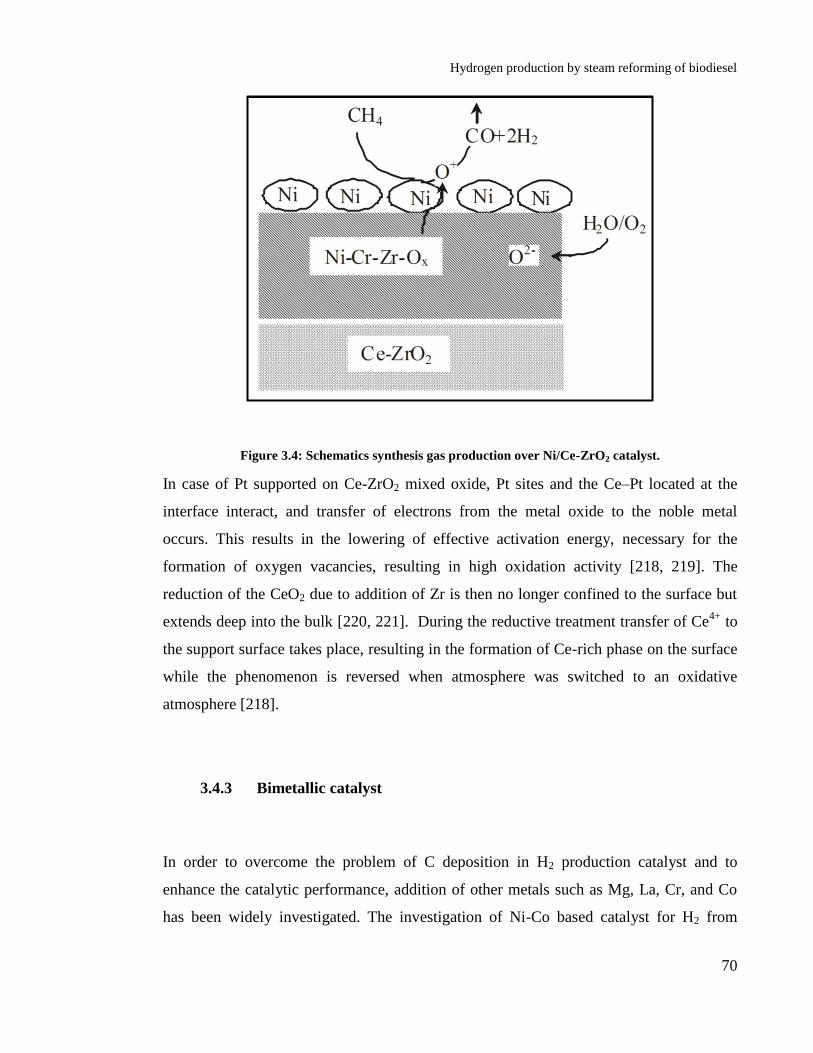
Hydrogen production by steam reforming of biodiesel
70
Figure 3.4: Schematics synthesis gas production over Ni/Ce-ZrO2 catalyst.
In case of Pt supported on Ce-ZrO2 mixed oxide, Pt sites and the Ce–Pt located at the
interface interact, and transfer of electrons from the metal oxide to the noble metal
occurs. This results in the lowering of effective activation energy, necessary for the
formation of oxygen vacancies, resulting in high oxidation activity [218, 219]. The
reduction of the CeO2 due to addition of Zr is then no longer confined to the surface but
extends deep into the bulk [220, 221]. During the reductive treatment transfer of Ce4+
to
the support surface takes place, resulting in the formation of Ce-rich phase on the surface
while the phenomenon is reversed when atmosphere was switched to an oxidative
atmosphere [218].
3.4.3 Bimetallic catalyst
In order to overcome the problem of C deposition in H2 production catalyst and to
enhance the catalytic performance, addition of other metals such as Mg, La, Cr, and Co
has been widely investigated. The investigation of Ni-Co based catalyst for H2 from

Hydrogen production by steam reforming of biodiesel
71
oxygenated hydrocarbons such as C2H5OH, C3H8O3, CH3COOH and gaseous
hydrocarbons such as CH4, biogas was compiled and reviewed by Giannakeas et al. [178].
The author attributed the positive effect of Co addition to the chemical synergism between
the Ni and Co metals. Furthermore significantly lower temperature of reduction is needed in
comparison with that of the monometallic systems. In a different approach to reduce C
formation use of bimetallic catalyst using alkali metals such as K and Sn [222] and Bi
[223] to the catalyst have been investigated. Addition of K or Ca to alumina neutralizes
acidic sites of Al2O3 and reducing the possibility of coke formation suppressing cracking
and polymerization reactions [224]. Carbon gasification reaction is enhanced by addition
of K and Ca affecting C deposited on the catalyst surface [225]. It also increases the
adsorption of steam on the catalyst surface [226] affecting SR reaction. According to
Trimm [222] carbide formation is an essential intermediate route to coke formation,
formed by interaction of 2p carbon electrons with 3d Ni electrons. Addition of penta-
valent p metals (such as Ge, Sn and Pb or As, Sb or Bi) interacts with Ni3d electrons,
thereby reducing the chance of NiC formation in turn affecting carbon formation.
Pengpanich et al [227] found addition of Sn to NiO disrupted the active site ensembles
responsible for coking. Solubility of carbon in Ni particles responsible for NiC formation
is also reduced by addition of Sn to Ni catalyst.
Espinal et al. [228] investigated the use of K to Co hydrotalcite with molar composition
(Co: Mg: Al) of 1:2:1 in CSR of bioethanol. Addition of K was responsible for
neutralising the number and strength of the acid sites resulting in stable long-term
experiments, with very little amount of C formation. The authors reported that formation
of ((Co, Mg) O) during the reaction was the active complex formed due to K addition
responsible for the high activity of the catalyst. The addition of K to Co/Ce-Zr had a
positive effect on the activity of catalyst in ATR of C2H5OH. The conversion of C2H5OH
increased from 46 to 98% with addition of K to the catalyst. The effect of oxidation
treatment over CoRhK/Ce-Zr catalyst was also studied by the authors. In comparison to
CoK/Ce-Zr catalyst, CoRhK/Ce-Zr catalyst regained its catalytic activity after oxidation
and the catalyst produced H2 at low temperature of 320°C. In CSRA, Iwasa et al. [229]

Hydrogen production by steam reforming of biodiesel
72
reported that addition of K to Ni/ Smectite had the best effect among Li, Na, K, and Rh or
Cs dopants. The addition of 1 wt% K increased reduction of Ni species incorporated in
the smectite, yielding more metallic Ni species than undoped Ni/Smectite sample thus
giving high activity for the K-modified Ni/Smectite catalyst. In case of complex
hydrocarbons such as kerosene, addition of K to the catalyst increased the conversion of
kerosene and H2 produced Yu et al. [230] Although K addition, increased CH4 selectivity
as a result of reduced CH4 decomposition, during the CSR reaction.
3.5 Research Rationale
The use of FAME as a diesel engine fuel has been widely investigated due to its many
advantages over vegetable oil as a transport fuel. Analysis of the “Well to Wheel” CO2
emissions of biodiesel have reported a reduction between 50 to 80% in comparison to
those of petroleum diesel. The recent boom in H2 energy technology has resulted in
several investigations of H2 production from various hydrocarbons and oxygenated
hydrocarbons such as ethanol, butanol vegetable oil and bio-oil. On the other hand, H2
production from biodiesel is very new and only few successful investigations have been
reported.
There are several advantages of using biodiesel as a H2 carrier. One of the important
advantage of using biodiesel as H2 carrier is its renewable nature. First of all, the process
for making biodiesel from vegetable / waste cooking oil and animal fat is well-known and
a commercialised process. Use of biodiesel as hydrogen carrier would result in lower
GHG emissions, since the CO2 generated during H2 production would be used by plants
grown to produce oil for biodiesel. If ethyl esters are used for H2 production, advantage
of totally recyclable CO2 cycle can be obtained since ethanol can be produced from
biomass. Biodiesel production is predicted to increase from 21750 thousand tonnes per
year in 2011 to 39150 by 2020. As a result, assured and continuous supply of biodiesel
would be available for H2 production. Biodiesel contains 11-12 wt % H2. For e.g. steam

Hydrogen production by steam reforming of biodiesel
73
reforming of ethanol will produce 13 wt % of hydrogen from ethanol, which is
considerably less in comparison to steam reforming of methyl oleate producing 23 wt %
of methyl oleate. Biodiesel contains lower oxygen (11 wt %) which is considerably
lower than ethanol (35 wt %) or bio-oil (65 wt %). The presence of oxygen would affect
hydrogen production lowering hydrogen yield.
Biodiesel has shorter carbon chain length compared to vegetable oil making it easier to
convert to H2 and is expected to form relatively lower amount of carbon. Waste cooking
oil contains free fatty acids formed as a result of cooking or frying processes. These free
fatty acids are responsible for formation of aromatics which are known precursors for
carbon formation during hydrogen production processes. The free fatly acids are removed
during biodiesel production in turn affecting the life of catalyst during hydrogen
production. Similarly biodiesel lacks aromatics present in diesel again responsible for
carbon formation during hydrogen production. Similarly other catalyst poisons like
sulphur, chlorine, phosphorus and calcium are absent in biodiesel, increasing catalyst life.
Biodiesel is non-toxic, biodegradable, handling and storage are much safer than
conventional petroleum diesel fuel due to high flash point. Biodiesel has higher energy
density ~40 MJ/kg in comparison to 29.7 and 15-19 MJ/kg for ethanol and bio-oil
respectively. As a result of high energy density, lower amount of biodiesel would be
required to be combusted in hydrogen production process such as autothermal reforming
to generate the internal heat required to drive the process. Other advantages like higher
lubricity and lower viscosity would be useful for injectors and pumps used in hydrogen
production processes. Absence of compounds like sulphur would prevent the formation
of SO2 in hydrogen production processes like autothermal and chemical looping
reforming. Biodiesel produced from waste cooking oil is cheaper as cost of waste
cooking oil is almost free. As of today the cost of biodiesel on a petrol station is £ 1/l in
comparison to 1.3£/l for diesel. The hydrogen produced from this type of biodiesel would
cheaper as compared to hydrogen produced from diesel. New sources of oil i.e. non
edible oils like Jatropha, Karanja or algae are being investigated widely to reduce the cost
of biodiesel and in turn reduce the cost of H2 produced.

Hydrogen production by steam reforming of biodiesel
74
3.6 Aim and Objective
The aim of this research project is to investigate hydrogen production from biodiesel via
steam and autothermal reforming. To accomplish this aim, the following objectives are
drawn.
Design and commission an experimental set up for hydrogen production via steam
and autothermal reforming of biodiesel.
The important tasks involved to fulfil this objective were design and
building of vaporisers for biodiesel and water.
Building a frame for the installation of the vaporisers and the reactor.
Selection of PID controllers and building of the controller unit for
mounting the PID controller and the necessary electronics.
Pipe work for connecting the vaporisers and the reactor.
Installing and commissioning of micro-GC for the analysis of the
products coming out of the reactor. Building a condenser for cooling the
reactor gases and separating the condensed vapours from the gases.
Preparation of an effective H2 production catalyst exhibiting high H2 yield,
biodiesel and steam conversion.
Examining the effect of catalyst preparation methods and types via catalyst
characterisation techniques for catalyst selection.
Testing the prepared and commercial catalyst in the reactor. Performing mass
balance calculations for determining H2 yield, biodiesel and steam conversions in
addition to H2 selectivity along with selectivities of carbon gases. Comparison of
experimental results with equilibrium counter parts to determine the process
efficiency.
Optimisation of operating parameters such as biodiesel preheating to maximize H2
yield, biodiesel and steam conversion.

Hydrogen production by steam reforming of biodiesel
75
Determine the optimum reactor temperature in order to maximize H2
production.
Determining the effect of S/C and WHSV on H2 yield in addition to
biodiesel and steam conversion.
To analyse the effect of biodiesel types on the performance of the steam
reforming process.
Characterisation of used steam reforming catalyst and calculation of overall
system efficiency by calculating the carbon balance of the process.
The characterisation work would involve XRD of the used catalyst to
determine the sintering of the catalyst.
Similarly examining the surface area of the used catalyst to access signs of
surface area reduction.
Examining autothermal reforming of biodiesel using the optimised parameters
such as S/C ratio, WHSV, vaporiser temperatures and reactor temperature
obtained from steam reforming experiments.
The examination of O2/C, S/C and WHSV on the performance of
autothermal reforming process.
Evaluation of process performance and efficiency by performing mass and
energy balances.
Comparing the experimental results with equilibrium results to determine
process efficiency.
The determination of autothermal conditions will be achieved using
energy balance calculations. Determination on of overall system efficiency
calculation using carbon balance of the process.

Hydrogen production by steam reforming of biodiesel
76
4. Methodology experimental methods and materials
This chapter describes the construction and building of the experimental set up. The
problems associated with it and the solutions implemented to resolve the problems. This
chapter also explains the preparation of biodiesel and catalyst used in the experiments
and it also describes the various methods used for characterisation of the same.
4.1 Reactor design and experimental setup building
The reactor systems used for the experiments were designed and built at the Energy
Research Institute, University of Leeds. They were a replica of an existing larger rig.
Initially the reactor was placed at the top to provide an up flow arrangement. The setup
had to be modified a few times due to the condensation of vapours and steam during the
experiments. The rig consisted of two vaporisers, reactor, pumps, mass flow controllers,
condenser and micro gas chromatograph for the analysis of the products. The vaporisers
consisted of 180 mm long aluminium and stainless steel solid cylinders, heated with
cartridge heaters supplied by Elmatic Cardiff, UK. The cylinders were provided with two
¼ " od stainless tubes in which actual vapourisation of biodiesel and water occurred by
indirect heating. Due to absence of holding mechanism as a result of the size of the
vapouriser tube inert material could not filled in the tubes. In the first of the setups, the
vapourisers were mounted on aluminium plate connected to the frame as shown in Figure
4.1.
A ½ " od SS 310 tube was used as a reactor. The tube placed in an electric furnace (Elite
thermal systems, UK). A special controller unit was built comprising of two limit based
controllers (Watlow Ez zone) used to control the cartridge heaters. A Eurotherm
controller present with the furnace was used for its control. The schematic of the rig with
an up flow arrangement with reactor at the side is shown in the Figure 4.2.
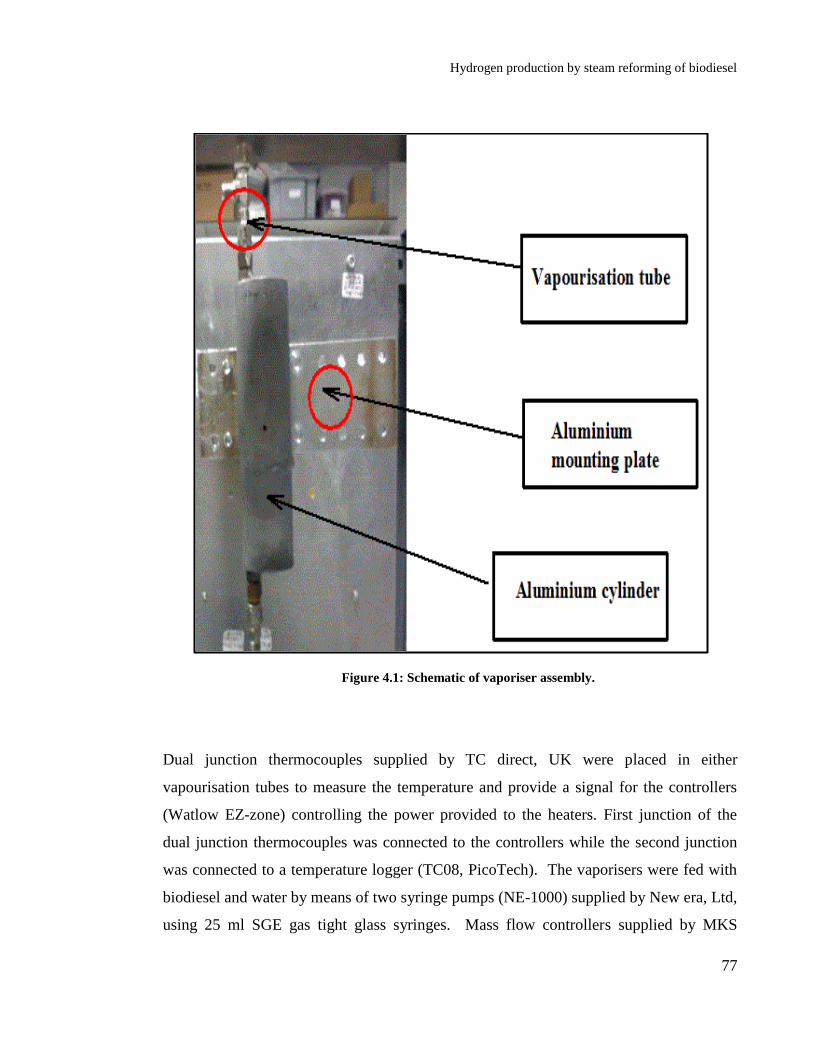
Hydrogen production by steam reforming of biodiesel
77
Figure 4.1: Schematic of vaporiser assembly.
Dual junction thermocouples supplied by TC direct, UK were placed in either
vapourisation tubes to measure the temperature and provide a signal for the controllers
(Watlow EZ-zone) controlling the power provided to the heaters. First junction of the
dual junction thermocouples was connected to the controllers while the second junction
was connected to a temperature logger (TC08, PicoTech). The vaporisers were fed with
biodiesel and water by means of two syringe pumps (NE-1000) supplied by New era, Ltd,
using 25 ml SGE gas tight glass syringes. Mass flow controllers supplied by MKS
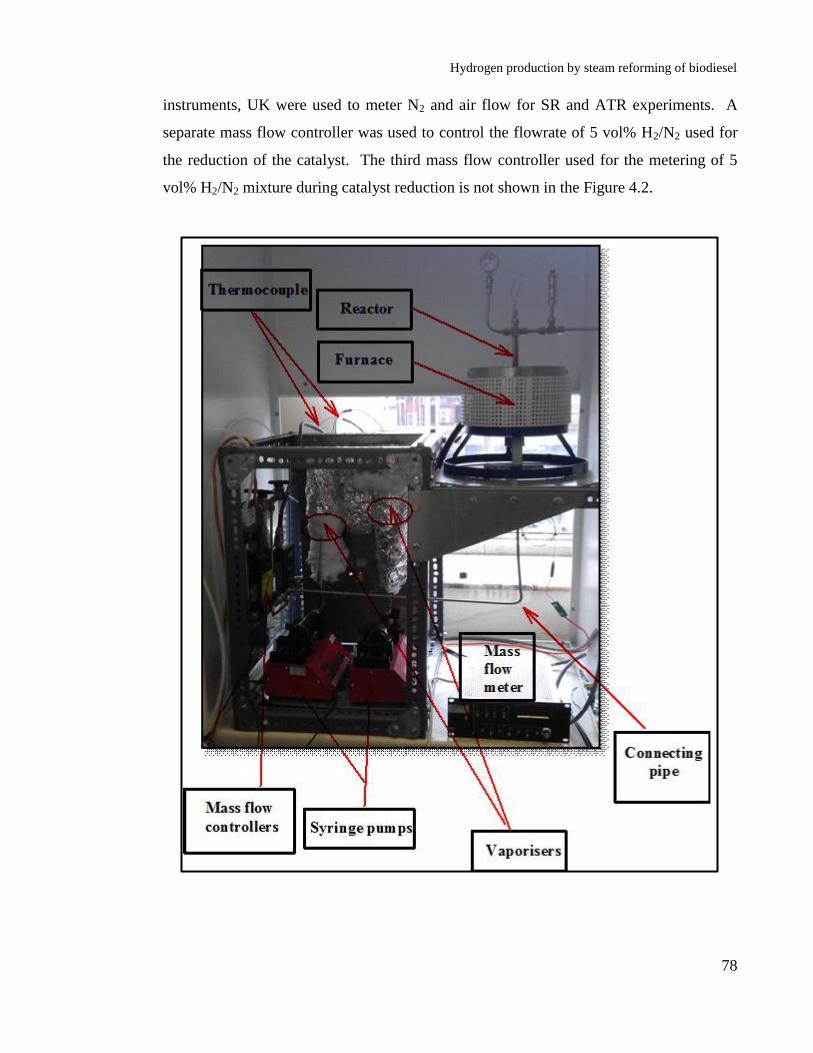
Hydrogen production by steam reforming of biodiesel
78
instruments, UK were used to meter N2 and air flow for SR and ATR experiments. A
separate mass flow controller was used to control the flowrate of 5 vol% H2/N2 used for
the reduction of the catalyst. The third mass flow controller used for the metering of 5
vol% H2/N2 mixture during catalyst reduction is not shown in the Figure 4.2.

Hydrogen production by steam reforming of biodiesel
79
Figure 4.2: Schematic of up flow reactor with reactor at the side. In the Figure the first vapouriser on
the left hand side was used for biodiesel.
The hot vapours from the vapourisers were mixed with N2 below the reactor in a
Swagelok cross provided with a thermocouple as shown in Figure 4.3. This thermocouple
was known as the reactor inlet thermocouple. A second thermocouple was provided in
the reactor bed. Both the thermocouples were connected to the pico-logger for recording
the temperature. Both vaporisers and the furnace were insulated with super wool and
aluminium foil (Figure 4.2) to minimise the heat loss and hence reduce the energy
requirement of the system; the controller associated with each vaporiser was checked and
tuned to the experimental specifications. A series of steam reforming experiments were
performed by setting both the vaporisers at 365°C and reactor temperature of 600°C.
Various different flow rates of biodiesel and steam and N2 were tried.
Figure 4.3: Schematic of up flow reactor inlet.

Hydrogen production by steam reforming of biodiesel
80
The condensation of hot biodiesel vapours and steam with cold N2 resulted in unsteady
reactor operation, resulting in low amounts or no products. In order to improve the
reactor operation and minimise the condensation of reactants, it was decided to move the
reactor at the top of the frame, in line with the vaporisers, and preheat the N2 by making
use of the heat from the heated vaporisers. The two N2 preheating coils were made from
1/8" od copper tubing and were placed on the vaporisers surfaces as shown in the Figure
4.4.
The modified reactor setup with the reactor placed on the top of the vaporisers is shown
in the Figure 4.5. In the figure the first vaporiser on the left hand side was used for
biodiesel. As a result of insulation the N2 preheating coils placed on the vaporisers
(Figure 4.4) are not visible in this figure. In the modified set up the pipe length from the
vaporisers to the reactor was reduced in order to prevent the condensation of the biodiesel
vapours and steam. A non return valve (check valves Figure 4.6) was used to prevent the
flow of the N2 towards the vaporiser and divert it directly in the reactor (Figure 4.6).
Figure 4.4: Schematic of the copper coil used for N2 preheating.

Hydrogen production by steam reforming of biodiesel
81
As the vapour pressure of the steam and biodiesel was smaller than the cracking pressure
of the check valve. The valve remained partially opened resulting in only small amount
of vapours being carried in the reactor to achieve stable operation. The condensed
vapours collected in the pipe and after a while created back pressure on the biodiesel
pump, resulting in the pushing the syringe backwards causing spillage of biodiesel on the
pump body and the experiments had to be stopped. The copper coils also were oxidised
due to constant use. In order to prevent the entire condensation problem, the position of
the reactor was changed a third and final time from up flow to down flow. Figure 4.7
shows a process and instrumentation diagram for down flow reactor system. Figure 4.8
shows the down flow reactor arrangement with stainless steel preheating coils. The coils
were made from ¼" od stainless steel tubing by Swagelok, UK. The coils were made
from 180 mm long ¼" od stainless steel tubing coiled to fit on the vaporisers. The
biodiesel vaporiser was placed at the top of the reactor with water vaporiser to the left of
it as shown in Figure 4.8, to facilitate direct injection of the biodiesel vapours into the
reactor and prevent condensation.
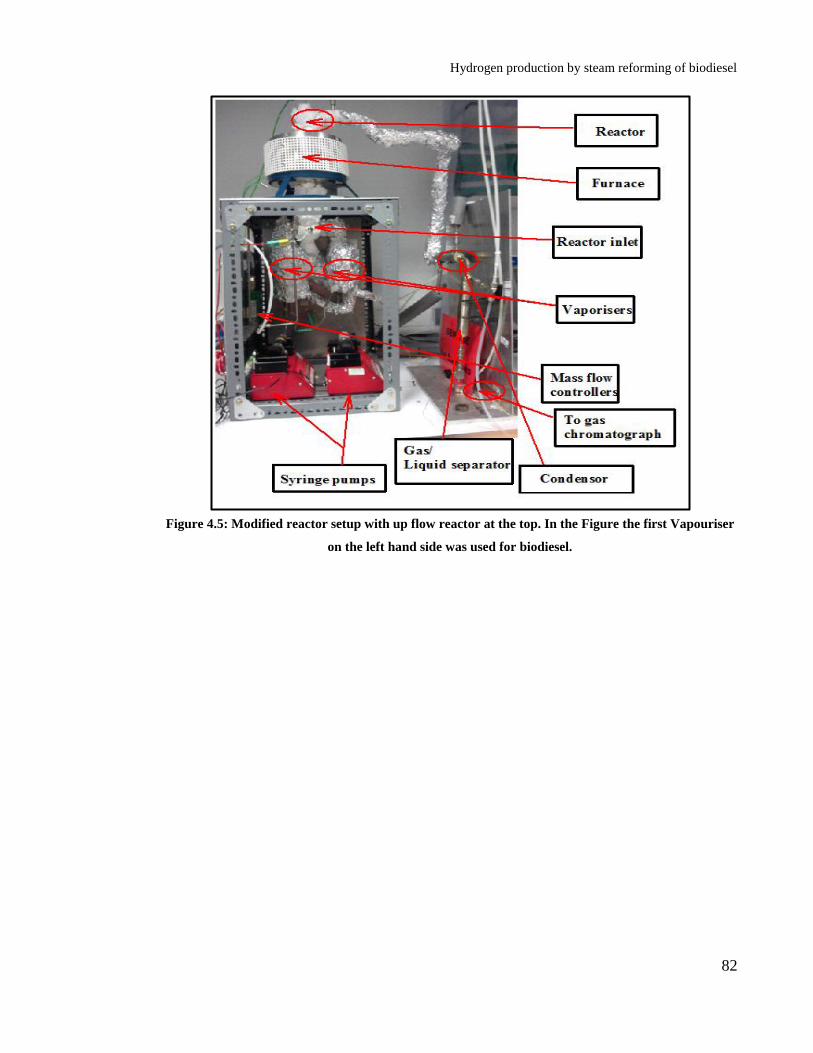
Hydrogen production by steam reforming of biodiesel
82
Figure 4.5: Modified reactor setup with up flow reactor at the top. In the Figure the first Vapouriser
on the left hand side was used for biodiesel.

Hydrogen production by steam reforming of biodiesel
83
Figure 4.6: Schematic of valve assembly used in the modified reactor.
The biodiesel and water vaporisers were connected via ¼" od stainless steel tubing.
During an experiment the biodiesel and water vaporisers were set to the desired
temperature using the Watlow (Ez zone PM controller) and reactor. The desired biodiesel
and water flowrates were maintained by means of the syringe pumps. Reactor
temperature was set by the Eurotherm controller. The hot vapours were mixed with
preheated N2 in Swagelok cross provided with a thermocouple as shown in Figure 4.7.

Hydrogen production by steam reforming of biodiesel
84
Figure 4.7: Process and instrumentation diagram of the down flow experimental set up. In the figure
the green lines represents signal connections and the black are the processes connections.
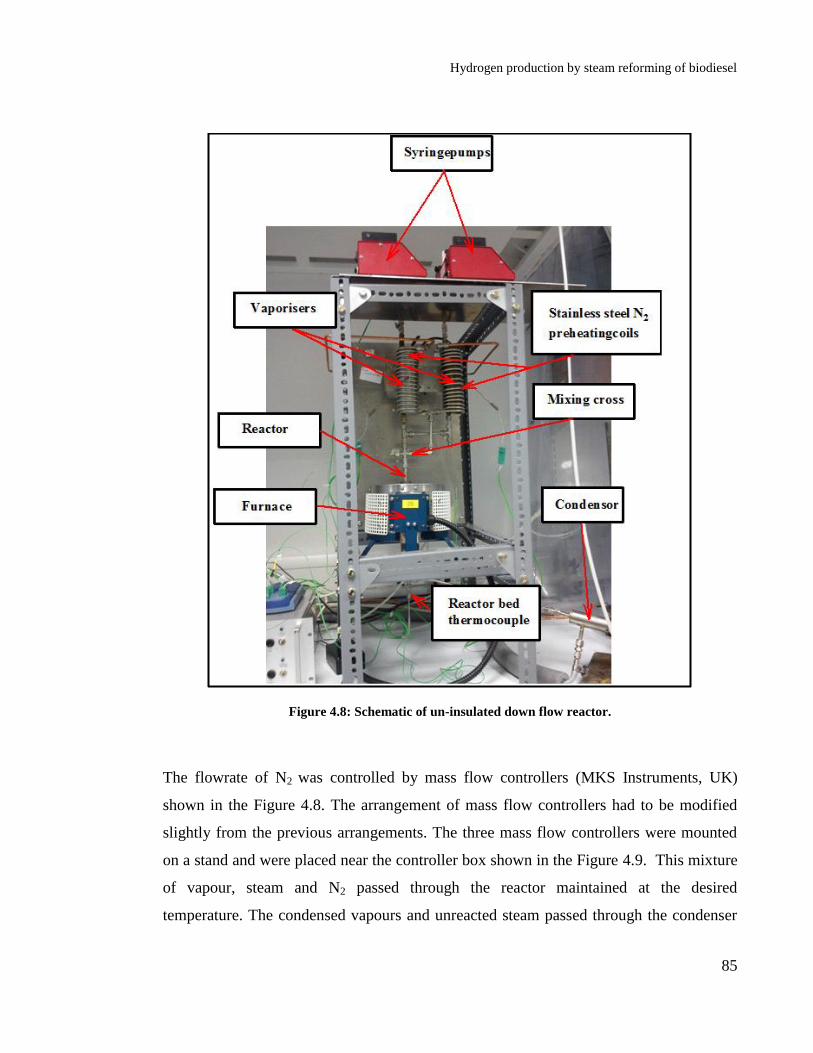
Hydrogen production by steam reforming of biodiesel
85
Figure 4.8: Schematic of un-insulated down flow reactor.
The flowrate of N2 was controlled by mass flow controllers (MKS Instruments, UK)
shown in the Figure 4.8. The arrangement of mass flow controllers had to be modified
slightly from the previous arrangements. The three mass flow controllers were mounted
on a stand and were placed near the controller box shown in the Figure 4.9. This mixture
of vapour, steam and N2 passed through the reactor maintained at the desired
temperature. The condensed vapours and unreacted steam passed through the condenser

Hydrogen production by steam reforming of biodiesel
86
and were collected in the gas/ liquid separator connected to the condenser. The condenser
was a double pipe type, in which the gases and the vapours flowed in the inner pipe and
water was circulated in the annulus between the inner and the outer pipe. Cold water at
1°C was circulated by means of a chiller connected to the condenser. The condensed
vapours and unreacted steam was collected and removed from the bottom of the gas-
liquid separator (Figure 4.10). The product gases (H2, CO, CO2, CH4, C-2 to C-3
hydrocarbons and N2) leave the gas liquid separator and were passed through a silica gel
trap to remove the moisture. The gases were finally transferred to an online gas
chromatograph for composition analysis (Figure 4.10).
Figure 4.9: Arrangement of mass flow controllers and schematic of the controller box.

Hydrogen production by steam reforming of biodiesel
87
The vaporisers were insulated with super wool insulation material (Good fellows, UK) in
order to prevent the heat loss from the preheating coils. To maintain the steam
temperature in the tubing connecting the biodiesel vaporiser and the water vaporiser, a
heating tape was provided as shown in Figure 4.11. The initial investigation, performed
in the absence of the heating tape still revealed steam condensation in the tubing
connecting both the vaporisers, which created back pressure on the water syringe pump.
The heating tape was provided by the engine research group.
Figure 4.10: Condenser and gas drying schematic connected to the micro gas chromatograph.

Hydrogen production by steam reforming of biodiesel
88
.
Figure 4.11: Insulated vaporisers and heating tape arrangement.
4.2 Gas chromatograph
The most important part of the experimental setup was the micro gas chromatograph
(micro GC). Figure 4.12 shows the micro gas chromatograph (CP 4900) supplied by
Varian Instruments, UK. The instrument was connected to a silica gel trap as shown in
the Figure 4.10. The gas chromatograph was equipped with two thermal conductivity
(TCD) detectors and two columns. Molecular sieve 5A plot and Pora Plot Q columns
were provided with the gas chromatograph for the analysis of H2 and carbon gases. The
molecular sieve 5A (column 1) was 10 m long column with 0.32 mm id and was used for
the analysis of H2, O2, N2, CH4 and CO. The Pora Plot Q (column 2) was used to detect
CO2, C2H4, C2H6, C3H6 and C3H8. In addition to these gases, column 2 also detected
CH4. Two pre columns were provided for both the columns to prevent unwanted
condensate or moisture entering the columns. Column 1 was operated with a back flush
of 13 s, which prevented CO2 from entering the column. The presence of CO2 disrupts
stable column operation as it entered the pores of the molecular sieve column affecting

Hydrogen production by steam reforming of biodiesel
89
the column performance. The poisoned column had to be regenerated by heating to
180°C. This operation required a long time due to oven temperature limitation. In order
to prevent this from happening, column 1 was always operated with back flush option.
The columns were conditioned after every experiment by heating to 180°C to get rid of
the moisture, which might enter the columns. Although the silica gel trap removed most
of the moisture before the gas from the reactor was sampled by the gas chromatograph.
The run time for the gas chromatograph was about 2.5 min which is much faster than
conventional gas chromatographs and therefore was more suited to the dynamic
processes investigated. The column temperatures were set to 100°C at 100 kpa pressure.
It was equipped with a pump which withdrew gas sample from the silica gel trap. The
pump had a sampling time of 20’s. The inlet sample line to the gas chromatograph was
maintained at 45°C. The Galaxie data acquisition software was provided by the
manufacturer to set the column conditions and other essential parameters for the
instrument. An external standard method was used for the analysis of the products. The
instrument was calibrated with various gas mixtures of different concentration to obtain a
good calibration curve for all the gases (Appendix A).
Figure 4.12: Micro gas chromatograph used for gas analysis.

Hydrogen production by steam reforming of biodiesel
90
4.3 Biodiesel and catalyst preparation
This section describes the preparation of biodiesel and catalysts used in the study. It also
explains the various techniques used to characterise biodiesel and the catalysts.
4.3.1 Biodiesel preparation
Three different kinds of biodiesels i.e. commercial, palm and in-house prepared biodiesel
were used in this study. The commercial biodiesel was provided by the engine research
group, Energy Research Institute, University of Leeds which was procured from a petrol
station in Huddersfield, UK. Likewise palm oil based biodiesel was procured from the
crystallisation science and engineering research group, Institute of Particle Science and
Engineering, University of Leeds.
In house biodiesel was prepared using the method described in [231]. Waste cooking oil
was collected from a local restaurant and was converted to biodiesel using acid-base
transesterification processes due to the presence of high amount of free fatty acid in the
waste cooking oil. Waste cooking oil was esterified using different concentration of
sulphuric acid (1.5 to 3% w/w) at 65 oC with methanol/oil ratio of 3/7 (v/v). The
esterified mixture was transesterified using KOH (1.5, 2 and 3% w/w) in methanol
(methanol/oil ratio 3/7(v/v)). The acid-base transesterification was performed in a 500
cm3 three neck flask fitted with a condenser and a thermometer as shown in Figure 4.12.
The condenser was fitted with a condenser to condense methanol vapours formed during
the processes. The waste cooking oil was filtered to remove insoluble impurities and was
heated to 100° C for 15 min to remove the moisture.
A 250 g of waste cooking coil was measured and its volume was recorded. The waste
cooking oil was heated to 65°C in a beaker on a hot plate and was poured in the three

Hydrogen production by steam reforming of biodiesel
91
neck flask as shown in Figure 4.12. Sulphuric acid was dissolved in methanol and was
heated to 50 °C to prevent boiling. This mixture was the added to the hot oil in the three
neck flask and was vigorously stirred for 3 h at 400 rpm by means of magnetic bar placed
in the three neck flask. The esterified oil was cooled and was allowed to settle overnight
and subjected to the base catalysed transesterification process using KOH as catalyst.
The esterified oil was measured and the volume was recorded. It was heated to 50 °C on a
hot plate and was poured in a clean three neck flask. Potassium hydroxide (1.5, 2 and 3
% w/w) was dissolved in methanol (methanol/oil ratio of 3/7 (v/v)) which was also
heated to 50 °C and mixed with the hot oil. This mixture was stirred for 3 h at 50 °C with
constant stirring. The transesterfied oil was cooled over night and was separated in a
separating funnel where the heavier glycerol layer was separated from the lighter methyl
ester (biodiesel). The biodiesel was washed with water to remove unreacted methanol
and glycerol.
Figure 4.13: Acid- base catalysed transesterification set up.
Glycerol
Biodiesel
(methyl
ester)

Hydrogen production by steam reforming of biodiesel
92
4.3.2 Biodiesel characterisation
Biodiesel samples were subjected to elemental analysis (C/H/N/O), Thermogravimetric
analysis (TGA), composition analysis (gas chromatography), acid value, and free fatty
acid determination.
4.3.2.1 Elemental Analysis
The biodiesel samples were characterised using various techniques. Biodiesel samples
were subjected to elemental analysis to determine the composition of C/H/N/S by means
of a Thermo Flash EA 1112 series CE instrument. Biodiesel samples of 3 mg were
placed in thin tin capsules and the capsules were folded to avoid air entrapment. The
folded capsules were placed in the autosampler of the analyser which were further
combusted in the reactor chamber with excess oxygen at 1800°C. The elemental C, H, N
and S were converted to CO2, H2O, nitrogen oxides and SO2. These gases were detected
by a TCD detector and compared with standard to determine the percentage of C, H, N
and S. An oat meal with BBOT (2, 5-Bis (5-tert-butyl-2-benzoxazolyl) thiophene was
used as standard for the analysis. The oxygen content of the samples was determined by
difference. It is important to note that biodiesel samples did not contain any N and S.
4.3.2.2 Thermogravimetric analysis (TGA)
A Stanton Redcroft TGH-1000 instrument was used to perform a proximate analysis of
the biodiesel samples. This instrument makes use of horizontal differential balance to
measure weight change of the sample with respect to time and temperature under
isothermal conditions. The experiments were performed using 5 biodiesel samples (1.5, 2
and 3 wt% biodiesel, commercial biodiesel, and palm oil biodiesel), in order to compare

Hydrogen production by steam reforming of biodiesel
93
the volatile, carbon residue and ash content weight percentages. For every experiment
180 mg of sample was used. The samples were placed in the TGA and were subjected to
the following heating program.
5 °C/min from ambient to 400 °C with 50ml/min of nitrogen.
25 °C/min from 400 °C to 900 °C with 50ml/min of nitrogen.
Held at 900 °C for 10 minutes with 50ml/min of air.
The data obtained from the TGA was used to determine the wt% of the volatile, carbon
residue and ash. The volatile percentage is given by the main mass loss around 200-
500°C. The carbon residue is determined by the weight at which air is added to the
system which is at 900°C. The ash content was the weight remaining at the end of the
analysis as this material cannot be burnt thus remains in the pan. The weight (initial
minus final for volatiles) given by the equipment in comparison to the initial weight was
used to produce the percentage data.
4.3.2.3 Composition analysis
The composition analysis of the biodiesel samples were provided by crystallisation
science and engineering research group, Institute of Particle Science and Engineering,
University of Leeds. Clarus 500, Perkin Elmer fitted with flame ionisation detector,
using a 100 m long, 0.25 mm i.d. and 0.25 μm film thicknesses, fused silica column
(SUPELCO SPTM
2380). The biodiesel sample was diluted in toluene before performing
the analysis.

Hydrogen production by steam reforming of biodiesel
94
4.3.2.4 Acid value and free fatty acid determination
The acid value of the biodiesel and the waste cooking oil samples was determined using
EN 14104 which is comparable to ASTM-D974. A 0.1 M solution of KOH in ethanol
was prepared by dissolving 3.5 g KOH in 500 ml ethanol. Biodiesel or oil sample (10 g)
was dissolved in toluene. This solution was titrated against 0.1 M alcoholic KOH using
phenolphthalein as an indicator. The alcoholic KOH solution was placed in a micro
burette and added drop wise to the oil-toluene mixture, with constant stirring. The end
point was color change from light yellow to light pink that lasted at least for 15 s. The
following Eqs 4.1 and 4.2 were used to determine the acid value and free fatty acid
content.
56.1Acid value =
V c
m
(4.1)
282.46Free fatty acid as % of oleic acid=
V c
m
(4.2)
In the above Eqs, V is the volume, in ml of standard KOH solution used, c is the
concentration of the KOH solution in moles/lit and m is the mass of the sample (biodiesel
or vegetable oil) in g. Finally 56.1 and 282.46 are the molar mass of KOH and C18H34O2.
4.3.2.5 Bomb calorimetry
Bomb calorimetry was performed on the 5 biodiesel samples using a Parr Instruments
model-6200 bomb calorimeter to determine the gross calorific value of the samples. The
biodiesel samples were placed in a metallic bomb as shown in Figure 4.13 which was

Hydrogen production by steam reforming of biodiesel
95
pressurised to 3 bars in pure O2 environment. The bomb was placed exactly 2 L of water
and the sample was lit by a fuse. The rise in temperature of the water was correlated to
the energy released by sample combustion which in turn provides the gross calorific
value (GCV) of the sample. During the tests test sample sometimes did not ignite as a
result biodiesel samples had to be spiked with kerosene or silicon tape to ensure ignition
propagation to sample and achieve complete combustion. The calorific value of the spike
is subtracted from the total to get the actual calorific value of the biodiesel sample.
Figure 4.14: Parr instruments bomb calorimeter
4.3.3 Catalyst preparation
Nickel based catalyst were used in this investigation. Two commercial catalysts i.e. Ni
supported on Al2O3 and Ni supported on calcium aluminate were tested in addition to in-
house prepared catalysts. An 18 wt% Ni supported on α-Al2O3 was supplied by Johnson
Matthey, Plc. On the other hand the 15 wt% Ni supported on calcium aluminate was
provided by TST, Ltd. These two catalysts i.e. 18 wt % NiO supported on α-Al2O3 and 15
wt% supported on calcium aluminate will hence forth be referred as Ni/Al and Ni/Ca-Al.
The difference between fresh and used will be pointed out by use NiO for fresh and Ni
Bomb Calorimeter
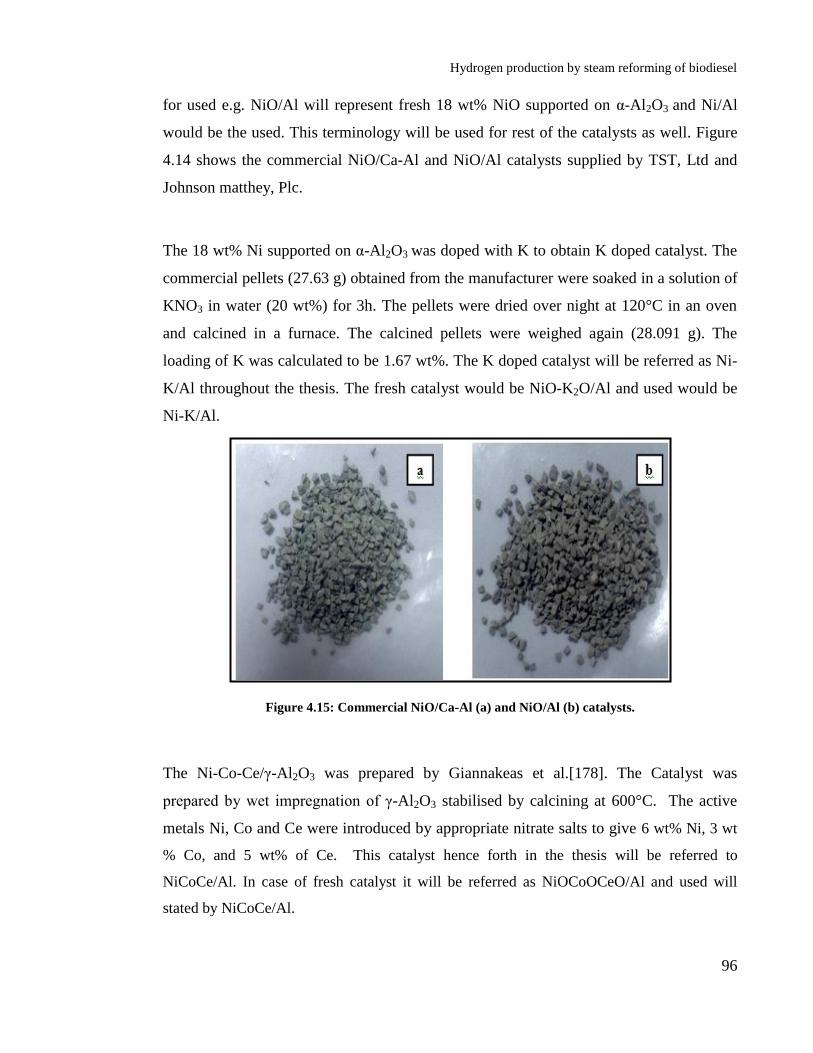
Hydrogen production by steam reforming of biodiesel
96
for used e.g. NiO/Al will represent fresh 18 wt% NiO supported on α-Al2O3 and Ni/Al
would be the used. This terminology will be used for rest of the catalysts as well. Figure
4.14 shows the commercial NiO/Ca-Al and NiO/Al catalysts supplied by TST, Ltd and
Johnson matthey, Plc.
The 18 wt% Ni supported on α-Al2O3 was doped with K to obtain K doped catalyst. The
commercial pellets (27.63 g) obtained from the manufacturer were soaked in a solution of
KNO3 in water (20 wt%) for 3h. The pellets were dried over night at 120°C in an oven
and calcined in a furnace. The calcined pellets were weighed again (28.091 g). The
loading of K was calculated to be 1.67 wt%. The K doped catalyst will be referred as Ni-
K/Al throughout the thesis. The fresh catalyst would be NiO-K2O/Al and used would be
Ni-K/Al.
Figure 4.15: Commercial NiO/Ca-Al (a) and NiO/Al (b) catalysts.
The Ni-Co-Ce/γ-Al2O3 was prepared by Giannakeas et al.[178]. The Catalyst was
prepared by wet impregnation of γ-Al2O3 stabilised by calcining at 600°C. The active
metals Ni, Co and Ce were introduced by appropriate nitrate salts to give 6 wt% Ni, 3 wt
% Co, and 5 wt% of Ce. This catalyst hence forth in the thesis will be referred to
NiCoCe/Al. In case of fresh catalyst it will be referred as NiOCoOCeO/Al and used will
stated by NiCoCe/Al.
a

Hydrogen production by steam reforming of biodiesel
97
Nickel impregnated catalysts were prepared using two different supports. One support
was Ce rich support prepared in the lab, while the other was Zr rich support supplied by
MEL Chemicals, UK.
4.3.3.1 Preparation Ni supported on Zr rich supports
A 17 wt% cerium doped zirconia oxide (Ce0.12Zr0.88O2) and hydroxide supplied by MEL
chemicals, UK were utilised in catalyst preparation. The hydroxide material was calcined
and converted to oxide and was used in the preparation of the catalysts. This material
was calcined at 600 °C for 6 h. Thus the oxide support obtained from the hydroxide
hence forth will be referred as in house calcined Ce-Zr support and the oxide support
provided by the manufacturer will be referred as pre calcined Ce-Zr support (Figure
4.15). The in house calcined support was used to prepare catalyst by two different
methods i.e. wet impregnation and dry impregnation methods.
Figure 4.16: Ce-Zr support supplied by MEL chemicals, UK.
Hydrogen production by steam reforming of biodiesel
98
In wet impregnation method 6g of in house calcined Ce-Zr support was impregnated with
different amounts of precursor to obtain 10, 20 and 30 wt% NiO loading, using
Ni2NiO6.6H2O as Ni precursor. In case of 10 wt% NiO loading, 2.33 g of Ni2NiO6.6H2O
was dissolved in 50 cm3 of distilled water and in house calcined Ce-Zr was added to it
and stirred continuously for 3 h using a magnetic needle on a hot plate without heating.
The impregnated material was drilled in an oven at 120 °C to remove the water and the
dried powder was calcined at 600 °C for 6 h in a furnace. Exact same procedure was
adopted to prepare other catalysts with 20 and 30 wt% NiO loadings.
In the dry impregnation method, the calculated amount of nitrate salt was added to 50
cm3 water which was slowly added to the catalyst support via a burette. Once a paste was
formed the addition was stopped and the material was dried over a hot plate to evaporate
the water; this procedure was repeated until all the solution had been added and the
material was dry. The solid was then calcined using the same methodology (600 °C for 6
hours).
It was found that the wet impregnation method produced smaller Ni crystallite size. The
surface area of the pre calcined material, supplied by MEL chemicals was higher as
compared to the in house calcined support. As a result the precalcined support and wet
impregnation method was used in the preparation of the catalyst. In preparation of 10
wt% NiO supported on pre calcined Ce-Zr, 30 g of Ce-Zr support was used. The
precursor Ni2NiO6.6H2O (11.64 g) was dissolved in 50 cm3 distilled water and the
support was added and continuously stirred for 3 h. The impregnated material dried at
120 °C and calcined at 600 °C for 6 h. In addition to this two other catalysts with 2 wt%
K2O and SnO were also prepared using the same method. The dopants were
simultaneously impregnated over the precalcined Ce-Zr support. In order to obtain K
doped Ni catalyst, 1.28 g of KNO3 and 11.36 g Ni2NiO6.6H2O were dissolved in same
amount of water and the impregnation of the precalcined support was achieved. In the
case of the Sn doped Ni catalyst, 0.23 g of SnC2O4 and 11.36 g Ni2NiO6.6H2O were used
in the preparation. The NiO catalysts prepared using wet impregnation of precalcined

Hydrogen production by steam reforming of biodiesel
99
Ce-Zr support are represent in Figure 4.16. The fresh 10 wt% NiO supported on pre
calcined Ce-Zr will be referred as NiO/Ce-Zr and other two with 10% Ni O and 2%
dopants will be reported using NiO-K2O/Ce-Zr, NiO-SnO/Ce-Zr. The used catalyst
would be referred as Ni/Ce-Zr, Ni-K/Ce-Zr and Ni-Sn/Ce-Zr. This terminology will be
used in rest of the thesis.
Figure 4.17: Nickel catalysts (NiO/Ce-Zr (a), NiO-K2O/Ce-Zr (b) and NiO-SnO/Ce-Zr (c)) prepared
by wet impregnation of pre calcined Ce-Zr support.
4.3.3.2 Preparation Ni supported on Ce-rich supports
The zirconia doped ceria (Ce-Zr) support was prepared in the laboratory, University of
Leeds using a sol-gel method. Tamarind seed polysaccharide TSP (Xyloglucan) was used
as a gelling agent. A stock solution of 3.5% (w/v) was prepared by dissolving 7 g of TSP

Hydrogen production by steam reforming of biodiesel
100
in 200 ml deionised water. The stock solution was heated on a hot plate at 65 °C under
continuous stirring to obtain a viscous solution.
As the solution obtained was very viscous the use of magnetic stirrer present with the hot
plate became difficult resulting in non homogeneity which was observed during initial
trials. A skin formed on top surface where full mixing had occured, however the
underneath of the solution was unhomogeneous and had not mixed completely. As a
result an electrical mixer, mounted on a clamp was used to produce uniform mixing. A
temperature probe was also placed within the solution to measure the bath solution and
control the hot plate temperature.
At the same time on a separate hot plate catalyst precursors i.e. cerium ammonium nitrate
and zirconyl oxy-nitrate with (Ce/Zr) molar ratio of 3/1 were mixed in alcohol. It was
found that TSP does not form a gel with water, rather it forms gels with alcoholic
solutions. Hence the precursors were dissolved in different alcohols. Three different
alcohols such as methanol, ethanol, propanol and sugar were examined. In each
experiment 5 g of cerium ammonium nitrate and 0.0702 g zirconyl oxy-nitrate was used.
The amount of alcohol was varied from 10 and 17 wt% of the water used. The
precursors, once mixed, were then added to the stock solution. The total solution was
mixed once more using the electrical mixer at a temperature of ~45 °C for approximately
one hour or until the solution had become a viscous gel (Figure 4.17). As temperature
controlled hot plate was unavailable it was difficult to maintain the temperature of the
solution to exact 45 °C. The obtained gels were dried using atmospheric and freeze
drying. The dried gels were calcined at 600 °C for 6 h in a furnace. Alumina doped ceria
(Ce-Al) was prepared using same method. Cerium ammonium (5g) nitrate and aluminium
nitrate were dissolved in ethanol with Ce/Al molar ratio 3/1. The dissolved precursors
were added to viscous TSP water solution and gel was obtained. The gel was freeze
dried and calcined at 600 °C for 6 h. In order to differentiate and avoid confusion the Ce-
Zr support prepared by sol gel synthesis will be referred as Ce-Zr-3/1.

Hydrogen production by steam reforming of biodiesel
101
Wet impregnation method was used to impregnate the Ce-Zr-3/1 and Ce-Al-3/1 supports
to prepare 10 wt% NiO supported on Ce-Zr-3/1 and Ce-Al supports. To achieve this 4 g
of each support and 1.55 g of Ni2NiO6.6H2O were used. The Ni2NiO6.6H2O was
dissolved in 30 cm3 water and the support was added to it and mixed thoroughly for 3 h.
The impregnated support was dried at 120°C overnight in an oven and calcined at 600 °C
for 6 h to obtain the catalyst. The 10 wt% NiO supported on sol gel synthesized Ce-Zr
support will hence forth be referred as Ni/Ce-Zr-(3/1) to distinguish it from other Ce-Zr
catalysts prepared from commercial support discussed in the previous section. Similarly
Ni supported on Ce-Al-3/1 catalyst will be referred as Ni/Ce-Al. In case of fresh it would
be NiO/Ce-Al and with used it would be refereed by Ni/Ce-Al. Similarly terminiolgy will
apply to Ni/Ce-Zr-3/1.
Figure 4.18: Viscous gel obtained during sol gel synthesis of Ce-Zr (3/1) support.

Hydrogen production by steam reforming of biodiesel
102
4.3.4 Catalyst characterisation
The catalyst were characterised using X ray diffraction, specific surface area (BET),
elemental analysis (C/H/N) and thermo gravimetric- Fourier transform infra red
spectroscopy (TGA-FTIR). The presence of carbon in the condensate from the catalytic
experiments was determined using Total organic carbon (TOC) analysis.
4.3.4.1 Surface area analysis (BET)
Adsorption is a surface phenomenon where a density of fluid in contact with solid
increase. When a gas molecule strikes a solid surface, it can collide in two different ways
i.e. elastically and in-elastically. During elastic collision no energy is exchanged as a
result the gas molecule is reflected back to gas phase, unaffecting the system. In inelastic
collision the gas molecule lacks energy to overcome the surface potential and sticks to the
surface for a while before returning to the gas phase. The inelastic collisions lead to
adsorption. Wan der Waals forces govern physical adsorption of gases on solid surface.
The process of physical adsorption takes place when a gas is contact with solid and
pressures and temperature conditions are manipulated so that the gas reaches it
condensation point [232]. This is performed in a closed vessel where a solid is exposed
to condensed gas usually N2 and the pressure of the system is increased gradually. This
causes the gas to condense in the large pores of the solid, until all the pore volume of the
solid is filled with the condensate and the surface is saturated. The system pressure is
then reduced so that the liquid boils and returns back to gas. This results in the formation
of two separate operations in the processes known as adsorption and desorption [232].
Adsorption and desorption equilibria are represented by isothermal plots that show the
volume of gas adsorbed onto the solid as a function of the relative pressure (P/P0). The

Hydrogen production by steam reforming of biodiesel
103
relative pressure is the equilibrium pressure (P) of the gas in contact with the liquid over
the saturated vapour pressure of the gas at the process temperature. The adsorption and
desorption isotherms are never identical since they are governed by different controlling
processes. This results in the formation of a hysteresis loop. These hysteresis loops are
very useful to predict the geometry of the pores in the material. The adsorption
desorption isotherms helps us identify the nature of the solid. IUPAC has classified the
isotherms in 6 types to determine the pore size and nature of the solid.
Figure 4.18 shows 6 different kinds of isotherms classified by IUPAC [233]. Type 1
isotherms indicate pores of 2 nm or smaller associated with micropores solids. Non-
porous i.e. macroporous solids having pores excess of 50 nm exhibit type 2 isotherm.
Type 4 isotherms are exhibited by mesoporous solids having pore radius 2-50 nm. Type
3 and 5 isotherms are rare. An example of type 3 isotherms is adsorption of water vapour
on non porous carbons. In this type of isotherms the adsorbent-adsorbate interactions are
reported to be weaker as compared to adsorbate-adsorbate. Type 5 isotherms are related
to type 3. In this type of isotherm the adsorbent-adsorbate interaction is weaker but is
obtained with certain types of porous adsorbents. Type 6 isotherms indicative of
multilayer adsorption on non-porous surfaces, e.g. argon or krypton on graphitised carbon
black at liquid nitrogen temperatures. Type 6 indicates groups of adsorption sites that are
homogeneous in regards to energy.

Hydrogen production by steam reforming of biodiesel
104
Figure 4.19: IUPAC classification of gas physical adsorption isotherms [233].
As a result of different controlling processes the adsorption and desorption isotherms are
rarely if ever identical. This results in formation of a loop on the isothermal plot known
as a hysteresis loop. In order to explain the relationship between the absorbed volume of
gas and relative pressure, P/P0 various models have been developed. The most commonly
used model is Brunauer-Emmett-Teller (BET) model.
The surface area of all the catalysts was evaluated was measured using Brunauer-
Emmett-Teller (BET) method. This method is widely used to determine the specific
surface area and porosity. The method relies on the physical adsorption of inert gases
line N2 on the surface of the material. The model makes use of the following Eq.
0 0
1 1
( ) m m
P C P
V P P V C V C P
(4.3)

Hydrogen production by steam reforming of biodiesel
105
In the above Eq 4.3, Vm is the monolayer adsorbed gas quantity and P and Po are the
equilibrium and saturation pressures. The model uses the following assumptions.
Adsorption occurs on well defined pores and only one molecule adsorbs per site. The
surface is assumed to be homogeneous and all the sites have same energy. The solid
surface is assumed to be completely covered with gas molecule and the gas molecule is
considered to be small enough to achieve this. The adsorbed molecules do not interact
with each other. The gas and solid do not interact beyond a monolayer. The BET model is
a mathematical technique that calculates specific surface area (SSA) of the material or
catalyst. SSA is defined as surface area per unit mass of the material. The model can be
used for meso and macroporous solids. The model Eq is valid when P/Po values are in
the range of 0.05 and 0.35 i.e. 0.05<P/Po<0.35 [234]. A graph of I/ (V [Po-P]-1) is
plotted against P/Po. The slope of the graph yields α and β is obtained as an intercept.
The quantity of Vm is calculated using following formula
Vm=1/ (α+β) and C is ratio of α/β [235]
2010mBET
M
NAVS
mV
(4.4)
The Eq 4.4 is used to determine the BET surface area where N is Avogadro’s number, A
is the area occupied by an absorbed gas molecule, m is the mass of the solid analysed and
VM is the molar volume of adsorbate.
The study of pore structure especially pore radius is very important especially in
hysteresis loop. The pore properties of mesoporous solids are widely studied using
Barrett, Joyner and Halenda (BJH) model. The small pore size of the mesoporous
material results in the formation of a highly curved meniscus in the adsorption of the
liquid on to the solid. As a result the liquid vapour pressure drops below the saturated
vapour pressure Po which results in formation of a hysteresis loop during adsorption and
desorption of gas [235]. This phenomenon is termed as capillary condensation. The
formation of the hysteresis loop and capillary condensation modelling helps us to
determine the pore size distribution, cumulative pore volume and specific surface area of

Hydrogen production by steam reforming of biodiesel
106
the catalyst. The condensation phenomenon is explained by means of Kelvin Eq 4.5
[236].
0 ( )p
P f Vcosln
P RT r t
(4.5)
In the above Eq, f is a form factor (depending on the meniscus), γ is the surface
temperature of the adsorbate at temperature T, V is the molar volume of the liquid
condensate, θ is the angle of contact equal to 0, R is the true gas constant rp is the radius
of the pore and t is the film thickness. The film thickness t of the adsorbate is calculated
using the Eq 4.6.
1/3
0
53.5
2.303log /t
P P
(4.6)
The Kelvin Eq 4.5 tries to predict the pressure at which adsorbate will spontaneously
condense and evaporate in cylindrical pores of given size. This will only happen if there
is an existing film of gas is adsorbed on the solid [237]. The BJH model uses a modified
Kelvin Eq (4.6) and the statistical thickness (t curve). The Eq 4.6 is used to determine the
change in pore volume and surface area by applying pore geometric pore models. Pore
size distribution is also provided by the model by plotting change in pore volume with
respect to change in pore radius against pore radius. Cumulative pore volume and the
specific surface are also obtained from this model.
The shapes of the hysteresis loop present in the isotherm help us to identify the geometry
of the pores in the mesoporous material. IUPAC has classified the hysteresis loops into
four different types (Figure 4.18). Type H1 suggest tubular pores at both end with various
cross sections and slightly widened parts; termed ink bottle and trough shaped pores.
Type H2 also suggest ink bottle shaped pores but can also propose or voids between close
packed particles [235]. The H2 type adsorption hysteresis can occur due to
interconnectivity of pores. In such systems the pore sizes and pore shapes are not well
defined or they are irregular. The sharp steep of the desorption isotherms indicates the
existence of interconnectivity among the pores [238]. Type H3 hysteresis is associated

Hydrogen production by steam reforming of biodiesel
107
with plate such as particles which give rise to slit shaped pores, while H3 type are
associated with narrow slit pores.
A Quanta-chrome Instruments NOVA 2200e Surface Area and Pore Size analyser
(Figure 4.19) was utilised in order to perform the surface area and isotherm analysis of
the support and the catalysts. The instrument was provided with a degassing (left had
side) and physical adsorption (right hand side) section. The instrument was used for the
analysis of both fresh and used catalysts. The samples were vacuum degassed at 300°C
for 3 h in order to eliminate gases such as CO2 or moisture adsorbed on to the solid
catalysts. The instrument was operated in batch manner to determine the amount of gas
adsorbed. Volumetric technique was used by the instrument which relied on pressure
sensors in a container with known volume to determine the adsorbed quantities.
Figure 4.20: Quanta-chrome Instruments NOVA 2200e Surface Area and Pore Size Analyser
Cylindrical glass tubes were used to perform the analysis. The tubes were initially
weighed and the sample was added in the tubes and the actual mass of the sample was
determined by subtracting the weight of the tube from the total (tube + sample). The
Hydrogen production by steam reforming of biodiesel
108
samples were degassed for 3 h; the tubes were cooled and weighed again to determine the
loss in weight after degassing. This final mass was used to perform the analysis. The
cooled tubes were then connected to the analysis section (right side of the instrument).
The samples were left overnight for isotherm analysis.
4.3.4.2 X ray powder diffraction (XRD)
X-ray diffraction is widely used technique to study the crystallographic structure of the
catalysts. In this method the sample is exposed to an electron beam that is accelerated
across a high voltage field. The electrons of the atoms from the sample deflect some of
the photons from the incident beam away from the original vector. This results in the
formation of deflected X-rays which are measured during the experiments. The presence
of different atoms and molecules in the sample interfere with one another resulting in the
intensity distribution.
The term 'powder' really means that the crystalline domains are randomly oriented in the
sample. Therefore when the 2-D diffraction pattern is recorded, it shows concentric rings
of scattering peaks corresponding to the various d spacings in the crystal lattice [239].
The positions and the intensities of the peaks are used for identifying the underlying
structure (or phase) of the material. For e.g. graphite, will exhibit different diffraction
lines as compared to diamond, even though they consist of carbon atom. This phase
identification is important because the material properties are highly dependent on
structure (just think of graphite and diamond) [239, 240].
The Brucker D8 instrument by means of Cu Kα radiation was used to perform the X-ray
diffraction studies. The samples were scanned with a steep size of 0.108°/s and the range
of 2θ was set at 20-100°. The obtained diffraction patterns of the samples were compared

Hydrogen production by steam reforming of biodiesel
109
with the known standard diffraction patterns to identify phases present in the material.
Phase analysis based on the XRD data was obtained using the X'Pert High Score Plus
software. Rietveld refinement was used to measure the phase compositions of NiO, Al2O3
and Ce-Zr as well as the crystallite sizes (Scherrer Eq accounting for peak broadening by
instrument and strain) [240]. The Scherrer Eq is given by Eq 4.7.
c
kλd =
βcosθ (4.7)
Where K is a dimensionless shape factor with typical values about 0.9, λ is the wave
length of the X-rays, θ is the Bragg diffraction angle and β is full width at half-maximum.
4.3.4.3 Elemental analysis
The amount of carbon deposited on the catalyst surface was determined using elemental
analysis by means Thermo Flash EA 1112 series CE instrument. For each analysis
duplicate samples (17 mg) each of used catalysts were analysed. The samples were
placed in thin tin capsules and the capsules were folded to avoid air entrapment. The
folded capsules were placed in the autosampler of the analyser which were further
combusted in the reactor chamber with excess oxygen at 1800°C, to obtain C, H in the
form of CO2 and H2O detected by the TCD detector of the instrument.
4.3.4.4 TGA-FTIR and TOC analysis
In order to obtain an idea about the type of carbon present on the catalyst surface TGA-
FTIR analysis was performed. Temperature programmed oxidation (TPO) of the catalyst
was performed in a Stanton-Redcroft TGA connected to a FTIR (Nicolet iS10, Thermo
scientific). During each test 100 mg of used catalyst was placed in the sampling pan of
Hydrogen production by steam reforming of biodiesel
110
the TGA and the temperature was increased from ambient to 900°C at the rate of
10°C/min in 50 cm3/min air. The FTIR spectral scanning was repeated every 30 s,
scanning from 4000 to 500 cm-1
to determine the gaseous products formed during the
experiment.
The organic carbon of the condensate collected after the experiment was analysed using a
Hach-Lange IL550 analyser. The samples were diluted 10 times before performing the
analysis, 1 cm3 of the condensate was placed in 10 cm
3 centrifuge tube and was diluted
up to the mark using deionised water.
4.3.4.5 Scanning Electron Microscopy analysis (SEM) and Energy Dispersive
X-ray (EDX)
SEM uses an electron microscope equipped with a high-energy beam of electrons for
generating images. This beam is bombarded on the sample, after striking the sample
surface they produce different signals which are detected by the detector resulting in the
formation of an image. This technique is used to study the sample topography along with
topology. The SEM is coupled with an energy-dispersive X-ray (EDX) source which is
used for chemical characterisation of the sample. The EDX technique uses the principle
of exciting electrons of sample using X-rays. At normal or ground state the atoms of the
sample contain electrons which are bound to the nucleons. The bombarded X-ray beam
excites the electron in the inner shell of atom. The excited electron is ejected from the
shell creating an electron hole. This hole is filled with another electron from higher
energy shell. This difference in energy between higher and lower energy shells releases
some form of X- rays. This X rays are characteristics of the difference of energy of the
shells and the atomic structure of the emitted electron, elemental composition can be
determined using this principle. The SEM-EDX analysis was performed to observe the
dispersion of the active metals i.e. Ni, K and Sn on the catalyst surface. It was also used
to observe carbon formation on the catalyst surface.
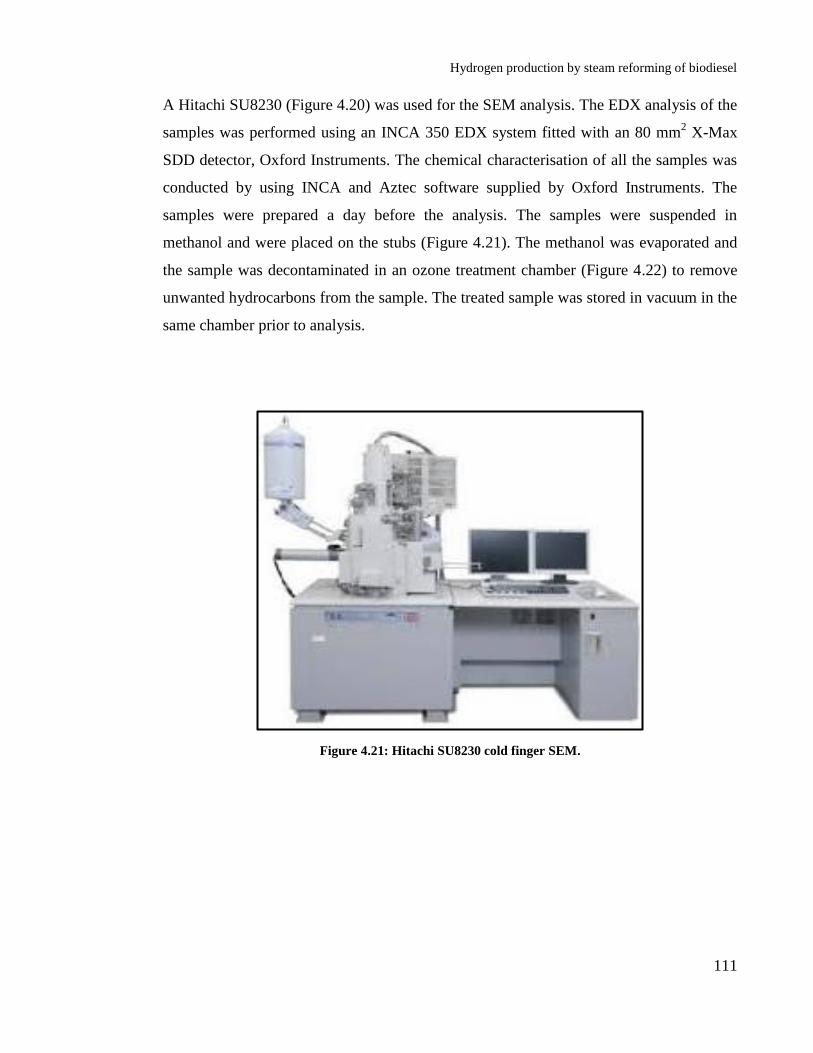
Hydrogen production by steam reforming of biodiesel
111
A Hitachi SU8230 (Figure 4.20) was used for the SEM analysis. The EDX analysis of the
samples was performed using an INCA 350 EDX system fitted with an 80 mm2 X-Max
SDD detector, Oxford Instruments. The chemical characterisation of all the samples was
conducted by using INCA and Aztec software supplied by Oxford Instruments. The
samples were prepared a day before the analysis. The samples were suspended in
methanol and were placed on the stubs (Figure 4.21). The methanol was evaporated and
the sample was decontaminated in an ozone treatment chamber (Figure 4.22) to remove
unwanted hydrocarbons from the sample. The treated sample was stored in vacuum in the
same chamber prior to analysis.
Figure 4.21: Hitachi SU8230 cold finger SEM.

Hydrogen production by steam reforming of biodiesel
112
Figure 4.22: SEM sample stubs.
Figure 4.23: Ozone decontaminator for Hitachi SU8230 SEM.
Hydrogen production by steam reforming of biodiesel
113
5. Characterisation of biodiesel and catalysts
5.1 Biodiesel Characterisation
The characterisation of biodiesel was performed to determine the ester content to be used
for the equilibrium analysis of the experiments. The elemental analysis of biodiesel was
to be used to set the flows of biodiesel and H2O for the CSR experiments. Similarly the
presence of fatty acid affecting the biodiesel performance during the CSR experiments
would also be determined in biodiesel characterisation, useful for equilibrium analysis.
Likewise, the free fatty acid and proximate analysis is used to determine the quality of
biodiesel used for the experiments.
The gas chromatograph composition of the different biodiesel used in this study is
shown in the Table 5.1. It can be seen from the table that biodiesel samples mainly
consisted of methyl oleate, methyl linoleate and methyl palmitate. The three different
biodiesel samples prepared using different amount of KOH (1.5, 2 and 3 wt%) showed
very similar ester compositions. Highest composition of methyl oleate was found in the
commercial biodiesel sample as compared to the other two. The in house prepared
biodiesel exhibited the highest amount of methyl linoleate. As compared to commercial
and in house prepared biodiesels, palm oil biodiesel showed the highest amount of methyl
palmitate. In all the biodiesel samples, smaller chain methyl esters (C13-15) were
negligible and so were higher methyl esters (C20-C25). The in house prepared biodiesel
composition were comparable to literature Hoekman et al. [241] and Wang et al. [242]
which both show biodiesel to contain ~≥40 wt% oleate, ~≥30 wt% linoleate and ~≥15
wt% palmitate.
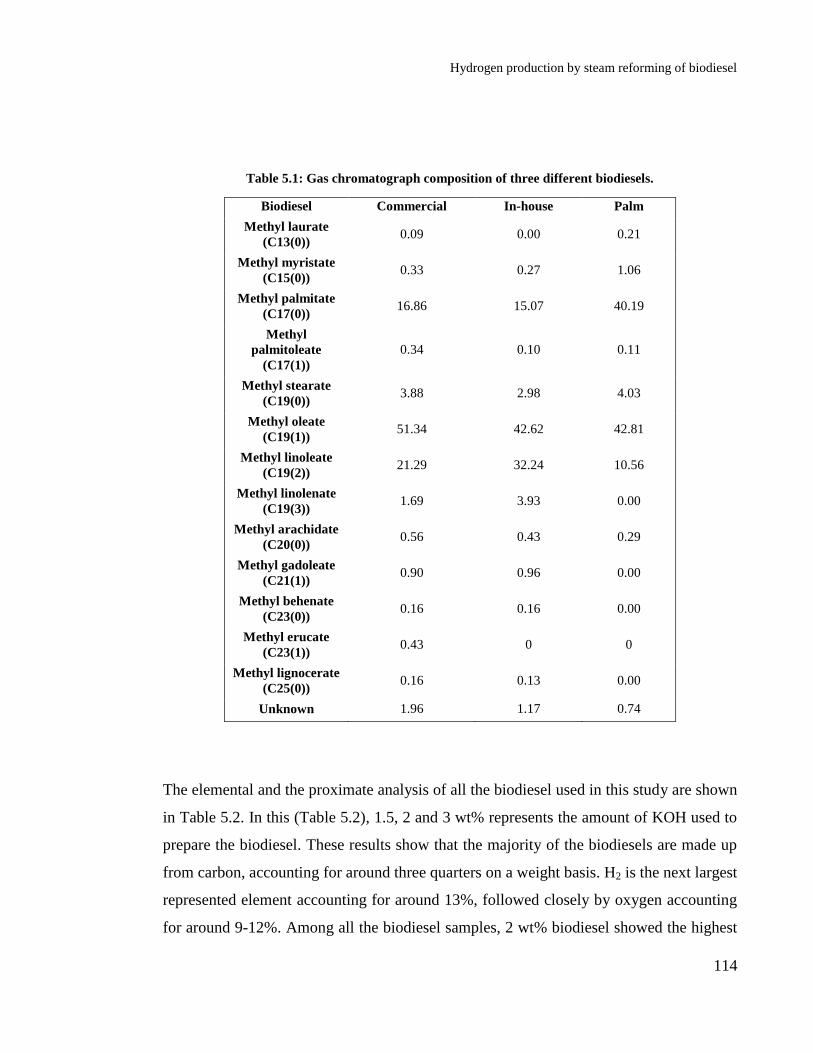
Hydrogen production by steam reforming of biodiesel
114
Table 5.1: Gas chromatograph composition of three different biodiesels.
Biodiesel Commercial In-house Palm
Methyl laurate
(C13(0)) 0.09 0.00 0.21
Methyl myristate
(C15(0)) 0.33 0.27 1.06
Methyl palmitate
(C17(0)) 16.86 15.07 40.19
Methyl
palmitoleate
(C17(1))
0.34 0.10 0.11
Methyl stearate
(C19(0)) 3.88 2.98 4.03
Methyl oleate
(C19(1)) 51.34 42.62 42.81
Methyl linoleate
(C19(2)) 21.29 32.24 10.56
Methyl linolenate
(C19(3)) 1.69 3.93 0.00
Methyl arachidate
(C20(0)) 0.56 0.43 0.29
Methyl gadoleate
(C21(1)) 0.90 0.96 0.00
Methyl behenate
(C23(0)) 0.16 0.16 0.00
Methyl erucate
(C23(1)) 0.43 0 0
Methyl lignocerate
(C25(0)) 0.16 0.13 0.00
Unknown 1.96 1.17 0.74
The elemental and the proximate analysis of all the biodiesel used in this study are shown
in Table 5.2. In this (Table 5.2), 1.5, 2 and 3 wt% represents the amount of KOH used to
prepare the biodiesel. These results show that the majority of the biodiesels are made up
from carbon, accounting for around three quarters on a weight basis. H2 is the next largest
represented element accounting for around 13%, followed closely by oxygen accounting
for around 9-12%. Among all the biodiesel samples, 2 wt% biodiesel showed the highest

Hydrogen production by steam reforming of biodiesel
115
carbon content while commercial biodiesel showed highest H2 content. The oxygen
content was highest in the 1.5 wt% biodiesel. The proximate analysis of all the biodiesel
samples suggests that all the biodiesel samples analysed contain ≥99.5% volatiles which
evaporates around 190°C (Figure 5.1). As a result formation of carbon residue and ash
content are minimal. This is beneficial for the H2 production process as 99% of the
sample will convert to vapours in the vaporiser, with little amount of ash and carbon
residue formation.
Table 5.2: Elemental and proximate analysis of 5 biodiesel samples.
wt (%)
Commercial
biodiesel
In-house-1.5
wt % In-house-2wt
%
In-house-3wt
%
Palm biodiesel
C 75.35 74.10 76.42 74.60 75.90
H 13.53 12.97 12.44 12.87 12.41
O 11.10 12.92 11.12 12.52 11.67
Volatile 99.63 99.91 99.92 99.65 99.88
Carbon
residues 0.28 0.02 0.03 0.13 0.015
Ash 0.1 0.07 0.05 0.22 0.108
The ash content and the ultimate analysis of the samples obtained from elemental
analysis of the biodiesel samples can be used to calculate the gross calorific value (GCV)
by using the Eq 5.1 provided by Channiwalla & Parikh [243].
0.3491C 1.1783H 0.1005S 0.1034O 0.0151N 0.0211A (5.1)
These values were compared with the one obtained from bomb calorimetry. Table 5.3
compares the calculated and the experimental GCV of commercial and in house prepared
biodiesel, obtained by bomb calorimetry. The calculated values were slightly higher as
compared to the observed values.
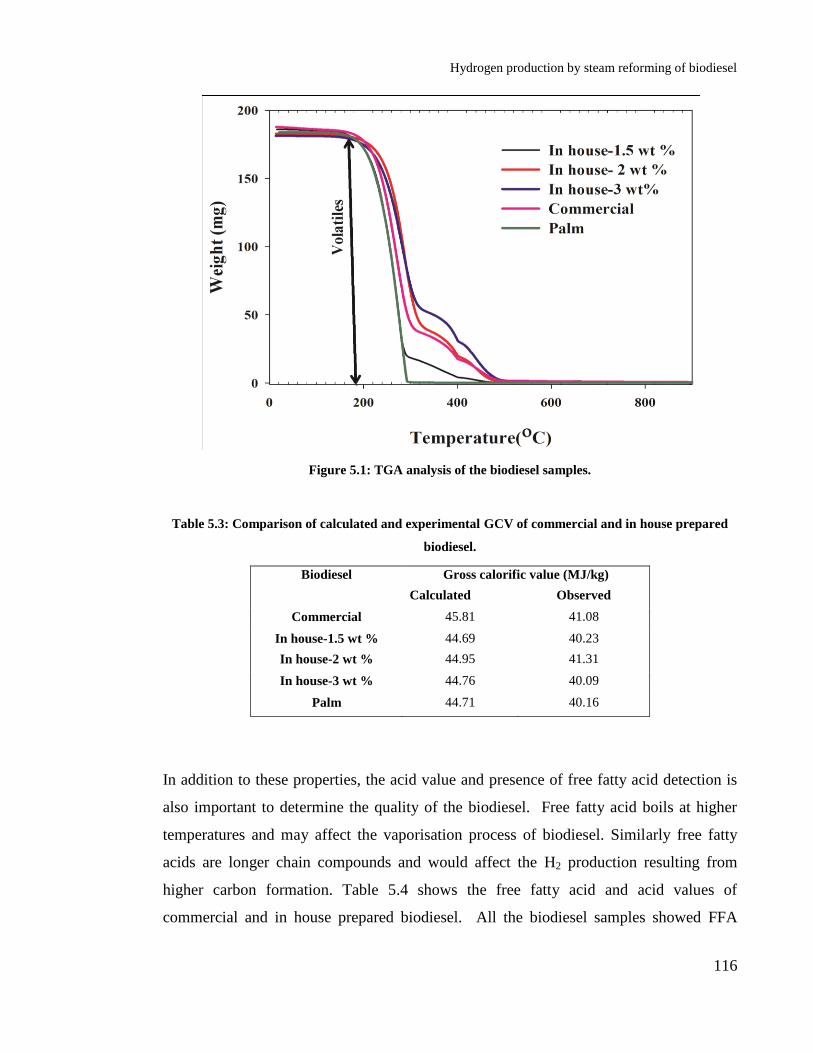
Hydrogen production by steam reforming of biodiesel
116
Figure 5.1: TGA analysis of the biodiesel samples.
Table 5.3: Comparison of calculated and experimental GCV of commercial and in house prepared
biodiesel.
Biodiesel Gross calorific value (MJ/kg)
Calculated Observed
Commercial 45.81 41.08
In house-1.5 wt % 44.69 40.23
In house-2 wt % 44.95 41.31
In house-3 wt % 44.76 40.09
Palm 44.71 40.16
In addition to these properties, the acid value and presence of free fatty acid detection is
also important to determine the quality of the biodiesel. Free fatty acid boils at higher
temperatures and may affect the vaporisation process of biodiesel. Similarly free fatty
acids are longer chain compounds and would affect the H2 production resulting from
higher carbon formation. Table 5.4 shows the free fatty acid and acid values of
commercial and in house prepared biodiesel. All the biodiesel samples showed FFA
Hydrogen production by steam reforming of biodiesel
117
composition comparable to both ASTM D974-664 and EN14104. In all the biodiesel
samples tested, in house 1.5 wt % biodiesel showed the lowest acid value as a result
lowest free FFA content, in comparison in house 3 wt% biodiesel had the highest acid
value and thus FFA content. The waste cooking oil used to prepare the biodiesel samples
exhibited the highest higher acid value as a result highest free FFA content.
Table 5.4: Free fatty acid and acid values of commercial and in house prepared biodiesel.
Biodiesel Free fatty acid (%) Acid value mg KOH/g
Commercial 0.461 0.925
In house -1.5 wt % 0.381 0.757
In house -2 wt % 0.508 1.01
In house -3 wt % 2.965 5.89
Palm 0.392 0.781
Waste cooking oil 10.22 20.89
5.2 Catalyst Characterisation
5.2.1 Surface area analysis
The surface area of the fresh Al2O3 and Ce-Zr catalysts is provided in the Table 5.5. As
seen in the Table the NiO-CoO-CeO/Al exhibits highest surface area followed by Ce-Zr
and Ca-Al supported catalysts. Lowest surface area was shown by NiO/Al and NiO-
K2O/Al catalysts. The pre calcined Ce-Zr support supplied by the manufacturer showed
higher surface area as compared to the in house calcined Ce-Zr support. The surface area
of the pre calcined Ce-Zr support was 30% higher than the in house calcined support,
suggesting that the in house calcination processes was not homogenous compared to the
calcination processes employed by the company. The difference between the surface area
values obtained from BET and BJH are far smaller when using the adsorption isotherm
than when using the desorption isotherm. The pore size and pore volume of the pre
calcined support was slightly smaller than the in-house calcined support. The catalyst
prepared using dry impregnation method exhibited higher surface area as compared to the
wet impregnation method. Increasing the loading of NiO showed to decrease the surface

Hydrogen production by steam reforming of biodiesel
118
area of the catalysts in both the methods. The decrease in BET surface area is associated
with increase in NiO content observed in X-ray diffraction experiments.
Table 5.5: Surface area of fresh commercial and Ce-Zr catalysts.
Catalyst BET
(m2/g)
BJH surface
area (m2/g)
Pore size
(nm)
Pore
volume
cc/g
In-house calcined Ce-Zr 60.35 60.32 6.03 0.18
Pre calcined Ce-Zr 90.43 101.46 4.73 0.22
Catalyst prepared using in-house calcined Ce-Zr
10wt%-NiO/Ce-Zr-wet 55.89 59.70 4.69 0.13
20wt%-NiO/Ce-Zr-wet 53.96 58.37 4.79 0.13
30wt%-NiO/Ce-Zr-wet 48.76 53.97 4.47 0.12
10wt%-NiO/Ce-Zr-dry 60.45 66.59 4.47 0.14
20wt%-NiO/Ce-Zr-dry 56.53 61.65 4.47 0.14
Catalyst prepared using pre calcined Ce-Zr
NiO/Ce-Zr 79.61 88.78 3.58 0.18
NiO-SnO/Ce-Zr 61.12 63.96 4.68 0.16
NiO-K2O/Ce-Zr 48.38 60.88 6.08 0.19
Commercial catalysts
NiO/Al 05.31 - - -
NiO-K2O/Al 02.27 - - -
NiO/Ca-Al 33.59 - - -
NiO-CoO-CeO/Al 106.38
The pore volume of the catalyst decreased with increase in Ni loading in the wet
impregnation method, while it remained unaffected in the dry impregnation method. This
could be explained by the extensive restructuring of the catalysts surface as suggested by
Haber et al [244]. As a result of loading NiO on to the support results in partial deposition
of NiO in the pores reducing the pore volume of the catalyst. The catalysts prepared using
the pre calcined Ce-Zr support was higher in surface area than catalyst obtained using the
in house calcined Ce-Zr support. The NiO/Ce-Zr catalyst showed the highest surface area
followed by NiO-SnO/Ce-Zr and finally NiO-K2O/Ce-Zr. The pore volume and the pore
size of the catalyst containing the dopants were higher as compared to bare Ni catalyst.
Impregnation of 1 wt% Rh on 13 wt% CeO2 doped ZrO2 supplied by the same

Hydrogen production by steam reforming of biodiesel
119
manufacturer, calcined under similar conditions showed much smaller surface area (44
m2/g) [245]. According to the authors there was no significant change before
impregnation and after impregnation of Rh on the support.
Figure 5.2: N2 adsorption-desorption isotherms of NiO/Ce-Zr catalyst prepared by wet impregnation
method using in-house calcined support.

Hydrogen production by steam reforming of biodiesel
120
Figure 5.3: N2 adsorption-desorption isotherms of NiO/Ce-Zr catalyst prepared by dry impregnation
method using in-house calcined support.
Figure 5.4: N2 adsorption-desorption isotherms of NiO/Ce-Zr catalyst prepared by wet impregnation
method using pre calcined Ce-Zr support.

Hydrogen production by steam reforming of biodiesel
121
The N2 adsorption-desorption isotherms for the wet and dry impregnated in-house
calcined Ce-Zr is shown in Figure 5.2 and 5.3 respectively. The isotherms obtained using
in-house calcined and pre calcined Ce-Zr is very similar. Figure 5.4 shows the N2
adsorption-desorption isotherms of Ni catalyst prepared using pre-calcined Ce-Zr
support. The isotherm can be attributed to type IV and exhibits type H1 hysteresis, which
presents the typical characteristic of capillary condensation in mesopores (between 2 and
40nm) and contains either ink bottle or trough shaped pores [235]. Chen et al. [246] and
Raju et al. [247] reported similar observations in the case of alumina and silica modified
ceria-zirconia oxides. In the case of surfactant assisted preparation of 5wt%
Ni/Ce0.6Zr0.4O2 catalyst, Sukonket et al. [248] reported the existence of type IV isotherm
exhibiting H2 hysteresis. Ni supported on ceria-zirconia support prepared using improved
evaporation induced self assemble strategy by Xu et al. [249] reported the presence of
type IV isotherm exhibiting H1 hysteresis, implying the presence of cylindrical pores.
Figure 5.5: Pore-size distribution of NiO/Ce-Zr catalysts prepared using wet impregnation of in
house calcined Ce-Zr support.
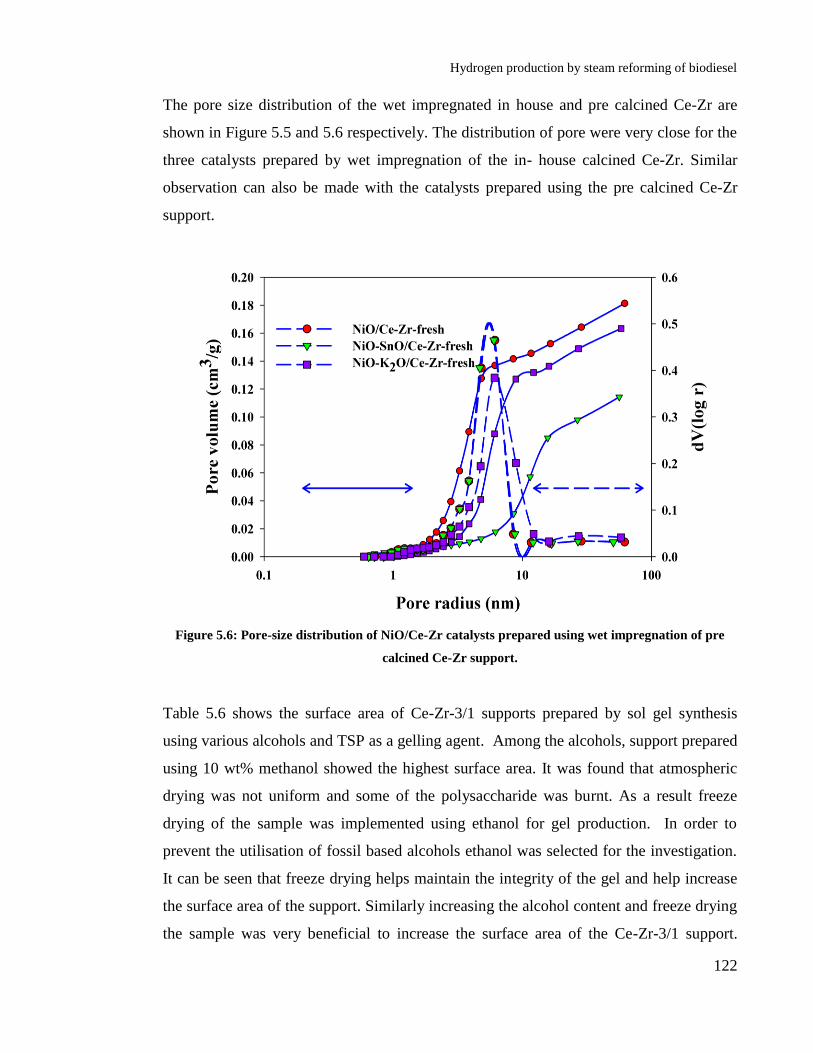
Hydrogen production by steam reforming of biodiesel
122
The pore size distribution of the wet impregnated in house and pre calcined Ce-Zr are
shown in Figure 5.5 and 5.6 respectively. The distribution of pore were very close for the
three catalysts prepared by wet impregnation of the in- house calcined Ce-Zr. Similar
observation can also be made with the catalysts prepared using the pre calcined Ce-Zr
support.
Figure 5.6: Pore-size distribution of NiO/Ce-Zr catalysts prepared using wet impregnation of pre
calcined Ce-Zr support.
Table 5.6 shows the surface area of Ce-Zr-3/1 supports prepared by sol gel synthesis
using various alcohols and TSP as a gelling agent. Among the alcohols, support prepared
using 10 wt% methanol showed the highest surface area. It was found that atmospheric
drying was not uniform and some of the polysaccharide was burnt. As a result freeze
drying of the sample was implemented using ethanol for gel production. In order to
prevent the utilisation of fossil based alcohols ethanol was selected for the investigation.
It can be seen that freeze drying helps maintain the integrity of the gel and help increase
the surface area of the support. Similarly increasing the alcohol content and freeze drying
the sample was very beneficial to increase the surface area of the Ce-Zr-3/1 support.

Hydrogen production by steam reforming of biodiesel
123
Highest surface area of 118.21 m2/g, was recorded for Ce-Zr-3/1 with 17 wt% ethanol
using freeze drying. On the other hand Ce-Al-3/1 support exhibited much smaller area as
compared to Ce-Zr-3/1 support. The Ce-Zr-3/1 support exhibited large surface area
reduction during the impregnation of Ni on the support. The catalyst surface area
prepared using Ce-Zr-3/1 support was 39.64 m2/g. Comparatively the surface area of the
NiO/Ce-Al catalyst was around 30.69 m2/g.
Table 5.6: Surface area of fresh Ce-Zr-3/1 supports prepared by sol gel synthesis and catalyst
prepared by impregnation method using Ni salts.
Alcohol
Drying Support
Alcohol
content wt
%
BET Surface
area m2/g
BJH surface
area m2/g
Methanol Atmospheric Ce-Zr-3/1 10 40.84 -
Ethanol Atmospheric Ce-Zr-3/1 10 36.58 -
Propanol Atmospheric Ce-Zr-3/1 10 39.60 -
Sugar Atmospheric Ce-Zr-3/1 10 22.16 -
Ethanol Freeze Ce-Zr- 3/1 10 45.27 -
Ethanol Freeze Ce-Zr-3/1 17 118.21 -
Ethanol Freeze Ce-Al-3/1 17 35.03 46.54
Ethanol Freeze NiO/ Ce-Zr-(3/1)a 17 39.64 50.91
Ethanol Freeze NiO/ Ce-Ala 17 30.69 31.78
a- The NiO loading for the catalyst was 10 wt %.
Figure 5.7 shows N2 adsorption-desorption isotherms of NiO/Ca-Al catalyst prepared
using wet impregnation of sol gel synthesised support. Both the catalysts NiO/Ca-Al and
NiO/Ce-Zr-3/1 exhibited type III isotherm with H3 hysteresis curve with suggest the
presence of plate-such as particles giving rise to slit-like pores [233]. As seen from
Figures 5.8 and 5.9 the pore size distributions of NiO/Ce-Al and NiO/Ce-Zr-3/1 catalysts.
The pore size distribution of these catalysts was very different as compared to the ones
prepared using pre calcined and in house calcined supports. The distribution pore-size

Hydrogen production by steam reforming of biodiesel
124
obtained with the NiO/Ce-Al catalyst was the worst among all the catalysts. This
suggests presence of non uniform pore structure resulting in uneven capillary
condensation in the pores.
Figure 5.7: N2 adsorption-desorption isotherms of NiO/Ce-Al catalyst prepared by wet impregnation
method using pre calcined support.
Figure 5.8: Pore-size distribution of NiO/Ce-Al catalyst prepared using wet impregnation of Ce-Al
support prepared using sol gel synthesis.

Hydrogen production by steam reforming of biodiesel
125
Figure 5.9:Pore-size distribution of Ni/Ce-Zr-3/1 catalyst, prepared by wet impregnation of Ce-Zr -
3/1, support obtained using sol gel synthesis.
5.2.2 X-ray diffraction analysis
Figure 5.10: X-ray diffraction of NiO/Ce-Zr catalysts prepared using wet impregnation method using
in house calcined Ce-Zr support. In the Figure (+) represents the Ce-Zr and (o) represents NiO.

Hydrogen production by steam reforming of biodiesel
126
The X-ray diffraction patterns for the NiO catalysts prepared by wet and dry
impregnation methods employing in house calcined Ce-Zr support are shown in the
Figure 5.10 and 5.11 respectively. Figure 5.12 shows the X-ray diffraction patterns of the
in house and pre calcined Ce-Zr supports. The Figure 5.12 also includes the X-ray
diffraction patterns of the NiO; NiO-K2O and NiO-SnO catalysts prepared using wet
impregnation of the pre calcined Ce-Zr support. The peaks observed at 29, 35, 49, 59, 81
and 94o respectively, with highest intensity peak observed at around 29
o are attributed to
diffraction peaks for Ce-Zr oxide. A cubic crystal system with tetragonal crystalline
structure was observed. Absence of peaks responsible for pure ZrO2 at 51o (220) and 61
o
(311) suggest the existence of a homogenous solid solution of Ce-Zr and complete
incorporation of Zr in cerium crystal structure. Since both supports i.e. pre and in house
calcined support (Figure 5.12) yielded identical data, inferring that both the supports
consisted of the same components i.e. Ce-Zr mix oxide, and that the in house calcination
of the cerium-zirconium hydroxide resulted in the complete formation of Ce-Zr mix
oxide.
Figure 5.11:X-ray diffraction of NiO/Ce-Zr catalysts prepared using dry impregnation method using
in house calcined Ce-Zr support. In the figure (+) represents the Ce-Zr and (o) represents NiO.

Hydrogen production by steam reforming of biodiesel
127
Figure 5.12: X-ray diffraction of NiO/Ce-Zr catalysts prepared using wet impregnation method
employing pre-calcined Ce-Zr support. In the Figure (+) represents the Ce-Zr and (o) represents
NiO.
The 2θ values of 37, 43 62-63, 75 and 79o shown in Figure 5.11, 5.12 and 5.13 are
attributed to the diffraction of NiO in the sample [250]. Highest intensity NiO peaks were
obtained at similar 2θ angle in both the preparation methods. Increasing loading increased
the NiO intensity in all the catalyst samples. The intensity of the NiO on the support
changes and first doubles and then triples as the loading increases from 10 to 20 wt% and
then to 30 wt%.
The Rietveld refinement summary of the NiO catalysts prepared using wet and dry
impregnation methods on the in house calcined Ce-Zr is shown in Table 5.7. The
difference between the desired and calculated loading increased with % loading. This
difference reaches maxima at 30 wt% loading in both the methods, which suggests a
decrease in the loading effectiveness. This could be as a result of NiO coating the outer
surface of the Ce-Zr support rather than entering the pores of the support thus reducing
the impregnation level [244].

Hydrogen production by steam reforming of biodiesel
128
Table 5.7: Rietveld refinement results of the catalysts prepared using in house calcined Ce-Zr
support.
Loading wt % Wet impregnation Dry impregnation
Ce-Zr (wt%) NiO (wt%) Ce-Zr (wt%) NiO (wt%)
10 90.70 9.30 90.50 9.50
20 79.60 20.40 81 19
30 71.70 28.30 74 26
The Rietveld refinement results of the catalysts prepared using pre calcined Ce-Zr
support also showed results similar to that obtained using in house calcined Ce-Zr
support. Table 5.8 shows the Rietveld refinement results of the catalysts prepared using
pre calcined Ce-Zr support. The goodness of fit for all the catalysts mentioned in the
Tables 5.7 and 5.8 was around 2 which suggest a very good match with the reference
patterns. As a result the crystallite sizes obtained for the catalysts would be accurate.
Table 5.8: Rietveld refinement results of the catalysts prepared using pre calcined Ce-Zr support.
Catalyst Ce-Zr (wt%) NiO (wt%)
NiO/Ce-Zr 90.50 9.50
NiO-SnO/Ce-Zr 90.25 9.75
NiO-K2O/Ce-Zr 90.13 9.87
The peaks attributed to K2O and SnO were not observed in the diffractogram (Figure
5.12) suggesting fine dispersion of the dopants on the pre calcined Ce-Zr and hence they
were not detected by XRD. Pengpanich et al., 2008 [227] reported similar results in case
of Ni-Sn/Ce0.75Zr0.25O2 catalysts utilised in partial oxidation of iso-octane. The existence
of peaks attributable to single-phase Ni3Sn, Ni3Sn2 and Ni3Sn4 were also not detected in
Ni-Sn/Ce0.12Zr0.88O2 catalysts [227].

Hydrogen production by steam reforming of biodiesel
129
The Ce-Zr and NiO crystallite sizes obtained from Rietveld refinement of the catalysts
prepared by wet and dry impregnated in house Ce-Zr are shown in Table 5.9. The crystal
size of Ce-Zr remained constant irrespective of the type of the impregnation processes
employed. In contrast, the crystal size of NiO in the catalyst varied depending on loading
and impregnation method. In the dry impregnation method, the NiO crystallite size
increased linearly with the NiO loading. However, in the wet impregnation method, the
NiO crystal size increased until 30 wt% loading, whereupon it decreased. This could be
as a result of the surface coating effect explained previously. The increase in NiO particle
size can lead to an increased plugging of the support pores, which causes a decrease of
the accessible pore area for the reactant gas, in turn affecting the catalytic activity.
Table 5.9: Comparison of crystallite sizes obtained using wet and dry impregnation methods
employing in house calcined Ce-Zr support.
Loading wt % Wet impregnation Dry impregnation
Ce-Zr (nm) NiO (nm) Ce-Zr (nm) NiO (nm)
10 11.41 15.59 11.63 23.98
20 11.33 37.28 11.37 32.40
30 11.33 33.90 11.68 36.84
Table 5.10: Crystallite sizes of NiO catalysts prepared using wet impregnation of the pre calcined Ce-
Zr support.
Catalyst Ce-Zr (nm) NiO (nm)
NiO/Ce-Zr 11.92 13.59
NiO-SnO/Ce-Zr 11.38 13.74
NiO-K2O/Ce-Zr 12.19 13.54
Table 5.10 compares the NiO and Ce-Zr crystallite sizes obtained from the Rietveld
refinement of the NiO/Ce-Zr catalysts prepared using pre calcined Ce-Zr support. It can
be seen from Tables 5.9 and 5.10, the NiO crystallite size obtained in wet impregnated

Hydrogen production by steam reforming of biodiesel
130
pre calcined Ce-Zr is smaller than the in house calcined Ce-Zr. In the three catalysts NiO-
K2O/Ce-Zr was slightly higher than NiO/Ce-Zr and NiO-SnO/Ce-Zr catalysts. Similarly,
the crystallite size for Ce-Zr in NiO-K2O/Ce-Zr was slightly higher as compared to the
other two. The addition of dopants induced some micro strain in NiO. At similar NiO
loading (10 wt%) according to Dantas et al. [251] NiO crystallite sizes lie in the range of
15-50 nm when using Ce-Zr support. The smaller NiO crystallite results in better NiO
reduction kinetics which would in turn affect the performance of the catalyst.
Figure 5.13 shows the X ray diffraction patterns for fresh NiO/Al and NiO-K2O/Al
catalysts. The 2θ values of 25, 35-37, 43 and 52-57o are attributed to Al2O3 in the catalyst
with highest intensity peak occurring at 43o. The addition of K to fresh NiO/Al catalyst
was shown to reduce significantly NiO crystallite size (from 48 to 35 nm). Higher micro
strain was observed in case of the NiO-K2O/Al catalyst in comparison to the bare NiO/Al
catalyst. Like NiO-K2O/Ce-Zr catalyst, no peaks for K2O were observed in the NiO-
K2O/Al catalyst. In dry reforming of propane using Mo-Ni/γ-Al2O3 catalyst, Siahvashi
and Adensia, 2013[252] reported that K2O was finely dispersed over Mo-Ni/γ-Al2O3
catalyst and could not be detected by XRD. The Rietveld refinement allowed deriving the
values 17.7 and 18 wt% for NiO content for the NiO/Al and NiO- K2O/Al catalysts
respectively.
The X-ray diffraction of Ce-Zr-3/1 prepared using different alcohol and sugar is shown in
Figure 5.14. Absence of ZrO2 peaks in all the samples suggested the formation of a
homogenous solid solution in all the three samples. The Ce-Zr-3/1 support prepared using
sugar showed the highest crystallite size of 12.79 nm. The CeZr-3/1 using propanol
reduced the crystallite size to 8.8 nm.

Hydrogen production by steam reforming of biodiesel
131
Figure 5.13: X-ray diffraction of NiO/Al and NiO-K2O/Al catalysts. In the figure (*) represents the
Al2O3 support and (o) represents NiO.
Figure 5.14: X-ray diffraction of Ce-Zr-3/1 prepared by sol-gel synthesis employing TSP as a gelling
agent using 10 wt% alcohol and 10 wt% sugar in the preparation.

Hydrogen production by steam reforming of biodiesel
132
The X-ray diffraction pattern for Ce-Zr-3/1 and Ce-Al-3/1 supports prepared using 17
wt% ethanol and tamarind seed polysaccharide (TSP) as gelling agent is shown in Figure
5.15. No peaks of responsible for Al2O3 were detected which suggests the incorporation
of Al2O3 in CeO2. It is well known that the radius of Al3+
(0.057 nm) is much smaller
than that of Ce4+
(0.097 nm), so incorporation of Al3+
ions into the ceria lattice inevitably
leads to the shrinkage of the lattice [253]. The introduction of Zr and Al into the Ce
lattice reduced the lattice parameters as shown in the Table 5.11. This shows that a solid
solution between CeO2, ZrO2 and Al2O3 was formed in Ce-Zr-3/1 and Ce-Al-3/1
supports. The crystallite sizes for the Ce-Zr-3/1 support were larger than Ce-Al-3/1. Sun
et al.[253] reported similar results in the preparation of Ce-Al mix oxide by citric acid
combustion method. The crystallite size decreased from 24 nm with CeO2 to 9 nm with
Ce-Al-3/1 oxide. The XRD pattern for the NiO/Ce-Zr-3/1 is shown in the Figure 5.16.
Like other catalysts NiO/Al and NiO/Ce-Zr, the NiO peaks are observed at 2θ values of
37, 43, 63 and 79°, while Ce-Zr-3/1 peaks were observed at same 2θ as shown in Figure
5.15. The NiO crystallite size obtained with this catalyst was 21.21 nm which was higher
than the other Ce-Zr based catalysts.
Unlike NiO/Al, NiO/Ce-Zr and NiO/Ce-Zr-3/1 catalyst the NiO/Ca-Al catalyst was
unable to be refined due to the presence of large amount of amorphous material and
complex pattern making it very difficult to refine. Figure 5.17 shows the XRD pattern for
the NiO/Ca-Al catalysts. Likewise the XRD pattern for NiO-CeO-CoO/Al contained
large amount of amorphous material making it difficult to perform Rietveld refinement.
The sizes of size of CeO and CoO oxide were reported to be 9.64 and 15.8 nm, which
were determined by Giannakeas et al. [178].

Hydrogen production by steam reforming of biodiesel
133
Figure 5.15: X-ray diffraction of Ce-Zr-3/1 and Ce-Al-3/1 prepared by sol-gel synthesis using 17 wt
% ethanol in sol gel synthesis employing TSP and gelling agent.
Table 5.11: Properties of Ce-Zr- 3/1 and Ce-Al-3/1 mix oxides.
Sample Lattice parameter (nm) Crystallite size( nm)
CeO2 0.54146 10
Ce-Zr-3/1a 0.53869 10.85
Ce-Zr-3/1b 0.53857 8.8
Ce-Zr-3/1c 0.53790 12.7
Ce-Zr-3/1d 0.53718 7.65
Ce-Al-3/1d 0.54092 4.18
a- The support was prepared using 10 wt% ethanol and 3 wt% TSP.
b- The support was prepared using 10 wt% sugar and 3 wt% TSP.
c- The support was prepared using 10 wt% propanol and 3 wt% TSP.
d- The supports were prepared using 17 wt% ethanol and 3 wt% TSP.

Hydrogen production by steam reforming of biodiesel
134
Figure 5.16: X-ray diffraction of NiO/Ce-Zr-3/1 prepared by sol-gel synthesis using 17 wt% ethanol
in sol gel synthesis employing TSP and gelling agent. In the Figure (+) represents the Ce-Zr-3/1
support and (o) represents NiO.
Figure 5.17: X-ray diffraction pattern of NiO/Ca-Al catalyst. In the Figure (+) represents the Ce-Zr-
3/1 support and (o) represents NiO. In the Figure (×) Ca-Al, (*) represents Al2O3 and (o) represents
NiO.
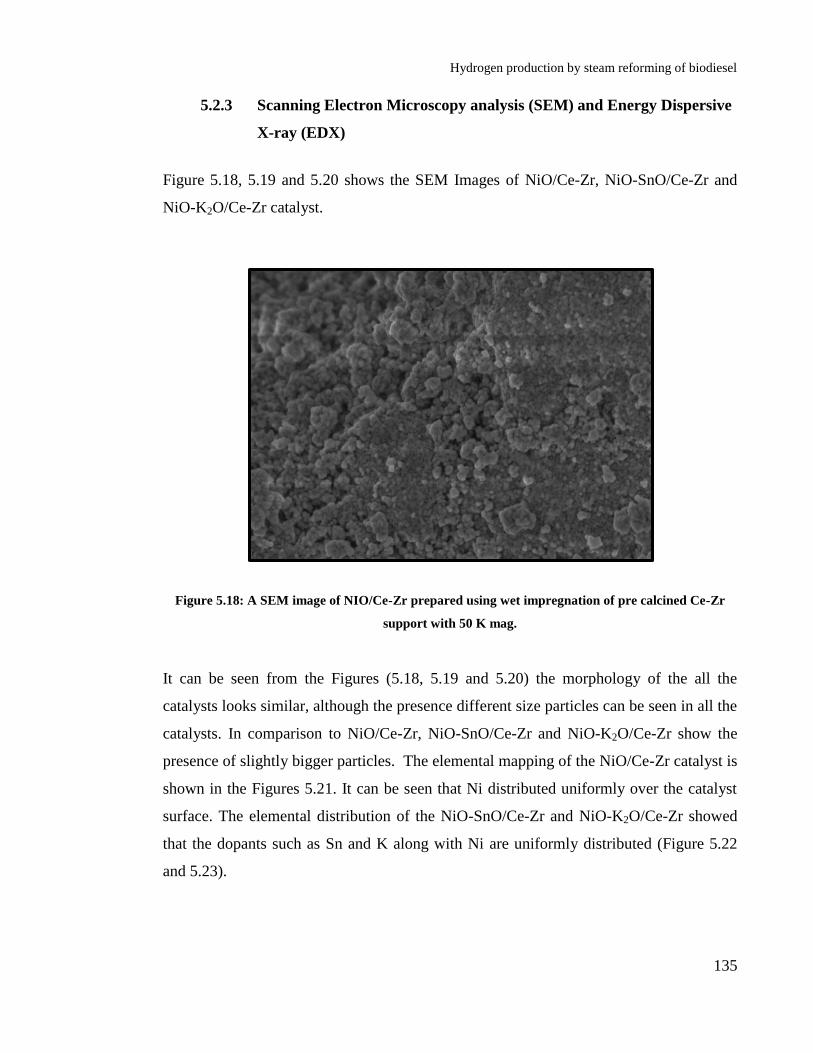
Hydrogen production by steam reforming of biodiesel
135
5.2.3 Scanning Electron Microscopy analysis (SEM) and Energy Dispersive
X-ray (EDX)
Figure 5.18, 5.19 and 5.20 shows the SEM Images of NiO/Ce-Zr, NiO-SnO/Ce-Zr and
NiO-K2O/Ce-Zr catalyst.
Figure 5.18: A SEM image of NIO/Ce-Zr prepared using wet impregnation of pre calcined Ce-Zr
support with 50 K mag.
It can be seen from the Figures (5.18, 5.19 and 5.20) the morphology of the all the
catalysts looks similar, although the presence different size particles can be seen in all the
catalysts. In comparison to NiO/Ce-Zr, NiO-SnO/Ce-Zr and NiO-K2O/Ce-Zr show the
presence of slightly bigger particles. The elemental mapping of the NiO/Ce-Zr catalyst is
shown in the Figures 5.21. It can be seen that Ni distributed uniformly over the catalyst
surface. The elemental distribution of the NiO-SnO/Ce-Zr and NiO-K2O/Ce-Zr showed
that the dopants such as Sn and K along with Ni are uniformly distributed (Figure 5.22
and 5.23).
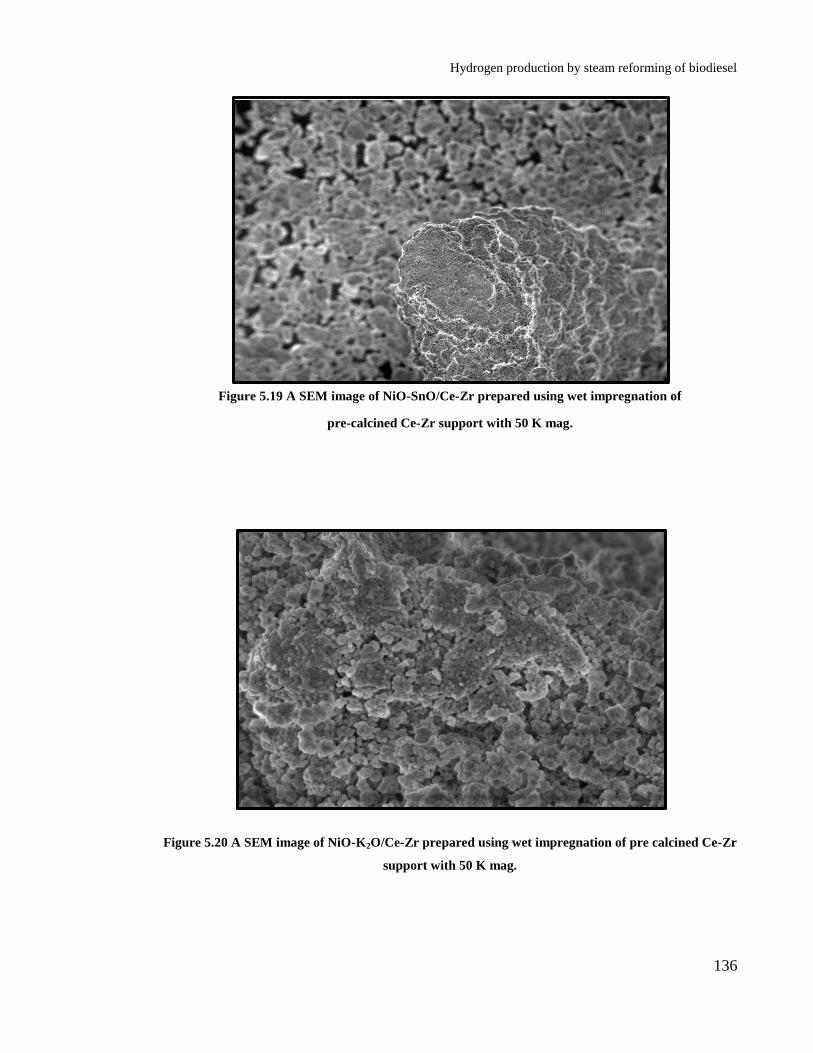
Hydrogen production by steam reforming of biodiesel
136
Figure 5.19 A SEM image of NiO-SnO/Ce-Zr prepared using wet impregnation of
pre-calcined Ce-Zr support with 50 K mag.
Figure 5.20 A SEM image of NiO-K2O/Ce-Zr prepared using wet impregnation of pre calcined Ce-Zr
support with 50 K mag.

Hydrogen production by steam reforming of biodiesel
137
Figure 5.21: Elemental dispersion of the NiO/Ce-Zr prepared by wet impregnation of the precalcined
Ce-Zr support.

Hydrogen production by steam reforming of biodiesel
138
Figure 5.22: Elemental dispersion of the NiO-SnO /Ce-Zr prepared by wet impregnation of the
precalcined Ce-Zr support.
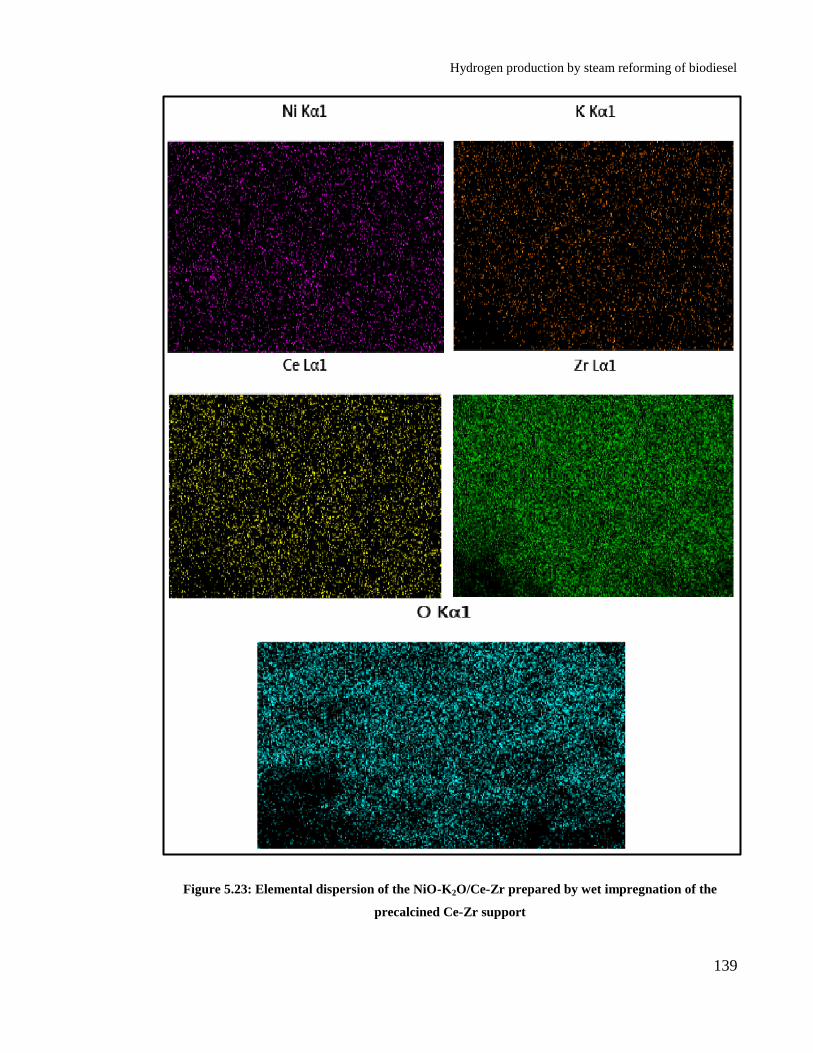
Hydrogen production by steam reforming of biodiesel
139
Figure 5.23: Elemental dispersion of the NiO-K2O/Ce-Zr prepared by wet impregnation of the
precalcined Ce-Zr support

Hydrogen production by steam reforming of biodiesel
140
6. Steam reforming of biodiesel
This evaluation was performed to determine the feasibility of H2 production from
biodiesel using CSR process. The experiments performed are divided into four series. In
the first instance, effect of temperature on the processes performance was evaluated. For
this part of the experiments, steam/carbon (S/C) molar ratio and weight hourly space
velocity (WHSV) was kept constant and the reactor temperature was varied from 600-
800oC. Commercial catalysts (Ni/Al) and (Ni/Ca-Al) were utilised for this part of the
experiments. The biodiesel and water vaporisers were set to 365 and 170oC respectively.
In the second series of experiments, the effect of biodiesel vaporiser temperature on the
processes was examined. Water vaporiser temperature, WHSV, reactor temperature, and
S/C ratio were kept constant at 170°C, 3.52h-1
, 650°C and 3 respectively for these
experiments.
In the third series of experiments, the effect of WHSV on the performance of Ni/Ca-Al
was evaluated using optimum reactor and vaporiser temperatures from series 1 and 2.
Using the results of optimum residence time (WHSV) and reactor temperature, the effect
of various catalysts and different biodiesel feedstocks on the CSR processes was
explored. Various catalyst supports and i.e. ceria-zirconia, calcium aluminate and
alumina on the process were investigated. Biodiesels from various origins i.e. palm oil,
commercial, and prepared in house were used in these experiments. Finally the effect of
molar steam to carbon ratio (S/C) on the performance of the Ni/Ca-Al catalyst was
evaluated at a given WHSV and reactor temperature.
6.1 Reactions involved
Various reactions such as steam reforming (SR), water gas shift (WGS), decomposition
(D), methanation (METH), carbon gasification (GS) and Boudouard reaction (BD) are
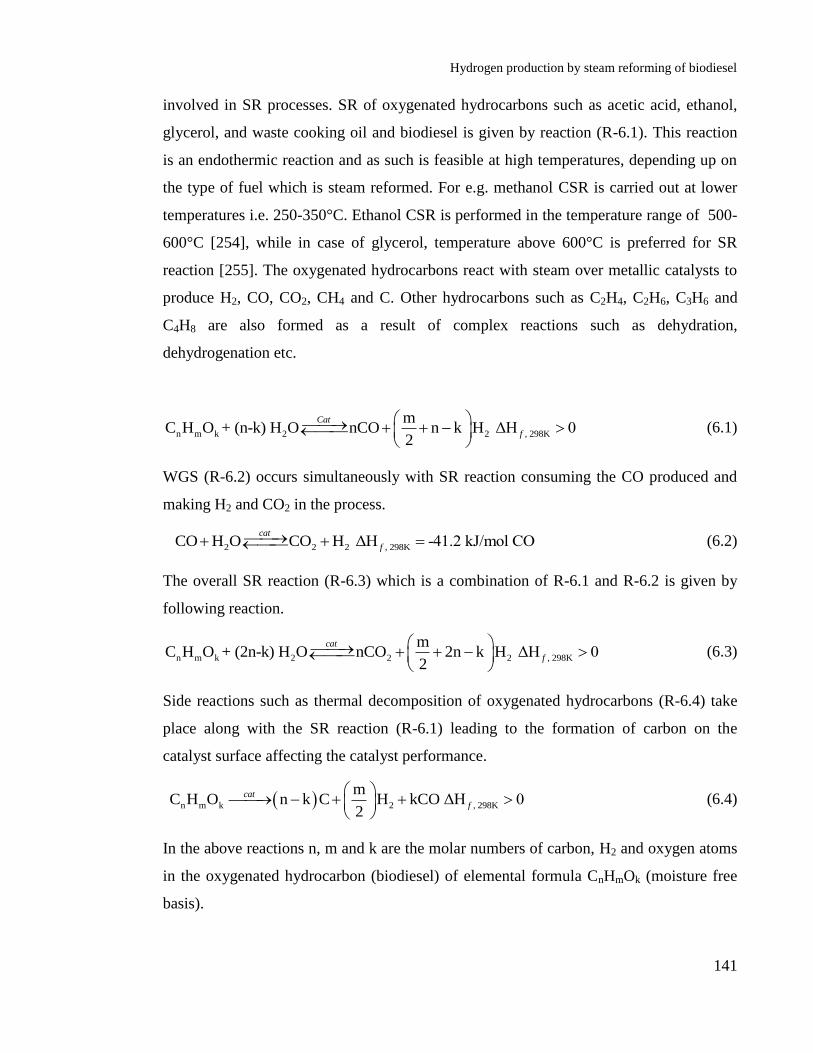
Hydrogen production by steam reforming of biodiesel
141
involved in SR processes. SR of oxygenated hydrocarbons such as acetic acid, ethanol,
glycerol, and waste cooking oil and biodiesel is given by reaction (R-6.1). This reaction
is an endothermic reaction and as such is feasible at high temperatures, depending up on
the type of fuel which is steam reformed. For e.g. methanol CSR is carried out at lower
temperatures i.e. 250-350°C. Ethanol CSR is performed in the temperature range of 500-
600°C [254], while in case of glycerol, temperature above 600°C is preferred for SR
reaction [255]. The oxygenated hydrocarbons react with steam over metallic catalysts to
produce H2, CO, CO2, CH4 and C. Other hydrocarbons such as C2H4, C2H6, C3H6 and
C4H8 are also formed as a result of complex reactions such as dehydration,
dehydrogenation etc.
n m k 2 2 , 298K
mC H O + (n-k) H O nCO n k H ΔH 0
2
Cat
f
(6.1)
WGS (R-6.2) occurs simultaneously with SR reaction consuming the CO produced and
making H2 and CO2 in the process.
2 2 2 , 298K CO H O CO H ΔH -41.2 kJ/mol COcat
f (6.2)
The overall SR reaction (R-6.3) which is a combination of R-6.1 and R-6.2 is given by
following reaction.
n m k 2 2 2 , 298K
mC H O + (2n-k) H O nCO 2n k H ΔH 0
2
cat
f
(6.3)
Side reactions such as thermal decomposition of oxygenated hydrocarbons (R-6.4) take
place along with the SR reaction (R-6.1) leading to the formation of carbon on the
catalyst surface affecting the catalyst performance.
n m k 2 , 298K
m C H O n k C H kCO ΔH 0
2
cat
f
(6.4)
In the above reactions n, m and k are the molar numbers of carbon, H2 and oxygen atoms
in the oxygenated hydrocarbon (biodiesel) of elemental formula CnHmOk (moisture free
basis).

Hydrogen production by steam reforming of biodiesel
142
Other reactions which affect the H2 yield and performance of the catalyst are given by
(R-6.5) to (R-6.7).
2 4 2 , 298K CO 3H CH H O ΔH 206.2 kJ/mol COcat
f (6.5)
METH reaction (R-6.5) competes with SR reaction (R-6.1) consuming H2 and affecting
H2 yield. Temperature plays an important role in governing the extent of this reaction.
METH reaction (forward R-6.5) is dominant at low temperature up to 400°C, consuming
H2 and CO producing CH4 and H2O. Above 600°C, reverse R-6.5 i.e. steam methane
reforming (SMR) is promoted, consuming CH4 and H2O and producing H2 and CO.
In addition to the above reactions, (R-6.6) and (R-6.7) reactions are the important
reactions which occur at high temperatures and are responsible for carbon removal from
catalyst surface, affecting the life and the performance of the catalyst.
2 2 , 298K C H O CO H ΔH 131.3 kJ/mol Ccat
f (6.6)
2 , 298K 22CO CO C ΔH 172.5 kJ/mol COcat
f (6.7)
6.2 Experimental procedure
As different types of catalysts were used in the evaluations, different procedures were
adopted for loading the catalysts. In case of the commercial catalysts i.e. Ni/Al and
Ni/Ca-Al were crushed from bigger pellets (5 mm diameter) and then sieved to obtain
particle size of 0.85-2mm diameter. This size was chosen to prevent pressure drop in the
system. For each evaluation 2.0506 g of catalyst was used. The catalysts were
sandwiched in two quartz wool plugs of 4 μm size and were placed in the reactor for the
evaluation. The powder catalysts were mixed with quartz sand of 150-200 m size to
make up 2.0506 g of reactor load. After every run the experimental set up was flushed
overnight with nitrogen in order to remove the biodiesel vapours and steam and collect
them in the gas liquid separation part of the condenser.

Hydrogen production by steam reforming of biodiesel
143
An experiment was performed in a day consisted of 4 main stages. The first stage
involved reactor cleaning and unloading the used catalyst from the previous experiment.
All the pipes and connections were thoroughly cleaned with acetone to remove
condensed biodiesel. In second stage the reactor containing fresh catalyst was attached to
the setup and all the pipes along with the connections were leak tested. The third stage
consisted of reducing fresh catalyst with 5 vol % H2/N2 mixture (200 cm3/min). Once the
fresh catalyst was loaded in the reactor, the reactor temperature was increased to the
desired set point by turning on the furnace under flowing N2 (200 cm3/min). Upon
reaching the set point indicated by reactor bed thermocouple, the N2 flow was switched
off and the H2/N2 flow was turned on. The completion of the catalyst reduction was
shown by a return to steady state H2 concentration (5% H2) measured by gas
chromatograph. Finally in the last stage the experimental set up was then flushed with
pure N2 to remove the H2 used during reduction, and the vaporisers were turned on. Once
the vaporisers reached the set point, the heating tape was turned on. Both these steps are
performed using high N2 flowrate in order to remove any unreacted biodiesel vapours
from previous experiments. The flowrate of N2 was then lowered to the desired value
depending on the experiment and the syringe pumps were turned on. The flow rate of N2
was set in the range 30-50 cm3/min (STP), depending on the WHSV value chosen for the
experiment. In the experiments performed using commercial biodiesel, biodiesel flowrate
was set to 0.978 cm3/h which gave a carbon input flowrate of 1.50 10
-5 mol/s. The water
flow rate was varied from 1.95 to 2.92 cm3/h to obtain the desired S/C of 2 and 3
respectively. The flow rates of other biodiesel feedstocks examined were adjusted
according to the elemental analysis and the density of the biodiesel to get the desired S/C.
6.3 Process outputs and elemental balances
The process performance was measured in terms of fuel and steam conversion (Xbiod and
XH2O), H2 yield (YH2,) and H2 yield efficiency (YH2, eff), selectivity to carbon containing
products (SC-i) and to H2 containing products (SH-i) using Eqs 6.8-6.28, respectively. In
these Eqs, n is a molar flow rate, and y represents a dry gas mol fraction in the products,
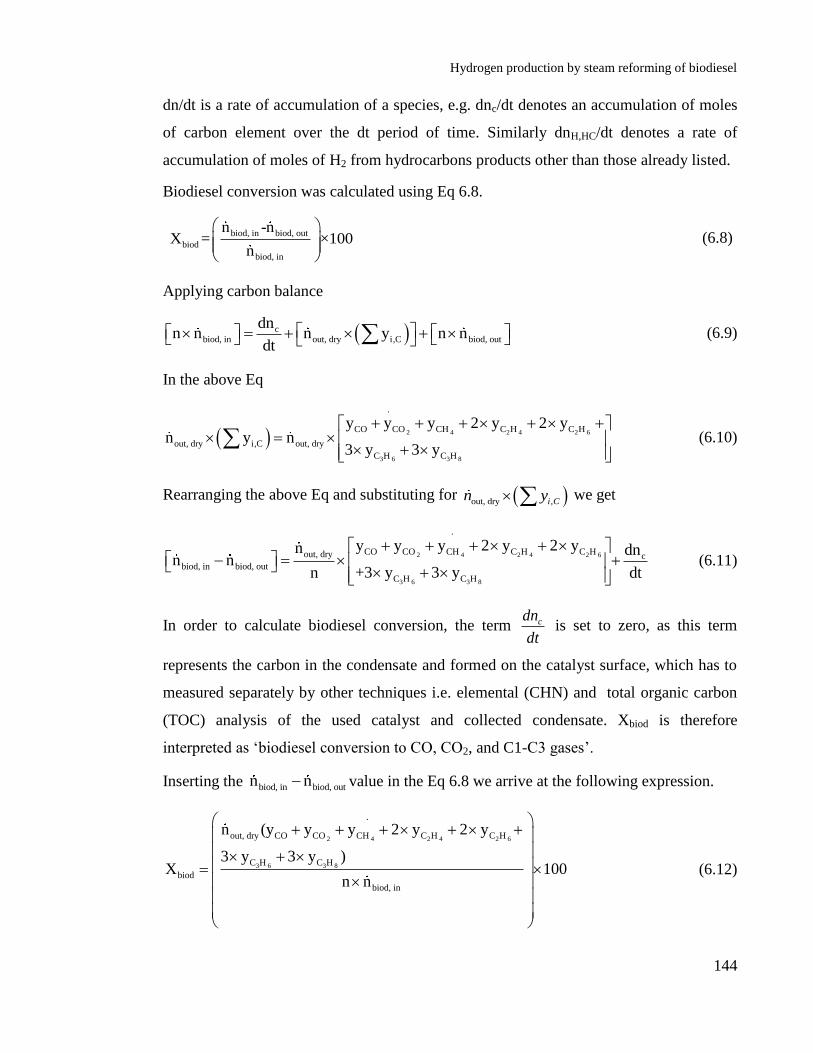
Hydrogen production by steam reforming of biodiesel
144
dn/dt is a rate of accumulation of a species, e.g. dnc/dt denotes an accumulation of moles
of carbon element over the dt period of time. Similarly dnH,HC/dt denotes a rate of
accumulation of moles of H2 from hydrocarbons products other than those already listed.
Biodiesel conversion was calculated using Eq 6.8.
biod, in biod, out
biod
biod, in
n -nX = ×100
n
(6.8)
Applying carbon balance
cbiod, in out, dry i,C biod, out
dnn n n y n n
dt (6.9)
In the above Eq
2 4 2 4 2 6
3 6 3 8
.
CO CO CH C H C H
out, dry i,C out, dry
C H C H
y y y 2 y 2 yn y n
3 y 3 y
(6.10)
Rearranging the above Eq and substituting for out, dry ,i Cn y we get
2 4 2 4 2 6
3 6 3 8
.
CO CO CH C H C Hout, dry cbiod, in biod, out
C H C H
y y y 2 y 2 yn dnn n
+3 y 3 yn dt
(6.11)
In order to calculate biodiesel conversion, the term dt
dnc is set to zero, as this term
represents the carbon in the condensate and formed on the catalyst surface, which has to
measured separately by other techniques i.e. elemental (CHN) and total organic carbon
(TOC) analysis of the used catalyst and collected condensate. Xbiod is therefore
interpreted as ‘biodiesel conversion to CO, CO2, and C1-C3 gases’.
Inserting the biod, in biod, outn n value in the Eq 6.8 we arrive at the following expression.
2 4 2 4 2 6
3 6 3 8
.
out, dry CO CO CH C H C H
C H C H
biod
biod, in
n (y y y 2 y 2 y
3 y 3 y )X 100
n n
(6.12)

Hydrogen production by steam reforming of biodiesel
145
Steam conversion is obtained using the Eq 6.13.
2 2
2
2
H O,in H O,out
H O
H O,in
n nX 100
n
(6.13)
Applying hydrogen balance, Eq 6.14
2
2
biod, in H O, in biod, out out, dry i, H
H,HC
H O, out
m n 2 n m n n ( y )
dn2 n
dt
(6.14)
Rearranging the Eq 6.14 we get Eq 6.15.
2 2
H,HC
H O, in H O, out biod, out biod, in
out, dry i,H
dn2 n n m n m n
dt
n ( y )
(6.15)
In the Eq 6.16, out, dry i,Hn y is substituted by the following term.
2 4 2 4 2 6
3 6 3 8
.
H CH C H C H
out, dry i out, dry,HC H C H
2×y +4×y +4×y +6×yn × y =n ×
+6×y +8×y
(6.16)
Finally the following expression (Eq 6.17) is derived by substituting 2 2H O, in H O, out(n n )
in Eq 6.13 and setting H,HCdn
dt to 0. This simplification may introduce a small error in the
calculated value of water conversion only if the condensates are shown to contain
significant amounts of organic H2. It will be shown later in the results section that this
amount was negligible based on the full carbon balance.
2 4 2 4 2 6
3 6 3 8
2
2
.
out, dry H CH C H C H
C H C H biod, in biod
H O
H O, in
n (2 y 4 y 4 y 6 y
6 y 8 y ) 0.5m (n X )X 100
n
(6.17)
Dry gas molar flowrate out, dryn is calculated using nitrogen balance.

Hydrogen production by steam reforming of biodiesel
146
2 2biod, in N , in out, dry N , out biod, outj×n + 2×n = n × 2×y + j×n
(6.18)
Where j is the elemental N in biodiesel, which is here is set to 0 due to its negligible
contribution to the nitrogen balance.
Rearranging the Eq 6.18 we get
2, in
2, out
N
out, dry
N
nn
y
(6.19)
In the above Eqs biod, inn 2H O, inn are the molar flow rates of biodiesel and water fed to the
reactor, dryout n is the molar flow rate of dry gases leaving the reactor and yi is the mol
fraction of i in the dry gas output. All the flowrates of biodiesel, water and dry gases are
in mol/s. Molar flow rate of biodiesel and water are calculated using Eq 6.20 and 6.21,
where ρ is kg/m3 ,
.
V is the volumetric flowrate in m3/s and W denotes a molar mass in
kg/mol, relevant to biodiesel and water respectively.
biod, in biod, in biod, in
biod, inbiodbiod
m ρ Vn mol/s
W W
(6.20)
2 2 2
2
2 2
H O, in H O, in H O, in
H O, in
H O H O
m ρ ×Vn = = mol /s
W W
(6.21)
H2 yield was calculated using Eq 6.22.
2 2
2
H H out, dry
H
biod biod, in
W yY (wt%) 100
W
n
n
(6.22)
Eq 6.22 can also be applied to determine CH4 yield,
Selectivities for the H2 (SH-H2) and carbon containing gases (SC) were determined by
using the following Eqs. Eq 6.23 and 6.24 provide selectivity to H2 (SH-H2) and to CH4
(SH-CH4) with respect to H2 containing gases.

Hydrogen production by steam reforming of biodiesel
147
2
2
2 4 2 4 2 6 3 6 3 8
H
H H .
H CH C H C H C H C H
yS 100
y y y y y y
(6.23)
4
4
2 4 2 4 2 6 3 6 3 8
CH
H H .
H CH C H C H C H C H
yS 100
y y y y y yC
(6.24)
Selectivity of CO (SC-CO) and CO2 (SC-CO2) with respect to carbon containing gases is
given below.
2 4 2 4 2 6 3 6 3 8
COC CO .
CO CO CH C H C H C H C H
y100
y y y y y y y
S
(6.25)
2
2
2 4 2 4 2 6 3 6 3 8
CO
C CO .
CO CO CH C H C H C H C H
y100
y y y y y y y
S
(6.26)
Efficiencies of the process are defined with the following Eqs.
Fuel reforming efficiency is given by Eq 6.27.
H , out 22H
biod, in biod
n LHVReforming (eff %) 100
n LHV
(6.27)
In the above LHV refers to the lower heating values of H2 and biodiesel in kJ/mol. The
LHV for H2 is 24.0 kJ/mol. A singe value of 37.5 kJ/mol was used for the LHV of
biodiesel despite the small differences in C, H and O content due to the different
feedstocks investigated in this work. H2 and biodiesel molar flowrates in the Eq are
represented by 2H
n and biod, inn respectively.
H2 yield and steam conversion efficiencies are defined as the ratio of H2 yield or steam
conversion obtained during the experiment to that predicted by chemical equilibrium.
2
2
2
H exp
H
H eq
(Y )Y (eff %) 100
(Y )
(6.28)
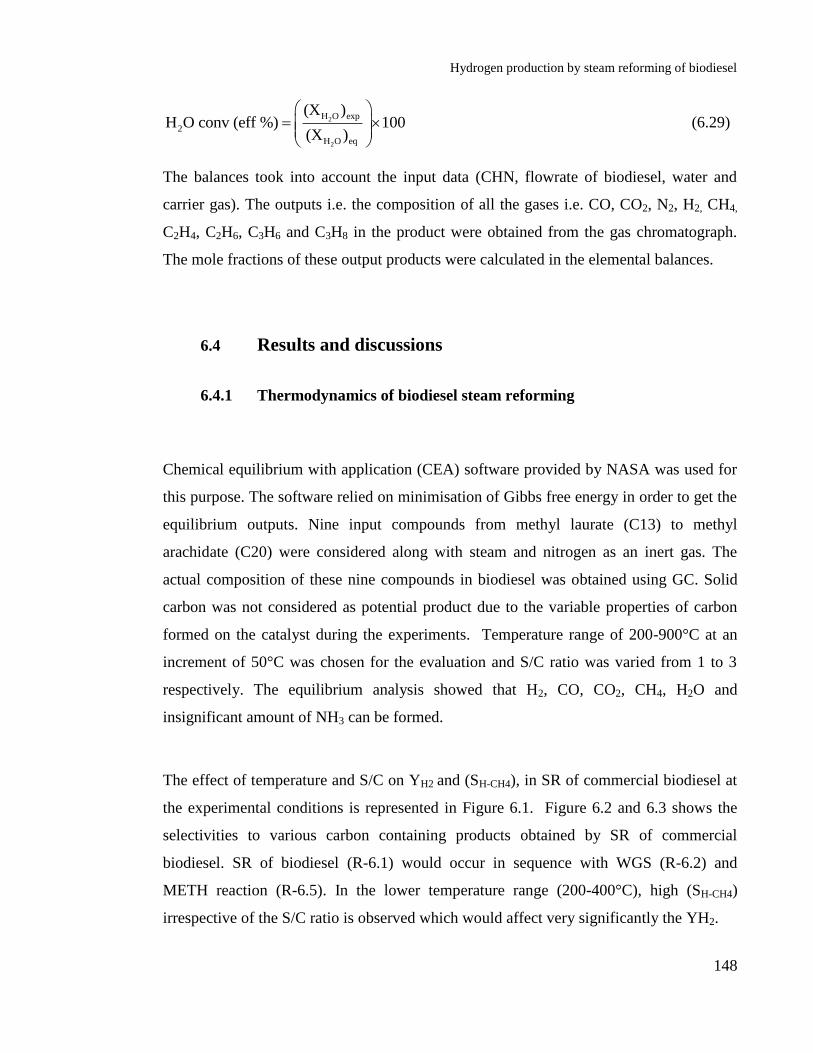
Hydrogen production by steam reforming of biodiesel
148
2
2
H O exp
2
H O eq
(X )H O conv (eff %) 100
(X )
(6.29)
The balances took into account the input data (CHN, flowrate of biodiesel, water and
carrier gas). The outputs i.e. the composition of all the gases i.e. CO, CO2, N2, H2, CH4,
C2H4, C2H6, C3H6 and C3H8 in the product were obtained from the gas chromatograph.
The mole fractions of these output products were calculated in the elemental balances.
6.4 Results and discussions
6.4.1 Thermodynamics of biodiesel steam reforming
Chemical equilibrium with application (CEA) software provided by NASA was used for
this purpose. The software relied on minimisation of Gibbs free energy in order to get the
equilibrium outputs. Nine input compounds from methyl laurate (C13) to methyl
arachidate (C20) were considered along with steam and nitrogen as an inert gas. The
actual composition of these nine compounds in biodiesel was obtained using GC. Solid
carbon was not considered as potential product due to the variable properties of carbon
formed on the catalyst during the experiments. Temperature range of 200-900°C at an
increment of 50°C was chosen for the evaluation and S/C ratio was varied from 1 to 3
respectively. The equilibrium analysis showed that H2, CO, CO2, CH4, H2O and
insignificant amount of NH3 can be formed.
The effect of temperature and S/C on YH2 and (SH-CH4), in SR of commercial biodiesel at
the experimental conditions is represented in Figure 6.1. Figure 6.2 and 6.3 shows the
selectivities to various carbon containing products obtained by SR of commercial
biodiesel. SR of biodiesel (R-6.1) would occur in sequence with WGS (R-6.2) and
METH reaction (R-6.5). In the lower temperature range (200-400°C), high (SH-CH4)
irrespective of the S/C ratio is observed which would affect very significantly the YH2.

Hydrogen production by steam reforming of biodiesel
149
Figure 6.1: Effect of temperature on equilibrium H2 yield (YH2) and CH4 (SC-CH4) selectivity in steam
reforming of commercial biodiesel at different S/C ratios, and 1 atm.
This could be the result of METH (R-6.5) reaction. It was considered that eliminating
CH4 from the potential equilibrium products would not be justified since in practice, Ni
catalysts are active in both SR and METH reactions. WGS reaction (R-6.2) is also active
in this temperature region, which could explain the presence of some amount of H2
(lower yield) in this temperature range.
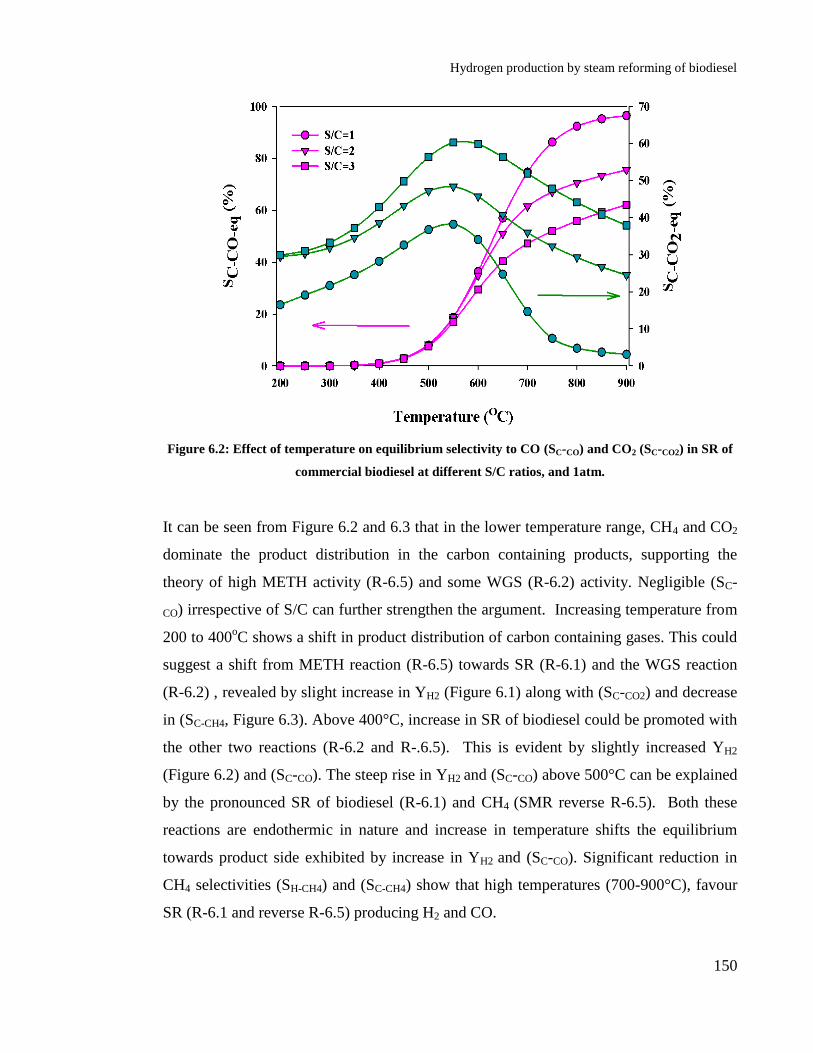
Hydrogen production by steam reforming of biodiesel
150
Figure 6.2: Effect of temperature on equilibrium selectivity to CO (SC-CO) and CO2 (SC-CO2) in SR of
commercial biodiesel at different S/C ratios, and 1atm.
It can be seen from Figure 6.2 and 6.3 that in the lower temperature range, CH4 and CO2
dominate the product distribution in the carbon containing products, supporting the
theory of high METH activity (R-6.5) and some WGS (R-6.2) activity. Negligible (SC-
CO) irrespective of S/C can further strengthen the argument. Increasing temperature from
200 to 400oC shows a shift in product distribution of carbon containing gases. This could
suggest a shift from METH reaction (R-6.5) towards SR (R-6.1) and the WGS reaction
(R-6.2) , revealed by slight increase in YH2 (Figure 6.1) along with (SC-CO2) and decrease
in (SC-CH4, Figure 6.3). Above 400°C, increase in SR of biodiesel could be promoted with
the other two reactions (R-6.2 and R-.6.5). This is evident by slightly increased YH2
(Figure 6.2) and (SC-CO). The steep rise in YH2 and (SC-CO) above 500°C can be explained
by the pronounced SR of biodiesel (R-6.1) and CH4 (SMR reverse R-6.5). Both these
reactions are endothermic in nature and increase in temperature shifts the equilibrium
towards product side exhibited by increase in YH2 and (SC-CO). Significant reduction in
CH4 selectivities (SH-CH4) and (SC-CH4) show that high temperatures (700-900°C), favour
SR (R-6.1 and reverse R-6.5) producing H2 and CO.

Hydrogen production by steam reforming of biodiesel
151
Figure 6.3: Effect of temperature on equilibrium selectivity to CH4 ((SC-CH4) in SR of commercial
biodiesel at different S/C ratios, and 1atm.
Although at these high temperatures (SC-CO) also increases due to shift in equilibrium to
reverse water shift reaction (reverse R-6.2) towards the reactants consuming H2 and CO2
thus affecting YH2 (Figure 6.1).
The shallow dip in YH2 at higher temperature and steep rise at lower temperatures can be
explained by strong endothermic nature of SR reactions (biodiesel (R-6.1) and CH4
(reverse R-6.5)) over weak exothermic WGS reaction (R-6.2). In addition to temperature,
S/C plays an important role in SR reactions. According to Le Chatelier’s principle
increasing S/C ratio increases YH2. The YH2 peaked at different temperatures when S/C
ratio was varied. At the lowest S/C of 1, YH2 increased all the way up till 900°C. The
peak yield temperature reduced to 750 and 700°C for S/C of 2 and 3 respectively. This
could be as a result of stronger effect of S/C on SR reactions (R-6.1 and (reverse R-6.5)
as compared to WGS (R-6.2).

Hydrogen production by steam reforming of biodiesel
152
Increasing S/C ratio promotes SR (R-6.1) increasing H2 yield. Likewise SMR (reverse
R-6.5), also increases with rise S/C ratio affecting YH2 above 500°C. Increased S/C
below 500°C, promoted WGS reaction as seen by decreased CO (SC-CO) and increased
CO2 (SC-CO2) selectivities (Figure 6.2). Thus increased S/C ratio has a positive impact on
YH2 and reduces formation of by products such as CH4. Higher S/C ratio in practice
would require larger reactor volumes to accommodate the high steam flowrates. It would
also mean higher cost of steam generation and would increase volume of recycled water
in the plant.
6.4.2 Effect of temperature
The effect of temperature on CSR of biodiesel was studied using commercial biodiesel in
the temperature range of 600-800°C using the commercial Ni/Al catalyst is shown in
Figure 6.4.
The CSR evaluations were performed using biodiesel liquid flow rate of 0.978 ml/h (20
ºC) and liquid water flow of 2.92 ml/h (20 ºC) with nitrogen gas flow rate of 50 ml/min
(STP), using 365 and 170 oC vaporiser temperatures for biodiesel and water respectively.
The biodiesel flow rate accounted for a carbon feed rate of 1.50 10-5
mol /s for all the
experiments, which is used to perform the carbon balance as shown in Table 6.1.
Hydrogen production by steam reforming of biodiesel
153
Figure 6.4: Effect of temperature on CSR of commercial biodiesel at S/C of 3 and WHSV of 3.52 h-1
using 365 and 170°C biodiesel and water vaporiser temperatures.
In order to check reproducibility of the experiments each experiment was performed
twice, and the best one among the two in terms of stability of conversion biodiesel and
water was chosen for further analysis i.e. to perform carbon balance and other
characterisation work. The experiments were performed for duration of 7200 s. Table 6.1
lists the molar carbon balance consisting of gas (‘C in gases’) and volatiles products (‘C
in the condensate’), as well as carbon deposited as coke on the catalyst (‘C on catalyst’).
It is important to note that the term coke carbon carried the largest uncertainties, as it
relied on samples taken from the catalyst bed, the difficulty residing in collecting thin
layers of carbonaceous residue deposited on other parts of the reactor and seeping
through the sample lines. Further as the catalysts were supported on quartz wool, some
amount of carbon was deposited on the top layer of the quartz wool, which was not
analysed. The used catalyst pellets were crushed before they were subjected to elemental
analysis for detection of coke carbon on the catalyst surface, some carbon would have
been lost during the crushing processes. All these reasons could explain why the carbon
balance was in some cases within 12-13 mol% of the carbon feed. Another explanation
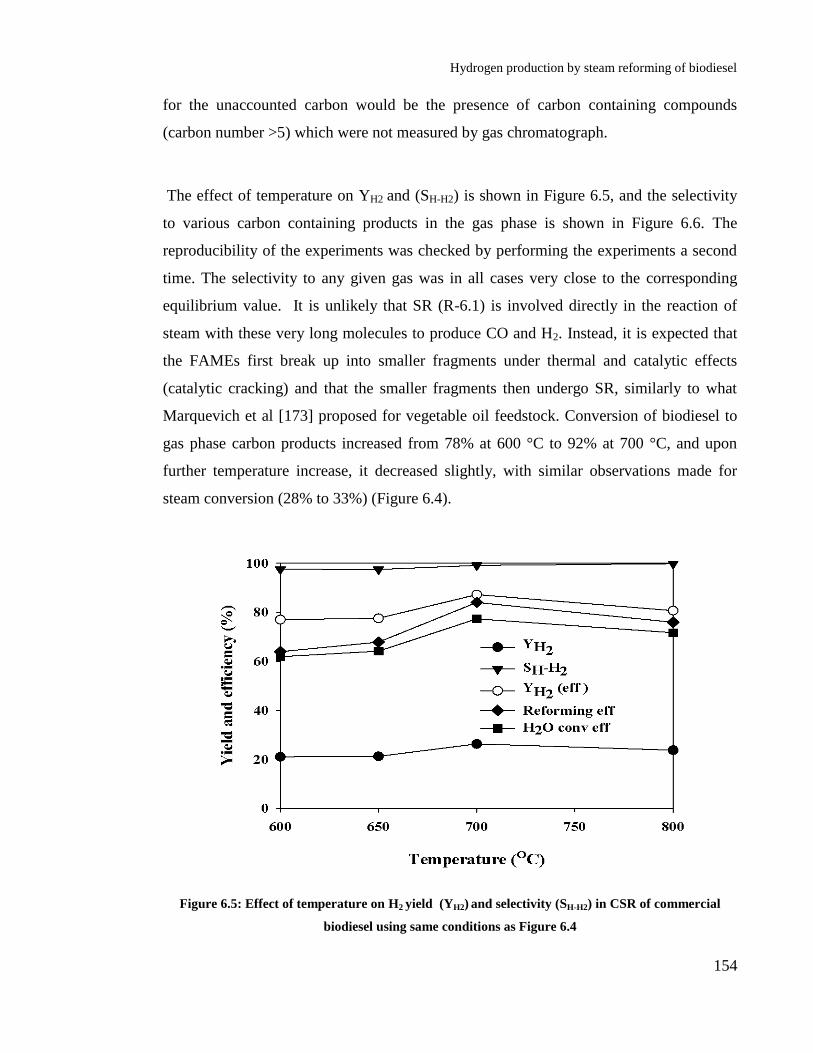
Hydrogen production by steam reforming of biodiesel
154
for the unaccounted carbon would be the presence of carbon containing compounds
(carbon number >5) which were not measured by gas chromatograph.
The effect of temperature on YH2 and (SH-H2) is shown in Figure 6.5, and the selectivity
to various carbon containing products in the gas phase is shown in Figure 6.6. The
reproducibility of the experiments was checked by performing the experiments a second
time. The selectivity to any given gas was in all cases very close to the corresponding
equilibrium value. It is unlikely that SR (R-6.1) is involved directly in the reaction of
steam with these very long molecules to produce CO and H2. Instead, it is expected that
the FAMEs first break up into smaller fragments under thermal and catalytic effects
(catalytic cracking) and that the smaller fragments then undergo SR, similarly to what
Marquevich et al [173] proposed for vegetable oil feedstock. Conversion of biodiesel to
gas phase carbon products increased from 78% at 600 °C to 92% at 700 °C, and upon
further temperature increase, it decreased slightly, with similar observations made for
steam conversion (28% to 33%) (Figure 6.4).
Figure 6.5: Effect of temperature on H2 yield (YH2) and selectivity (SH-H2) in CSR of commercial
biodiesel using same conditions as Figure 6.4
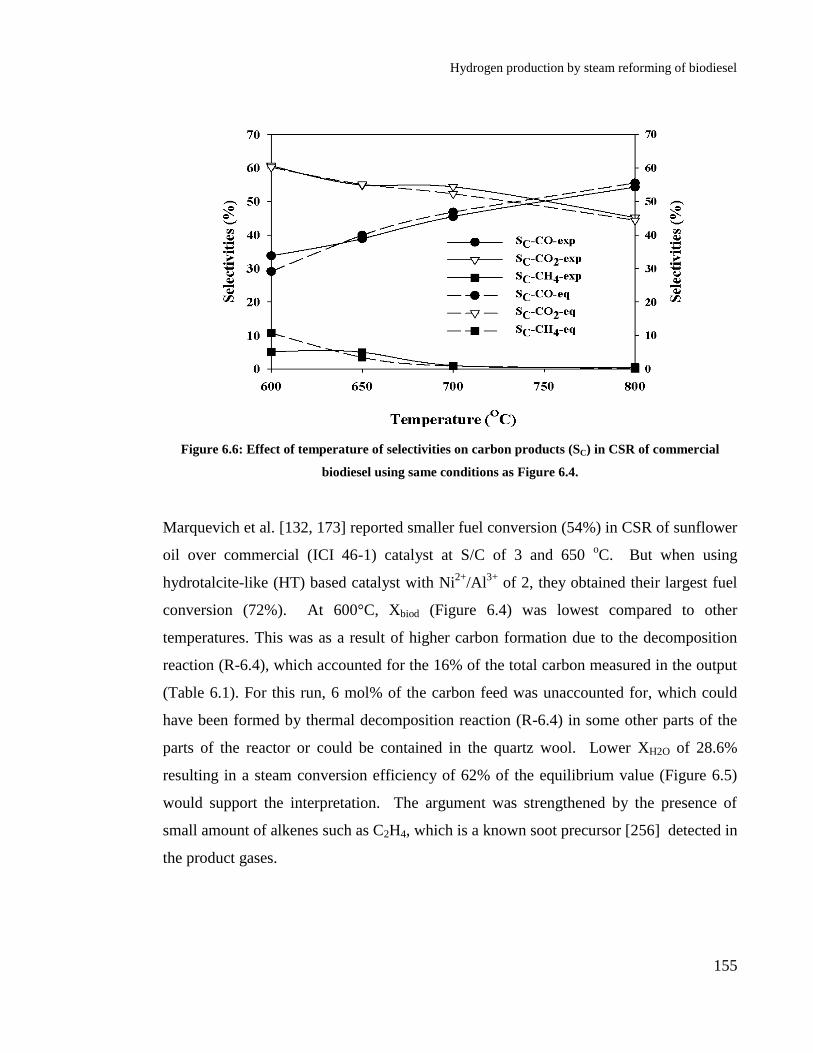
Hydrogen production by steam reforming of biodiesel
155
Figure 6.6: Effect of temperature of selectivities on carbon products (SC) in CSR of commercial
biodiesel using same conditions as Figure 6.4.
Marquevich et al. [132, 173] reported smaller fuel conversion (54%) in CSR of sunflower
oil over commercial (ICI 46-1) catalyst at S/C of 3 and 650 oC. But when using
hydrotalcite-like (HT) based catalyst with Ni2+
/Al3+
of 2, they obtained their largest fuel
conversion (72%). At 600°C, Xbiod (Figure 6.4) was lowest compared to other
temperatures. This was as a result of higher carbon formation due to the decomposition
reaction (R-6.4), which accounted for the 16% of the total carbon measured in the output
(Table 6.1). For this run, 6 mol% of the carbon feed was unaccounted for, which could
have been formed by thermal decomposition reaction (R-6.4) in some other parts of the
parts of the reactor or could be contained in the quartz wool. Lower XH2O of 28.6%
resulting in a steam conversion efficiency of 62% of the equilibrium value (Figure 6.5)
would support the interpretation. The argument was strengthened by the presence of
small amount of alkenes such as C2H4, which is a known soot precursor [256] detected in
the product gases.

Hydrogen production by steam reforming of biodiesel
156
At 650 °C, the amount of unaccounted carbon was high (13.2%), which suggested that
the decomposition occurred in other parts of the reactor rather than on the catalyst surface
(4% of total C-products, Table 6.1). This was likely due to the reverse Boudouard
reaction (R-.6), shown by reduced carbon formation on catalyst (Table 6.1) in addition to
(SC-CO2) and increased (SC-CO) (Figure 6.6). Similarly steam conversion efficiency
(Figure 6.5) increased only by 3% which can backs the hypothesis. A YH2 of 21.1 wt%
(YH2 (eff) of 77%) and 21.6 wt% (YH2 (eff) of 77.5%) were measured at 600 and 650oC
(Figure 6.5). Reforming efficiency of the system was also unaffected significantly since
there was no appreciable change in the YH2.
At 700 oC, biodiesel Xbiod and XH2O increased (Figure 6.4) under combined effects of
increase in SR (R-6.1), SMR (reverse R-6.5), and TD (R-6.4). The carbon balance for
700 °C was near zero, while carbon in the condensates was negligible; indicating the
products were gases CO, CO2, CH4 and carbonaceous residue on the catalyst (7% of total
C products). This implied the fuel conversion was now overwhelmingly consisting of
catalytic reactions (R-6.1, reverse (R-6.5) and (R-6.4)) as seen by increased YH2 (Figure
6.5) along with (SH-H2) and (SC-CO) (Figure 6.6) supporting the hypothesis. Highest
biodiesel and steam conversions (XH2O) of 92.3 and 36.3% at 700 oC resulted in the
highest yield and YH2 (eff)) (87.2%, Figure 6.5). At similar S/C of 2.5 and 700 oC with
WHSV of 1.967 h-1
, Pimenidou et al [174] reported lower fuel (although this was waste
cooking oil) and steam conversions i.e. 86.3% and 35.7%, respectively. Figure 6.7 shows
the changes in biodiesel and steam conversion with respect to time at 700°C. Initially the
values oscillate substantially. One of the reasons for this could be the smaller flowrates of
biodiesel and water. As the flowrates of the biodiesel (0.978 cm3/h) and water (2.92
cm3/h) used are smaller and size of the vapourisation (1/4’’) is bigger, it takes ~1800 s to
generate enough vapours to assure continues flow over the catalyst bed to achieve steady
state. The average Xbiod and XH2O values were selected from the point where steady
readings of H2 produced were observed (2250 s). The slandered deviation was quite small
for both the Xbiod and XH2O. A deviation of 6.2 and 2.3 % was observed for Xbiod and
XH2O.
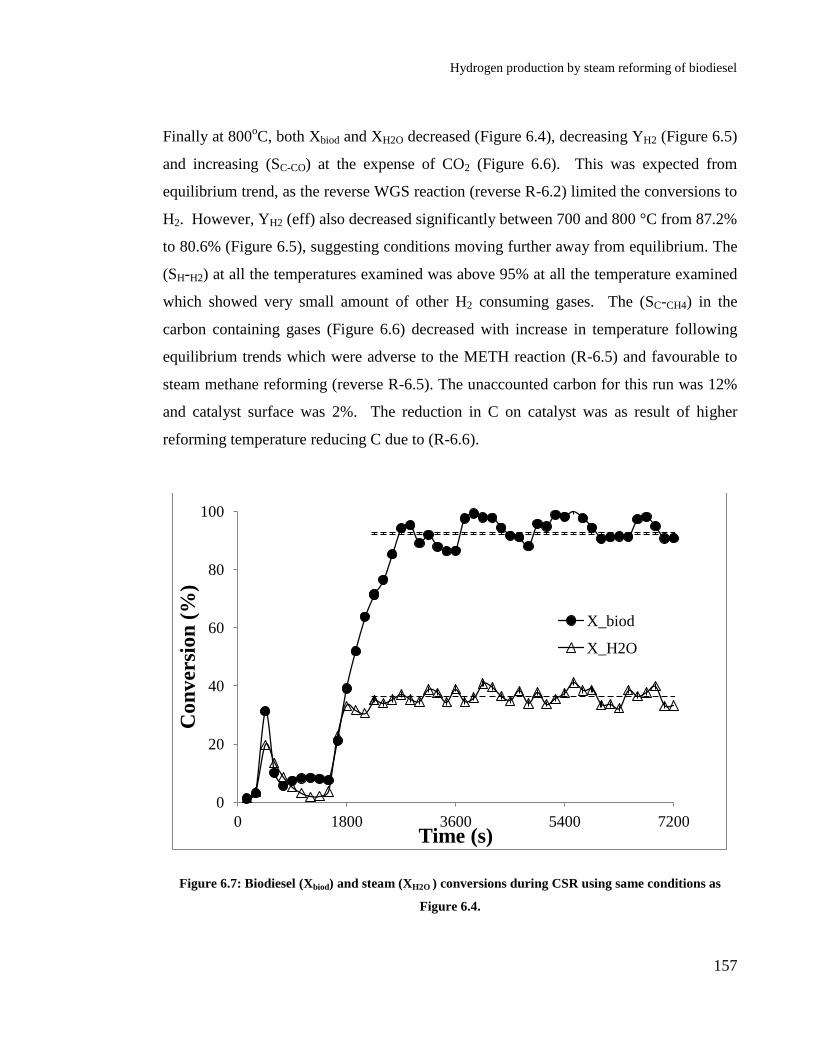
Hydrogen production by steam reforming of biodiesel
157
Finally at 800oC, both Xbiod and XH2O decreased (Figure 6.4), decreasing YH2 (Figure 6.5)
and increasing (SC-CO) at the expense of CO2 (Figure 6.6). This was expected from
equilibrium trend, as the reverse WGS reaction (reverse R-6.2) limited the conversions to
H2. However, YH2 (eff) also decreased significantly between 700 and 800 °C from 87.2%
to 80.6% (Figure 6.5), suggesting conditions moving further away from equilibrium. The
(SH-H2) at all the temperatures examined was above 95% at all the temperature examined
which showed very small amount of other H2 consuming gases. The (SC-CH4) in the
carbon containing gases (Figure 6.6) decreased with increase in temperature following
equilibrium trends which were adverse to the METH reaction (R-6.5) and favourable to
steam methane reforming (reverse R-6.5). The unaccounted carbon for this run was 12%
and catalyst surface was 2%. The reduction in C on catalyst was as result of higher
reforming temperature reducing C due to (R-6.6).
Figure 6.7: Biodiesel (Xbiod) and steam (XH2O ) conversions during CSR using same conditions as
Figure 6.4.
0
20
40
60
80
100
0 1800 3600 5400 7200
Co
nv
ersi
on
(%
)
Time (s)
X_biod
X_H2O
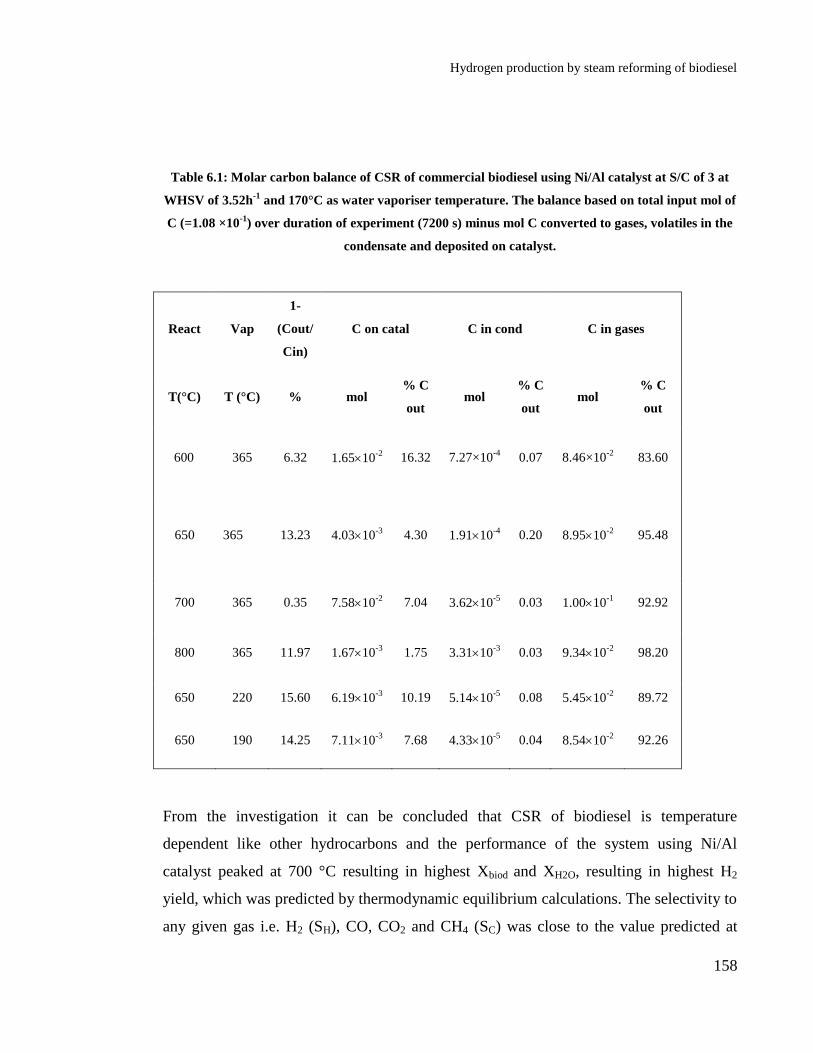
Hydrogen production by steam reforming of biodiesel
158
Table 6.1: Molar carbon balance of CSR of commercial biodiesel using Ni/Al catalyst at S/C of 3 at
WHSV of 3.52h-1
and 170°C as water vaporiser temperature. The balance based on total input mol of
C (=1.08 ×10⁻¹
) over duration of experiment (7200 s) minus mol C converted to gases, volatiles in the
condensate and deposited on catalyst.
React
Vap
1-
(Cout/
Cin)
C on catal C in cond C in gases
T(°C) T (°C) % mol % C
out mol
% C
out mol
% C
out
600 365 6.32
1.6510-2
16.32 7.27×10⁻⁴
0.07 8.46×10⁻²
83.60
650
365 13.23 4.0310-3
4.30 1.9110-4
0.20 8.9510-2
95.48
700 365 0.35 7.5810-2
7.04 3.6210-5
0.03 1.0010-1
92.92
800 365 11.97 1.6710-3
1.75 3.3110-3
0.03 9.3410-2
98.20
650 220 15.60 6.1910-3
10.19 5.1410-5
0.08 5.4510-2
89.72
650 190 14.25 7.1110-3
7.68 4.3310-5
0.04 8.5410-2
92.26
From the investigation it can be concluded that CSR of biodiesel is temperature
dependent like other hydrocarbons and the performance of the system using Ni/Al
catalyst peaked at 700 °C resulting in highest Xbiod and XH2O, resulting in highest H2
yield, which was predicted by thermodynamic equilibrium calculations. The selectivity to
any given gas i.e. H2 (SH), CO, CO2 and CH4 (SC) was close to the value predicted at

Hydrogen production by steam reforming of biodiesel
159
equilibrium. Carbon balance for this particular temperature exhibited almost complete
closure, which meant all the carbon entering the reactor was accounted for in the gas
products and accumulated on the catalyst.
6.4.3 Effect of biodiesel preheating
Table 6.2 shows the effect of biodiesel preheating temperatures on CSR of commercial
biodiesel at S/C of 3 using WHSV of 3.52 h-1
with 1.50 10
-5 mol /s carbon molar feed
flowrate. The reactor temperature was set to at 650 °C rand 170 °C as reactor and water
vaporiser temperatures. The carbon balance for these runs is provided in Table 6.1. Lin et
al. [257] showed that biodiesel is stable up to 275 °C and thermal decomposition starts at
275 °C and above. According to these authors, thermal decomposition of biodiesel
involves isomerisation, polymerisation (Diels-Alder reaction) and pyrolysis reactions
which occur in the temperature range of 275-400 °C, 300-425 °C and >350 °C.
Table 6.2: Effect of biodiesel preheating temperatures on CSR of biodiesel using Ni/Al catalyst at 650
°C, WHSV of 3.52 h-1
and S/C of 3. Water vaporiser was set to 170 °C.
Vaporiser
T (°C) Xbiod XH2O
Reforming
eff (%)
H2O conv eff
(%) YH2 (wt %)
YH2 eff (%)
190 79.46 31.74 71.25 67.03 22.30 74.97
220 75.72 30.65 68.57 64.71 21.46 72.15
365 82.3 30.04 67.82 63.42 21.23 71.36
It is possible that at higher vaporiser temperature i.e. 365 °C, biodiesel decomposed and
the products were steam reformed producing H2, CO, CO2, CH4, C2H4 and C2H6.
Lowering the vaporiser temperature reduced the Xbiod, which means a higher amount of

Hydrogen production by steam reforming of biodiesel
160
longer chain compounds entered the reactor, which would have broken down on the
surface of catalyst, forming smaller compounds that were steam reformed to produce H2,
CO, CO2, and CH4. As the vaporiser tubes were made of stainless steel it could have
some catalytic effect on the decomposition of biodiesel at higher temperature (365 °C)
resulting in Xbiod due to thermal decomposition. Lower reforming and steam conversion
efficiency could support the interpretation. Relatively higher reforming and steam
conversion efficiencies suggest better SR activity with lower vaporiser (190 °C)
temperature than higher (365 °C). As higher amount of intact biodiesel entered the
reactor at lower vaporiser temperature, higher amount of carbon formation resulted. For
190 °C vapouriser temperature, 8% of the carbon feed ended up on the catalyst, while
14.3% was unaccounted carbon (Table 6.1). The unaccounted carbon could be present on
the quartz wool. The carbon content of the condensate was negligible as compared to that
of the gas and the carbon deposited on the catalyst. Carbon content of the condensate at
365 °C, although very small, was higher as compared to 190 °C, which suggested that at
this vaporiser temperature more liquid products are formed by pyrolysis of biodiesel.
The better performance of the catalyst in terms of H2 obtained at 190 °C and in order to
prevent the thermal decomposition of biodiesel in the vaporiser, resulted in this
temperature being chosen for the biodiesel vaporiser. TGA experiments also showed that
at 190 °C, biodiesel vaporisation just begins.
6.4.4 Effect of catalyst
SR processes depend greatly on the type of catalyst used for the processes. Some
catalysts have higher surface area, which results in higher activity compared to catalysts
with lower surface area. The presence of dopants in the catalysts can also affect the
activity positively as well negatively. The presence of elements such as Ca affects the
activity of the catalyst by reducing carbon formation and maintaining the activity of the

Hydrogen production by steam reforming of biodiesel
161
catalyst. Ceria based catalysts are also helpful in reducing carbon formation and exhibit
higher WGS activity. This section of results and discussion explores the effect of various
Ni based catalysts on CSR of commercial biodiesel.
The performance evaluation of the catalysts was performed at constant WHSV (i.e.
residence time) and S/C. The biodiesel flowrate to the reactor was kept constant at 0.978
cm3/h and the steam flowrate was maintained at 2.92 cm
3/h, which provided an S/C of 3.
These conditions corresponded to a carbon input flowrate of 1.50 10-5
mol/s while the
N2 flowrate was set to 40 cm3/min to obtain a constant WHSV of 3.18 h
-1.
Figure 6.8 represents Xbiod and XH2O conversions in CSR of commercial biodiesel at
constant S/C of 3 and WHSV of 3.18 h-1
. The reactor temperature was set to 650
oC. The
molar carbon balance for these set of experiments is provided in Table 6.3. The previous
experiments on the effect of temperature showed that 700 °C was found to be the
optimum temperature in terms of YH2 and with highest Xbiod and XH2O. The (SC-CO) at this
temperature was higher, inferring limitation of WGS activity. Similarly as some of the
catalysts tested were powders, these might undergo sintering due to high reactor
temperatures. For this reason the catalysts were compared at 650 °C. The biodiesel and
water vaporisers were set to 190 and 170 °C respectively.
6.4.4.1 Alumina supported catalysts
Figure 6.8 represents the performance of alumina supported Ni catalysts in CSR of
commercial at constant S/C of 3, with 650 °C as reactor temperature and WHSV of 3.18
h-1
. The biodiesel and water vaporisers were set to 190 and 170 °C. Table 6.3 shows the
molar carbon balance for these experiments performed over 7200s with a carbon input of
1.08×10⁻¹
mol. Biodiesel (Xbiod) and steam (XH2O) conversions with the commercial
Ni/Al and Ni/K-Al catalysts were lower as compared to Ni/Ca-Al and NiCoCe/Al
catalysts. The Ni/Ca-Al catalyst exhibited highest Xbiod of 96.0% followed by NiCoCe/Al
which showed 90.4% conversion. Steam conversions (XH2O) of 37.8 and 34.9% were

Hydrogen production by steam reforming of biodiesel
162
observed for Ni/Ca-Al and NiCoCe/Al respectively compared to the equilibrium value of
47%.
6.4.4.2 Alumina supported catalyst
Figure 6.8: Performance of various alumina supported Ni catalysts in CSR of commercial biodiesel
at 650 °C and constant S/C of 3 and WHSV of 3.18 h-1
with biodiesel and water vaporisers set to 190
and 170 °C.
Steam conversions (XH2O) for Ni/Al and Ni/K-Al were very similar, but Xbiod for Ni/Al
catalyst was higher compared to Ni/K-Al catalyst, which infers that thermal
decomposition of biodiesel was higher over alumina support of the Ni/Al catalyst (Figure
6.8). Although the carbon content in the condensates was insignificant as compared to
the carbon conversion in gas phase and on the catalyst surface, Ni/Al catalyst exhibited
higher organic carbon as compared to the Ni/K-Al catalyst (Table 6.3). According to
Marquevich et al.[173], the acidic nature of alumina support can cause cracking of
oxygenated hydrocarbons affecting the SR performance. The presence of K could have
modified the acidic sites of alumina, resulting in lower TD. Addition of K increases
steam adsorption on catalyst surface, which means steam covers the surface, restricting

Hydrogen production by steam reforming of biodiesel
163
the fragments of biodiesel broken by Ni to be adsorbed and steam reformed [228, 258].
Addition of K alters the hydrocarbon dissociative chemisorptions in SMR i.e. there is a
decrease in CHx (a) fragments formed on the Ni surface from the increase of interactions
with water vapour resulting lower activity and coke formation[259]. The carbon content
on the surface of Ni-K/Al catalyst was relatively lower compared to the Ni/Al catalyst.
Approximately 4.2 and 3.63% of the total carbon in the products was found on the
surface of the Ni/Al and Ni/K-Al catalysts. The unaccounted carbon for these runs was
higher, suggesting formation carbon in other places of the reactor or quartz wool surface
(Table 6.3).
From the two catalysts that yielded higher Xbiod, i.e. Ni/Ca-Al and NiCoCe/Al, the latter
exhibited higher carbon formation on its surface. A 4.8% of the output carbon was found
on NiCoCe/Al as compared to 3.5% on Ni/Ca-Al (Table 6.3). This could explain why the
Xbiod was lower for the NiCoCe/Al catalyst as compared to Ni/Ca-Al. Similarly XH2O
over NiCoCe/Al was lower than Ni/Ca-Al, suggesting lower SR activity (R-6.1). Among
all the catalysts, the highest amount of carbon in the condensate was found for
NiCoCe/Al, which suggests this catalyst was more active in the biodiesel decomposition
reaction. For these two catalysts (Ni/Ca-Al and NiCoCe/Al) only 0.5 and 5% of the
carbon feed was unaccounted (Table 6.3). Vagia and Lemonidou [260] reported high
catalytic activity in CSR of acetic acid over 5 wt% Ni/12CaO-7Al2O3. They reported that
Ni was distributed at the boundaries of the grains facilitating a high degree of dispersion.
Further, the smaller crystallites of Ni over the support contributed to the difference in
dispersion and caused high reforming activity. The presence of Ca in the case of calcium
aluminate based catalyst had an influence on the performance of the catalyst. Addition of
Ca to 10% Ni/Al2O3 was shown to improve the performance of the catalyst in CSR of
ethanol Choong et al [261]. Formation of less crystalline carbon was observed in Ca
modified catalysts which was more easily gasified (R-6) during the CSR reaction.
Addition of Ca decreased the acidity of the Al2O3 and increased the adsorption of steam
while providing the Ni catalyst the proximity and abundance of adsorbed OH groups
affecting the performance of the catalyst [261].

Hydrogen production by steam reforming of biodiesel
164
Higher conversion of Xbiod and XH2O in Ni/Ca-Al resulted in highest YH2 from enhanced
SR reaction (R-6.1). A YH2 of 27.0 wt% was observed for Ni/Ca-Al, which resulted in
YH2 (eff) close to 93% (Figure 6.9). Steam conversion (XH2O) and reforming efficiencies
for this catalyst were also highest due to higher biodiesel and steam conversion. A steam
conversion efficiency of 79.5% was seen with reforming efficiency of 86.3% (Figure
6.8). Lowest YH2 of 22.8 wt% was exhibited by Ni/K-Al, which resulted in YH2 (eff) of
78.9% (Figure 6.9). Reforming efficiency of 72.5% and steam conversion efficiency of
68.3% was recorded for Ni/K-Al (Figure 6.8).
Figure 6.9 represents yield (YH2) and (SH-H2) to H2 in addition selectivity to carbon gases
(SC) in CSR of commercial biodiesel at S/C of 3, WHSV of 3.18 h-1
for various alumina
supported catalysts. Selectivity to any given gas was very close to its equilibrium value.
The (SH-H2), for all the catalysts was close to 100%. The (SC-CO) and (SC-CO2) was in the
range of 38.7 to 42.4% and 55.8 to 58.5% respectively. The (SC-CO) in case of Ni/K-Al
was slightly lower than others, due to slight improvement WGS reaction (R-6.2). Ni/K-
Al also showed highest (SC-CH4) as compared to the other catalysts. Addition of K
disrupts the CH4 activation sites of the catalyst which would reduce SMR reaction
(reverse R-6.5) increasing (SC-CH4).

Hydrogen production by steam reforming of biodiesel
165
Figure 6.9: Yield of H2 (YH2) and selectivity (SH-H2) for H2 with selectivities of carbon gases in CSR of
commercial biodiesel over alumina supported catalysts, at same conditions as Figure 6.8.
6.4.4.3 Ceria-zirconia supported catalysts
Effect of ceria based Ni catalysts on (Xbiod and steam XH2O in CSR of commercial
biodiesel, at 650 °C using S/C of 3 and constant WHSV of 3.18 h-1
is shown in Figure
6.10. The molar carbon balance for these set of experiments performed over 7200s with
the carbon input of 1.08×10⁻¹
mole is shown in Table 6.3. The vaporiser temperatures
were set to 190 and 170 °C for biodiesel and water respectively. In the case of Ce-Zr
supported catalyst, the presence of Ce resulted in higher conversion and WGS activity
[262]. Addition of Ce is well known to promote metal activity and dispersion, resulting
high catalytic activity. Similarly the presence of Ce increases adsorption of steam
thereby promoting XH2O. Higher (SC-CO2) and XH2O during the CSR reaction suggested
higher WGS reaction (R-6.2) activity. It was reported that CeOx enhances the dissociation
of H2O and accelerates the reaction of steam with adsorbed species on the Ni surface near
the boundary area between metal and support, thus decreasing the carbon deposition
(Table 6.3) and promoting the stability of the catalyst during reforming [216]. Ni/Ce-Zr-

Hydrogen production by steam reforming of biodiesel
166
1.5g showed the highest biodiesel and steam conversions compared to the others (Ni-
K/Ce-Zr, Ni-Sn/Ce-Zr and Ni/Ce-Al). Biodiesel conversion (Xbiod) of 96.1% with 41.3%
XH2O were observed with this catalyst, which resulted in 86.9 and 88.9% steam
conversion and reforming efficiency respectively. For this catalyst 1.3% of the carbon fed
was detected on the catalyst surface.
Decreasing the amount of catalyst resulted in reduction in Xbiod and XH2O with Ni/Ce-Zr-
1g catalyst. Biodiesel (Xbiod) and steam (XH2O) conversion reduced to 90.2% and 33.3%
with the use of Ni/Ce-Zr-1g. It is obvious that increasing the amount of sand in the bed,
with reduction in catalyst mass, resulted in lower activity. Comparing the carbon
formation on catalyst surface, use of 1 g catalyst showed slightly higher carbon formation
(Table 6.3). The unaccounted carbon for Ni/Ce-Zr-1g and Ni/Ce-Zr-1.5 g were 7 and 2.5
% of the carbon fed respectively (Table 6.3) which suggests that the CSR process was
very efficient. The unaccounted carbon could be present in the sand and over the quartz
wool.
In case of Ni-K/Ce-Zr Ni-Sn/Ce-Zr catalysts, biodiesel and steam conversions (XH2O)
decreased, suggesting lower activity towards SR reaction (R-6.1). The reason for reduced
activity for these catalysts differs from one another.The Ni-K/Ce-Zr catalyst showed
reduced activity due to the presence of higher carbon on catalyst surface (Table 6.3). It
was hoped that addition of K would reduce carbon formation, but this ability of the
catalyst is dependent on the position and amount of K on the catalyst surface. According
to Borowiecki et al. [263] location of K on the catalyst plays an important role in
resistance of K containing catalyst to carbon formation. A part of K is in an intimate
contact with Ni, whereas the other part is distributed over the support. In catalyst where
K–Ni interaction dominates, K promoted catalyst exhibits lower resistance to carbon
formation. A Xbiod of 90.0% and XH2O of 38.1% were exhibited by the Ni-K/Ce-Zr
catalyst. A 6% of the carbon measured in the output was observed over the catalyst
surface (Table 6.3), with 4% of the carbon fed was unaccounted.
Hydrogen production by steam reforming of biodiesel
167
Reduction in the catalytic activity of Ni-Sn/Ce-Zr compared to Ni/Ce-Zr, could be as a
result of surface coverage of active Ni sites by Sn [227]. Similar behaviour was reported
by Nikolla et al. [264] in SMR using S/C of 0.5 at 800 oC using Ni/YSZ catalyst.
Addition of Sn was reported to increase the stability of the catalyst but was shown to
reduce activity; a 25% decrease in the activity was reported with 5 wt% Sn doped
Ni/YSZ catalyst. Formation of relatively higher amount of carbon (Table 6.3) on the
surface of Ni-Sn/Ce-Zr compared to Ni/Ce-Zr could be one of the reasons for lower
activity of the catalyst, resulting from formation of alkenes [256]. A 3% of the measured
carbon in the output was detected on the catalyst surface of the Ni-Sn/Ce-Zr catalyst,
with 7% unaccounted carbon. Biodiesel (Xbiod) and steam (XH2O) conversions of 90.0%
and 39.4% were recorded with Ni-Sn/Ce-Zr catalyst.
Lowest conversions Xbiod and XH2O were observed with the Ni/Ce-Al catalyst. Biodiesel
conversion (Xbiod) of 75.9% with XH2O of 30.4% was seen with this catalyst. The reason
for low catalytic activity was the high amount of carbon formation on the catalyst
surface. From the total output carbon, 18% was observed over the catalyst surface thus
significantly affecting the performance of the catalyst. The unaccounted carbon was 8%
of the carbon feed, which suggest most of the carbon was formed over the catalyst
surface. As a result of poor biodiesel and steam conversions (XH2O), 75.5 and 64.1%
reforming and steam conversion efficiencies were obtained for the catalyst.
The selectivity (SH-H2) and YH2 with the selectivities of carbon gases (SC) for Ce-Zr
catalysts are shown in Figure 6.11. The highest YH2 of 27.8 wt% was obtained with
Ni/Ce-Zr-1.5 g catalyst, which resulted in an YH2 (eff) of 93.5% (Figure 6.11). It
decreased to 23.7 wt% with 79.0% YH2 (eff) for Ni/Ce-Zr-1 g catalyst. H2 yields of 26.2
and 25.7 wt% were found for the Ni-K/Ce-Zr and Ni-Sn/Ce-Zr catalysts. Among all the
catalysts, the lowest yield was found for the Ni/Ce-Al catalyst (20.9 wt%), hence low YH2
(eff)of 70.9%. The (SH-H2) was above 97% for all the catalysts. The (SC-CO) in Ni/Ce-Zr-1
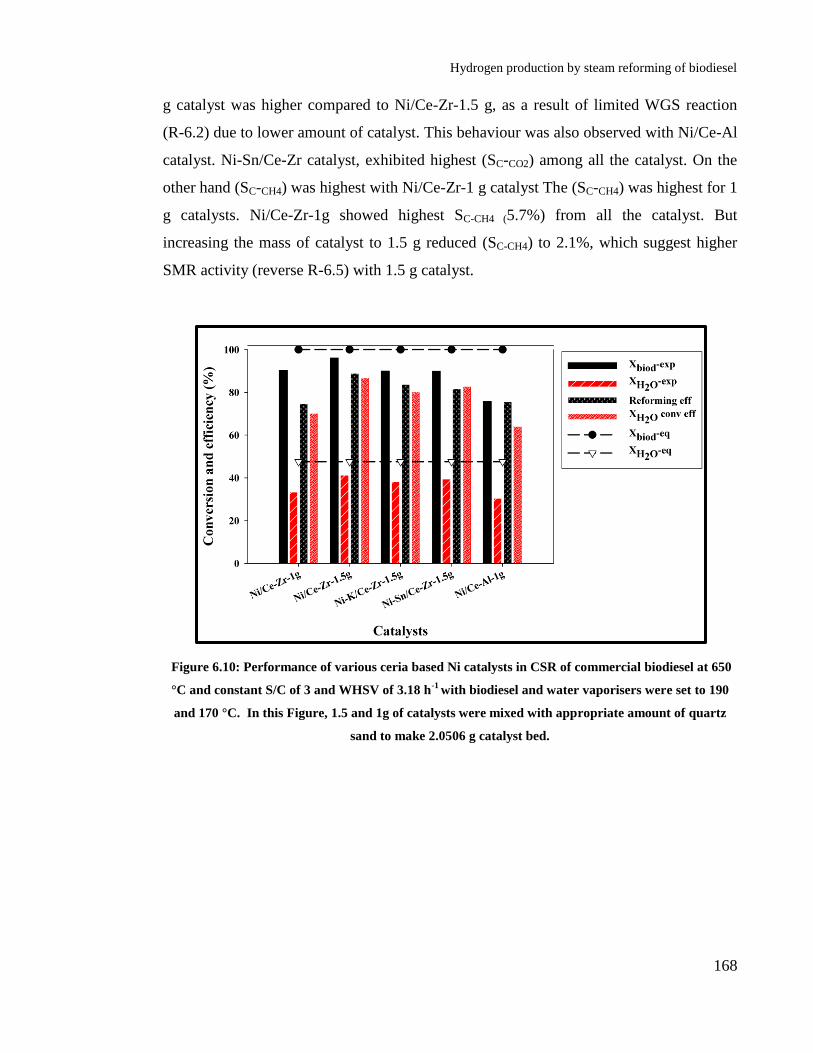
Hydrogen production by steam reforming of biodiesel
168
g catalyst was higher compared to Ni/Ce-Zr-1.5 g, as a result of limited WGS reaction
(R-6.2) due to lower amount of catalyst. This behaviour was also observed with Ni/Ce-Al
catalyst. Ni-Sn/Ce-Zr catalyst, exhibited highest (SC-CO2) among all the catalyst. On the
other hand (SC-CH4) was highest with Ni/Ce-Zr-1 g catalyst The (SC-CH4) was highest for 1
g catalysts. Ni/Ce-Zr-1g showed highest SC-CH4 (5.7%) from all the catalyst. But
increasing the mass of catalyst to 1.5 g reduced (SC-CH4) to 2.1%, which suggest higher
SMR activity (reverse R-6.5) with 1.5 g catalyst.
Figure 6.10: Performance of various ceria based Ni catalysts in CSR of commercial biodiesel at 650
°C and constant S/C of 3 and WHSV of 3.18 h-1
with biodiesel and water vaporisers were set to 190
and 170 °C. In this Figure, 1.5 and 1g of catalysts were mixed with appropriate amount of quartz
sand to make 2.0506 g catalyst bed.

Hydrogen production by steam reforming of biodiesel
169
Figure 6.11: Yield (YH2) and selectivity (SH-H2) to H 2 with selectivity to carbon gases in CSR of
commercial biodiesel over Ce-Zr supported catalysts, at same conditions as Figure 6.10.
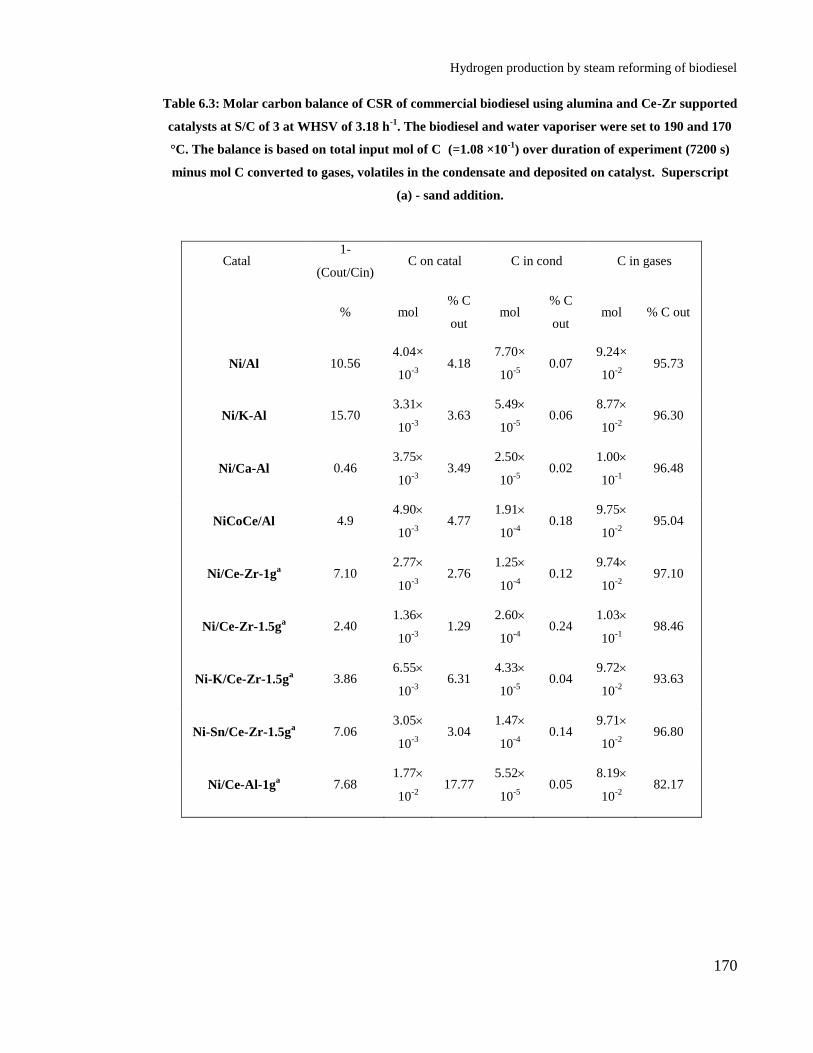
Hydrogen production by steam reforming of biodiesel
170
Table 6.3: Molar carbon balance of CSR of commercial biodiesel using alumina and Ce-Zr supported
catalysts at S/C of 3 at WHSV of 3.18 h-1
. The biodiesel and water vaporiser were set to 190 and 170
°C. The balance is based on total input mol of C (=1.08 ×10⁻¹
) over duration of experiment (7200 s)
minus mol C converted to gases, volatiles in the condensate and deposited on catalyst. Superscript
(a) - sand addition.
Catal 1-
(Cout/Cin) C on catal C in cond C in gases
% mol % C
out mol
% C
out mol % C out
Ni/Al 10.56 4.04×
10-3
4.18
7.70×
10-5
0.07
9.24×
10-2
95.73
Ni/K-Al 15.70 3.31
10-3
3.63
5.49
10-5
0.06
8.77
10-2
96.30
Ni/Ca-Al 0.46 3.75
10-3
3.49
2.50
10-5
0.02
1.00
10-1
96.48
NiCoCe/Al 4.9 4.90
10-3
4.77
1.91
10-4
0.18
9.75
10-2
95.04
Ni/Ce-Zr-1ga 7.10
2.77
10-3
2.76
1.25
10-4
0.12
9.74
10-2
97.10
Ni/Ce-Zr-1.5ga 2.40
1.36
10-3
1.29
2.60
10-4
0.24
1.03
10-1
98.46
Ni-K/Ce-Zr-1.5ga 3.86
6.55
10-3
6.31 4.33
10-5
0.04
9.72
10-2
93.63
Ni-Sn/Ce-Zr-1.5ga 7.06
3.05
10-3
3.04 1.47
10-4
0.14
9.71
10-2
96.80
Ni/Ce-Al-1ga 7.68
1.77
10-2
17.77 5.52
10-5
0.05
8.19
10-2
82.17

Hydrogen production by steam reforming of biodiesel
171
6.4.5 Effect of WHSV
The effect of WHSV on the CSR of commercial biodiesel was performed using Ni/Ca-Al
catalyst at 650 °C and constant S/C of 3. Biodiesel and water flowrates were kept
constant at 0.978 cm3/h (1.50 10
-5 mol /s carbon molar feed flowrate) and 2.92 cm
3/h.
The WHSV values were adjusted to 2.85, 3.18 and 3.52 h-1
by altering N2 flowrate from
30 to 50 cm3/min. Biodiesel and water vaporisers were set at 190 and 170 °C. Figure 6.12
illustrates the effect of WHSV on CSR of commercial biodiesel at constant S/C and
reactor temperature of 650 °C. The molar carbon balances of these experiments are
provided in Table 6.4 over 7200s with a carbon input of 1.08×10⁻¹
mol.
Figure 6.12: Effect of WHSV on the performance of Ni/Ca-Al catalyst in CSR of commercial
biodiesel at 650 °C and S/C of 3. In this investigation biodiesel and water vaporisers were set to 190
and 170 °C respectively.

Hydrogen production by steam reforming of biodiesel
172
Increase in WHSV increased the amount of carbon in the condensate as observed by TOC
analysis (Table 6.4) which could suggest increased pyrolysis of biodiesel. Similarly
increasing the WHSV increased the amount of carbon deposited on the catalyst surface.
At WHSV of 3.52 h-1
, 6% of the carbon output was found on the catalyst surface. This
decreased to 2.8% with reduction in WHSV to 2.85 h-1
. This suggests that lower WHSV
increases carbon steam gasification leading to net lower carbon deposition. Maximum
conversions of both biodiesel and steam and therefore YH2 (27 wt%, Figure 6.12) were
observed at 3.18 h-1
, with very good mass balance closure (Table 6.4). Reforming and
steam conversion efficiencies of 86.9 and 80.35% were observed for this WHSV value.
Figure 6.13 represents selectivity (SH-H2) and yield for H2 (YH2) with the selectivities to
CO, CO2 and CH4 (SC). At all the WHSV values, H2 selectivities (SH-H2) values were
above 98%, with 99.4 % at WHSV of 3.18 h-1
. The (SC-CO) was shown to increase with
WHSV value, in contrast to (SC-CO2) which remained similar at all the WHSV values.
The (SC-CH4) was negligible as compared to the other gases, with WHSV of 3.18 h-1
showing the least.
Figure 6.13: Effect of WHSV on yield (YH2) and selectivity (SH-H2) to H2 with selectivities of carbon
gases in CSR of commercial biodiesel over Ni/Ca-Al catalyst, at 650 °C and constant S/C of 3.

Hydrogen production by steam reforming of biodiesel
173
6.4.6 Effect of biodiesel
Effect of biodiesel types (commercial, palm and in-house biodiesel ) on the performance
of the CSR was examined using Ni/Ca-Al catalyst at constant S/C of 3 and 650 °C with
WHSV of 3.18 h-1
is shown in Figure 6.14 with molar carbon balance for the experiments
are provided in Table 6.4. The biodiesel flows was adjusted to maintain a carbon molar
feed flowrate of 1.50 10-5
mol /s. The steam flowrate was also adjusted to provide S/C
ratio of 3. The WHSV for these experiments was 3.18 h-1
.
Figure 6.14: Effect of biodiesel origin on CSR process using Ni/Ca-Al catalyst at 650 °C and constant
S/C of 3 with constant WHSV of 3.18 h-1
. The biodiesel and water vaporisers were set to 190 and 170
°C. In this Figure 1.5 and 2 wt% represents the amount of KOH catalyst used for biodiesel
preparation.
Highest Xbiod and XH2O were observed with commercial biodiesel compared to other
biodiesels examined. Biodiesel conversion (Xbiod) with commercial biodiesel was 96% as
compared to 86.5, 88.5 and 80.7% with palm, in-house 1.5 wt% and 2 wt%. Lower
conversion in CSR of palm oil biodiesel was reported by Shiratori et al [140] using S/C
Hydrogen production by steam reforming of biodiesel
174
of 3.5 at 800 oC with GHSV of 3900 h
-1 over a Ni/YSZ+Al2O3 based paper catalyst.
Highest XH2O was recorded with commercial biodiesel. The decreasing order of XH2O was
commercial biodiesel > palm > in-house -1.5 wt% and finally in-house -2 wt%.
Commercial biodiesel also exhibited the lowest carbon formation on the catalyst surface
as compared to other biodiesel. Commercial biodiesel showed 3.5% of the output carbon
on the catalyst surface. For palm, in-house 1.5 wt% and 2 wt% biodiesels, carbon
formation was 4.5, 5.5 and 6.5% of the carbon output. As a result of higher Xbiod and
relatively lower amount of carbon deposited on the catalyst surface, commercial biodiesel
showed the best result in terms of carbon balance (Table 6.4). Only 0.5% of the carbon
fed was unaccounted as compared to 13% with in-house- 2wt% biodiesel (Table 6.4).
The reforming and steam conversion efficiency for commercial biodiesel reached the
maxima of 86.9 and 80.3% (Figure 6.13) due to the above reasons.
The (SH-H2) and (YH2) in addition to carbon containing gases (SC) are shown in Figure
6.15. Highest Xbiod and XH2O conversions resulted in highest in YH2 with commercial
biodiesel (Figure 6.14). According to Shotipruk et al [265] higher H2 production can be
produced from palmitic acid and oleic acid using S/C of 3 at 900 oC, since commercial
biodiesel has higher amount of these esters one could assume that this could be one of the
factors affecting YH2 in the CSR of the biodiesels examined. The yield of H2 decreased
from commercial biodiesel to in-house-2wt% biodiesel. This resulted in in-house-2wt%
biodiesel showing the poorest YH2 (eff) value of 74.0% (Figure 6.15) which suggested
deviation from equilibrium conditions with this biodiesel. The (SH-H2) was above 98%
for all the biodiesels. Palm biodiesel exhibited the highest (SC-CO) among all the
biodiesels. In contrast, in-house-2wt% biodiesel recorded the highest (SC-CO2). In-house-
1.5 wt% biodiesel was responsible for highest (SC-CH4) among the rest.
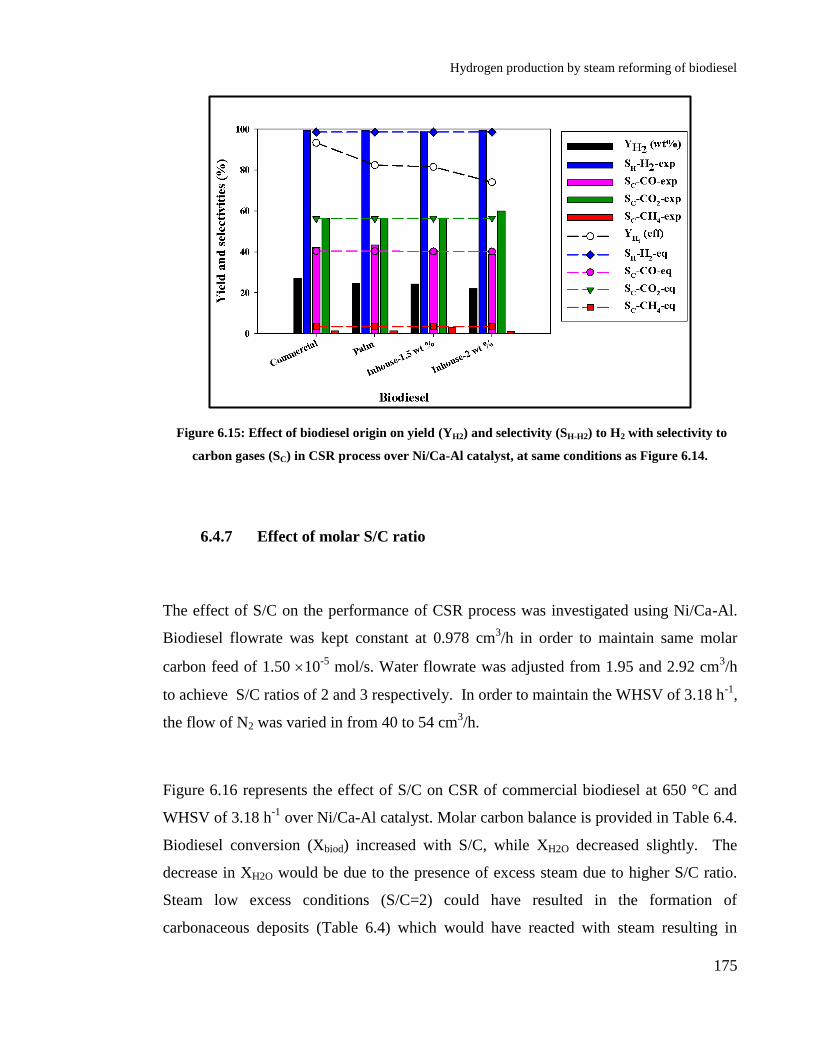
Hydrogen production by steam reforming of biodiesel
175
Figure 6.15: Effect of biodiesel origin on yield (YH2) and selectivity (SH-H2) to H2 with selectivity to
carbon gases (SC) in CSR process over Ni/Ca-Al catalyst, at same conditions as Figure 6.14.
6.4.7 Effect of molar S/C ratio
The effect of S/C on the performance of CSR process was investigated using Ni/Ca-Al.
Biodiesel flowrate was kept constant at 0.978 cm3/h in order to maintain same molar
carbon feed of 1.50 10-5
mol/s. Water flowrate was adjusted from 1.95 and 2.92 cm3/h
to achieve S/C ratios of 2 and 3 respectively. In order to maintain the WHSV of 3.18 h-1
,
the flow of N2 was varied in from 40 to 54 cm3/h.
Figure 6.16 represents the effect of S/C on CSR of commercial biodiesel at 650 °C and
WHSV of 3.18 h-1
over Ni/Ca-Al catalyst. Molar carbon balance is provided in Table 6.4.
Biodiesel conversion (Xbiod) increased with S/C, while XH2O decreased slightly. The
decrease in XH2O would be due to the presence of excess steam due to higher S/C ratio.
Steam low excess conditions (S/C=2) could have resulted in the formation of
carbonaceous deposits (Table 6.4) which would have reacted with steam resulting in

Hydrogen production by steam reforming of biodiesel
176
higher steam conversion XH2O) [174]. A 7% of the carbon in the products was found on
the catalyst surface with 7% unaccounted carbon at S/C of 2. Increasing the S/C reduced
the carbon deposition by half, 3.5% of the output carbon was detected on the catalyst
surface. The improved performance with higher S/C is as a result of lower carbon
deposition resulting in improved SR reaction (R-6.1). Higher reforming and steam
conversion efficiencies support this claim. In contrast to our results, higher temperature
was required to obtain similar conversions in CSR of waste cooking oil [174]. At similar
S/C of 2.5 and WHSV of 1.967 h-1
, waste cooking oil and XH2O reached 86.3 and 35.7%
at 700 °C over Ni/Al catalyst. Higher S/C of 4 was required to achieve 99.9% for waste
cooking oil as compared to 96.0% at S/C of 3 for biodiesel. This could suggest that
biodiesel would be easy to steam reform even at higher WHSV values.
Figure 6.16: Effect of molar S/C on CSR process using Ni/Ca-Al catalyst at 650 °C and constant
WHSV of 3.18 h-1
. The biodiesel and water vaporisers were set to 190 and 170 °C.
The yield of H2 was lower at S/C of 2 compared to yield obtained at S/C of 3. A 21.9
wt% of YH2 with (YH2 (eff)) of 80.3% was observed at S/C of 2. Figure 6.17 represents
yield (YH2) and (SH-H2) to H2 in addition to selectivities to carbon containing gases i.e.

Hydrogen production by steam reforming of biodiesel
177
CO, CO2 and CH4 (SC). At higher S/C, higher WGS activity (R-6.2) was observed thus
increasing YH2. Lower CO and higher (SC-CO2) were observed at S/C of 3, supports the
interpretation. Similarly lower (SC-CH4) under steam rich condition suggests higher SMR
activity (reverse R-6.5). The (SH-H2) in case of S/C of 2 was slightly lower than that
observed at S/C of 3.
Figure 6.17: Effect of S/C on yield (YH2) and selectivity (SH-H2) to H2 with selectivity to carbon gases
(SC) in CSR process over Ni/Ca-Al catalyst, at same conditions as Figure 6.16.

Hydrogen production by steam reforming of biodiesel
178
Table 6.4: Molar carbon balance of CSR experiments using Ni/Ca-Al catalyst. The biodiesel and
water vaporiser were set to 190 and 170 °C. The balance is based on total input mol of C (=1.08 ×10⁻¹
)
over duration of experiment (7200 s) minus mol C converted to gases, volatiles in the condensate and
deposited on catalyst.
Biodiesel 1-
(Cout/Cin) C on catal C in cond C in gases
% mol % C
out mol
% C
out mol % C out
Commerciala 07.12
6.04×
10-3
06.02
2.10×
10-4
00.21
9.40×
10-2
93.76
Commercialb 00.46
3.75
10-3
03.49
2.50
10-5
00.02
1.03
10-1
96.48
Commercialc 11.64
2.70
10-3
02.83
1.50
10-5
00.01
9.26
10-2
97.14
Commerciald 07.24
7.13
10-3
07.12
0.00
10-5
00.00
9.30
10-2
92.87
Palmb 09.21
4.55
10-3
04.64
3.74
10-5
00.03
9.34
10-2
95.31
In-house1.5 wt %b 06.42
5.46
10-3
05.40
4.65
10-5
00.04
9.54
10-2
94.54
In-house 2 wt %b 13.56
6.19
10-3
06.63 2.84
10-5
00.03
8.71
10-2
93.33
a- The performance was evaluated at S/C of 3 and WHSV of 3.52h-1
.
b- The performance was evaluated at S/C of 3 and WHSV of 3.18h-1
.
c- The performance was evaluated at S/C of 3 and WHSV of 2.85h-1
.
d- The performance was evaluated at S/C of 2 and WHSV of 3.18h-1
.
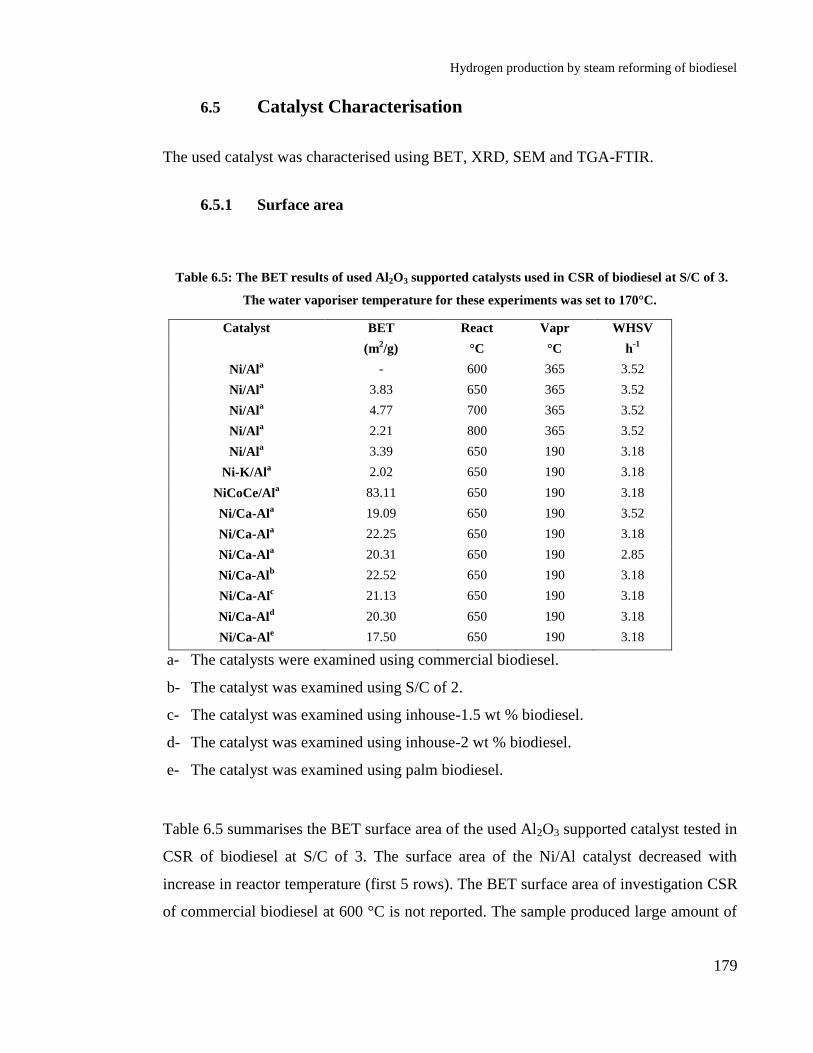
Hydrogen production by steam reforming of biodiesel
179
6.5 Catalyst Characterisation
The used catalyst was characterised using BET, XRD, SEM and TGA-FTIR.
6.5.1 Surface area
Table 6.5: The BET results of used Al2O3 supported catalysts used in CSR of biodiesel at S/C of 3.
The water vaporiser temperature for these experiments was set to 170°C.
Catalyst BET React Vapr WHSV
(m2/g) °C °C h
-1
Ni/Ala - 600 365 3.52
Ni/Ala 3.83 650 365 3.52
Ni/Ala 4.77 700 365 3.52
Ni/Ala 2.21 800 365 3.52
Ni/Ala 3.39 650 190 3.18
Ni-K/Ala 2.02 650 190 3.18
NiCoCe/Ala 83.11 650 190 3.18
Ni/Ca-Ala 19.09 650 190 3.52
Ni/Ca-Ala 22.25 650 190 3.18
Ni/Ca-Ala 20.31 650 190 2.85
Ni/Ca-Alb 22.52 650 190 3.18
Ni/Ca-Alc 21.13 650 190 3.18
Ni/Ca-Ald 20.30 650 190 3.18
Ni/Ca-Ale 17.50 650 190 3.18
a- The catalysts were examined using commercial biodiesel.
b- The catalyst was examined using S/C of 2.
c- The catalyst was examined using inhouse-1.5 wt % biodiesel.
d- The catalyst was examined using inhouse-2 wt % biodiesel.
e- The catalyst was examined using palm biodiesel.
Table 6.5 summarises the BET surface area of the used Al2O3 supported catalyst tested in
CSR of biodiesel at S/C of 3. The surface area of the Ni/Al catalyst decreased with
increase in reactor temperature (first 5 rows). The BET surface area of investigation CSR
of commercial biodiesel at 600 °C is not reported. The sample produced large amount of

Hydrogen production by steam reforming of biodiesel
180
liquid on the analysis tube in spite of degassing for 24 h which was very difficult to be
removed, hindering the analysis. The surface area of the catalyst at 650 °C, decreased by
~33% compared to the fresh NiO/Al catalyst. The most significant decrease in surface
area was observed at 800 °C. The surface area decreased by 61.3% as compared to the
fresh NiO/Al catalyst. The decrease in catalyst surface area at 700 °C was smaller than
650°C: ~17.5% compared to fresh Ni/Al, which was half the surface area loss observed
at 650 °C. The decrease in surface area is as a result of sintering of the catalyst. In
comparison to the Ni/Al, Ni-K/Al showed hardly any decrease in the surface area of the
catalyst. The surface decreased only by ~2.64% in comparison to the NiO-K2O/Al
catalyst. In case of Ni/Ca-Al catalysts using commercial biodiesel, the smallest decrease
in surface area was observed at WHSV of 3.18 h-1
, which accounted for a decrease of ~33
% compared to the fresh NiO/Ca-Al. In spite of lowering the S/C to 2, the decrease in
surface area was very similar. In all the different biodiesels examined, palm biodiesel
showed the highest decrease in surface area with the Ni/Ca-Al catalyst. A ~48%
reduction in BET surface area was recorded with the Ni/Ca-Al catalyst in CSR of palm
oil biodiesel. The surface area of used Ce-Zr catalyst in CSR of commercial biodiesel at
650 °C is shown in Table 6.6. Figure 6.18 and 6.19 shows the N2 adsorption-desorption
isotherms along with BJH pore size and pore volume distribution for the used Ni catalysts
supported on pre calcined Ce-Zr support. The used catalyst also exhibited the same type
IV isotherm with type H1 hysteresis with different size pores. In the three catalysts
supported on the pre calcined Ce-Zr support, Ni-K/Ce-Zr catalysts showed the highest
decrease in BET surface area. A ~45.5% decrease in BET surface area as compared to
the fresh NiO-K2O/Ce-Zr was observed. On the other hand, the smallest surface area loss
was shown by the Ni-Sn/Ce-Zr catalyst, which accounted for ~17.3% in comparison to
the fresh NiO-SnO/Ce-Zr catalyst. Similarly the pore radius of the Ce-Zr catalyst
increased after the treatment in the reactor. The pore radius almost doubled in case of
used Ni-K/Ce-Zr as compared to the fresh catalyst. In comparison to the fresh catalysts,
the pore radii of the Ni/Ce-Zr and Ni-Sn/Ce-Zr catalysts, increased by 1.3 and 1.7%.

Hydrogen production by steam reforming of biodiesel
181
Table 6.6: Surface area results of Ce-Zr supported catalysts used in CSR of commercial biodiesel at
S/C of 3 at 650 °C. The biodiesel and water vaporiser temperature for these experiments was set to
190 and 170 °C.
Catalyst BET BJH surface
area Pore size
Pore
volume
(m2/g) (m
2/g) (nm) cm
3/g
Catalyst prepared using pre calcined Ce-Zr
Ni/Ce-Zr 48.33 60.49 6.04 0.19
Ni-Sn/Ce-Zr 50.53 59.66 6.06 0.21
Ni-K/Ce-Zr 22.08 31.69 11.41 0.11
Ni/Ce-Zr-3/1 35.61 43.41 0.62 0.11
Ni/Ce-Al 25.55 33.31 1.20 0.10
Figure 6.18: N2 adsorption-desorption isotherms of used Ni catalysts supported on the pre calcined
Ce-Zr support. The performance of the catalyst was examined at 650 °C and S/C of 3 with WHSV of
3.18 h-1
. The vaporiser temperatures for biodiesel and water were set to 190 and 170 °C.

Hydrogen production by steam reforming of biodiesel
182
Figure 6.19: Pore-size distribution of used Ni/Ce-Zr catalysts prepared with wet impregnation of pre
calcined Ce-Zr support. The performance of the catalyst was examined at 650 °C and S/C of 3 with
WHSV of 3.18 h-1
. The vaporiser temperatures for biodiesel and water were set to 190 and 170 °C
respectively.
In the case of the Ni/Ce-Zr-3/1 and Ni/Ce-Al catalysts, BET surface areas decreased by
~10.2 and 16.8% with the pore radii increasing to 0.62 and 1.20 respectively. The surface
area reduction in case of NiCoCe/Al catalyst was 22%.
6.5.2 X-ray diffraction analysis
Figures 6.20 and 6.21 shows the XRD spectra for the used Al2O3 and Ce-Zr supported
catalysts, respectively. Peaks attributed to Ni were observed at 2θ values of 44, 51, 76
and 91°, with highest intensity displayed at 44o. No peaks pertaining to NiO were
observed in any of the catalysts, indicating effective reduction during the H2 flow pre-
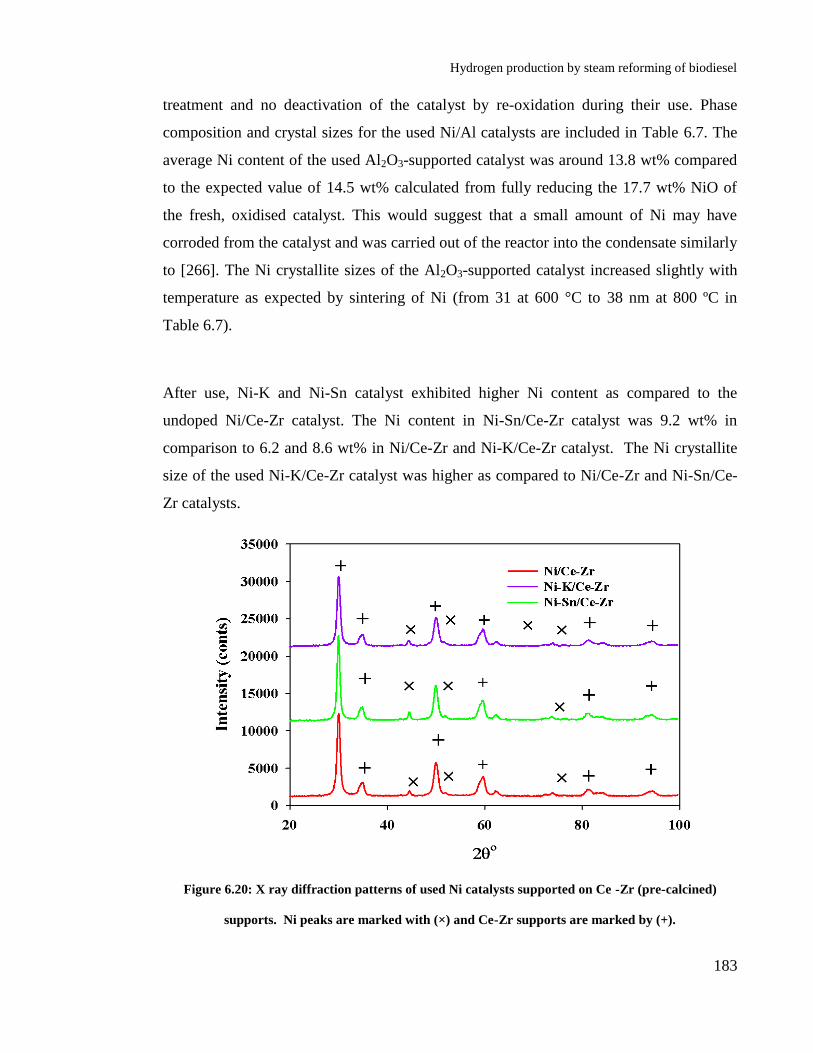
Hydrogen production by steam reforming of biodiesel
183
treatment and no deactivation of the catalyst by re-oxidation during their use. Phase
composition and crystal sizes for the used Ni/Al catalysts are included in Table 6.7. The
average Ni content of the used Al2O3-supported catalyst was around 13.8 wt% compared
to the expected value of 14.5 wt% calculated from fully reducing the 17.7 wt% NiO of
the fresh, oxidised catalyst. This would suggest that a small amount of Ni may have
corroded from the catalyst and was carried out of the reactor into the condensate similarly
to [266]. The Ni crystallite sizes of the Al2O3-supported catalyst increased slightly with
temperature as expected by sintering of Ni (from 31 at 600 °C to 38 nm at 800 ºC in
Table 6.7).
After use, Ni-K and Ni-Sn catalyst exhibited higher Ni content as compared to the
undoped Ni/Ce-Zr catalyst. The Ni content in Ni-Sn/Ce-Zr catalyst was 9.2 wt% in
comparison to 6.2 and 8.6 wt% in Ni/Ce-Zr and Ni-K/Ce-Zr catalyst. The Ni crystallite
size of the used Ni-K/Ce-Zr catalyst was higher as compared to Ni/Ce-Zr and Ni-Sn/Ce-
Zr catalysts.
Figure 6.20: X ray diffraction patterns of used Ni catalysts supported on Ce -Zr (pre-calcined)
supports. Ni peaks are marked with (×) and Ce-Zr supports are marked by (+).

Hydrogen production by steam reforming of biodiesel
184
Figure 6.21: X ray diffraction patterns of used Ni/Al and Ni-K/Al catalysts. Ni peaks are marked
with (×) and Al2O3 supports are marked by (*).
Table 6.7: Rietveld refinement results of the used Al2O3 and Ce-Zr (pre calcined) supported
catalysts.
Catalyst React Vap WHSV Ni Support
Ni
Cryst. size
°C °C h-1
wt. % wt. % nm
Ni/Al 600 365 3.52 13.8 86.2 30.91
Ni/Al 650 365 3.52 13.8 86.2 34.91
Ni/Al 700 365 3.52 13.9 86.1 31.87
Ni/Al 800 365 3.52 13.7 86.3 38.13
Ni/Al 650 190 3.18 13.7 86.3 31.06
Ni-K/Al 650 190 3.18 15.7 84.3 37.79
Ni/Ce-Zr 650 190 3.18 6.62 93.38 12.72
Ni-K/Ce-Zr 650 190 3.18 8.64 91.35 16.94
Ni-Sn/Ce-
Zr 650 190 3.18 9.26 90.73 11.79

Hydrogen production by steam reforming of biodiesel
185
6.5.3 TGA-FTIR and SEM analysis
The TPO of the Ni/Al catalyst examined in the CSR of commercial biodiesel at constant
S/C of 3 and WHSV of 3.52h-1
in the temperature range of 600-800 °C, is shown in the
Figure 6.22. The vaporiser temperature of biodiesel and water for these experiments
were set to 365 and 170°C. As seen in the Figure 6.22, there are two CO2 emission peaks
obtained from the TGA-FTIR analysis. The TGA-FTIR analysis was performed from 25
to 900°C at a temperature rate of 10°/C/min in 50 cm3/min air flow. Normally the
combustion temperature of the carbon deposits depends on the nature and deposition
sites. It is assumed that the CO2 peak observed at lower temperature i.e. around 330-350
°C is associated with the carbon deposited over the active metals while the higher
temperature CO2 peak is associated with carbon deposited on the catalyst support [266,
267]. It was reported that the low temperature CO2 peak is associated with oxidation of
surface metal carbides [268]. The high temperature peak is as a result of oxidation of
graphite carbon in the form of filaments and nanotubes [269].
At 600 °C, the intensity of CO2 was highest which decreased with temperature to 650 °C
and up on further increase it increased to 700-800°C. This was explained as a result of
Boudouard reaction (R-6.7), affecting accordingly the (SC-CO) and to CO2 (SC-CO2)
(Figure 6.6). In this temperature range 650-800 °C, the intensity of CO2 was highest for
the second peak which suggests that most of the carbon formed was present on the
catalyst support.
The TPO of the pre calcined Ce-Zr supported Ni catalysts examined in the CSR of
commercial biodiesel at constant S/C of 3 and 650°C with WHSV of 3.18 h-1
is shown in
the Figure 6.23. The vaporiser temperature of biodiesel and water were set to 190 and
170°C respectively. It can be seen from the Figure 6.23, that two forms of carbon were
observed with Ni/Ce-Zr and Ni-K/Ce-Zr catalysts, in comparison to only one form
observed over Ni-Sn/Ce-Zr catalyst and Ni/Ca-Al (Figure 6.24).

Hydrogen production by steam reforming of biodiesel
186
Figure 6.22: The TPO of Ni/Al catalyst examined in CSR of commercial biodiesel using constant S/C
of 3 and WHSV of 3.52 h-1
in the temperature range of 600-800°C. The vaporiser temperature of
biodiesel and water were set to 365 and 170°C respectively.
The intensity of CO2 peak observed at lower temperature with Ni/Ce-Zr was higher as
compared to Ni-K/Ce-Zr, which suggests that higher carbon formation over the metallic
Ni as compared to the support. According to Li et al. presence of smaller Ni crystallite
sizes in a catalyst help to reduce graphite carbon formation on the catalyst surface [270].
The low temperature CO2 peak shifts towards lower temperature i.e. 255°C with Ni-
K/Ce-Zr which could suggest that the addition of K to the catalyst is useful in oxidation
of C. The addition of K lowers the activation energy of the oxidation process and shifts
the spontaneous oxidation temperatures to lower values [271]. In comparison to Ni/Ce-
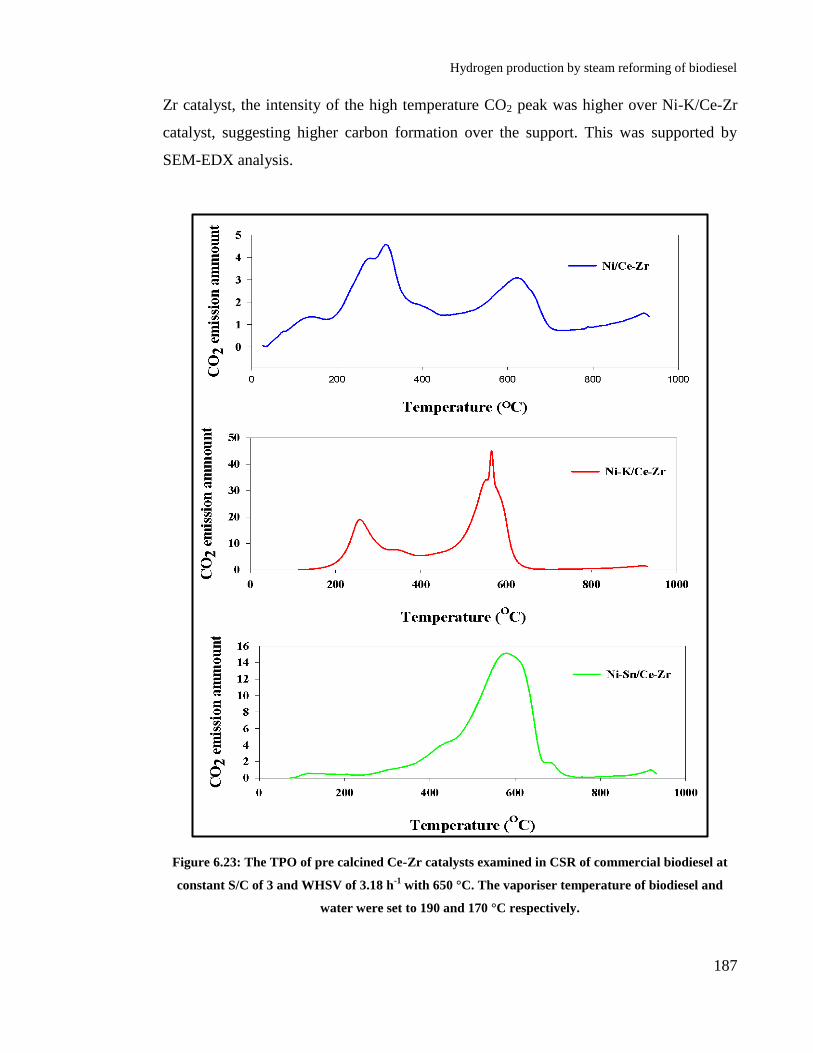
Hydrogen production by steam reforming of biodiesel
187
Zr catalyst, the intensity of the high temperature CO2 peak was higher over Ni-K/Ce-Zr
catalyst, suggesting higher carbon formation over the support. This was supported by
SEM-EDX analysis.
Figure 6.23: The TPO of pre calcined Ce-Zr catalysts examined in CSR of commercial biodiesel at
constant S/C of 3 and WHSV of 3.18 h-1
with 650 °C. The vaporiser temperature of biodiesel and
water were set to 190 and 170 °C respectively.
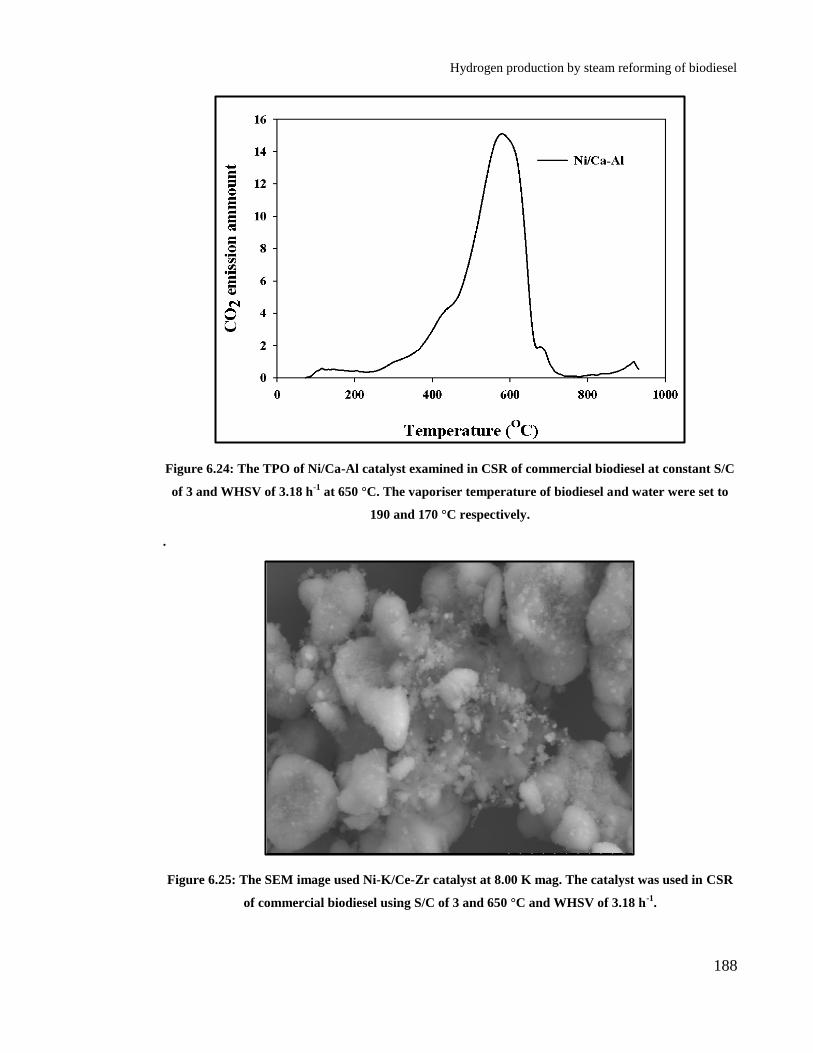
Hydrogen production by steam reforming of biodiesel
188
Figure 6.24: The TPO of Ni/Ca-Al catalyst examined in CSR of commercial biodiesel at constant S/C
of 3 and WHSV of 3.18 h-1
at 650 °C. The vaporiser temperature of biodiesel and water were set to
190 and 170 °C respectively.
.
Figure 6.25: The SEM image used Ni-K/Ce-Zr catalyst at 8.00 K mag. The catalyst was used in CSR
of commercial biodiesel using S/C of 3 and 650 °C and WHSV of 3.18 h-1
.
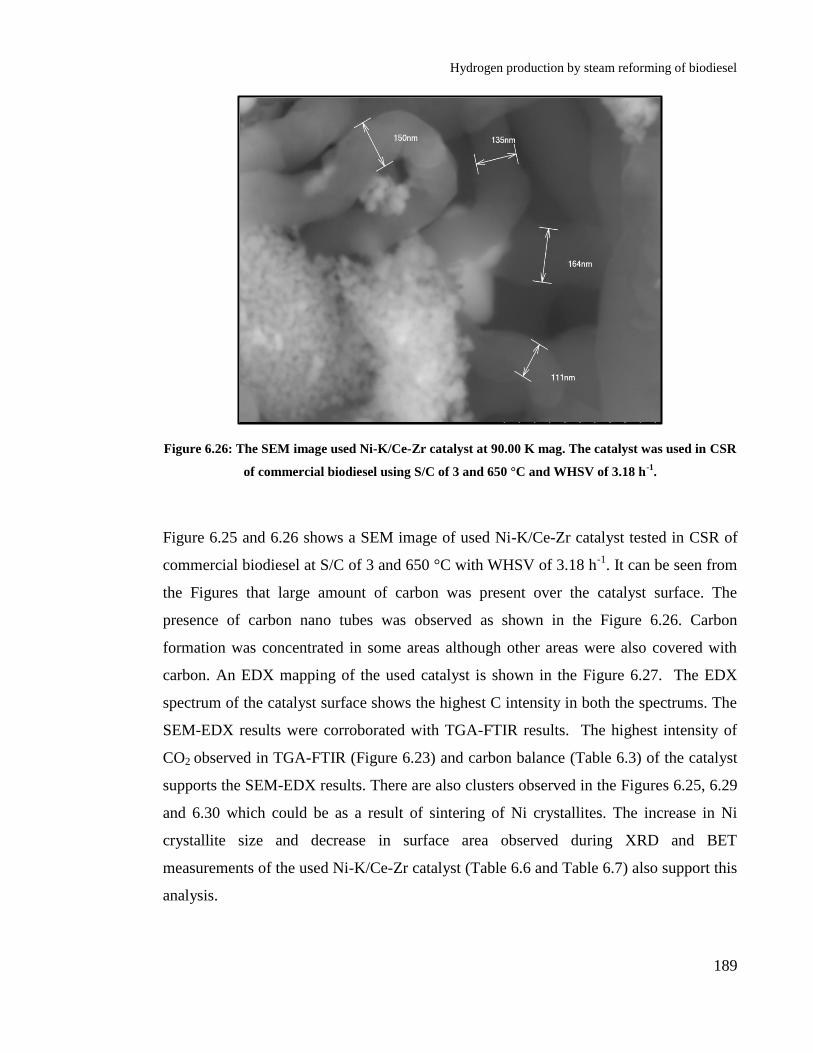
Hydrogen production by steam reforming of biodiesel
189
Figure 6.26: The SEM image used Ni-K/Ce-Zr catalyst at 90.00 K mag. The catalyst was used in CSR
of commercial biodiesel using S/C of 3 and 650 °C and WHSV of 3.18 h-1
.
Figure 6.25 and 6.26 shows a SEM image of used Ni-K/Ce-Zr catalyst tested in CSR of
commercial biodiesel at S/C of 3 and 650 °C with WHSV of 3.18 h-1
. It can be seen from
the Figures that large amount of carbon was present over the catalyst surface. The
presence of carbon nano tubes was observed as shown in the Figure 6.26. Carbon
formation was concentrated in some areas although other areas were also covered with
carbon. An EDX mapping of the used catalyst is shown in the Figure 6.27. The EDX
spectrum of the catalyst surface shows the highest C intensity in both the spectrums. The
SEM-EDX results were corroborated with TGA-FTIR results. The highest intensity of
CO2 observed in TGA-FTIR (Figure 6.23) and carbon balance (Table 6.3) of the catalyst
supports the SEM-EDX results. There are also clusters observed in the Figures 6.25, 6.29
and 6.30 which could be as a result of sintering of Ni crystallites. The increase in Ni
crystallite size and decrease in surface area observed during XRD and BET
measurements of the used Ni-K/Ce-Zr catalyst (Table 6.6 and Table 6.7) also support this
analysis.
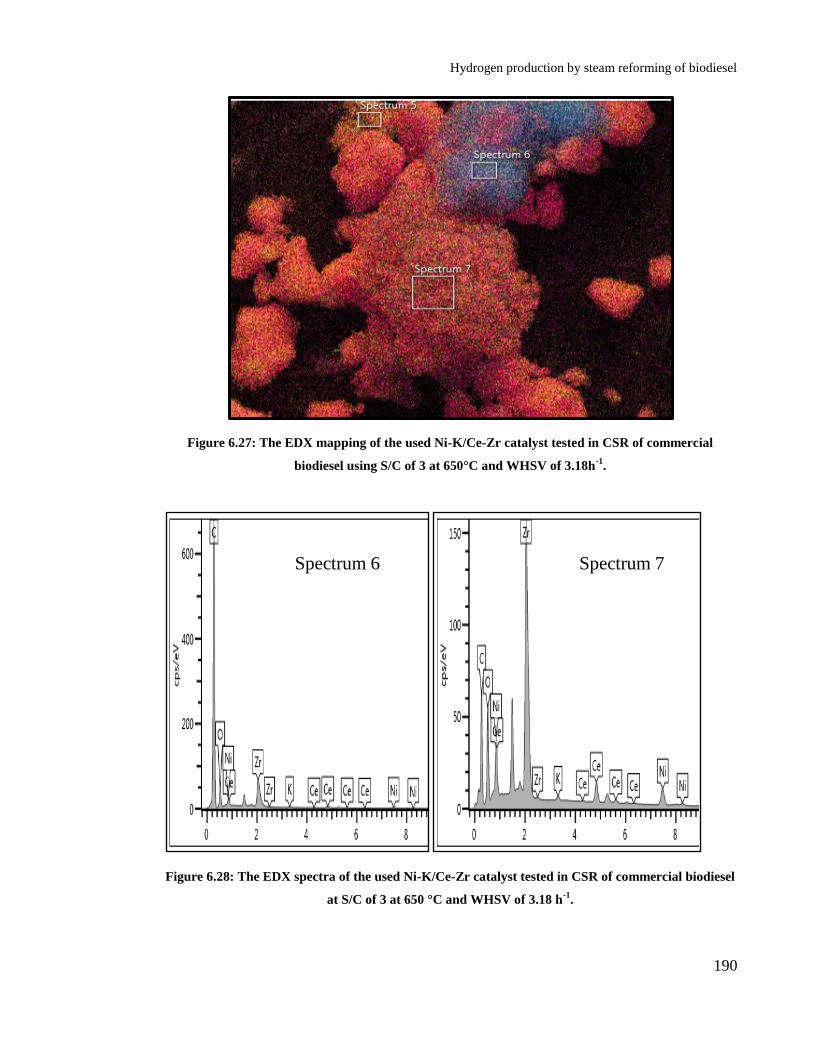
Hydrogen production by steam reforming of biodiesel
190
Figure 6.27: The EDX mapping of the used Ni-K/Ce-Zr catalyst tested in CSR of commercial
biodiesel using S/C of 3 at 650°C and WHSV of 3.18h-1
.
Figure 6.28: The EDX spectra of the used Ni-K/Ce-Zr catalyst tested in CSR of commercial biodiesel
at S/C of 3 at 650 °C and WHSV of 3.18 h-1
.
Spectrum 6 Spectrum 7

Hydrogen production by steam reforming of biodiesel
191
Figure 6.29: The EDX mapping of the SEM image shown in the Figure 6.25 using the same
conditions as Figure 6.27.

Hydrogen production by steam reforming of biodiesel
192
Figure 6.30: Elemental distribution of the (Figure 6.27) which represents used Ni-K/Ce-Zr catalyst
tested using same conditions as Figure 6.27.

Hydrogen production by steam reforming of biodiesel
193
Figure 6.31: The SEM image used Ni/Ce-Zr catalyst at 11 K mag using upper detector. The catalyst
was tested in CSR of commercial biodiesel using S/C of 3 at 650 °C and WHSV of 3.18 h-1
.
Figure 6.32: The SEM image used Ni/Ce-Zr catalyst at 15 K mag using secondary lower detector.
The conditions were same as Figure 6.31.
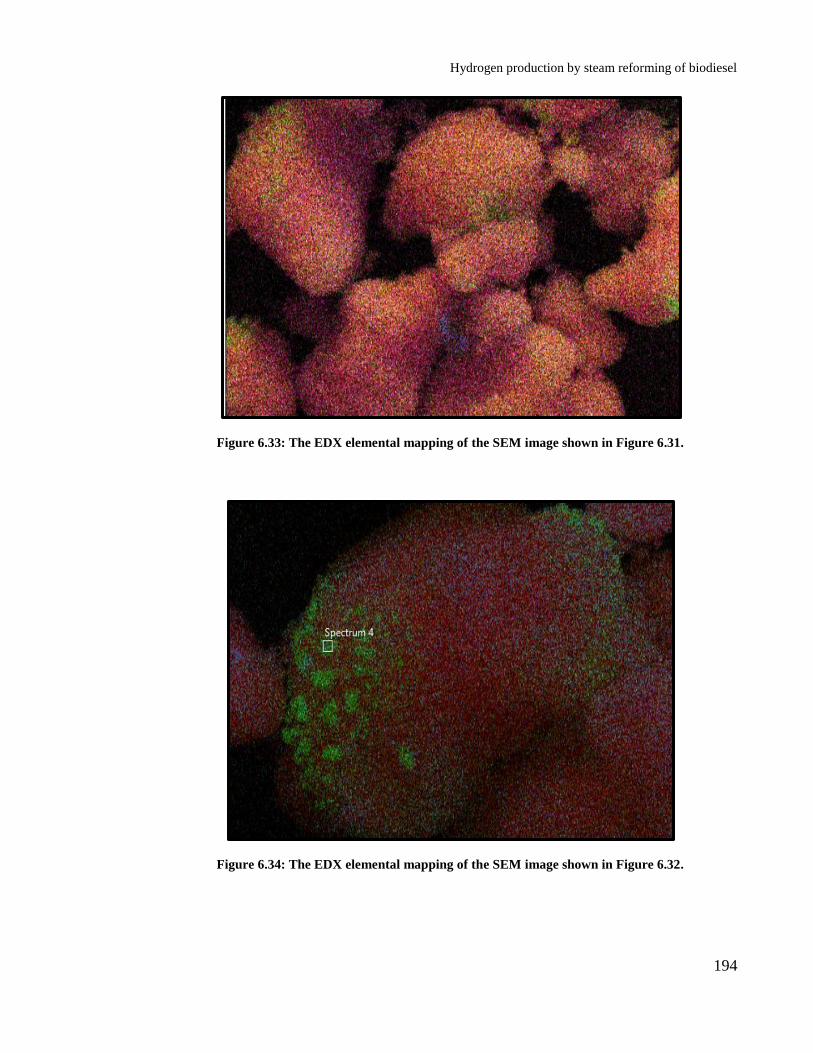
Hydrogen production by steam reforming of biodiesel
194
Figure 6.33: The EDX elemental mapping of the SEM image shown in Figure 6.31.
Figure 6.34: The EDX elemental mapping of the SEM image shown in Figure 6.32.

Hydrogen production by steam reforming of biodiesel
195
The SEM image of the used Ni/Ce-Zr catalyst tested in CSR of commercial biodiesel
with S/C of 3 at 650 °C with WHSV of 3.18 h-1
is shown in the Figure 6.31 and 6.32. It
can be seen from the Figure that the amount of carbon deposited on the catalyst surface
was much less as compared to Ni/-K/Ce-Zr catalyst. The formation of the carbon on the
catalyst is evenly distributed (Figure 6.33 and 6.34). The smaller intensity of CO2
observed in TGA-FTIR (Figure 6.23) and carbon balance (Table 6.3) results for the
catalyst supports the SEM-EDX results. On the other hand clusters of Ni were observed
over the catalyst which shows signs of sintering of Ni crystallites (Figure 6.34). Figure
6.35 shows EDX spectra of the used Ni/Ce-Zr catalyst and the elemental distribution of
the used Ni/Ce-Zr catalyst is shown in the Figure 6.36. The EDX spectra revealed the
presence of the Ni clusters; high Ni intensity (Figure 6.35) supports the result. The
reduction in BET surface area, observed with Ni/Ce-Zr catalyst also showed sintering of
the catalyst (Table 6.6).
Figure 6.35: The EDX spectra of the used Ni/Ce-Zr catalyst tested in CSR of commercial biodiesel at
S/C of 3 using 650 °C and WHSV of 3.18 h-1
.

Hydrogen production by steam reforming of biodiesel
196
Like Ni/Ce-Zr catalyst, carbon formation over Ni-Sn/Ce-Zr was uniformly distributed
over the catalyst surface as shown in the Figure 6.37. Figure 6.23 shows that only one
form of carbon was formed with Ni-Sn/Ce-Zr catalyst. The distribution of carbon seen
from the elemental distribution was uniform over the catalyst surface (Figure 6.39). The
existence of Ni sintering in this catalyst could be smaller in this catalyst as compared to
the other two catalysts. This can be seen in the elemental distribution for the catalyst and
Ni in the Figures 6.40 and 6.41. The reduction in surface area as a result of sintering was
lowest for this catalyst in comparison to the other two Ni/Ce-Zr and Ni-K/Ce-Zr catalyst.
Thus combining the BET and SEM-EDX results, one can say that this catalyst suffers
less sintering for both the support and Ni.

Hydrogen production by steam reforming of biodiesel
197
Figure 6.36: Elemental distribution for the used Ni-/Ce-Zr catalyst using same conditions as Figure
6.30.

Hydrogen production by steam reforming of biodiesel
198
Figure 6.37: The SEM image of used Ni-Sn/Ce-Zr catalyst at 11 K mag. The catalyst was tested for
CSR of commercial biodiesel using S/C of 3 at 650 °C and WHSV of 3.18 h-1
.
Figure 6.38: The EDX elemental mapping of the SEM image shown in Figure 6.37.

Hydrogen production by steam reforming of biodiesel
199
Figure 6.39: Elemental distribution for the used Ni-Sn/Ce-Zr catalyst using same conditions as
Figure 6.38.

Hydrogen production by steam reforming of biodiesel
200
Figure 6.40: Elemental distribution for the used Ni-Sn/Ce-Zr catalyst using same conditions as
Figure 6.37. In the figure (A) is elemental mapping of the catalyst and (B) is the Ni mapping for the
catalyst.
A
B

Hydrogen production by steam reforming of biodiesel
201
Figure 6.41: The EDX spectra of the used Ni-Sn/Ce-Zr catalyst tested in CSR of commercial biodiesel
using S/C of 3 at 650 °C and WHSV of 3.18 h-1
6.6 Conclusion
The experimental results show that biodiesel can be converted to H2 rich gas efficiently.
The optimum temperature for H2 production by CSR of biodiesel is in the range of 650-
700 °C which was also predicted by equilibrium. The optimum biodiesel vaporiser
temperature was found to be 190 °C. Molar S/C ratio played an important role to
determine the right conditions to perform the experiments, with S/C of 3 showing the best
performance. It was found that WHSV of 3.18 h-1
provided the best results. The four
different biodiesels examined showed that the commercial biodiesel exhibited the highest
YH2 and Xbiod. Both the catalysts, commercial and in house prepared catalyst i.e. Ni/Ce-Zr
and Ni/Ca-Al provided the best performance in terms of H2 yield, along with Xbiod and
XH2O. In comparison to Ni/Ce-Zr, Ni-Ce-Zr-3/1 catalyst was ineffective and showed very

Hydrogen production by steam reforming of biodiesel
202
high carbon formation about 25.7% of the carbon feed was observed on the catalyst
making it very difficult to operate the reactor and calculate the conversion as a result the
experimental results were not shown above for this particular catalyst.
Surface area analysis of the used catalysts indicated that the Ni/Ca-Al, Ni/Ce-Zr and Ni-
K/Ce-Zr catalysts were prone to higher sintering as compared to the other Ni/Al and Ni-
K/Al catalysts. The SEM-EDX analysis showed the presence of Ni sintering in the Ni/Ce-
Zr, Ni-K/Ce-Zr and Ni-Sn/Ce-Zr catalysts. The TPO results performed using TGA-FTIR
showed that two forms of carbon were deposited on the Ni/Al, Ni/Ce-Zr and Ni-K/Ce-Zr
catalysts. On the other hand Ni-Sn/Ce-Zr and Ni/Ca-Al showed the presence of only one
form of carbon.
Hydrogen production by steam reforming of biodiesel
203
7. Autothermal reforming
The ATR of biodiesel was examined by Specchia et al [146] and the authors reported the
conditions to run an ATR reformer. The authors reported that S/C of 2-2.5 and O2/C of
0.39-0.41 were good starting conditions to operate an ATR reformer. As a result the ATR
experiments were performed using similar conditions. From the CSR experiments Ni/Ca-
Al catalyst was an effective catalyst exhibiting highest biodiesel and water conversion
thus highest H2 yield. The experiments were performed at two S/C of 2-3, O2/C of 0.3 -
0.38 and WHSV of 3.23-2.54 h-1
using commercial biodiesel. As this catalyst showed
highest conversion at 650°C this temperature was selected for the investigation. The
experiments were performed using same input carbon molar flowrate as the CSR
experiment. In the experiments performed, biodiesel flowrate was set to 0.978 cm3/h
which gave a carbon input flowrate of 1.50 10-5
mol/s. The water flow rate was varied
from 1.95 to 2.92 cm3/h to obtain the desired S/C of 2 and 3 respectively. In comparison
to CSR, O2 was used in the experiment. As use of pure O2 was not allowed for the
experiments, air was used. In order to adjust the WHSV, N2 was used in addition with air.
The air flowrates of 26 and 40 cm3/min were used to obtain an O2/C ratio of 0.3 and 0.38.
7.1 Experimental procedure and reactions involved
In addition to the reactions involved in SR discussed in 6.1, catalytic partial (CPO) and
complete oxidation (CPO) happen in the ATR processes. Reaction 7.1 and 7.2 show the
partial and complete oxidation reactions.
n m k 2 2 , 298K
n-kC H O + O nCO + H ΔH 0
2 2f
m (7.1)
n m k 2 2 2 , 298K
m k m C H O + n+ O nCO + H O ΔH 0
4 2 2f
(7.2)
Hydrogen production by steam reforming of biodiesel
204
Other oxidation reactions like oxidation of CO, H2 and C takes in ATR processes.
2 2 , 298K
1 CO+ O CO ΔH =-283.6 kJ/mol
2f (7.3)
2 2 2 , 298K
1H + O H O ΔH =-241.6 kJ/mol
2f
(7.4)
, 298K2 ΔH =-1
1C+ O CO 10.5 kJ l
2/mof (7.5)
, 2982 K2 ΔH =-395.6kJ/molC+O CO f (7.6)
For measuring the performance of ATR same Eqs i.e. (6.12, 6.17 and 6.22) used in CSR
were used to determine the conversion of biodiesel (Xbiod), steam (XH2O) and hydrogen
yield (YH2). The oxygen conversion is determined using the following Eq 7.7. The
selectivities of carbon gases were calculated in similar fashion as the CSR using Eqs
6.24-26. The selectivity for H2 (SH-H2) was calculated using Eq 7.8, which contains
addition H2O term in addition to the others. The efficiency of the process was measured
by comparing the experimental results to the equilibrium predictions.
2 2
2
2
O , in O , out
O
O , in
n -nX = ×100
n
(7.7)
2
2
2 4 2 4 2 6 3 6 3 8 2
H
H H .
H CH C H C H C H C H H O
yS 100
y +y +y +y +y +y +y
(7.8)
The reaction contribution of the reactions was also calculated. Let the moles of biodiesel
reacted by POX (R-7.1), CSR (R-6.3), COX (R-7.2) and TD(R-6.4) be POXn , CSRn , COXn
and TDn .
Hydrogen production by steam reforming of biodiesel
205
Applying mass balance we get
outCO POX TDn ( n n )n k (7.9)
out2POX TD CSRn (n n ) ( 2 ) n
2 2H
m mn k (7.10)
out2CSR COXn (n n )CO n (7.11)
Cs TDn =(n-k)×n (7.12)
Solving for POXn , CSRn , COXn and TDn we get
CsTD
nn = mol/s
n-k
(7.13)
2CO out
COX CSR
nn = -n mol/s
n
(7.14)
2H ,out POX TD
CSR
n - 0.5m×(n +n )n mol/s
m( +2n-k)
2
(7.15)
CO out TDPOX
n -k×nn = mol/s
n
(7.16)
POXPOX
TD POX CSR COX
nn (%)= ×100
n +n +n +n
(7.17)
In the above equations n, m and k are the elemental composition of C, H and O of
biodiesel respectively.
It is important to note that the C balance for ATR runs had an additional term which
involved char collected from the reactor inlet.. Figure 7.1 shows the char formed in

Hydrogen production by steam reforming of biodiesel
206
reactor inlet in the ATR experiments. Also O2 conversion for all the experiments was
100%.
Figure 7.1: Char formed in the reactor inlet during ATR experiments.
7.2 Results and discussion
Figure 7.2 shows the performance of Ni/Ca-Al catalyst in attempted ATR of commercial
biodiesel at 650 °C with 190 and 170 °C as vaporiser temperatures. The Xbiod was highest
at S/C of 3 and O2/C of 0.38 at WHSV of 3.23 h-1
. The molar carbon balance for these
set of experiments is provided in Table 7.1 performed over 7200s with the carbon input
of 1.08×10⁻¹
mol. Biodiesel conversion (Xbiod) of 84.03% was observed at these
conditions. In CSR, with same conditions Xbiod of 96.04% was observed. As compared to
CSR, under attempted ATR conditions, XH2O was drastically affected. The XH2O
decreased from 37.8 to 13.1% when the ATR equilibrium value was in excess of 25%.
At the same O2/C and WHSV value, decreasing the S/C had a negative effect on the
Char
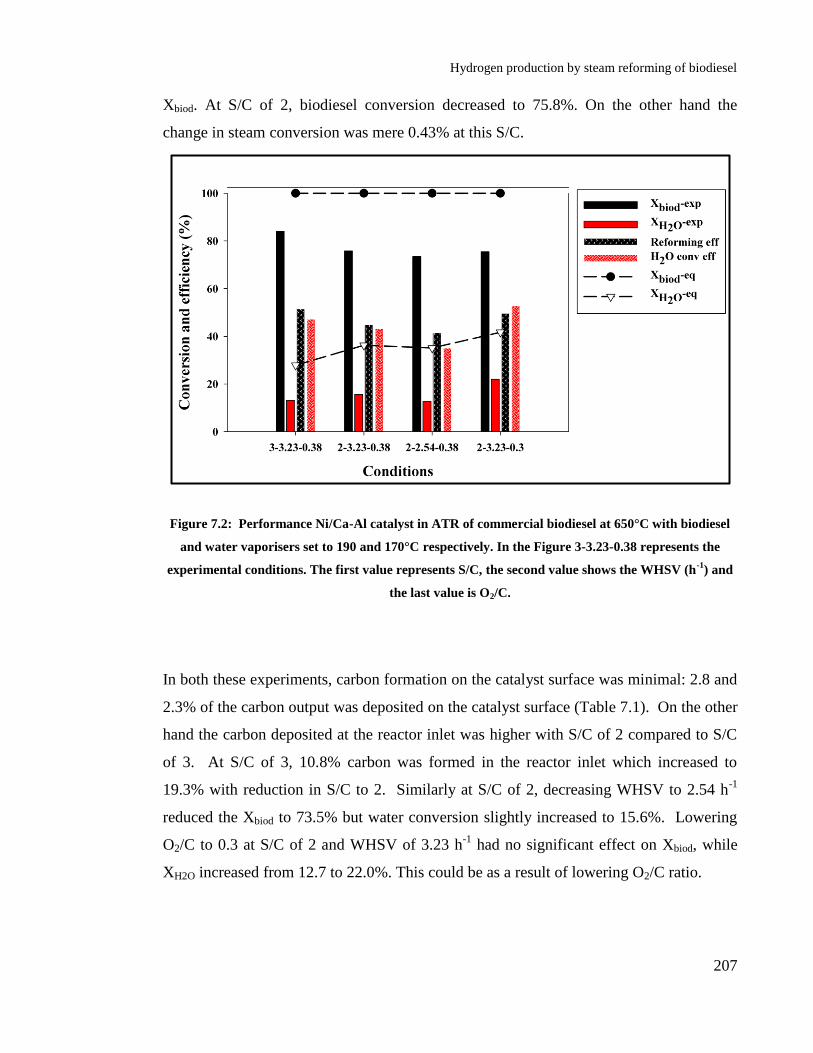
Hydrogen production by steam reforming of biodiesel
207
Xbiod. At S/C of 2, biodiesel conversion decreased to 75.8%. On the other hand the
change in steam conversion was mere 0.43% at this S/C.
Figure 7.2: Performance Ni/Ca-Al catalyst in ATR of commercial biodiesel at 650°C with biodiesel
and water vaporisers set to 190 and 170°C respectively. In the Figure 3-3.23-0.38 represents the
experimental conditions. The first value represents S/C, the second value shows the WHSV (h-1
) and
the last value is O2/C.
In both these experiments, carbon formation on the catalyst surface was minimal: 2.8 and
2.3% of the carbon output was deposited on the catalyst surface (Table 7.1). On the other
hand the carbon deposited at the reactor inlet was higher with S/C of 2 compared to S/C
of 3. At S/C of 3, 10.8% carbon was formed in the reactor inlet which increased to
19.3% with reduction in S/C to 2. Similarly at S/C of 2, decreasing WHSV to 2.54 h-1
reduced the Xbiod to 73.5% but water conversion slightly increased to 15.6%. Lowering
O2/C to 0.3 at S/C of 2 and WHSV of 3.23 h-1
had no significant effect on Xbiod, while
XH2O increased from 12.7 to 22.0%. This could be as a result of lowering O2/C ratio.
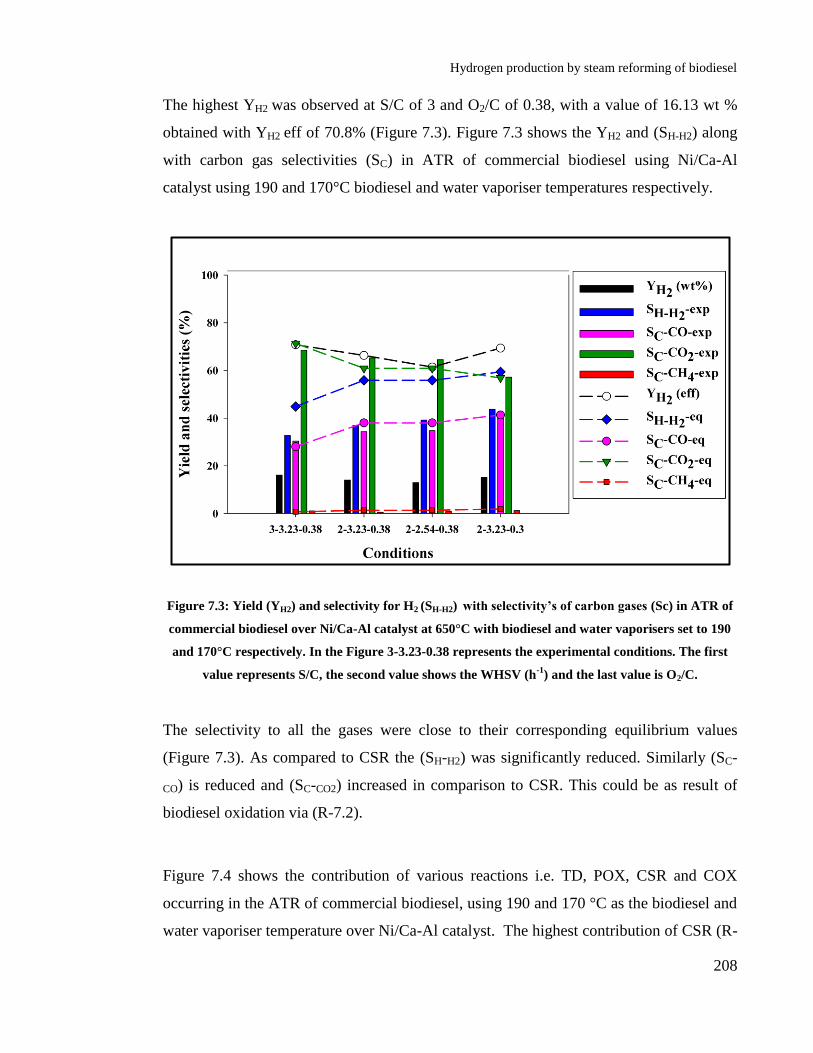
Hydrogen production by steam reforming of biodiesel
208
The highest YH2 was observed at S/C of 3 and O2/C of 0.38, with a value of 16.13 wt %
obtained with YH2 eff of 70.8% (Figure 7.3). Figure 7.3 shows the YH2 and (SH-H2) along
with carbon gas selectivities (SC) in ATR of commercial biodiesel using Ni/Ca-Al
catalyst using 190 and 170°C biodiesel and water vaporiser temperatures respectively.
Figure 7.3: Yield (YH2) and selectivity for H2 (SH-H2) with selectivity’s of carbon gases (Sc) in ATR of
commercial biodiesel over Ni/Ca-Al catalyst at 650°C with biodiesel and water vaporisers set to 190
and 170°C respectively. In the Figure 3-3.23-0.38 represents the experimental conditions. The first
value represents S/C, the second value shows the WHSV (h-1
) and the last value is O2/C.
The selectivity to all the gases were close to their corresponding equilibrium values
(Figure 7.3). As compared to CSR the (SH-H2) was significantly reduced. Similarly (SC-
CO) is reduced and (SC-CO2) increased in comparison to CSR. This could be as result of
biodiesel oxidation via (R-7.2).
Figure 7.4 shows the contribution of various reactions i.e. TD, POX, CSR and COX
occurring in the ATR of commercial biodiesel, using 190 and 170 °C as the biodiesel and
water vaporiser temperature over Ni/Ca-Al catalyst. The highest contribution of CSR (R-

Hydrogen production by steam reforming of biodiesel
209
6.3) was observed at S/C of 3 and constant O2/C of 0.38 and WHSV of 3.23 h-1
. At these
conditions CSR (R-6.3) contributed 32% and the other two reactions POX (R-7.1) and
COX (R-7.2) contributed to 24 and 27%. Among the four reactions the contribution of
TD (R-6.4) was lowest about 18 %. The higher CSR (R-6.3) contribution resulted in
higher Xbiod and XH2O conversions resulting in higher (YH2) (Figure 7.2 and 7.3).
Lowering the S/C to 2 at the same O2/C and WHSV was unfavourable as it reduced the
contribution of the desired CSR (R-6.3) by 10 % and POX (R-7.1) by 1.2 %, with
increasing contribution of the undesired TD (R-6.4) by 7.2% resulting in lower Xbiod
(Figure 7,2) ultimately lowering (YH2) (Figure 7.3). The reduced S/C ratio marginally
affected contributions of COX (R-7.2) increasing by 2.6 %. The higher steam conversion
and reforming efficiencies (Figure 7.2) with S/C of 3 and O2/C of 0.38 corroborates the
interpretation of the results. The amount of carbon formed on the catalyst surface for
these two runs were similar but the carbon formed in the reactor inlet was higher with
S/C of 2 as result of higher TD (R-6.4) contribution of 25.2%.
The reduction of O2/C from 0.38 to 0.3 at S/C of 2 and same WHSV of 3.23 h-1
lowered
the contribution of COX (R-7.2) by 12 % and increased POX (R-7.1) by 13 %. At these
conditions of O2/C of 0.3 with S/C of 2, CSR (R-6.3) contribution increased by 5% and
TD (R-6.4) decreased by 6%. As a result YH2 increased from 14.1 to 15.2 wt % when
O2/C was lowered from 0.38 to 0.3.
At the same S/C of 2 and O2/C ratio of 0.38, decreasing the WHSV to 2.54 h-1
had no
significant effect on the reaction contributions. The contributions of POX (R-7.1) and
COX (R-7.2) increased by 3 and 1 %, but TD (R-6.4) decreased by 2.5 %. Even though
the contributions of POX and CSR (R-6.3) increased, the reduced Xbiod and XH2O
conversions (Figure 7.2) were responsible for the lower YH2. This also reflected by the
decreased fuel and steam conversion efficiencies which are a supporting evidence for the
interpretation.
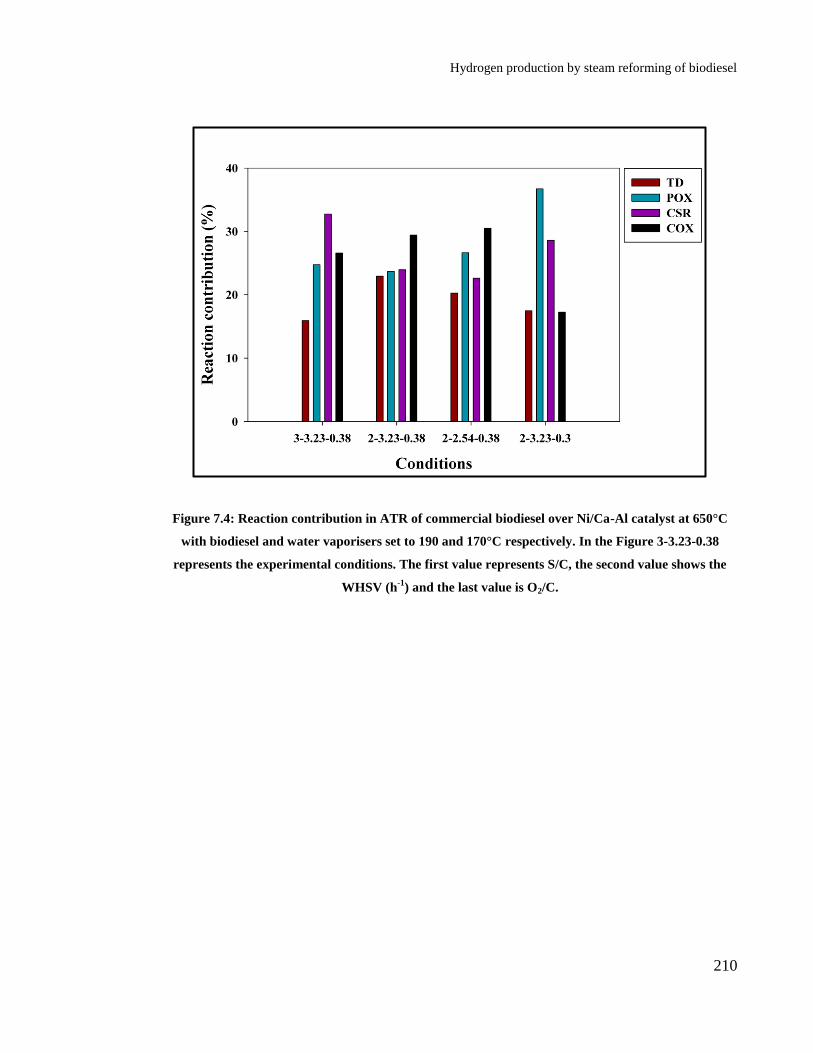
Hydrogen production by steam reforming of biodiesel
210
Figure 7.4: Reaction contribution in ATR of commercial biodiesel over Ni/Ca-Al catalyst at 650°C
with biodiesel and water vaporisers set to 190 and 170°C respectively. In the Figure 3-3.23-0.38
represents the experimental conditions. The first value represents S/C, the second value shows the
WHSV (h-1
) and the last value is O2/C.

Hydrogen production by steam reforming of biodiesel
211
Table 7.1: Molar carbon balance of ATR of commercial biodiesel using Ni/Ca-Al catalyst. The
biodiesel and water vaporiser were set to 190 and 170°C. The balance is based on total input mol of C
(=1.08 ×10⁻¹
) over duration of experiment (7200 s) minus mol C converted to gases, volatiles in the
condensate, deposited on catalyst and carbon formed in the reactor.
C on catal C in cond Char -reactor C in gases
O2/C
1-
Cin/Cout mol
% C
out mol
% C
out mol
% C
out mol % C out
0.38a 2.62
2.89
10-3
02.75
1.73
10-4
00.16
1.13×
10-2
10.78
9.07
10-2
86.29
0.38b 3.24
2.37
10-3
02.26
9.66
10-5
00.09
2.01×
10-2
19.30
8.18
10-2
78.32
0.38c 9.00
1.35
10-3
01.38
5.93
10-5
00.06
1.75×
10-2
17.83
7.93
10-1
80.71
0.3b 10.32
2.58×
10-3
02.66
3.53×
10-5
00.03
1.27×
10-2
13.15
8.14×
10-2
84.13
a- The experiment was performed using S/C of 3 with WHSV of 3.23 h-1
.
b- The experiment was performed using S/C of 2 with WHSV of 3.23 h-1
.
c- The experiment was performed using S/C of 2 with WHSV of 2.54 h-1
.
7.3 Energy Balance:
In order to determine if autothermal conditions are achieved an energy balance was
performed assuming isothermal conditions. The enthalpy of component i is calculated
using Eq 7.18 from CEA thermodynamic analysis software using NASA coefficients.
The values of the the coefficients a1-b1 is provided in Appendix E. The magnitude of the
balance (ΔHEC, for enthalpy change of reaction) was expressed in % of the total output
enthalpy given by following Eq 7.19.
2 3 4-2 -1i 1
1 2 3 4 5 6 7
H bT T T T=-a T +a T lnT+a +a +a +a +a +
RT 2 3 4 5 T (7.18)

Hydrogen production by steam reforming of biodiesel
212
H HΔH 100
H
p r
EC
p
(7.19)
The enthalpies of reactants and products in the inlet and outlet are shown in Tables 7.2
and 7.3, at isothermal conditions of 650°C and atmospheric pressures. In both inlets and
outlet enthalpies, enthalpy term of H2O completely dominates all the others (reactants
and products). In the inlet the enthalpy of H2O and biodiesel were negative while the
other reactants O2 and N2 were positive.
Table 7.2: Enthalpies of inlet reactants, calculated at isothermal conditions of 650 °C and 1 atm. In
the Table 3-3.23-0.38 represents the experimental conditions. The first value represents S/C, the
second value shows the WHSV (h-1
) and the last value is O2/C. The enthalpy calculation was
performed for duration of 7200 s.
Conditions 3-3.23-0.38 2-3.23-0.38 2-2.54-0.38 2-3.23-0.3
Enthalpy J % J % J % J %
Biod -9.62×10² 1.4 -9.62×10
2 2.2 -9.62×10
2 2.2 -9.62×10
2 2.2
H2O -7.09×10⁴ 104.1 -4.73×10
4 109.5 -4.73×10
4 109.5 -4.73×10
4 109.7
O2 8.25×10² -1.2 8.25×10
2 -1.9 8.25×10
2 -1.9 6.60×10
2 -1.5
N2 2.94×10³ -4.3 4.24×10
3 -9.8 4.24×10
2 -9.8 4.49×10
3 -10.4
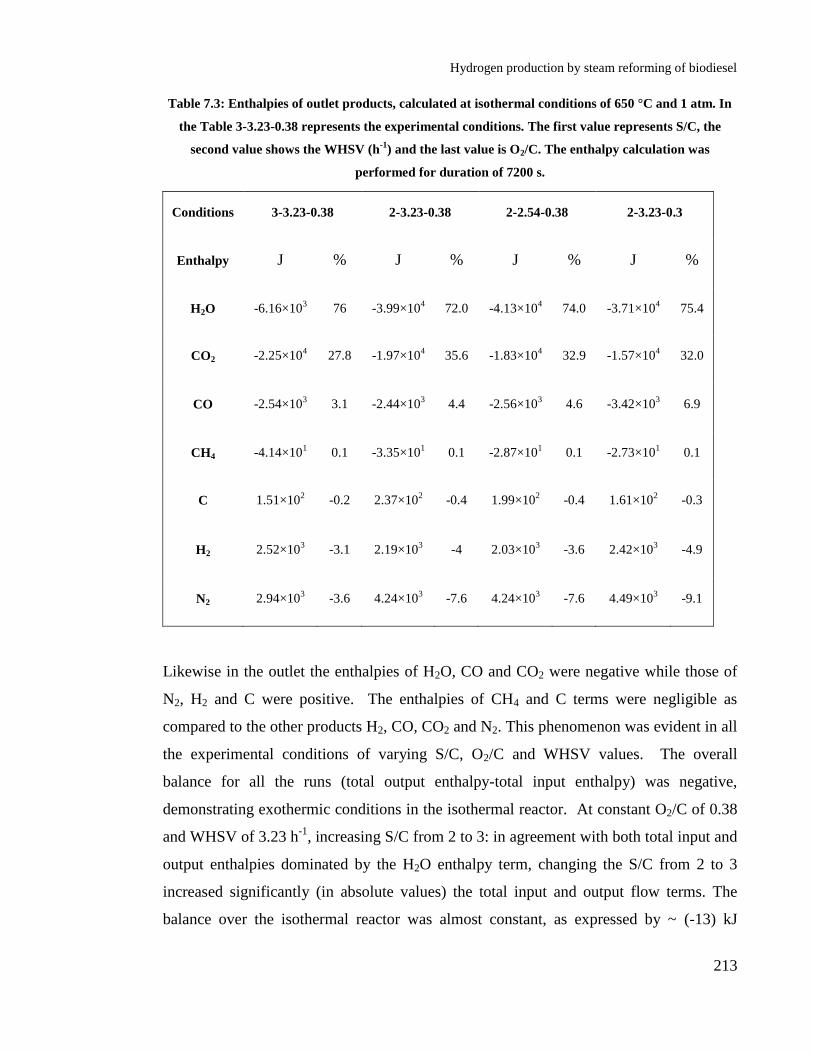
Hydrogen production by steam reforming of biodiesel
213
Table 7.3: Enthalpies of outlet products, calculated at isothermal conditions of 650 °C and 1 atm. In
the Table 3-3.23-0.38 represents the experimental conditions. The first value represents S/C, the
second value shows the WHSV (h-1
) and the last value is O2/C. The enthalpy calculation was
performed for duration of 7200 s.
Conditions 3-3.23-0.38 2-3.23-0.38 2-2.54-0.38 2-3.23-0.3
Enthalpy J % J % J % J %
H2O -6.16×10³ 76 -3.99×10
4 72.0 -4.13×10
4 74.0 -3.71×10
4 75.4
CO2 -2.25×10⁴ 27.8 -1.97×10
4 35.6 -1.83×10
4 32.9 -1.57×10
4 32.0
CO -2.54×10³ 3.1 -2.44×10
3 4.4 -2.56×10
3 4.6 -3.42×10
3 6.9
CH4 -4.14×101 0.1 -3.35×10
1 0.1 -2.87×10
1 0.1 -2.73×10
1 0.1
C 1.51×10² -0.2 2.37×10
2 -0.4 1.99×10
2 -0.4 1.61×10
2 -0.3
H2 2.52×10³ -3.1 2.19×10
3 -4 2.03×10
3 -3.6 2.42×10
3 -4.9
N2 2.94×10³ -3.6 4.24×10
3 -7.6 4.24×10
3 -7.6 4.49×10
3 -9.1
Likewise in the outlet the enthalpies of H2O, CO and CO2 were negative while those of
N2, H2 and C were positive. The enthalpies of CH4 and C terms were negligible as
compared to the other products H2, CO, CO2 and N2. This phenomenon was evident in all
the experimental conditions of varying S/C, O2/C and WHSV values. The overall
balance for all the runs (total output enthalpy-total input enthalpy) was negative,
demonstrating exothermic conditions in the isothermal reactor. At constant O2/C of 0.38
and WHSV of 3.23 h-1
, increasing S/C from 2 to 3: in agreement with both total input and
output enthalpies dominated by the H2O enthalpy term, changing the S/C from 2 to 3
increased significantly (in absolute values) the total input and output flow terms. The
balance over the isothermal reactor was almost constant, as expressed by ~ (-13) kJ
Hydrogen production by steam reforming of biodiesel
214
(Figure 7.5) over the 7200 s of the experiment. However expressed in terms of relative
energy flows, the difference between input and output appeared to reduce. With
autothermality expressed by ΔHEC of zero, a reduction from 22.1% to 16.0% (Figure 7.5)
in this parameter reflected conditions getting closer to autothermality from the
exothermal side. This is explained by equilibrium conditions shifted towards reactions
that utilise steam, such as SR (R-6.1) and WGS (R-6.2), where SR is significantly more
endothermic than the mildly exothermic WGS (R-6.2) (Figure 7.4).
Decreasing O2/C from 0.38 to 0.3 at constant S/C of 3 and WHSV of 3.23 h-1
, did not
affect the total input enthalpy, as the O2 term is a negligible contributor to the inflow of
energy compared to the overwhelming effect of steam. Varying the O2/C affects the
output enthalpy flow, via the effects on the CO and CO2 products. Decreasing O2/C
hinders the COX (R-7.2), and shifts the equilibrium towards the less exothermic POX (R-
7.1) (Figure 7.4). With CO2 being a dominant term in the output enthalpy, a lower yield
of CO2 product and higher yield of CO reduces overall the total output enthalpy and
brings the conditions closer to autothermality. This is reflected in the large drop in ΔHEC
from 22.1% to 12.7% (Figure 7.5). The condition O2/C of 0.3 for S/C of 2 at WHSV of
3.23h-1
represented the closest to autothermal conditions for this set of runs.
Changing the WHSV by varying the catalyst mass in the reactor would have the effect of
reducing the time available for homogeneous reactions in the reactor and for
heterogeneous reactions on the catalyst bed. Accordingly, lowering the WHSV
corresponded to higher reaction times and could have created conditions closer to
chemical equilibrium. However, it was found here that the energy balance was hardly
affected by the variation of WHSV from 3.23 to 2.54 h-1
at constant S/C of 2 and O2/C of
0.38, by increasing the catalyst mass from 2 g to 2.6 g. It is ventured that the reactor as
close to chemical equilibrium for 2g of catalyst as permitted by the set up and conditions
used, and that adding catalyst volume did not change that.

Hydrogen production by steam reforming of biodiesel
215
Figure 7.5: Enthalpy balance of the ATR reforming experiments.
7.4 Conclusion
Although the attempted ATR experiments were successful in demonstrating the
simultaneous occurrence and respective contributions of the desired reactions of POX,
steam reforming and complete oxidation, which form the backbone of autothermal
reforming, the reactor designed did not appear to convert the biodiesel to the same
efficient degree as was measured during the previous CSR experiments. A different
approach must be adapted to feeding the reactants, and recommendations on this issue are
made in the Future Work section. The main problem associated with the attempted ATR
experiments was excessive formation of carbon in the reactor inlet, affecting the
conversion of biodiesel to produce high yield of H2 gas.

Hydrogen production by steam reforming of biodiesel
216
8. Conclusion and future work
An experimental set-up was designed and successfully evaluated for H2 production from
biodiesel. An up flow reactor arrangement was difficult to operate as a result of
condensation occurring due to the mixing of cold N2 carrier gas and hot biodiesel vapours
and steam. The use of N2 preheating coils placed on the vaporisers in addition to
changing the configuration to down flow proved to be the right option for the prevention
of condensation of the biodiesel and steam vapours and correct operation of the system.
In order to evaluate the performance of the reactor set-up, a micro gas chromatograph
was installed and an analysis method was developed and successfully tested. The
designed set up was very effective for steam reforming while autothermal reforming
indicated further optimization was required. Effects of molar steam to carbon ratio in the
feed (S/C), temperature, weight hourly space velocity (WHSV, i.e. an inverse measure of
residence time in the reformer), catalyst and biodiesel characteristics on the steam
reforming outputs were examined at constant carbon input of 1.50 10-5
mol of C/s. The
optimum temperature conditions to convert biodiesel to H2 were found to be in the
temperature range 600-700°C, with 190 and 170°C as biodiesel and water vaporiser
temperatures respectively. The performance of the process was examined in terms of H2
yield, as well as Xbiod and XH2O and selectivity to products. The experimental values were
compared with the equilibrium values to determine the efficiency of the system and allow
comparisons between catalysts and operating conditions.
The catalysts examined in this study were prepared by impregnation of commercial Ce-Zr
support and of supports prepared by sol gel synthesis. The commercial Ce-Zr was
supplied MEL Chemicals, UK. The manufacturer supplied the support in the form of
hydroxide and oxide. The hydroxide was calcined in the laboratory to form oxide and
was used to prepare the catalyst using two methods (wet and dry impregnation) with
different Ni loading. It was found that smaller Ni crystallite sizes and higher surface area
with good pore size distribution was exhibited by catalysts prepared with the wet
impregnation method. As a result, this method was used in catalyst preparations. Further
Hydrogen production by steam reforming of biodiesel
217
the oxide pre calcined by the manufacturer had higher surface area thus it was chosen for
the preparation of the catalysts Ni/Ce-Zr, N-K/Ce-Zr and Ni-Sn/Ce-Zr. Tamarind seed
polysaccharide was used for the first time as a gelling agent in sol gel synthesis for the
preparation of catalyst supports (Ce-Zr-3/1 and Ce-Al-3/1). As the polysaccharide is
stable up to 100°C and can work in high ph this would assist in good gel formation. The
formation of nanoparticles using green approach can be achieved. The higher chain
length of the polysaccharide resulted in formation of nano crystals.
Three different kinds of biodiesel (commercial, palm and in house) were used to evaluate
the characteristics of biodiesel on the process. It was found that commercial biodiesel
exhibited the best performance in terms of reactants conversion and YH2 over the Ni/Ca-
Al catalyst among the three biodiesels tested and was thus used for evaluating the other
catalysts.
The performance of the in house prepared Ni catalysts was compared with the
commercial (Ni/Al) catalyst provided by Johnson Matthey, Plc and the Ni/Ca-Al catalyst
provided by TST, Ltd. For Ni/Al catalysts, highest YH2 of 26.3 wt% of the biodiesel feed
was obtained with YH2 (eff) of 87.2% (i.e. % of the chemical equilibrium value) at 700 oC
and S/C of 3 at WHSV of 3.52 h-1
. A biodiesel conversion of 92% with 36.3% steam
conversion was obtained for the catalyst, representing 84% and 77% of the chemical
equilibrium values respectively. On the other hand Ni/Ca-Al and Ni/Ce-Zr supported
catalysts exhibited the best performance at lower temperature (650 oC) and WHSV of
3.18 h-1
at S/C of 3. A YH2 of 27.0 wt% (93.3% of equilibrium), was seen with the Ni/Ca-
Al catalyst as a result of high biodiesel and steam conversions of 96% and 37.5%. On the
other hand, Ni/Ce-Zr was responsible for slightly higher YH2 of 27.9 wt%, equivalent to
96% of the equilibrium value, caused by the highest steam conversion among all the
catalysts examined. The Ni/Ca-Al and the Ni/Ce-Zr catalysts exhibited a fuel reforming
efficiencies as expressed by the ratio of H2 to biodiesel calorific values of 86.4 and
88.9%.
Hydrogen production by steam reforming of biodiesel
218
The addition of dopants such as K and Sn had a negative effect on the catalytic activity of
the Ni/Ce-Zr catalyst, especially Ni-K/Ce-Zr which showed higher C deposition on the
catalyst surface and exhibited lower reforming activity as a result. The Ni catalysts
prepared using sol gel made supports (Ce-Zr-3/1 and Ce-Al-3/1) were ineffective
compared to the ones prepared using commercial Ce-Zr support supplied by MEL
chemicals, UK. The catalysts prepared using sol gel syntheses were prone to carbon
deposition and exhibited low surface area along with uneven pore structure, affecting
their activity and catalyst performance. On the other hand the catalyst prepared using
commercial Ce-Zr support had high surface area and had a uniform pore structure thus
providing good catalytic activity.
In comparison to steam reforming, H2 production via autothermal reforming was not as
successful. A hydrogen yield of 16.1 wt%, i.e. just 70.8% of equilibrium was achieved at
S/C of 3 and molar oxygen to carbon ratio (O2/C) of 0.38 with WHSV of 3.23 h-1
at 650
°C, resulting from Xbiod and XH2O of just 84.0 and 13.1%, respectively. Enthalpy
balances on the reformer for the experiments performed at 650 °C for the constant run
durations of 7200 s showed that the enthalpy balance (Hr) for all the runs (total output
enthalpy minus total input enthalpy) was negative, demonstrating exothermic conditions
in the isothermal reactor. The negative enthalpy term of H2O (steam) dominated over all
the other reactants input enthalpy terms (biodiesel, O2, N2). In the total output enthalpy,
the enthalpies of H2O, CO2, CH4 and CO were negative while those of N2, O2, C and
biodiesel, were positive, with, again the steam term dominating over all the others. The
magnitude of the balance ΔHEC showed that lower S/C of 2, resulted in conditions getting
closer to autothermality from the exothermal side. The ΔHEC value reducing from 22% to
16% of the total output enthalpy when lowering S/C from 3 to 2 at constant O2/C of 0.38
and WHSV of 3.23 h-1
supported this interpretation. Likewise lowering the O2/C from
0.38 to 0.3 at constant at S/C of 2 and WHSV of 3.23 h-1
also had a significant effect on
ΔHEC, suggesting conditions moving closer to autothermality, supported by reduced ΔHEC
value from 22.1% to 12.7%. At 650 °C, the condition O2/C of 0.3 for S/C of 2 at WHSV
of 3.23 h-1
represented the closest to autothermal conditions for the experiments.

Hydrogen production by steam reforming of biodiesel
219
Future work
It can be seen from this evaluation that H2 can be successfully produced from biodiesel
via steam reforming. The long term evaluation of the process has to be carried out to
determine the stability of the catalyst in terms of activity and carbon deposition. The
reasons responsible for carbon formation should be investigated to improve the stability
and activity of the catalyst. The forms of carbon formed during hydrogen production
must be investigated. This would help in selection or modification of catalyst to resist or
minimise carbon formation. Further characterisation of catalyst using chemisorptions
should be performed in order to determine the active sites of the catalyst in order to have
a clear idea of the performance of the catalyst. Evaluation of the catalyst in kinetic regime
rather than the thermodynamic regime should be performed in order to have a clear
picture on the activity of the catalysts. The optimisation of particle size to eliminate
internal diffusion limitation must be determined. In order eliminate the effects of
thermodynamic regime; experiments must be performed in lower temperature range from
500-600°C.
The formation of liquid products during the hydrogen production processes has to be
examined to determine their effect on the overall performance of the process. The
presence of certain compounds in the liquid products like aromatics responsible for
carbon formation, would give an idea of the reaction mechanisms involved and steps
leading to the formation of the carbon precursors. The factors responsible for formation
of the carbon precursors must be indentified and steps to avoid them should be
investigated. For e.g. the effect of reactor temperature steam/carbon ration, residence
time and catalyst support on the formation of carbon precursors like aromatics or
ethylene should be investigated. The investigation of these conditions would help in
selection of operating conditions for hydrogen production from biodiesel.
Hydrogen production by steam reforming of biodiesel
220
The effects of wall on the reactor on the performance of process have been examined.
The stainless steel contains Ni and other elements such Cr which would catalyse some
reactions during hydrogen production. Likewise the presence of sand used in the reactor
would also affect reactions like decomposition during hydrogen production. As a result
both these important aspects need to be examined under the chosen operating conditions.
The influence of biodiesel type on hydrogen production is not fully understood. In order
to investigate the effect of biodiesel type on H2 production, use of biodiesel derived from
animal fat such as beef tallow or non edible oil derived biodiesel i.e. Jatropha could be
evaluated. Further the hydrogen production from model compounds like methyl palmitate
or linoleate etc should be studied. The percentage of the methyl esters vary depending on
the source of biodiesel. The examination of H2 production from model compounds would
provide clues to the variation in performance of biodiesel in steam reforming processes.
Likewise this could also provide an insight into the reasons for carbon formation during
the process. Similarly, biodiesel production using algae oil has been investigated widely
in recent times and algal biodiesel could also be investigated for steam reforming. The
use of algae-derived biodiesel could be essential in resolving the problems of using edible
oil for biodiesel production and competition between food and non-food crops. The use
of sinter resistant Ni catalyst containing Ce-Zr needs to be developed for long term H2
production from biodiesel.
It is known that steam reforming is an energy consuming process, in order to minimize
energy expenditure of H2 production autothermal reforming must be optimised and
further evaluated. Different flow arrangements of reactants and oxidant for autothermal
reforming may improve the processes effectiveness and increase H2 yield while reducing
carbon formation. Other processes such as chemical looping and sorption enhanced steam
reforming could be evaluated for H2 production from biodiesel. These processes are
energy efficient and improve H2 yield, when low H2 yield is a drawback of conventional
autothermal reforming.
Hydrogen production by steam reforming of biodiesel
221
9. References
1. Akorede, M.F., et al., Mitigating the anthropogenic global warming in the electric
power industry. Renewable and Sustainable Energy Reviews, 2012. 16(5): p.
2747-2761.
2. John, H., Global warming. Reports on Progress in Physics, 2005. 68(6): p. 1343.
3. Hanley, I., Unmixed steam reforming of methane and vegetable oil for production
of hydrogen rich gas, in Energy research Institute. 2007, University of Leeds:
Leeds. p. 194.
4. MHTRE. Global warming. 2014 [cited 2014 May 30]; Available from:
http://www.revisescience.co.uk/2011/schools/hach/sc1air2.asp.
5. Council., N.R., Advancing science of climate change. 2010, National Research
Council. p. 4.
6. Florides, G.A. and P. Christodoulides, Global warming and carbon dioxide
through sciences. Environment International, 2009. 35(2): p. 390-401.
7. Neftel, A., et al., Evidence from polar ice cores for the increase in atmospheric
CO2 in the past two centuries. Nature, 1985. 315(6014): p. 45-47.
8. US and IEA, CO2 emissions from fuel coombustion 2013, International energy
agency. p. 7-142.
9. Doman, L.E., World energy demand and economic outlook. 2013 U.S.EIA:
Washington. p. 9-19.
10. BP, BP Energy outlook 2035. 2014.
11. Monirul Qader Mirza, M., Global warming and changes in the probability of
occurrence of floods in Bangladesh and implications. Global Environmental
Change, 2002. 12(2): p. 127-138.
12. Niranjan Kumar, K., et al., On the observed variability of monsoon droughts over
India. Weather and Climate Extremes, 2013. 1(0): p. 42-50.
13. Kharraz, J.E., et al., Water scarcity and drought in WANA countries. Procedia
Engineering, 2012. 33(0): p. 14-29.
14. Sanghi, A. and R. Mendelsohn, The impacts of global warming on farmers in
Brazil and India. Global Environmental Change, 2008. 18(4): p. 655-665.
15. Peng, S., et al., Rice yields decline with higher night temperature from global
warming. Proceedings of the National Academy of Sciences of the United States
of America, 2004. 101(27): p. 9971-9975.
16. Walthall, C.L., J. Hatfield, P. Backlund, L. Lengnick, E. Marshall, M. Walsh, S.
Adkins, M. Aillery, E.A. Ainsworth, , et al., Climate Change and Agriculture in
the United States.USDA Technical Bulletin 1935. . 2012, U.S. Department of
Agriculture,: Washington, DC. p. 186.
17. Stern, N., The Economics of Climate Change 2006, The Office of Climate
Change: Exter United Kingdom. p. 27.
18. Wang, G., et al., A comprehensive risk analysis of coastal zones in China.
Estuarine, Coastal and Shelf Science, 2014. 140(0): p. 22-31.
19. Crowell, M., et al., An Estimate of the U.S. Population Living in 100-Year Coastal
Flood Hazard Areas. Journal of Coastal Research, 2010: p. 201-211.

Hydrogen production by steam reforming of biodiesel
222
20. Hinrichsen, D., Coastal Waters of the World Trends, Threats, and Strategies.
1998, Washington DC: Island Press. 270.
21. Adam Parri, et al., Global Sea Level Rise Scenarios for the United States National
Climate Assessment. 2012, Natioanl Oceanic and Atmospheric Administration:
Sliver spring, Maryland. p. 1-29.
22. UCS, Causes of Sea Level Rise: What the Science Tells Us. 2013, Union of
concerned scientists: Washington, DC. p. 1-7.
23. Nicholls, R.J., F.M.J. Hoozemans, and M. Marchand, Increasing flood risk and
wetland losses due to global sea-level rise: regional and global analyses. Global
Environmental Change, 1999. 9, Supplement 1(0): p. S69-S87.
24. Parizek, B.R. and R.B. Alley, Implications of increased Greenland surface melt
under global-warming scenarios: ice-sheet simulations. Quaternary Science
Reviews, 2004. 23(9–10): p. 1013-1027.
25. Chapman, M.R., N.J. Shackleton, and J.-C. Duplessy, Sea surface temperature
variability during the last glacial–interglacial cycle: assessing the magnitude and
pattern of climate change in the North Atlantic. Palaeogeography,
Palaeoclimatology, Palaeoecology, 2000. 157(1–2): p. 1-25.
26. Bajracharya, S.R., P.K. Mool, and B.R. Shrestha, Impact of Climate Change on
Himalayan Glaciers and Glacial Lakes Case Studies on GLOF and Associated
Hazards in Nepal and Bhutan. 2007, Kathmandu, Nepal: Quality Printers. 120.
27. Bajracharya, S.R. and P. Mool, Glaciers, glacial lakes and glacial lake outburst
floods in the Mount Everest region, Nepal. Annals of Glaciology, 2010. 50(53): p.
81-86.
28. Tarnocai, C., et al., Soil organic carbon pools in the northern circumpolar
permafrost region. Global Biogeochemical Cycles, 2009. 23(2): p. GB2023.
29. Mastny, L. Melting of Earth's Ice Cover Reaches New High. 2000 [cited 2014 6
June 2014]; Available from: http://www.worldwatch.org/melting-earths-ice-
cover-reaches-new-high.
30. Michieka, N.M. and J.J. Fletcher, An investigation of the role of China's urban
population on coal consumption. Energy Policy, 2012. 48(0): p. 668-676.
31. WCES, Steel Statistical Yearbook 2013, Worldsteel Committee on Economic
Studies: Brussel. p. 116.
32. Mellish, M.L., International Energy Outlook. 2013, U.S. Eenergy Information
Administration: Washington. p. 67-84.
33. Awan, A.B. and Z.A. Khan, Recent progress in renewable energy – Remedy of
energy crisis in Pakistan. Renewable and Sustainable Energy Reviews, 2014.
33(0): p. 236-253.
34. WSA, Crude steel production March 2014, World steel association. p. 1.
35. McCaffrey, R. Global Cement India-review. in The 2nd Global Cement India
Conference and Exhibition 2013. Mumbai, India.
36. Findler, S., Rising Coal Use Clouds Europe's Future. The wall street journal,
2014.
37. Barden, J.L. and M. Ford, International Energy Outlook. 2013, U.S. Eenergy
Information Administration. p. 67-84.

Hydrogen production by steam reforming of biodiesel
223
38. U.S.EIA. Dy natural gas consumption. 2012; Available from:
http://www.eia.gov/cfapps/ipdbproject/iedindex3.cfm?tid=3&pid=26&aid=2&cid
=regions&syid=2008&eyid=2012&unit=BCF.
39. Metelitsa, A. and M. Leahy, International energy outlook. 2013, U.S. Eenergy
Information Administration: Washington. p. 23-37.
40. U.S.EIA, Country Analysis Brief: India. 2013, U.S. Energy Information
Administration: Washington.
41. U.S.EIA, Country Analysis Brief: China. 2014, U.S. Eenergy Information
Administration.
42. Agrawal, P., India's Petroleum Demand: Empirical Estimations and Projections
for the Future 2012, Institute of Economic Growth. p. 1-26.
43. Ashraful, A.M., et al., Production and comparison of fuel properties, engine
performance, and emission characteristics of biodiesel from various non-edible
vegetable oils: A review. Energy Conversion and Management, 2014. 80(0): p.
202-228.
44. Rutledge, D., Estimating long-term world coal production with logit and probit
transforms. International Journal of Coal Geology, 2011. 85(1): p. 23-33.
45. Kreft, E. Supreme Court Upholds EPA Ruling That Will Likely Shut Down
Critical Coal Plants. 2014; Available from:
http://www.theblaze.com/stories/2014/04/29/supreme-court-upholds-epa-ruling-
that-will-likely-shut-down-critical-coal-plants/.
46. Tandjaoui, M.N., et al., The Impact of Wind Power Implantation in Transmission
Systems. Energy Procedia, 2013. 36(0): p. 260-267.
47. Denny, E., The economics of tidal energy. Energy Policy, 2009. 37(5): p. 1914-
1924.
48. Li, Y., B.J. Lence, and S.M. Calisal, An integrated model for estimating energy
cost of a tidal current turbine farm. Energy Conversion and Management, 2011.
52(3): p. 1677-1687.
49. Ramos, V., et al., Tidal stream energy impacts on estuarine circulation. Energy
Conversion and Management, 2014. 80(0): p. 137-149.
50. European Parliament, C.o.t.E.U., The promotion of the use of energy from
renewable sources and amending and subsequently repealing Directives
2001/77/EC and 2003/30/EC (Text with EEA relevance) 2009.
51. Berndes, G., M. Hoogwijk, and R. van den Broek, The contribution of biomass in
the future global energy supply: a review of 17 studies. Biomass and Bioenergy,
2003. 25(1): p. 1-28.
52. Agency, E.E., Renewable Energy Road Map:Renewable energies in the 21st
century: building a more sustainable future 2007: Brusselss. p. 1-60.
53. Demirbaş, A., Biomass resource facilities and biomass conversion processing for
fuels and chemicals. Energy Conversion and Management, 2001. 42(11): p. 1357-
1378.
54. Long, H., et al., Biomass resources and their bioenergy potential estimation: A
review. Renewable and Sustainable Energy Reviews, 2013. 26(0): p. 344-352.
55. McKendry, P., Energy production from biomass (part 1): overview of biomass.
Bioresource Technology, 2002. 83(1): p. 37-46.

Hydrogen production by steam reforming of biodiesel
224
56. Clifton-brown, J.C., P.F. Stampfl, and M.B. Jones, Miscanthus biomass
production for energy in Europe and its potential contribution to decreasing fossil
fuel carbon emissions. Global Change Biology, 2004. 10(4): p. 509-518.
57. Demba Diop, et al., Assessing the impact of biofuels production on developing
countries from the point of view of Policy Coherence for Development. 2013, The
European Union’s Framework Contract Commission 2011. p. 168.
58. Biradar, C.H., K.A. Subramanian, and M.G. Dastidar, Production and fuel quality
upgradation of pyrolytic bio-oil from Jatropha Curcas de-oiled seed cake. Fuel,
2014. 119(0): p. 81-89.
59. Shadangi, K.P. and R.K. Singh, Thermolysis of polanga seed cake to bio-oil using
semi batch reactor. Fuel, 2012. 97(0): p. 450-456.
60. Jang, Y.-S., et al., Butanol production from renewable biomass by clostridia.
Bioresource Technology, 2012. 123(0): p. 653-663.
61. Czernik, S. and A.V. Bridgwater, Overview of Applications of Biomass Fast
Pyrolysis Oil. Energy & Fuels, 2004. 18(2): p. 590-598.
62. IRENA, Renewable Power Generation Costs. 2012, International Renewable
Energy Agency.
63. Silitonga, A.S., et al., A review on prospect of Jatropha curcas for biodiesel in
Indonesia. Renewable and Sustainable Energy Reviews, 2011. 15(8): p. 3733-
3756.
64. Tolbert, V.R. and L.L. Wright, Environmental enhancement of U.S. biomass crop
technologies: research results to date. Biomass and Bioenergy, 1998. 15(1): p.
93-100.
65. Lemus, R., et al., Biomass yield and quality of 20 switchgrass populations in
southern Iowa, USA. Biomass and Bioenergy, 2002. 23(6): p. 433-442.
66. Staubmann, R., et al., Biogas production fromJatropha curcas press-cake.
Applied Biochemistry and Biotechnology, 1997. 63-65(1): p. 457-467.
67. Huerga, I.R., et al., Biodiesel production from Jatropha curcas: Integrated
process optimization. Energy Conversion and Management, 2014. 80(0): p. 1-9.
68. Pandey, V.L. and A. Chaubal, Comprehending household cooking energy choice
in rural India. Biomass and Bioenergy, 2011. 35(11): p. 4724-4731.
69. Romijn, H., R. Raven, and I. de Visser, Biomass energy experiments in rural
India: Insights from learning-based development approaches and lessons for
Strategic Niche Management. Environmental Science & Policy, 2010. 13(4): p.
326-338.
70. Niu, H., et al., Rural household energy consumption and its implications for eco-
environments in NW China: A case study. Renewable Energy, 2014. 65(0): p.
137-145.
71. Larminie, J. and A. Dicks, Fuel Cell Systems Explained (2nd Edition), John Wiley
& Sons.
72. Services, E.G.T., Fuel cells Handbook. 2004, EG&G Technical Services:
Morgantown, West Virginia. p. 427.
73. James Larmine, A.d., Fuel cell systems explained. Wiley, 2001: p. 1-35.
74. Singhal, S.a.K.K., High temperature solid oxide fuel cells: Fundamentals design
and applications. Elsevier advanced technology, 2003: p. 405.

Hydrogen production by steam reforming of biodiesel
225
75. Wang, Y., et al., A review of polymer electrolyte membrane fuel cells:
Technology, applications, and needs on fundamental research. Applied Energy,
2011. 88(4): p. 981-1007.
76. Kirubakaran, A., S. Jain, and R.K. Nema, A review on fuel cell technologies and
power electronic interface. Renewable and Sustainable Energy Reviews, 2009.
13(9): p. 2430-2440.
77. Kandepu, R., et al., Modeling and control of a SOFC-GT-based autonomous
power system. Energy, 2007. 32(4): p. 406-417.
78. Pérez, L.C., et al., Effect of fuel utilization on the carbon monoxide poisoning
dynamics of Polymer Electrolyte Membrane Fuel Cells. Journal of Power
Sources, 2014. 258(0): p. 122-128.
79. Singhal, S.C. and K. Kendall, Introduction to SOFCs, in High Temperature and
Solid Oxide Fuel Cells, C.S. Subhash and K. Kevin, Editors. 2003, Elsevier
Science: Amsterdam. p. 1-22.
80. Karatzas, X., et al., Autothermal reforming of low-sulfur diesel over bimetallic
RhPt supported on Al2O3, CeO2–ZrO2, SiO2 and TiO2. Applied Catalysis B:
Environmental, 2011. 106(3–4): p. 476-487.
81. Gould, B.D., A.R. Tadd, and J.W. Schwank, Nickel-catalyzed autothermal
reforming of jet fuel surrogates: n-Dodecane, tetralin, and their mixture. Journal
of Power Sources, 2007. 164(1): p. 344-350.
82. USDOE, Fuel cell hand book. 7 ed. 2004, West Virginia, United States: EG&G
Technical Services, Inc. 1-427.
83. Nahar, G., Biodiesel Formulations as Fuels for Micro-tubular Solid Oxide Fuel
Cells., in Chemical Engineering. 2007, University of Birmingham: Birmingahm.
p. 112.
84. Mizutani, Y., et al., From rare earth doped zirconia to 1 kW solid oxide fuel cell
system. Journal of Alloys and Compounds, 2006. 408-412: p. 518-524.
85. Edwards, P.P., et al., Hydrogen and fuel cells: Towards a sustainable energy
future. Energy Policy, 2008. 36(12): p. 4356-4362.
86. Clark, W.W., et al., Hydrogen energy stations: along the roadside to the hydrogen
economy. Utilities Policy, 2005. 13(1): p. 41-50.
87. Knight, E., Optimisation of unmixed steam reforming, in Energy research
Institute. 2009, University of Leeds: Leeds. p. 217.
88. Wang, Y.D., et al., An experimental investigation of the performance and gaseous
exhaust emissions of a diesel engine using blends of a vegetable oil. Applied
Thermal Engineering, 2006. 26(14–15): p. 1684-1691.
89. Knothe, G., Historical Perspectives on Vegetable Oil-Based Diesel Fuels Inform,
2001. 12: p. 1103-1107.
90. Reddy, B. and A. Khan, Nanosized CeO2–SiO2, CeO2–TiO2, and CeO2–ZrO2
Mixed Oxides: Influence of Supporting Oxide on Thermal Stability and Oxygen
Storage Properties of Ceria. Catalysis Surveys from Asia, 2005. 9(3): p. 155-171.
91. Jones, S. and C.L. Peterson, Using Unmodified Vegetable Oils as a Diesel Fuel
Extender, in Bioenergy 2002: Boise, Idaho, USA.
92. Demirbaş, A., Fuel properties and calculation of higher heating values of
vegetable oils. Fuel, 1998. 77(9–10): p. 1117-1120.

Hydrogen production by steam reforming of biodiesel
226
93. Hazar, H. and H. Aydin, Performance and emission evaluation of a CI engine
fueled with preheated raw rapeseed oil (RRO)–diesel blends. Applied Energy,
2010. 87(3): p. 786-790.
94. Prasad, L. and A. Agrawal, Experimental Investigation of Performance of Diesel
Engine Working On Diesel and Neem Oil Blends. Journal of Mechanical and Civil
Engineering (2012. 1(4): p. 48-51.
95. Agarwal, A.K., Biofuels (alcohols and biodiesel) applications as fuels for internal
combustion engines. Progress in Energy and Combustion Science, 2007. 33(3): p.
233-271.
96. manufacturers, E. and association, Use of Raw Vegetable Oil or Animal Fats in
Diesel Engines 2006: Chicago, Illinois ,USA.
97. Harwood, H., Oleochemicals as a fuel: Mechanical and economic feasibility.
Journal of the American Oil Chemists’ Society, 1984. 61(2): p. 315-324.
98. Agarwal, A.K. and L.M. Das, Biodiesel Development and Characterization for
Use as a Fuel in Compression Ignition Engines. Journal of Engineering for Gas
Turbines and Power, 2000. 123(2): p. 440-447.
99. Nwafor, O.M.I., Emission characteristics of diesel engine running on vegetable
oil with elevated fuel inlet temperature. Biomass and Bioenergy, 2004. 27(5): p.
507-511.
100. Nwafor, O.M.I. and G. Rice, Performance of rapeseed oil blends in a diesel
engine. Applied Energy, 1996. 54(4): p. 345-354.
101. Sisarwal, V. and A.C. Tiwari, Experimental Investigation of Effect of Straight
Vegetable Oil Fuel on Engine Performance Parameters International Journal of
Engineering Research and Applications, 2013. 3(1): p. 12091-2094.
102. Samuel T. Jones, C.L.P., Joseph C. Thompson. Used Vegetable Oil Fuel Blend
Comparisons Using Injector Coking in a DI Diesel Engine. . in ASAE Meeting
Paper 2001. Sacramento, California, USA ASAE.
103. Saravanan, N., G. Nagarajan, and S. Puhan, Experimental investigation on a DI
diesel engine fuelled with Madhuca Indica ester and diesel blend. Biomass and
Bioenergy, 2010. 34(6): p. 838-843.
104. Atabani, A.E., et al., Non-edible vegetable oils: A critical evaluation of oil
extraction, fatty acid compositions, biodiesel production, characteristics, engine
performance and emissions production. Renewable and Sustainable Energy
Reviews, 2013. 18(0): p. 211-245.
105. Kumar, N., Varun, and S.R. Chauhan, Performance and emission characteristics
of biodiesel from different origins: A review. Renewable and Sustainable Energy
Reviews, 2013. 21(0): p. 633-658.
106. Agarwal, A.K. and A. Dhar, Experimental investigations of performance,
emission and combustion characteristics of Karanja oil blends fuelled DICI
engine. Renewable Energy, 2013. 52(0): p. 283-291.
107. Agarwal, A.K. and K. Rajamanoharan, Experimental investigations of
performance and emissions of Karanja oil and its blends in a single cylinder
agricultural diesel engine. Applied Energy, 2009. 86(1): p. 106-112.
108. Agarwal, D. and A.K. Agarwal, Performance and emissions characteristics of
Jatropha oil (preheated and blends) in a direct injection compression ignition
engine. Applied Thermal Engineering, 2007. 27(13): p. 2314-2323.

Hydrogen production by steam reforming of biodiesel
227
109. Sahoo, P.K., et al., Biodiesel development from high acid value polanga seed oil
and performance evaluation in a CI engine. Fuel, 2007. 86(3): p. 448-454.
110. Chavanne, C.G., Procedures for the transformation of vegetable oils for their use
as fuel. 1937: Belgium.
111. Mittelbach, M. and C. Remschmidt, Biodiesel: The Comprehensive Handbook.
2004.
112. Amezaga, J.M., Boyes, S.L. and Harrison, J.A. , Biofuels Policy in the European
Union in 7th International Biofuels Conference. 2010, Indian Oil Corporation
Ltd. and International Union for Conservation of Nature New Delhi. p. 1-10.
113. board, E.b. European biodiesel board. 2014; Available from: www.ebb-
eu.org/stats.php.
114. Sun, J., J.A. Caton, and T.J. Jacobs, Oxides of nitrogen emissions from biodiesel-
fuelled diesel engines. Progress in Energy and Combustion Science, 2010. 36(6):
p. 677-695.
115. Lapuerta, M., O. Armas, and J. Rodríguez-Fernández, Effect of biodiesel fuels on
diesel engine emissions. Progress in Energy and Combustion Science, 2008.
34(2): p. 198-223.
116. Murugesan, A., et al., Bio-diesel as an alternative fuel for diesel engines—A
review. Renewable and Sustainable Energy Reviews, 2009. 13(3): p. 653-662.
117. Basha, S.A., K.R. Gopal, and S. Jebaraj, A review on biodiesel production,
combustion, emissions and performance. Renewable and Sustainable Energy
Reviews, 2009. 13(6–7): p. 1628-1634.
118. Demirbas, A., Relationships derived from physical properties of vegetable oil and
biodiesel fuels. Fuel, 2008. 87(8–9): p. 1743-1748.
119. Balat, M. and H. Balat, A critical review of bio-diesel as a vehicular fuel. Energy
Conversion and Management, 2008. 49(10): p. 2727-2741.
120. Dhar, A. and A.K. Agarwal, Performance, emissions and combustion
characteristics of Karanja biodiesel in a transportation engine. Fuel, 2014.
119(0): p. 70-80.
121. Dhar, A., R. Kevin, and A.K. Agarwal, Production of biodiesel from high-FFA
neem oil and its performance, emission and combustion characterization in a
single cylinder DICI engine. Fuel Processing Technology, 2012. 97(0): p. 118-
129.
122. Jindal, S., et al., Experimental investigation of the effect of compression ratio and
injection pressure in a direct injection diesel engine running on Jatropha methyl
ester. Applied Thermal Engineering, 2010. 30(5): p. 442-448.
123. Kalligeros, S., et al., An investigation of using biodiesel/marine diesel blends on
the performance of a stationary diesel engine. Biomass and Bioenergy, 2003.
24(2): p. 141-149.
124. Misra, R.D. and M.S. Murthy. Comparative performance evaluation of karanja
vegetable oil and karanja biodiesel blends with diesel in C.I. engine. in Clean
Energy and Technology (CET), 2011 IEEE First Conference on. 2011.
125. Shi, X., et al., Emission characteristics using methyl soyate–ethanol–diesel fuel
blends on a diesel engine. Fuel, 2005. 84(12–13): p. 1543-1549.

Hydrogen production by steam reforming of biodiesel
228
126. Lapuerta, M., J. Rodríguez-Fernández, and J.R. Agudelo, Diesel particulate
emissions from used cooking oil biodiesel. Bioresource Technology, 2008. 99(4):
p. 731-740.
127. Agarwal, A.K., T. Gupta, and A. Kothari, Particulate emissions from biodiesel vs
diesel fuelled compression ignition engine. Renewable and Sustainable Energy
Reviews, 2011. 15(6): p. 3278-3300.
128. Pinzi, S., et al., The Ideal Vegetable Oil-based Biodiesel Composition: A Review
of Social, Economical and Technical Implications. Energy & Fuels, 2009. 23(5):
p. 2325-2341.
129. Knothe, G., A.C. Matheaus, and T.W. Ryan Iii, Cetane numbers of branched and
straight-chain fatty esters determined in an ignition quality tester☆. Fuel, 2003.
82(8): p. 971-975.
130. Knothe, G., C.A. Sharp, and T.W. Ryan, Exhaust Emissions of Biodiesel,
Petrodiesel, Neat Methyl Esters, and Alkanes in a New Technology Engine†.
Energy & Fuels, 2005. 20(1): p. 403-408.
131. Sarathy, S.M., et al., A comparison of saturated and unsaturated C4 fatty acid
methyl esters in an opposed flow diffusion flame and a jet stirred reactor.
Proceedings of the Combustion Institute, 2007. 31(1): p. 1015-1022.
132. Marquevich, M., F. Medina, and D. Montané, Hydrogen production via steam
reforming of sunflower oil over Ni/Al catalysts from hydrotalcite materials.
Catalysis Communications, 2001. 2(3–4): p. 119-124.
133. Mittelbach, M. and H. Enzelsberger, Transesterification of heated rapeseed oil for
extending diesel fuel. Journal of the American Oil Chemists' Society, 1999. 76(5):
p. 545-550.
134. Lin, J., C.W. Babbitt, and T.A. Trabold, Life cycle assessment integrated with
thermodynamic analysis of bio-fuel options for solid oxide fuel cells. Bioresource
Technology, 2013. 128(0): p. 495-504.
135. Xuan, J., et al., A review of biomass-derived fuel processors for fuel cell systems.
Renewable and Sustainable Energy Reviews, 2009. 13(6–7): p. 1301-1313.
136. Kraaij, G.J., et al., Biodiesel fuel processor for APU applications. International
Journal of Hydrogen Energy, 2009. 34(10): p. 4495-4499.
137. Martin, S. and A. Wörner, On-board reforming of biodiesel and bioethanol for
high temperature PEM fuel cells: Comparison of autothermal reforming and
steam reforming. Journal of Power Sources, 2011. 196(6): p. 3163-3171.
138. Nahar, G.A., Hydrogen rich gas production by the autothermal reforming of
biodiesel (FAME) for utilization in the solid-oxide fuel cells: A thermodynamic
analysis. International Journal of Hydrogen Energy, 2010. 35(17): p. 8891-8911.
139. Lin, J., et al., Bio-fuel reforming for solid oxide fuel cell applications. Part 2:
Biodiesel. International Journal of Hydrogen Energy, 2014. 39(1): p. 183-195.
140. Shiratori, Y., et al., Paper-structured catalyst for the steam reforming of biodiesel
fuel. International Journal of Hydrogen Energy, 2013. 38(26): p. 11278-11287.
141. Nahar, G. and K. Kendall, Biodiesel formulations as fuel for internally reforming
solid oxide fuel cell. Fuel Processing Technology, 2011. 92(7): p. 1345-1354.
142. Quang-Tuyen, T., Y. Shiratori, and K. Sasaki, Feasibility of palm-biodiesel fuel
for a direct internal reforming solid oxide fuel cell. International Journal of
Energy Research, 2013. 37(6): p. 609-616.

Hydrogen production by steam reforming of biodiesel
229
143. Zhou, Z.F., et al., Direct oxidation of waste vegetable oil in solid-oxide fuel cells.
Journal of Power Sources, 2007. 171(2): p. 856-860.
144. N. Abatzoglou, C. Fauteux-Lefebvre, and N. Braidy, Biodiesel reforming with a
NiAl2O4/Al2O3-YSZ catalyst for the production of renewable SOFC fuel. WIT
Transactions on Ecology and the Environment, 2011. 143: p. 145-154.
145. Sgroi, M., et al., BIOFEAT: Biodiesel fuel processor for a vehicle fuel cell
auxiliary power unit: Study of the feed system. Journal of Power Sources, 2005.
149(0): p. 8-14.
146. Specchia, S., et al., Conceptual design and selection of a biodiesel fuel processor
for a vehicle fuel cell auxiliary power unit. Journal of Power Sources, 2005.
145(2): p. 683-690.
147. Swami, S.M. and M.A. Abraham, Integrated Catalytic Process for Conversion of
Biomass to Hydrogen. Energy & Fuels, 2006. 20(6): p. 2616-2622.
148. Ospinal-Jimenez, M., Hydrogen production study usingautothermal reforming of
biodiesel and other hydrocarbons for fuel cell applications, in Chemical
Engineering. 2006, Uiversity of Puerto Rico. p. 126.
149. Colucci, J.A., Hydrogen Production Using Autothermal Reforming of Biodiesel
and Other Hydrocarbons for Fuel Cell Applications. ASME Conference
Proceedings, 2006. 2006(47454): p. 483-484.
150. Siefert, N.S., et al., Operation of a solid oxide fuel cell on a reformed FAME
mixture. Biomass and Bioenergy, 2012. 47(0): p. 362-371.
151. Pena, M.A., J.P. Gómez, and J.L.G. Fierro, New catalytic routes for syngas and
hydrogen production. Applied Catalysis A: General, 1996. 144(1-2): p. 7-57.
152. Leite, L., E. Benazzi, and N. Marchal-George, Hydrocracking of phenanthrene
over bifunctional Pt catalysts. Catalysis Today, 2001. 65(2-4): p. 241-247.
153. Roussel, M., et al., Mechanisms of n-decane hydrocracking on a sulfided NiW
on silica-alumina catalyst. Journal of Catalysis, 2003. 218(2): p. 427-437.
154. Guo, X.-j., et al., Preparation of CuO/ZnO/Al2O3 catalysts for methanol synthesis
using parallel-slurry-mixing method. Journal of Fuel Chemistry and Technology,
2007. 35(3): p. 329-333.
155. Kojima, R., et al., Cesium-promoted rhenium catalysts supported on alumina for
ammonia synthesis. Applied Catalysis A: General, 2003. 246(2): p. 311-322.
156. Liu, Y., et al., Fischer-Tropsch synthesis in slurry-phase reactors over Mn- and
Zr-modified Co/SiO2 catalysts. Fuel Processing Technology. 90(7-8): p. 901-908.
157. Ahmed, S. and M. Krumpelt, Hydrogen from hydrocarbon fuels for fuel cells.
International Journal of Hydrogen Energy, 2001. 26(4): p. 291-301.
158. Harrison, D.P., Sorption-Enhanced Hydrogen Production: A Review. Industrial &
Engineering Chemistry Research, 2008. 47(17): p. 6486-6501.
159. Hot spot elimination in partial oxidation of hydrocarbons. Focus on Catalysts,
2007. 2007(10): p. 7-7.
160. De Groote, A.M. and G.F. Froment, The role of coke formation in catalytic
partial oxidation for synthesis gas production. Catalysis Today, 1997. 37(3): p.
309-329.
161. Huang, T.-j. and S.-W. Wang, Hydrogen production via partial oxidation of
methanol over copper-zinc catalysts. Applied Catalysis, 1986. 24(1-2): p. 287-
297.

Hydrogen production by steam reforming of biodiesel
230
162. Ersoz, A., et al., Autothermal reforming as a hydrocarbon fuel processing option
for PEM fuel cell. Journal of Power Sources, 2003. 118(1-2): p. 384-392.
163. Ersoz, A., H. Olgun, and S. Ozdogan, Reforming options for hydrogen production
from fossil fuels for PEM fuel cells. Journal of Power Sources, 2006. 154(1): p.
67-73.
164. Freni, S., G. Calogero, and S. Cavallaro, Hydrogen production from methane
through catalytic partial oxidation reactions. Journal of Power Sources, 2000.
87(1-2): p. 28-38.
165. Cheekatamarla, P.K. and A.M. Lane, Catalytic autothermal reforming of diesel
fuel for hydrogen generation in fuel cells: I. Activity tests and sulfur poisoning.
Journal of Power Sources, 2005. 152: p. 256-263.
166. Kang, I. and J. Bae, Autothermal reforming study of diesel for fuel cell
application. Journal of Power Sources, 2006. 159(2): p. 1283-1290.
167. Joensen, F. and J.R. Rostrup-Nielsen, Conversion of hydrocarbons and alcohols
for fuel cells. Journal of Power Sources, 2002. 105(2): p. 195-201.
168. Faungnawakij, K., R. Kikuchi, and K. Eguchi, Thermodynamic analysis of carbon
formation boundary and reforming performance for steam reforming of dimethyl
ether. Journal of Power Sources, 2007. 164(1): p. 73-79.
169. Faungnawakij, K., et al., Influence of solid–acid catalysts on steam reforming and
hydrolysis of dimethyl ether for hydrogen production. Applied Catalysis A:
General, 2006. 304(0): p. 40-48.
170. Zhang, B., et al., Hydrogen production by steam reforming of ethanol over an
Ir/CeO2 catalyst: Reaction mechanism and stability of the catalyst. International
Journal of Hydrogen Energy, 2008. 33(16): p. 4377-4386.
171. Zhang, B., et al., Hydrogen production from steam reforming of ethanol and
glycerol over ceria-supported metal catalysts. International Journal of Hydrogen
Energy, 2007. 32(13): p. 2367-2373.
172. Marquevich, M., R. Coll, and D. Montané, Steam Reforming of Sunflower Oil for
Hydrogen Production. Industrial & Engineering Chemistry Research, 2000.
39(7): p. 2140-2147.
173. Marquevich, M., et al., Hydrogen Production by Steam Reforming of Vegetable
Oils Using Nickel-Based Catalysts. Industrial & Engineering Chemistry Research,
2001. 40(22): p. 4757-4766.
174. Pimenidou, P., et al., Chemical looping reforming of waste cooking oil in packed
bed reactor. Bioresource Technology, 2010. 101(16): p. 6389-6397.
175. Kumar, R.V., R.K. Lyon, and J.A. Cole, Unmixed Reforming: A Novel
Autothermal Cyclic Steam Reforming Process
Advances in Hydrogen Energy, C.E. Grégoire Padró and F. Lau, Editors. 2002, Springer
US. p. 31-45.
176. Holladay, J.D., et al., An overview of hydrogen production technologies. Catalysis
Today, 2009. 139(4): p. 244-260.
177. Faur Ghenciu, A., Review of fuel processing catalysts for hydrogen production in
PEM fuel cell systems. Current Opinion in Solid State and Materials Science,
2002. 6(5): p. 389-399.
Hydrogen production by steam reforming of biodiesel
231
178. Giannakeas, N., Development of Oxygen Transfer Materials for Chemical
Looping Reforming Processes, in Energy Resources Institute. 2012, The
University of Leeds: Leeds. p. 250.
179. Marquevich, M., R. Coll, and D. Montane, Steam Reforming of Sunflower Oil for
Hydrogen Production. . Industrial & Engineering Chemistry Research, 2000.
39(7): p. 2632-2632.
180. French, R.J. and S. Czernik, Hydrogen production by steam reforming of waste
vegetable oils. Prepr. Pap.-Am. Chem. Soc., Div. Fuel Chem, 2003. 48(2): p. 592.
181. Pimenidou, P., et al., High purity H2 by sorption-enhanced chemical looping
reforming of waste cooking oil in a packed bed reactor. Bioresource Technology,
2010. 101(23): p. 9279-9286.
182. Alberton, A.L., M.M.V.M. Souza, and M. Schmal, Carbon formation and its
influence on ethanol steam reforming over Ni/Al2O3 catalysts. Catalysis Today,
2007. 123(1-4): p. 257-264.
183. Chen, H., et al., A comparative study on hydrogen production from steam-glycerol
reforming: thermodynamics and experimental. Renewable Energy, 2011. 36(2): p.
779-788.
184. Dou, B., et al., Hydrogen production by sorption-enhanced steam reforming of
glycerol. Bioresource Technology, 2009. 100(14): p. 3540-3547.
185. Dou, B., et al., Steam reforming of crude glycerol with in situ CO2 sorption.
Bioresource Technology, 2010. 101(7): p. 2436-2442.
186. He, L., et al., Towards efficient hydrogen production from glycerol by sorption
enhanced steam reforming. Energy & Environmental Science, 2010. 3(8): p.
1046-1056.
187. Hu, X. and G. Lu, Comparative study of alumina-supported transition metal
catalysts for hydrogen generation by steam reforming of acetic acid. Applied
Catalysis B: Environmental, 2010. 99(1-2): p. 289-297.
188. Trovarelli, A., et al., The utilization of ceria in industrial catalysis. Catalysis
Today, 1999. 50(2): p. 353-367.
189. Lahaye, J., et al., Influence of cerium oxide on the formation and oxidation of
soot. Combustion and Flame, 1996. 104(1–2): p. 199-207.
190. Matatov-Meytal, Y.I. and M. Sheintuch, Catalytic Abatement of Water Pollutants.
Industrial & Engineering Chemistry Research, 1998. 37(2): p. 309-326.
191. Murray, E.P., T. Tsai, and S.A. Barnett, A direct-methane fuel cell with a ceria-
based anode. Nature, 1999. 400(6745): p. 649-651.
192. Scott L. Swartz, D., et al., Fuel processing catalysts based on nanoscale ceria.
Fuel Cells Bulletin, 2001. 4(30): p. 7-10.
193. Zhou, G. and R.J. Gorte, Thermodynamic Investigation of the Redox Properties
for Ceria−Hafnia, Ceria−Terbia, and
Ceria−Praseodymia Solid Solutions. The Journal of Physical Chemistry
B, 2008. 112(32): p. 9869-9875.
194. Bernardo, C.A., I. Alstrup, and J.R. Rostrup-Nielsen, Carbon deposition and
methane steam reforming on silica- Journal of
Catalysis, 1985. 96(2): p. 517-534.

Hydrogen production by steam reforming of biodiesel
232
195. Thormann, J., et al., Steam reforming of hexadecane over a Rh/CeO2 catalyst in
microchannels: Experimental and numerical investigation. International Journal
of Hydrogen Energy, 2009. 34(12): p. 5108-5120.
196. Sato, K., et al., Oxidative reforming of n-C4H10 triggered at ambient temperature
over reduced Ni/CeO2. Catalysis Communications, 2009. 10(11): p. 1478-1481.
197. Swartz, S.L., et al., Hydrogen production from E85 fuel with ceria-based
catalysts. Journal of Power Sources, 2009. 188(2): p. 515-520.
198. Laosiripojana, N., et al., Role and advantages of H2S in catalytic steam reforming
over nanoscale CeO2-based catalysts. Journal of Catalysis, 2010. 276(1): p. 6-15.
199. Laosiripojana, N. and S. Assabumrungrat, Hydrogen production from steam and
autothermal reforming of LPG over high surface area ceria. Journal of Power
Sources, 2006. 158(2): p. 1348-1357.
200. Laosiripojana, N. and S. Assabumrungrat, Catalytic dry reforming of methane
over high surface area ceria. Applied Catalysis B: Environmental, 2005. 60(1-2):
p. 107-116.
201. Udani, P.P.C., et al., Steam reforming and oxidative steam reforming of methanol
over CuO-CeO2 catalysts. International Journal of Hydrogen Energy, 2009.
34(18): p. 7648-7655.
202. Zhang, B., et al., Steam reforming of bio-ethanol for the production of hydrogen
over ceria-supported Co, Ir and Ni catalysts. Catalysis Communications, 2006.
7(6): p. 367-372.
203. Mizuno, T., et al., Effect of support on catalytic properties of Rh catalysts for
steam reforming of 2-propanol. International Journal of Hydrogen Energy, 2003.
28(12): p. 1393-1399.
204. Kašpar, J., P. Fornasiero, and N. Hickey, Automotive catalytic converters: current
status and some perspectives. Catalysis Today, 2003. 77(4): p. 419-449.
205. Laosiripojana, N. and S. Assabumrungrat, Methane steam reforming over Ni/Ce-
ZrO2 catalyst: Influences of Ce-ZrO2 support on reactivity, resistance toward
carbon formation, and intrinsic reaction kinetics. Applied Catalysis A: General,
2005. 290(1-2): p. 200-211.
206. Laosiripojana, N., D. Chadwick, and S. Assabumrungrat, Effect of high surface
area CeO2 and Ce-ZrO2 supports over Ni catalyst on CH4 reforming with H2O
in the presence of O2, H2, and CO2. Chemical Engineering Journal, 2008. 138(1-
3): p. 264-273.
207. Aneggi, E., et al., Insights into the redox properties of ceria-based oxides and
their implications in catalysis. Journal of Alloys and Compounds, 2006. 408-412:
p. 1096-1102.
208. Liang, Q., et al., Role of Surface Area in Oxygen Storage Capacity of Ceria–
Zirconia as Soot Combustion Catalyst. Catalysis Letters, 2007. 119(3-4): p. 265-
270.
209. Mamontov, E. and T. Egami, Structural defects in a nano-scale powder of CeO2
studied by pulsed neutron diffraction. Journal of Physics and Chemistry of Solids,
2000. 61(8): p. 1345-1356.
210. Bernal, S., et al., Some recent results on metal/support interaction effects in
NM/CeO2 (NM: noble metal) catalysts. Catalysis Today, 1999. 50(2): p. 175-206.

Hydrogen production by steam reforming of biodiesel
233
211. Nagai, Y., et al., X-ray absorption fine structure analysis of local structure of
CeO2–ZrO2 mixed oxides with the same composition ratio (Ce/Zr=1). Catalysis
Today, 2002. 74(3–4): p. 225-234.
212. Roh, H.-S., et al., Highly active and stable Ni/Ce–ZrO2 catalyst for H2
production from methane. Journal of Molecular Catalysis A: Chemical, 2002.
181(1–2): p. 137-142.
213. Lemaux, S., et al., Understanding of Enhanced Oxygen Storage Capacity in
Ce0.5Zr0.5O2: The Presence of an Anharmonic Pair Distribution
Function in the Zr−O2 Subshell as Analyzed by XAFS Spectroscopy. The
Journal of Physical Chemistry B, 2001. 105(21): p. 4810-4815.
214. Fornasiero, P., et al., Relationships between Structural/Textural Properties and
Redox Behavior in Ce0.6Zr0.4O2 Mixed Oxides. Journal of Catalysis, 1999.
187(1): p. 177-185.
215. Vlaic, G., et al., Relationship between the Zirconia-Promoted Reduction in the
Rh-Loaded Ce0.5Zr0.5O2Mixed Oxide and the Zr-O Local Structure. Journal of
Catalysis, 1997. 168(2): p. 386-392.
216. Dong, W.-S., et al., Methane reforming over Ni/Ce-ZrO2 catalysts: effect of
nickel content. Applied Catalysis A: General, 2002. 226(1–2): p. 63-72.
217. Roh, H.-S., et al., Highly stable Ni catalyst supported on Ce–ZrO2 for oxy-steam
reforming of methane. Catalysis Letters, 2001. 74(1): p. 31-36.
218. Fan, J., et al., Influence of the oxidative/reductive treatments on the activity of
Pt/Ce0.67Zr0.33O2 catalyst. Applied Surface Science, 2005. 245(1–4): p. 162-
171.
219. Wu, X., et al., Effect of preparation methods on the structure and redox behavior
of platinum–ceria–zirconia catalysts. Chemical Engineering Journal, 2005.
109(1–3): p. 133-139.
220. Fornasiero, P., et al., Modification of the Redox Behaviour of CeO2Induced by
Structural Doping with ZrO2. Journal of Catalysis, 1996. 164(1): p. 173-183.
221. Trovarelli, A., et al., Nanophase Fluorite-Structured CeO2-ZrO2Catalysts
Prepared by High-Energy Mechanical Milling. Journal of Catalysis, 1997. 169(2):
p. 490-502.
222. Trimm, D.L., Catalysts for the control of coking during steam reforming.
Catalysis Today, 1999. 49(1-3): p. 3-10.
223. Trimm, D.L., Coke formation and minimisation during steam reforming
reactions. Catalysis Today, 1997. 37(3): p. 233-238.
224. Mariño, F., et al., Cu-Ni-K/γ-Al2O3 supported catalysts for ethanol steam
reforming: Formation of hydrotalcite-type compounds as a result of metal–
support interaction. Applied Catalysis A: General, 2003. 238(1): p. 41-54.
225. Zhang, Y., et al., Potassium catalytic hydrogen production in sorption enhanced
gasification of biomass with steam. International Journal of Hydrogen Energy,
2014. 39(9): p. 4234-4243.
226. Alstrup, I., et al., Promotion of steam reforming catalysts, in Studies in Surface
Science and Catalysis, D.S.F.F.A.V. A. Parmaliana and A. F, Editors. 1998,
Elsevier. p. 5-14.
227. Pengpanich, S., et al., iso-Octane partial oxidation over Ni-Sn/Ce0.75Zr0.25O2
catalysts. Catalysis Today, 2008. 136(3–4): p. 214-221.
Hydrogen production by steam reforming of biodiesel
234
228. Espinal, R., et al., Cobalt hydrotalcites as catalysts for bioethanol steam
reforming. The promoting effect of potassium on catalyst activity and long-term
stability. Applied Catalysis B: Environmental, 2012. 127(0): p. 59-67.
229. Iwasa, N., T. Yamane, and M. Arai, Influence of alkali metal modification and
reaction conditions on the catalytic activity and stability of Ni containing
smectite-type material for steam reforming of acetic acid. International Journal of
Hydrogen Energy, 2011. 36(10): p. 5904-5911.
230. Yu, X., et al., Hydrogen production from steam reforming of kerosene over Ni–La
and Ni–La–K/cordierite catalysts. Fuel, 2006. 85(12–13): p. 1708-1713.
231. Jain, S., M.P. Sharma, and S. Rajvanshi, Acid base catalyzed transesterification
kinetics of waste cooking oil. Fuel Processing Technology, 2011. 92(1): p. 32-38.
232. Bloom, R., The autothermal reforming of biodiesel, in School of Process,
Environmental and Material Engineering. 2013, University of Leeds: Leeds. p.
65.
233. Sing, K.S.W., Reporting physisorption for gas solid systems. 1982, International
union of pure and applied chemistry: Uxbridge. p. 2202-2218.
234. Lynch, j., Physico-chemical analysis of industrail catlysts:A practical guide to
chracterisation. 2003, Paris: Institut Francais DU Petrole. 305.
235. Anderson, J.R. and K.C. Pratt., Introduction to characterization and testing of
catalysts 1985, Sydney: Orlando Academic Press
236. Quantachrome, Physisorption methods and techniques. 2005, Ountachrome
instruments
237. Quantachrome, An Introduction to calculation methods for surface area and pore
size from gas sorption data. 2005, Ountachrome instruments
238. Naumov, S., Hysteresis Phenomena in Mesoporous Materials, in Physics and
earth sciences. 2009, Universit¨at Leipzig: Leipzig. p. 95.
239. California, U.o. UCSB X-ray Basics. 2014; Available from:
http://www.mrl.ucsb.edu/centralfacilities/x-ray/basics.
240. McCusker, L.B., et al., Rietveld refinement guidelines. Journal of Applied
Crystallography, 1999. 32(1): p. 36-50.
241. Hoekman, S.K., et al., Review of biodiesel composition, properties, and
specifications. Renewable and Sustainable Energy Reviews, 2012. 16(1): p. 143-
169.
242. Wang, R., et al., Biodiesel preparation, optimization, and fuel properties from
non-edible feedstock, Datura stramonium L. Fuel, 2012. 91(1): p. 182-186.
243. Parikh, J., S.A. Channiwala, and G.K. Ghosal, A correlation for calculating HHV
from proximate analysis of solid fuels. Fuel, 2005. 84(5): p. 487-494.
244. J. Haber', J.H.Block, and B. Delmon, Manual of methods and procedures for
catalyst characterization. Journal of Pure and Applied Chemistry, 1995. 67: p.
1267-1306.
245. Roh, H.-S., Y. Wang, and D. King, Selective Production of
H<sub>2</sub> from Ethanol at Low Temperatures over
Rh/ZrO<sub>2</sub>–CeO<sub>2</sub> Catalysts.
Topics in Catalysis, 2008. 49(1): p. 32-37.
Hydrogen production by steam reforming of biodiesel
235
246. Chen, H., et al., A novel mesostructured alumina–ceria–zirconia tri-component
nanocomposite with high thermal stability and its three-way catalysis.
Microporous and Mesoporous Materials, 2011. 143(2–3): p. 368-374.
247. Aasberg-Petersen, K., et al., Technologies for large-scale gas conversion. Applied
Catalysis A: General, 2001. 221(1-2): p. 379-387.
248. Sukonket, T., et al., Influence of the Catalyst Preparation Method, Surfactant
Amount, and Steam on CO2 Reforming of CH4 over 5Ni/Ce0.6Zr0.4O2 Catalysts.
Energy & Fuels, 2011. 25(3): p. 864-877.
249. Xu, L., H. Song, and L. Chou, Mesoporous nanocrystalline ceria–zirconia solid
solutions supported nickel based catalysts for CO2 reforming of CH4.
International Journal of Hydrogen Energy, 2012. 37(23): p. 18001-18020.
250. Biswas, P. and D. Kunzru, Steam reforming of ethanol for production of hydrogen
over Ni/CeO–ZrO catalyst: Effect of support and metal loading. International
Journal of Hydrogen Energy, 2007. 32(8): p. 969-980.
251. Dantas, S.C., et al., Effect of different promoters on Ni/CeZrO2 catalyst for
autothermal reforming and partial oxidation of methane. Chemical Engineering
Journal, 2010. 156(2): p. 380-387.
252. Siahvashi, A. and A.A. Adesina, Synthesis gas production via propane dry (CO2)
reforming: Influence of potassium promotion on bimetallic Mo-Ni/Al2O3.
Catalysis Today, 2013. 214(0): p. 30-41.
253. Sun, S., W. Chu, and W. Yang, Ce-Al Mixed Oxide with High Thermal Stability
for Diesel Soot Combustion. Chinese Journal of Catalysis, 2009. 30(7): p. 685-
689.
254. Fishtik, I., et al., A thermodynamic analysis of hydrogen production by steam
reforming of ethanol via response reactions. International Journal of Hydrogen
Energy, 2000. 25(1): p. 31-45.
255. Adhikari, S., et al., A thermodynamic analysis of hydrogen production by steam
reforming of glycerol. International Journal of Hydrogen Energy, 2007. 32(14): p.
2875-2880.
256. Yoon, S., I. Kang, and J. Bae, Effects of ethylene on carbon formation in diesel
autothermal reforming. International Journal of Hydrogen Energy, 2008. 33(18):
p. 4780-4788.
257. Lin, R., Y. Zhu, and L.L. Tavlarides, Mechanism and kinetics of thermal
decomposition of biodiesel fuel. Fuel, 2013. 106(0): p. 593-604.
258. Borowiecki, T., G. Giecko, and M. Panczyk, Effects of small MoO3 additions on
the properties of nickel catalysts for the steam reforming of hydrocarbons: II.
genolysis and cracking of n-butane.
Applied Catalysis A: General, 2002. 230(1–2): p. 85-97.
259. Meeyoo, V., et al., Steam reforming of ethanol over Ni/Ce0.75Zr0.25o2 and Ni-
K/Ce0.75Zr0.25O2 catalysts, in Chemeca 2011 (39th : 2011 : Sydney, N.S.W.).
2011, Engineers Australia: Barton, A.C.T. p. [807]-[816].
260. Vagia, E.C. and A.A. Lemonidou, Hydrogen production via steam reforming of
bio-oil components over calcium aluminate supported nickel and noble metal
catalysts. Applied Catalysis A: General, 2008. 351(1): p. 111-121.

Hydrogen production by steam reforming of biodiesel
236
261. Choong, C.K.S., et al., Effect of calcium addition on catalytic ethanol steam
reforming of Ni/Al2O3: II. Acidity/basicity, water adsorption and catalytic
activity. Applied Catalysis A: General, 2011. 407(1–2): p. 155-162.
262. Hilaire, S., et al., A comparative study of water-gas-shift reaction over ceria-
supported metallic catalysts. Applied Catalysis A: General, 2004. 258(2): p. 271-
276.
263. Borowiecki, T., et al., Studies of potassium-promoted nickel catalysts for methane
steam reforming: Effect of surface potassium location. Applied Surface Science,
2014. 300(0): p. 191-200.
264. Nikolla, E., J. Schwank, and S. Linic, Promotion of the long-term stability of
reforming Ni catalysts by surface alloying. Journal of Catalysis, 2007. 250(1): p.
85-93.
265. Shotipruk, A., et al., Reactivity of CeO2 and Ce-ZrO2 toward steam reforming of
palm fatty acid distilled (PFAD) with co-fed oxygen and hydrogen. Chemical
Engineering Science, 2009. 64(3): p. 459-466.
266. Cheng, F. and V. Dupont, Nickel catalyst auto-reduction during steam reforming
of bio-oil model compound acetic acid. International Journal of Hydrogen Energy,
2013. 38(35): p. 15160-15172.
267. Zhenga, J., et al., Comparative study of carbon formation on supported NI
catalysts during CH4 reforming using TEOM, TPO-IR and TGA techniques.
Prepr. Pap.-Am. Chem. Soc., Div. Fuel Chem, 2003. 48(2): p. 801.
268. Swaan, H.M., et al., Deactivation of supported nickel catalysts during the
reforming of methane by carbon dioxide. Catalysis Today, 1994. 21(2–3): p. 571-
578.
269. Świerczyński, D., et al., Steam reforming of tar from a biomass gasification
process over Ni/olivine catalyst using toluene as a model compound. Applied
Catalysis B: Environmental, 2007. 74(3–4): p. 211-222.
270. Li, D., et al., Self-activation and self-regenerative activity of trace Rh-doped
Ni/Mg(Al)O catalysts in steam reforming of methane. Applied Catalysis A:
General, 2007. 332(1): p. 98-109.
271. Silvie Vallová, E.P., Věra Valovičová, Martin Hummel, The Effect of potassium
carbonate on Thermal Oxidation of Cokes and Carbonaceous Materials. Fuels,
2013. 3: p. 100-104.

Hydrogen production by steam reforming of biodiesel
237
10. Appendices
10.1. Appendix A: Gas chromatograph calibration
The gas chromatograph used an external standard method to determine the reactor outlet
gas composition. The different gas mixtures were used for the calibration of the gas
chromatograph. The calibration gas mixture was connected to the gas chromatograph and
samples were injected in the columns via the sampling pump. The calibration point was
taken when the area of the sampling gases was constant and there was no residual O2
From air left in the gas sampling tube.
Figure 10.1: Channel 1, N2 calibration for the GC.

Hydrogen production by steam reforming of biodiesel
238
Figure 10.2: Channel 1, H2 calibration for the GC.
Figure 10.3: Channel 1, CO calibration for the GC.

Hydrogen production by steam reforming of biodiesel
239
Figure 10.4: Channel 1, CO2 calibration for the GC.
Figure 10.5: Channel 2, O2 calibration for the GC.
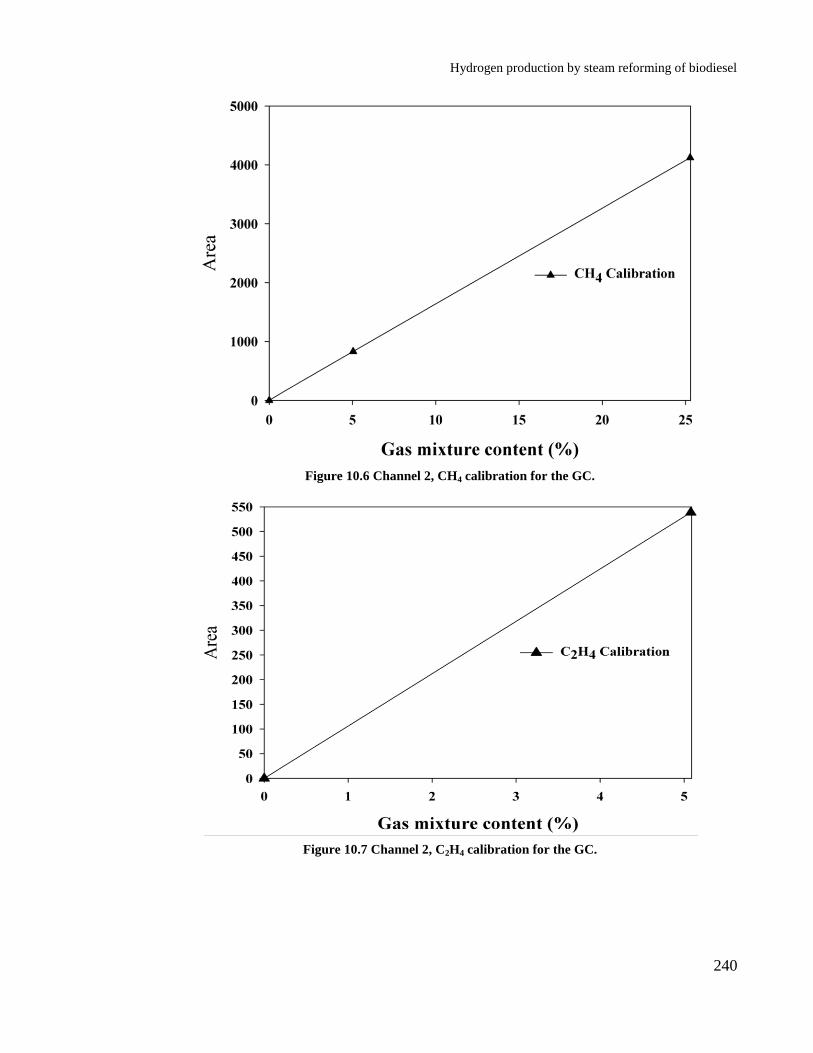
Hydrogen production by steam reforming of biodiesel
240
Figure 10.6 Channel 2, CH4 calibration for the GC.
Figure 10.7 Channel 2, C2H4 calibration for the GC.

Hydrogen production by steam reforming of biodiesel
241
Figure 10.8: Channel 2, C2H6 calibration for the GC.
Figure 10.9: Channel 2, C3H6 calibration for the GC.

Hydrogen production by steam reforming of biodiesel
242
Figure 10.10: Channel 2, C3H8 calibration for the GC.

Hydrogen production by steam reforming of biodiesel
243
10.2. Appendix B: Equilibrium calculations
The input and output data of thermodynamic output is given below considering an
example of SR of commercial biodiesel using S/C of 3 and WHSV of 3.18h-1
. The inlet
biodiesel composition was used to calculate inlet mole fractions. Due to unavailability of
the thermodynamic data of some of the methyl esters, the biodiesel composition obtained
from gas chromatograph was regularised to 100% before calculating the mole fractions.
Table 10.1: Inlet molar composition used for equilibrium calculations for SR of commercial
biodiesel at S/C of 3 and WHSV of 3.18 h
-1.
Inlet
Compound mole fraction
C13H26O2 1.262865E-05
C17H32O2 4.738665E-05
C17H34O2 2.424214E-03
C19H38O2 5.625648E-04
C15H30O2 4.741212E-05
C19H36O2 7.240017E-03
C19H34O2 2.917506E-03
C21H42O2 8.128071E-05
C19H32O2 2.251192E-04
H2O 7.547660E-01
N2 2.307359E-01
Ar 1.000000E-03
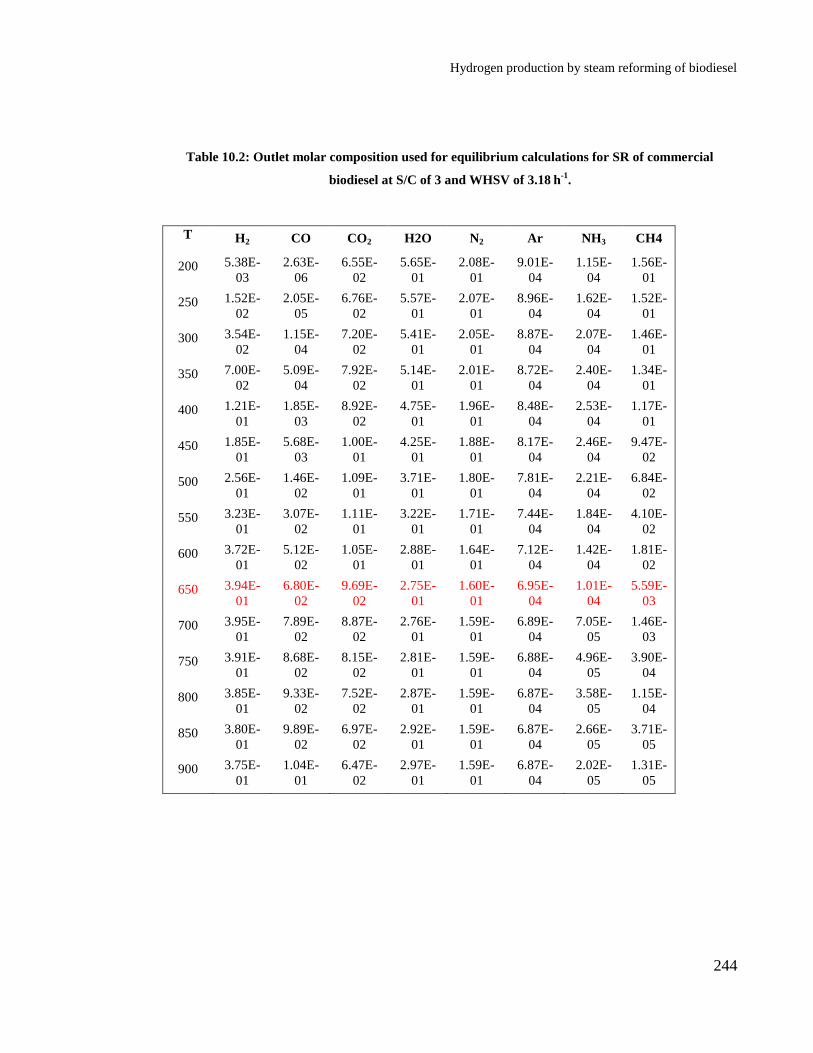
Hydrogen production by steam reforming of biodiesel
244
Table 10.2: Outlet molar composition used for equilibrium calculations for SR of commercial
biodiesel at S/C of 3 and WHSV of 3.18 h
-1.
T H2 CO CO2 H2O N2 Ar NH3 CH4
200 5.38E-
03
2.63E-
06
6.55E-
02
5.65E-
01
2.08E-
01
9.01E-
04
1.15E-
04
1.56E-
01
250 1.52E-
02
2.05E-
05
6.76E-
02
5.57E-
01
2.07E-
01
8.96E-
04
1.62E-
04
1.52E-
01
300 3.54E-
02
1.15E-
04
7.20E-
02
5.41E-
01
2.05E-
01
8.87E-
04
2.07E-
04
1.46E-
01
350 7.00E-
02
5.09E-
04
7.92E-
02
5.14E-
01
2.01E-
01
8.72E-
04
2.40E-
04
1.34E-
01
400 1.21E-
01
1.85E-
03
8.92E-
02
4.75E-
01
1.96E-
01
8.48E-
04
2.53E-
04
1.17E-
01
450 1.85E-
01
5.68E-
03
1.00E-
01
4.25E-
01
1.88E-
01
8.17E-
04
2.46E-
04
9.47E-
02
500 2.56E-
01
1.46E-
02
1.09E-
01
3.71E-
01
1.80E-
01
7.81E-
04
2.21E-
04
6.84E-
02
550 3.23E-
01
3.07E-
02
1.11E-
01
3.22E-
01
1.71E-
01
7.44E-
04
1.84E-
04
4.10E-
02
600 3.72E-
01
5.12E-
02
1.05E-
01
2.88E-
01
1.64E-
01
7.12E-
04
1.42E-
04
1.81E-
02
650 3.94E-
01
6.80E-
02
9.69E-
02
2.75E-
01
1.60E-
01
6.95E-
04
1.01E-
04
5.59E-
03
700 3.95E-
01
7.89E-
02
8.87E-
02
2.76E-
01
1.59E-
01
6.89E-
04
7.05E-
05
1.46E-
03
750 3.91E-
01
8.68E-
02
8.15E-
02
2.81E-
01
1.59E-
01
6.88E-
04
4.96E-
05
3.90E-
04
800 3.85E-
01
9.33E-
02
7.52E-
02
2.87E-
01
1.59E-
01
6.87E-
04
3.58E-
05
1.15E-
04
850 3.80E-
01
9.89E-
02
6.97E-
02
2.92E-
01
1.59E-
01
6.87E-
04
2.66E-
05
3.71E-
05
900 3.75E-
01
1.04E-
01
6.47E-
02
2.97E-
01
1.59E-
01
6.87E-
04
2.02E-
05
1.31E-
05

Hydrogen production by steam reforming of biodiesel
245
Table 10.3: Equilibrium mass balance calculations of SR of commercial biodiesel at S/C 3 and
WHSV of 3.18 h-1
.
Temp Outlet
moles XH2O Y H2 SH-H2 SC-CO SC-CO2 SC-CH4
200 112.12391 16.41430 0.30691 3.27793 0.00120 29.89656 70.10224
250 112.67509 17.15141 0.87246 8.91584 0.00940 30.99280 68.99780
300 113.83002 18.68056 2.05229 19.23812 0.05326 33.25098 66.69576
350 115.89024 21.35138 4.13624 33.83797 0.23883 37.15232 62.60885
400 119.09834 25.37872 7.32996 50.21282 0.89228 42.84619 56.26153
450 123.57839 30.66658 11.66294 65.57913 2.83514 49.77632 47.38854
500 129.32900 36.67768 16.92468 78.43991 7.62519 56.36320 36.01161
550 135.97334 42.37626 22.52406 88.40622 16.88578 60.24829 22.86593
600 142.13034 46.32586 27.19984 95.17511 29.47420 59.85109 10.67471
650 145.79461 47.56141 29.55354 98.52479 40.27812 56.29619 3.42570
700 147.07290 46.94381 29.96988 99.61176 47.16576 51.92997 0.90427
750 147.41162 45.78648 29.69660 99.89460 51.95138 47.80605 0.24257
800 147.50296 44.60377 29.28724 99.96864 55.82201 44.10686 0.07112
850 147.52620 43.52197 28.88213 99.98972 59.15533 40.82168 0.02299
900 147.53865 42.55155 28.51329 99.99631 62.07979 37.91207 0.00814
Sample calculations performed at 650°C provides following results
Applying N2 balance (6.18) outlet moles are calculated assuming 100 moles as basis.
Molar flowrate of gases leaving is
(23.03)Outlet moles= 145.75
0.1582 (10.1)

Hydrogen production by steam reforming of biodiesel
246
Steam conversion calculated using Eq 6.13 is given below.
2H O
75.47 39.57X 100=47.56 %
75.47
(10.2)
The H2 yield was caudated using Eq 6.22.
2H
2.02 0.396 145.75Y (wt%) 100= 29.55%
394.93
(10.3)
The selectivities of H2 and other carbon containing gases calculated using 6.23 and 6.25-
26 is given below
2H H
0.396S 100 =98.52 %
0.396 0.005
(10.4)
C-CO
0.069S = ×100 =40.28%
0.069+0.097+0.005
(10.5)
2C-CO
0.097S = ×100 =56.29%
0.069+0.097+0.005
(10.6)
4C-CH
0.005S = ×100 =3.42%
0.069+0.097+0.005
(10.7)

Hydrogen production by steam reforming of biodiesel
247
10.3. Appendix C: Carbon balance calculation
Carbon balance is shown below considering an e.g. Ni/Ce-Zr catalyst
Input molar flowrate of carbon 1.5×10⁻⁵
mol/s considering 7200 s experiment the inlet
mole of carbon is calculated to 1.5×10⁻⁵
mol/s ×7200 s = 1 1.0798 10 mol. The biodiesel
conversion was 96.09 hence C leaving the reactor with the gases is given by
1 1C leaving the reactor with gases =1.08 10 0.9609 1.0376 10 mol (10.8)
The amount of C in the condensate was 781.34 mg/lit and the amount of condensate
collected was 4 ml hence the amount of C in the condensate would be
-4781.35 4 1C in the condensate = × × =2.6023×10 mol
1000 1000 12
(10.9)
The amount of C deposited on the catalyst obtained from elemental analysis is 0.79 wt %
The total amount of C on the catalyst surface is
10.079 2.0506C on catalyst surface 1.3596 10 mol
1 0.079 12
(10.10)
The total output C=( C in gas+C on cat+C in condensate) (10.11)
1 3 4
1
The total output C (1.0376 10 1.3596 10 2.6023 10 )
1.0538 10 mol
(10.12)
1 1
1
1.0798 10 1.0538 10Unacounted C (% feed) = 100 2.40
1.0798 10
(10.13)
-4
1
2.6023×10 C in gas (%)= 100 98.46
1.0538 10
(10.14)
1
1
1.3596 10C on catalyst (%)= 100 1.29
1.0538 10
(10.15)

Hydrogen production by steam reforming of biodiesel
248
-4
1
2.6023×10 C in condensate (%)= 100 0.24
1.0538 10
(10.16)

Hydrogen production by steam reforming of biodiesel
249
10.4. Appendix D: Vaporiser details
Figure 10.11: Engineering drawing of the vaporisers.

Hydrogen production by steam reforming of biodiesel
250
Table 10.4: Flowrates used for vaporizer design.
Mass flow of biod kg/h Molar flow of biod
kmol/h
Molar flow of water
kmol/ha
Molar flow of N2
kmol/h
5.4000E-03 1.82432E-05 1.0399E-03 1.22543E-05
6.0000E-03 2.02703E-05 1.1554E-03 1.22543E-05
1.2000E-02 4.05405E-05 2.3108E-03 1.22543E-05
a- Based on S/C of 3.
Energy required to heat water from 25 to 100°C.
2
373.2 3
1
298
Δa+ΔbT+ΔcT ΔdTH O
Q n dT (10.17)
Table 10.5: Specific heat constants for water and enthalpy calculation.
Δa Δb Δc Δd Q1 kJ/h
9.1315E+01 -3.9399E-02 -2.0910E-04 5.2982E-07 7.2056E+00
9.1388E+01 -3.9454E-02 -2.0929E-04 5.3030E-07 8.0033E+00
9.1719E+01 -3.9701E-02 -2.1016E-04 5.3248E-07 1.5980E+01
Energy required to heat steam from 100 to 400°C.
2
673.2 3 4
2
373
Δa+ΔbT+ΔcT ΔdT ΔeTH O
Q n dT (10.18)
Table 10.6: Specific heat constants for steam and enthalpy calculation.
Δa Δb Δc Δd Δe Q2 kJ/h
3.3872E+01 -8.2350E-03 2.9028E-05 -1.6262E-08 3.6486E-09 1.0900E+02
3.3878E+01 -8.2532E-03 2.9115E-05 -1.6416E-08 3.6530E-09 1.2138E+02
3.3905E+01 -8.3354E-03 2.9508E-05 -1.7117E-08 3.6729E-09 2.4520E+02
Energy required for phase change at 100°C
2Q =nλ where λ is 39.5kJ/mol (10.19)
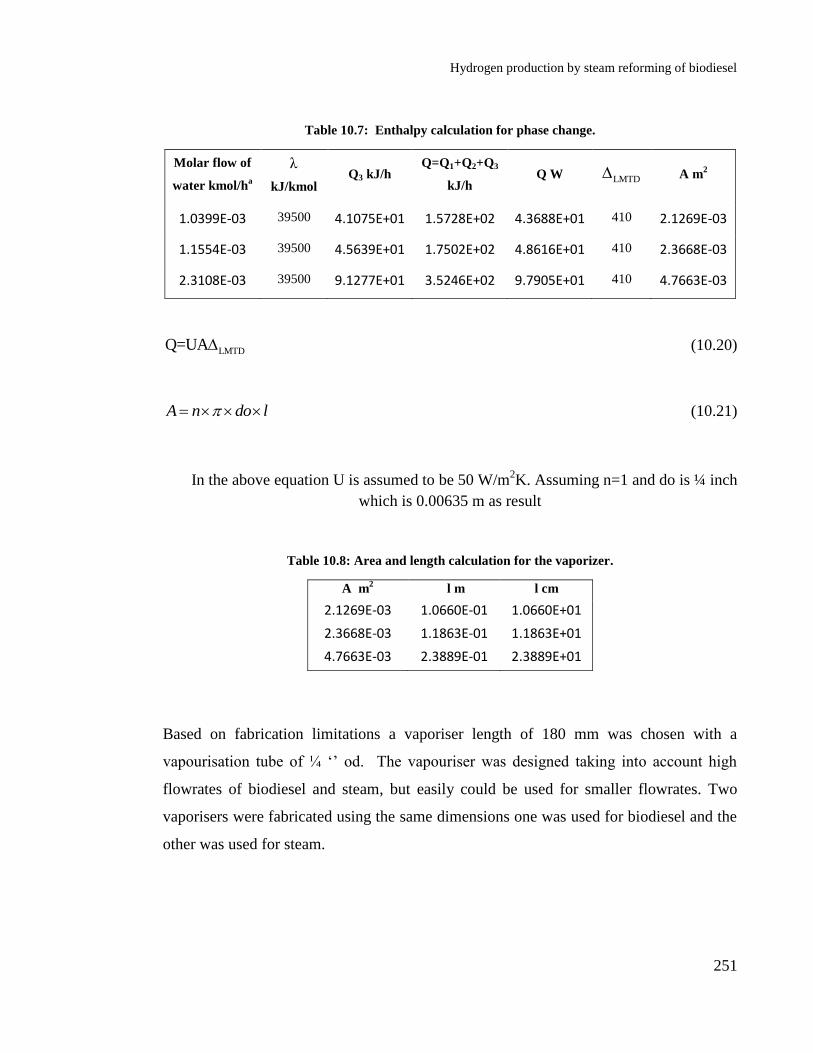
Hydrogen production by steam reforming of biodiesel
251
Table 10.7: Enthalpy calculation for phase change.
Molar flow of
water kmol/ha
λ
kJ/kmol Q3 kJ/h
Q=Q1+Q2+Q3
kJ/h Q W LMTD A m
2
1.0399E-03 39500 4.1075E+01 1.5728E+02 4.3688E+01 410 2.1269E-03
1.1554E-03 39500 4.5639E+01 1.7502E+02 4.8616E+01 410 2.3668E-03
2.3108E-03 39500 9.1277E+01 3.5246E+02 9.7905E+01 410 4.7663E-03
LMTDQ=UA (10.20)
A n do l (10.21)
In the above equation U is assumed to be 50 W/m2K. Assuming n=1 and do is ¼ inch
which is 0.00635 m as result
Table 10.8: Area and length calculation for the vaporizer.
A m2 l m l cm
2.1269E-03 1.0660E-01 1.0660E+01
2.3668E-03 1.1863E-01 1.1863E+01
4.7663E-03 2.3889E-01 2.3889E+01
Based on fabrication limitations a vaporiser length of 180 mm was chosen with a
vapourisation tube of ¼ ‘’ od. The vapouriser was designed taking into account high
flowrates of biodiesel and steam, but easily could be used for smaller flowrates. Two
vaporisers were fabricated using the same dimensions one was used for biodiesel and the
other was used for steam.

Hydrogen production by steam reforming of biodiesel
252
10.5. Appendix E: Energy balance coefficients
Table 10.9: NASA coefficients for reactants used in energy balance calculations.
Compou
nds a1 a2 a3 a4 a5 a6 a7 b1
C13H26O2 0.00000
0E+00
0.000000
E+00
-
1.754888
E+00
1.61438
6E-01
-
1.075599
E-04
3.70402
5E-08
-
5.233795
E-12
-
8.301120
E+04
C15H30O2 0.00000
0E+00
0.000000
E+00
-
2.836721
E+00
1.88432
6E-01
-
1.267065
E-04
4.39090
9E-08
-
6.225764
E-12
-
8.569414
E+04
C17H32O2 0.00000
0E+00
0.000000
E+00
-
3.029283
E+00
2.02466
6E-01
-
1.342311
E-04
4.58873
0E-08
-
6.431215
E-12
-
7.628389
E+04
C17H34O2 0.00000
0E+00
0.000000
E+00
-
3.681177
E+00
2.14276
8E-01
-
1.452972
E-04
5.09002
5E-08
-
7.292151
E-12
-
9.167280
E+04
C19H32O2 0.00000
0E+00
0.000000
E+00
-
3.89465
8E+00
2.17532
7E-01
-
1.50062
2E-04
5.38064
4E-08
-
7.91313
3E-12
-
5.03525
1E+04
C19H34O2 0.00000
0E+00
0.000000
E+00
-
3.96765
6E+00
2.22996
7E-01
-
1.51188
7E-04
5.30381
7E-08
-
7.62072
0E-12
-
6.59102
5E+04
C19H36O2 0.00000
0E+00
0.000000
E+00
-
4.132870
E+00
2.29449
1E-01
-
1.556226
E-04
5.51139
2E-08
-
8.047574
E-12
-
8.176242
E+04
C19H38O2 0.00000
0E+00
0.000000
E+00
-
4.669568
E+00
2.41604
3E-01
-
1.660651
E-04
5.91905
2E-08
-
8.637092
E-12
-
9.720475
E+04
C21H42O2 0.00000
0E+00
0.000000
E+00
-
4.72516
2E+00
2.63307
3E-01
-
1.77231
1E-04
6.12879
3E-08
-
8.64119
7E-12
-
1.02787
7E+05
H2O -
3.94796
1E+04
5.755731
E+02
9.31782
7E-01
7.22271
3E-03
-
7.34255
7E-06
4.95504
3E-09
-
1.33693
3E-12
-
3.30397
4E+04
N2 -
3.42556
3E+04
4.847001
E+02
1.11901
1E+00
4.29388
9E-03
-
6.83630
1E-07
-
2.02337
3E-09
1.03904
0E-12
-
3.39145
5E+03
O2 2.21037
1E+04
-
3.818462
E+02
6.08273
8E+00
-
8.53091
4E-03
1.38464
6E-05
-
9.62579
4E-09
2.51970
6E-12
7.10846
1E+02
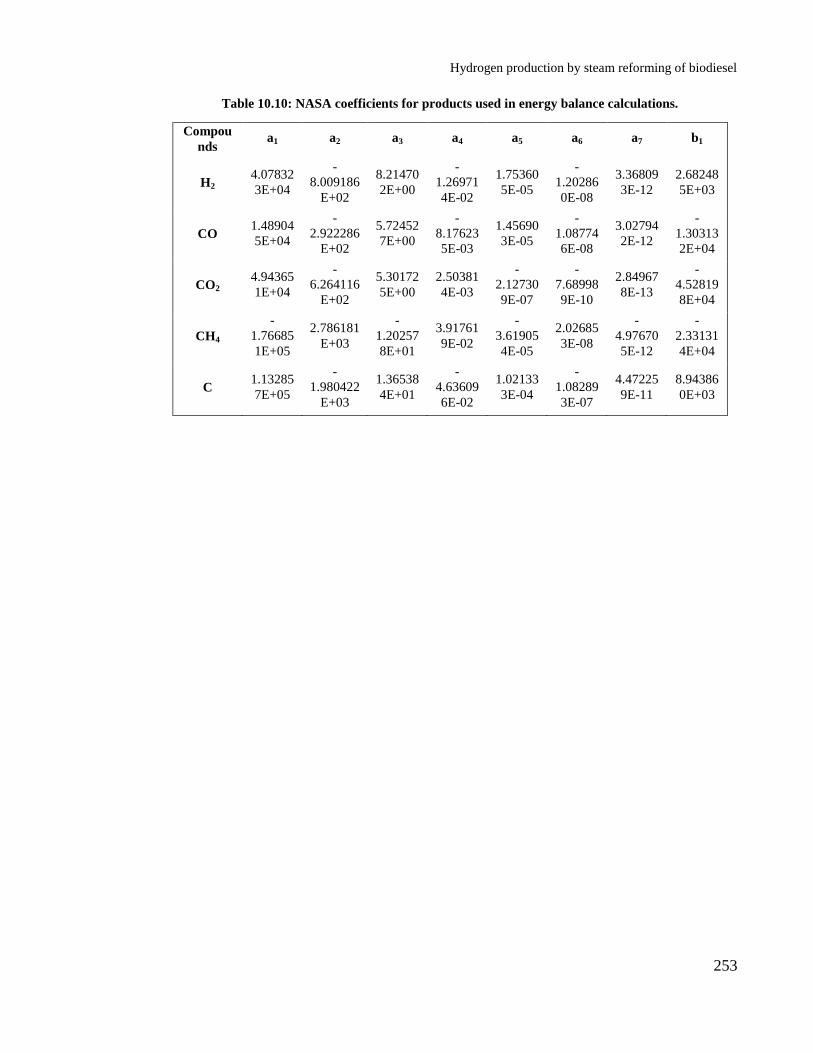
Hydrogen production by steam reforming of biodiesel
253
Table 10.10: NASA coefficients for products used in energy balance calculations.
Compou
nds a1 a2 a3 a4 a5 a6 a7 b1
H2 4.07832
3E+04
-
8.009186
E+02
8.21470
2E+00
-
1.26971
4E-02
1.75360
5E-05
-
1.20286
0E-08
3.36809
3E-12
2.68248
5E+03
CO 1.48904
5E+04
-
2.922286
E+02
5.72452
7E+00
-
8.17623
5E-03
1.45690
3E-05
-
1.08774
6E-08
3.02794
2E-12
-
1.30313
2E+04
CO2 4.94365
1E+04
-
6.264116
E+02
5.30172
5E+00
2.50381
4E-03
-
2.12730
9E-07
-
7.68998
9E-10
2.84967
8E-13
-
4.52819
8E+04
CH4
-
1.76685
1E+05
2.786181
E+03
-
1.20257
8E+01
3.91761
9E-02
-
3.61905
4E-05
2.02685
3E-08
-
4.97670
5E-12
-
2.33131
4E+04
C 1.13285
7E+05
-
1.980422
E+03
1.36538
4E+01
-
4.63609
6E-02
1.02133
3E-04
-
1.08289
3E-07
4.47225
9E-11
8.94386
0E+03
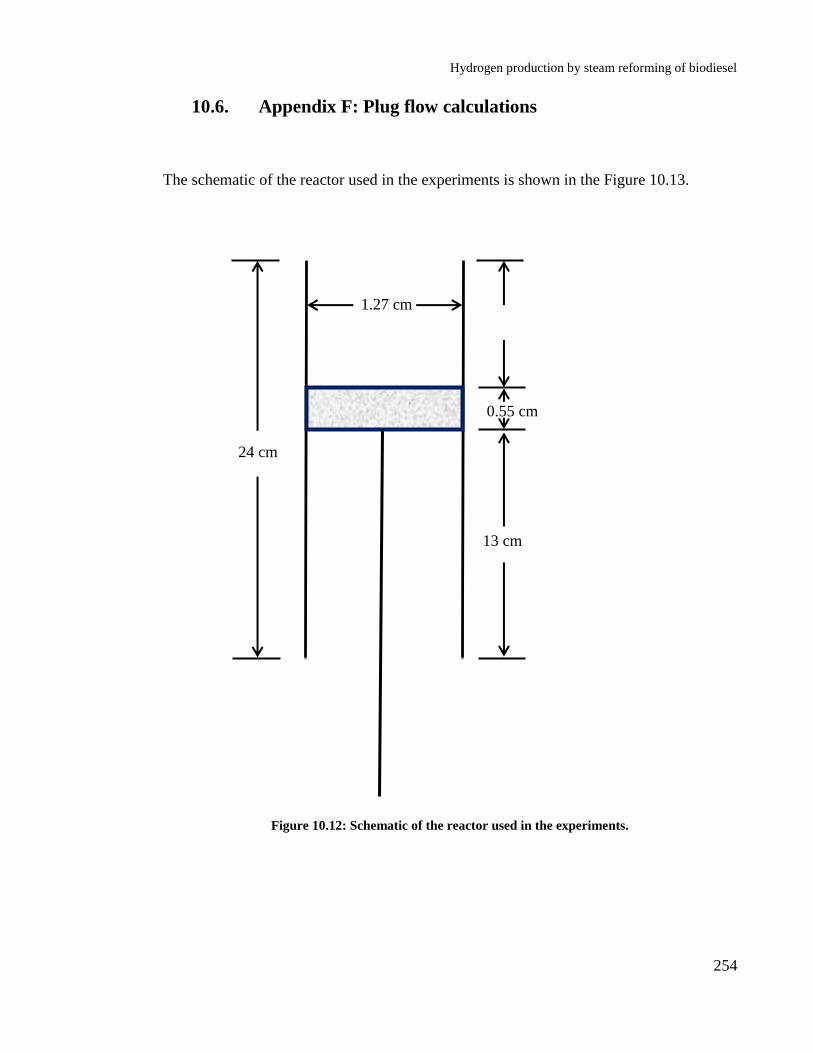
Hydrogen production by steam reforming of biodiesel
254
10.6. Appendix F: Plug flow calculations
The schematic of the reactor used in the experiments is shown in the Figure 10.13.
Figure 10.12: Schematic of the reactor used in the experiments.
1.27 cm
13 cm
24 cm
0.55 cm

Hydrogen production by steam reforming of biodiesel
255
The mass of the Ni/Ce-Zr catalyst used in an experiment is 2.0506 ×10⁻³
kg. The ρcat and
ρsand are 5680 kg/m3 and 2640 kg/m
3.
The density of ρmix is 4164 kg/m3. The density of the bed is given by
b mρ =ρ (1- ) (10.22)
In the above equation ϕ is the void fraction and considered to be 0.3.
3
bρ =4164(1-0.3)=2914 kg/m (10.23)
Diameter of the reactor (d) is 1.27×10⁻²
m and the dp is 5×10⁻⁶
m. The ratio of d/dp is
given by
2
6
1.27 102540
5 10p
d
d
(10.24)
p
10 (plug flow)d
d (10.25)
Similarly the volume of the bed used is
37 32.0506 10
7.035 102914
bb
b
mV m
(10.26)
2
4b b bV d l
(10.27)
In the above equation lb is the length of the bed and db is the diameter of the bed which is
same as the diameter of the reactor.
-7-3
2 -2 2
4 4 7.035 105.556 10
(1.27 10 )
b
b
Vl m
d
(10.28)
3
6
5.556 101111.3
5 10
b
b
l
d
(10.29)
b
b
l50 (plug flow)
d (10.30)
Recommended