Housing Reform and Housing Affordability in China: A Case
Study of Shanghai
Jie Chen
PhD (Uppsala), Associate Professor
School of Management, Fudan University &Institution for Housing and Urban Research,
Uppsala University, Sweden

China Urban Land and Housing in the 21st Century, HK Dec.2007
2
The Contents
Housing reform in China 1978-2006: the transition path
Housing market development in Shanghai 1993-2006
Assessing the housing affordability situation in Shanghai 1995-2006

China Urban Land and Housing in the 21st Century, HK Dec.2007
3
Contributions
Background materialsA systemic analysis of housing affordability
in urban ChinaMethodology contribution: New approaches
of measuring housing affordability: dynamic price-to-income ratio; dynamic residual income approach

China Urban Land and Housing in the 21st Century, HK Dec.2007
4
The rise of the questionThe issue of housing affordability in China must be
understood in the historical backgroundBefore the 1978 reform, residential housing was a
welfare good that distributed by the authority, no problem of affording, but just chance to be allocated and time of waiting
Only after the housing becomes a commodity good, the housing affordability issue arises.
The transformation of housing finance system has played a critical role in this process.

China Urban Land and Housing in the 21st Century, HK Dec.2007
5
The welfare housing allocation and old housing finance system
Under the welfare housing system, government produced and allocated housings.
Virtually all housing investments were solely financed by the state budgetary funding.
The single-channel state budgetary funding housing finance system could not be sustained.
Due to the continued financial deficit, investment on urban residential housing was consistently low.
Housing storage was extremely serious in big cities like Shanghai.

China Urban Land and Housing in the 21st Century, HK Dec.2007
6
Housing Reform in China
Three phases of China housing reform after 1978: 1) 1980-1988, rent increase; 2) 1989-1998, the selling of public housing (at discoun
ted rate), the design of housing subsidies, infant developments of new housing finance system including the housing provident fund;
3) 1998-now, the complete demolition of welfare housing system and the formation of a free-wheeling, market-driven housing sector.

China Urban Land and Housing in the 21st Century, HK Dec.2007
7
The Restructuring of Housing Finance System in China (1)
Housing Provident Fund (HPF): participating employees contribute a certain proportion of their salaries to their HPF accounts and employers contribute an equal amount. The compulsory minimum contribution rate in Shanghai is 7%. The savings at HPF can only for housing-related purposes.
The functions of HPF: HPF initially was designed to finance housing production now it mainly issues personal home mortgage at a preferential interest rate .
Problems with HPF: there may be an economic redistribution from the low- to high-income households.
China Urban Land and Housing in the 21st Century, HK Dec.2007
8
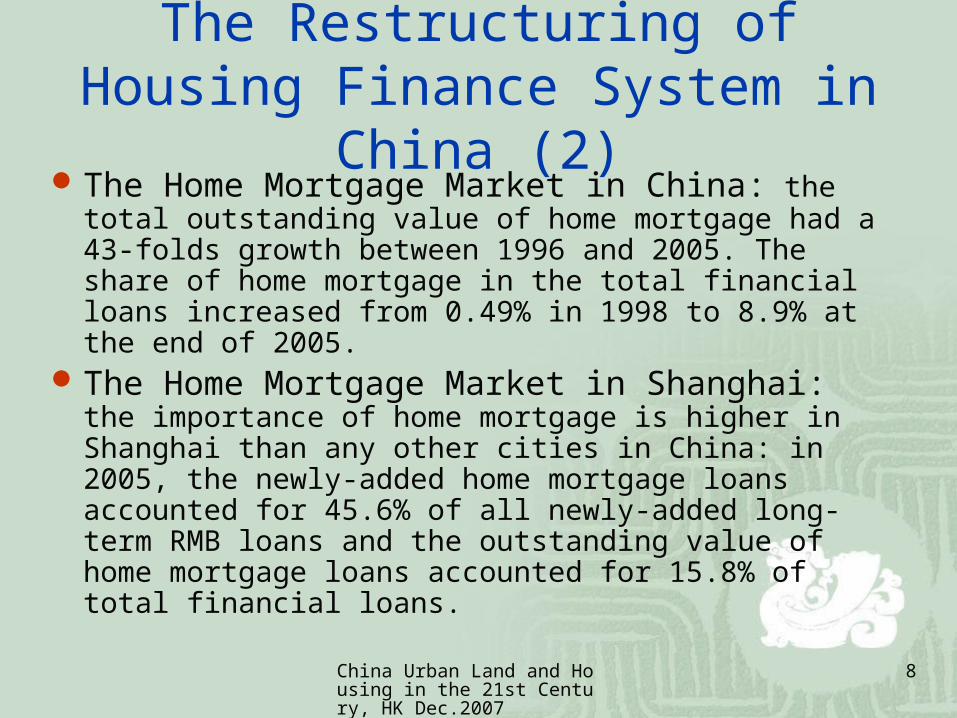
The Restructuring of Housing Finance System in China (2)
The Home Mortgage Market in China: the total outstanding value of home mortgage had a 43-folds growth between 1996 and 2005. The share of home mortgage in the total financial loans increased from 0.49% in 1998 to 8.9% at the end of 2005.
The Home Mortgage Market in Shanghai: the importance of home mortgage is higher in Shanghai than any other cities in China: in 2005, the newly-added home mortgage loans accounted for 45.6% of all newly-added long-term RMB loans and the outstanding value of home mortgage loans accounted for 15.8% of total financial loans.

China Urban Land and Housing in the 21st Century, HK Dec.2007
9
An overview of Shanghai residential housing industry
► Before the 1978 reform, investment on residential housing was little. The consequence: the living space floor per capita in 1952 was 3.4 sqm; in 1978, 4.5 sqm,
► Between 1978-1998, housing development was much lagged behind the economic growth.
► The 1998 reform lifted the welfare housing system. But the market slumped into stagnancy between 1999 and 1999. The Shanghai government had tried hard to stimulate the home demand.
► Since 2001, the housing market begins soaring. The house prices in Shanghai kept rising with continuously double-digit rises between 2002 and May of 2005.
► The market has been cooled down since May of 2005.► However, strong rebound since this summer
China Urban Land and Housing in the 21st Century, HK Dec.2007
10
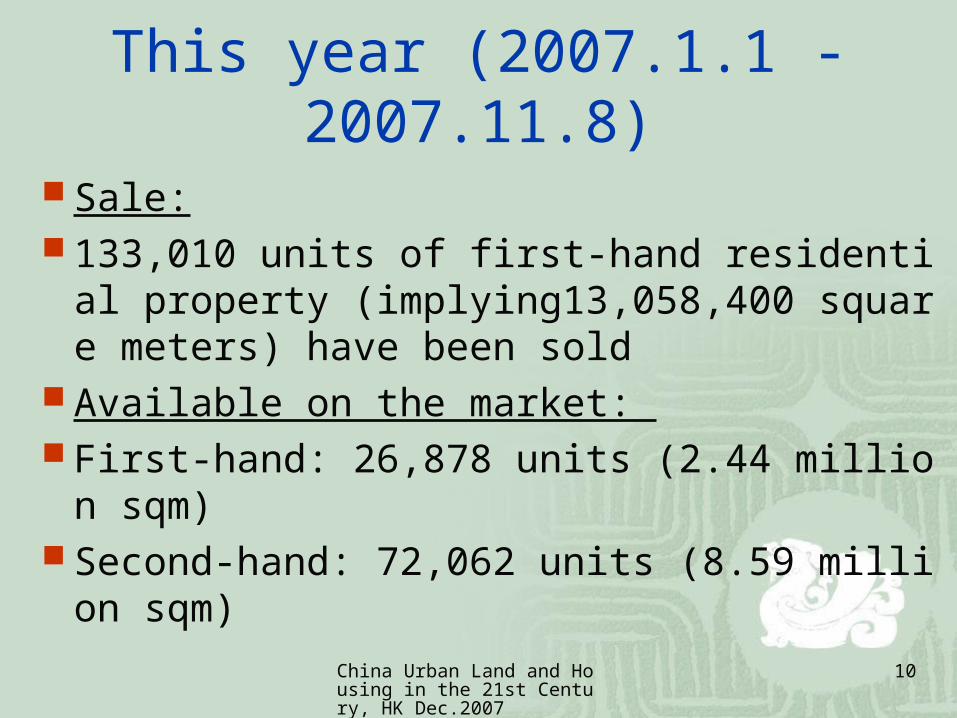
This year (2007.1.1 - 2007.11.8)
Sale: 133,010 units of first-hand residential property
(implying13,058,400 square meters) have been sold
Available on the market: First-hand: 26,878 units (2.44 million sqm) Second-hand: 72,062 units (8.59 million sqm)

China Urban Land and Housing in the 21st Century, HK Dec.2007
11
Fig.1. The share of residential housing investment in total social investment and the livingfloor space per capita in Shanghai 1952-2006
0
2
4
6
8
10
12
14
16
18
The
sha
re o
f re
side
ntia
l hou
sing
inve
stm
ent i
nto
tal i
nves
tmen
t(%
)
0
5
10
15
20
25
30
35
The
livi
ng f
loor
spa
ce p
er c
apita
(m2 )
The living floor space per capita The share of residential housing investment in total social investment
Housing Investment and Housing Conditions in Shanghai 1952-2006
China Urban Land and Housing in the 21st Century, HK Dec.2007
12
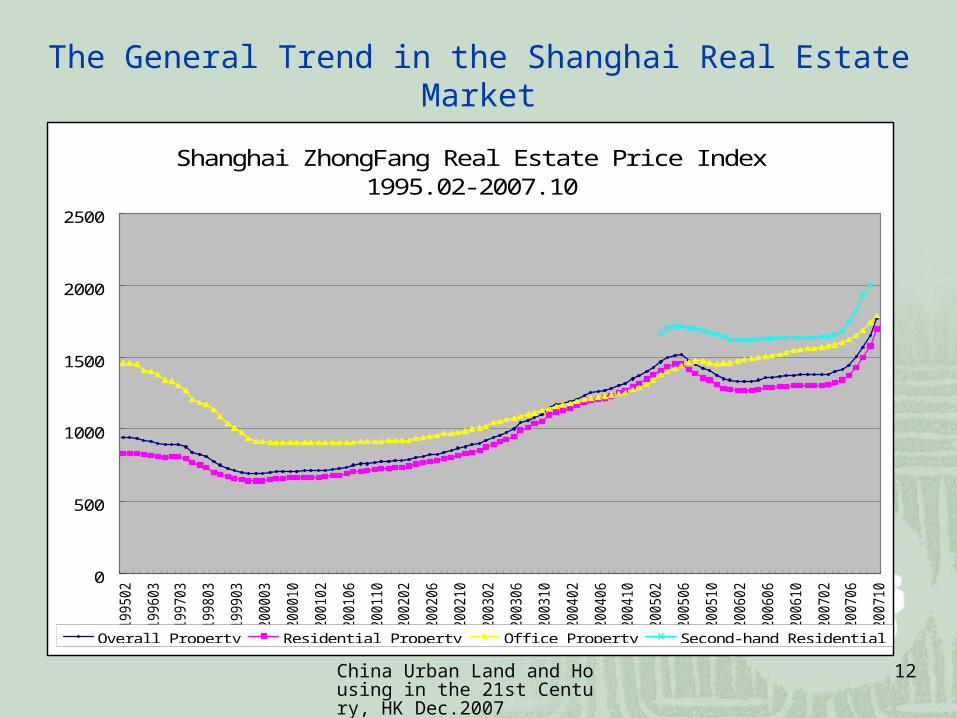
The General Trend in the Shanghai Real Estate Market
Shanghai ZhongFang Real Estate Pri ce I ndex1995. 02- 2007. 10
0
500
1000
1500
2000
2500
199502
199603
199703
199803
199903
200003
200010
200102
200106
200110
200202
200206
200210
200302
200306
200310
200402
200406
200410
200502
200506
200510
200602
200606
200610
200702
200706
200710
Overal l Property Resi dent i al Property Offi ce Property Second- hand Resi dent i al

China Urban Land and Housing in the 21st Century, HK Dec.2007
13
The market of first-hand commodity residential housings in Shanghai, 1995-2006
Year Total construction space sold (10,000 m2)
Growth rate (%)
Total value sold (100 million RMB)
Growth rate (%)
Unit Price (RMB/m2)
Growth rate (%)
1995 536.31 132.83 2477
1996 528.56 -1.4 156.90 18.1 2968 19.81997 617.02 16.7 178.35 13.7 2891 -2.61998 1056.77 71.3 319.76 79.3 3026 4.71999 1243.33 17.7 385.64 20.6 3102 2.52000 1445.87 16.3 480.97 24.7 3326 7.22001 1681.48 16.3 615.17 27.9 3659 10.02002 1846.38 9.8 739.89 20.3 4200 14.82003 2224.47 20.5 1109.86 50.0 4989 18.82004 3233.74 45.4 2064.74 86.0 6385 28.02005 2845.69 -12.0 1906.05 -7.7 6698 4.92006 3025.40 6.3 2177.08 14.2 7038 5.1
China Urban Land and Housing in the 21st Century, HK Dec.2007
14
Year Total floor size of sold commodity residential housings (10000 ㎡ )
Sold to individuals (10000 ㎡ )
Sold to working units (10000 ㎡ )
The share of individual buyers(%)
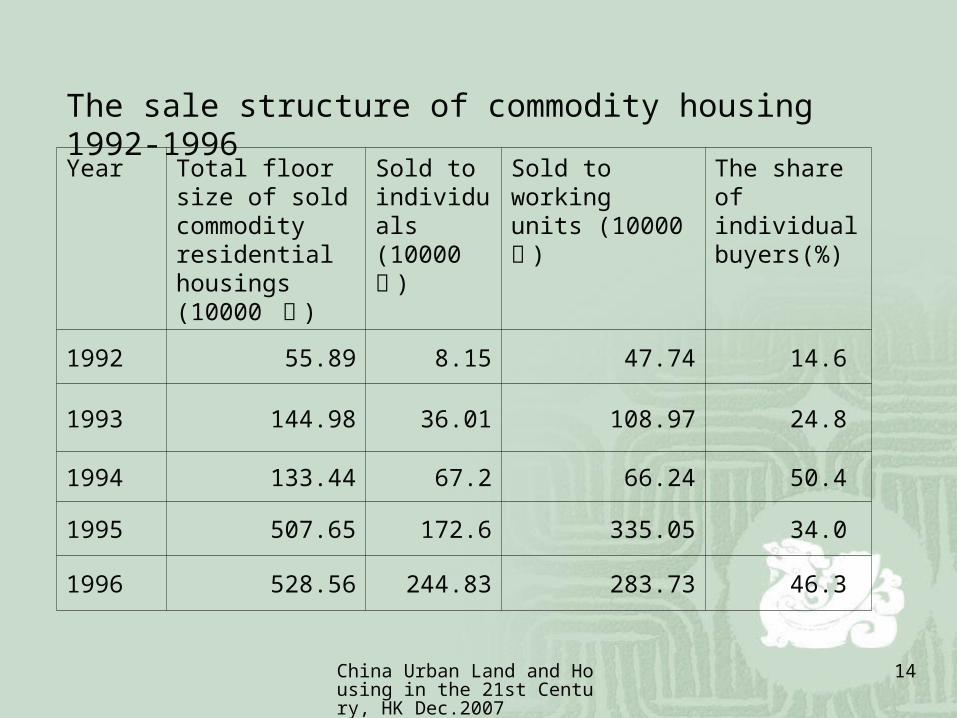
1992 55.89 8.15 47.74 14.6
1993 144.98 36.01 108.97 24.8
1994 133.44 67.2 66.24 50.4
1995 507.65 172.6 335.05 34.0
1996 528.56 244.83 283.73 46.3
The sale structure of commodity housing 1992-1996
China Urban Land and Housing in the 21st Century, HK Dec.2007
15
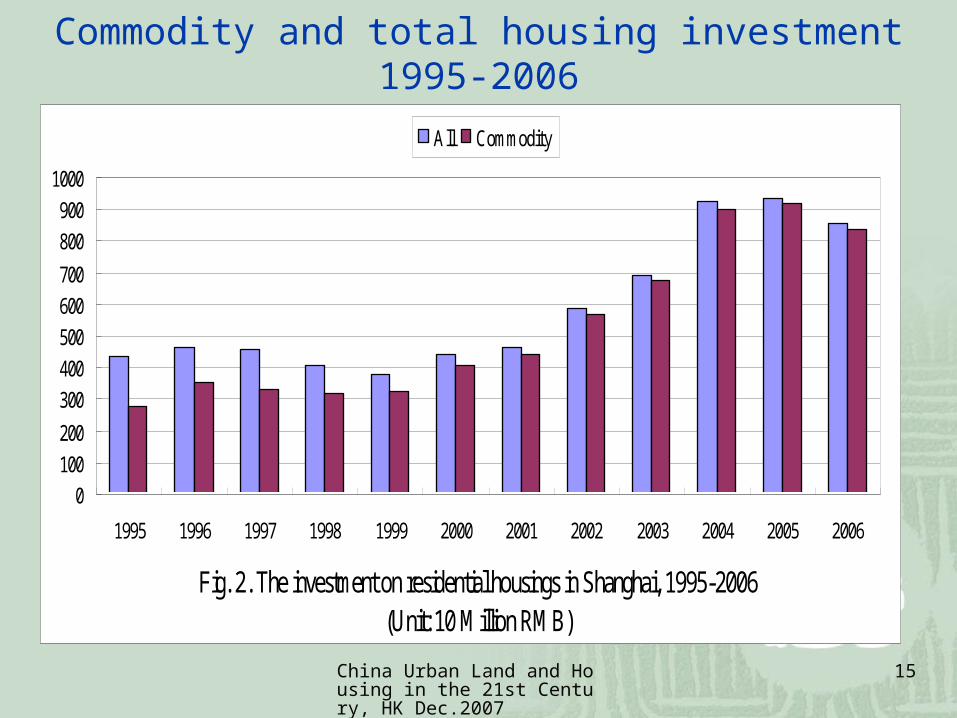
Commodity and total housing investment 1995-2006
Fig. 2. The investment on residential housings in Shanghai, 1995-2006(Unit: 10 Million RMB)
0
100
200
300
400
500
600
700
800
900
1000
1995 1996 1997 1998 1999 2000 2001 2002 2003 2004 2005 2006
All Commodity
China Urban Land and Housing in the 21st Century, HK Dec.2007
16
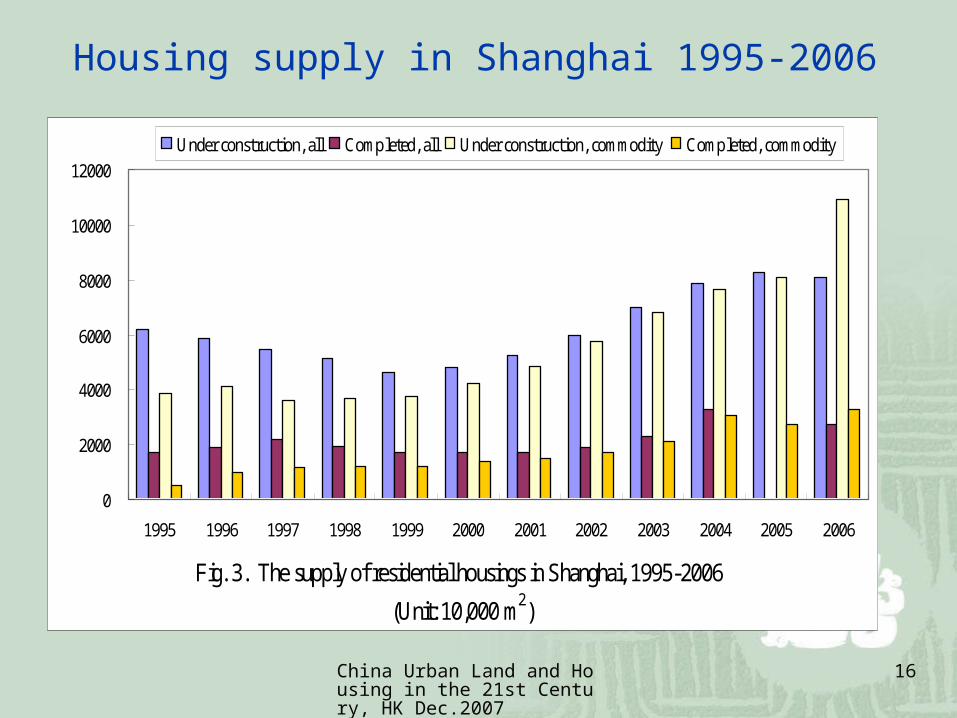
Housing supply in Shanghai 1995-2006
Fig. 3. The supply of residential housings in Shanghai, 1995-2006
(Unit: 10,000 m2)
0
2000
4000
6000
8000
10000
12000
1995 1996 1997 1998 1999 2000 2001 2002 2003 2004 2005 2006
Under construction, all Completed, all Under construction, commodity Completed, commodity
China Urban Land and Housing in the 21st Century, HK Dec.2007
17
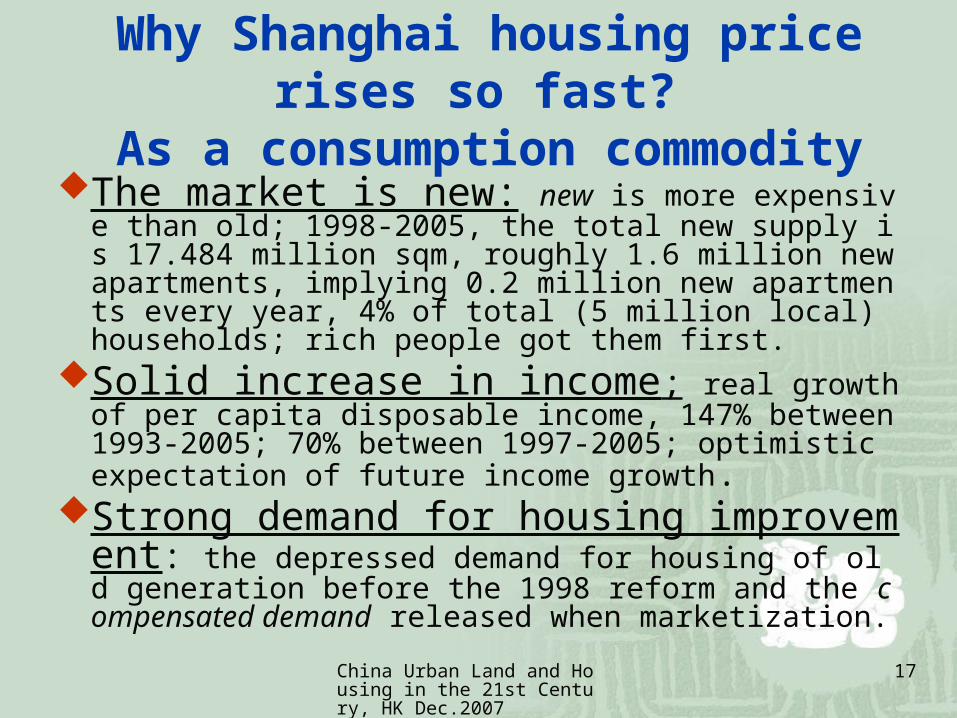
Why Shanghai housing price rises so fast?
As a consumption commodityThe market is new: new is more expensive than ol
d; 1998-2005, the total new supply is 17.484 million sqm, roughly 1.6 million new apartments, implying 0.2 million new apartments every year, 4% of total (5 million local) households; rich people got them first.
Solid increase in income; real growth of per capita disposable income, 147% between 1993-2005; 70% between 1997-2005; optimistic expectation of future income growth.
Strong demand for housing improvement: the depressed demand for housing of old generation before the 1998 reform and the compensated demand released when marketization.

China Urban Land and Housing in the 21st Century, HK Dec.2007
18
Fig.6. The income growth of Shanghai residents by income group, 1990-2003
0
5000
10000
15000
20000
25000
30000
35000
40000
1990 1991 1992 1993 1994 1995 1996 1997 1998 1999 2000 2001 2002 2003
Disp
osab
le in
com
e per
capi
ta, R
MB
lowest 10% 10-20% 20-40% 40-60% 60-80% 80-90% highest 10%
Note: Disposable income per capita in Shanghai 2004-2005, by income categoryYear 2004: bottom 20%, 7065; 20%-40%, 10664; 40%-60%, 14149; 60%-80%, 19371; Top 20%, 34404; Year 2005: bottom 20%, 7851; 20%-40%, 11800; 40%-60%, 15668; 60%-80%, 21313; Top 20%, 37722.
China Urban Land and Housing in the 21st Century, HK Dec.2007
19
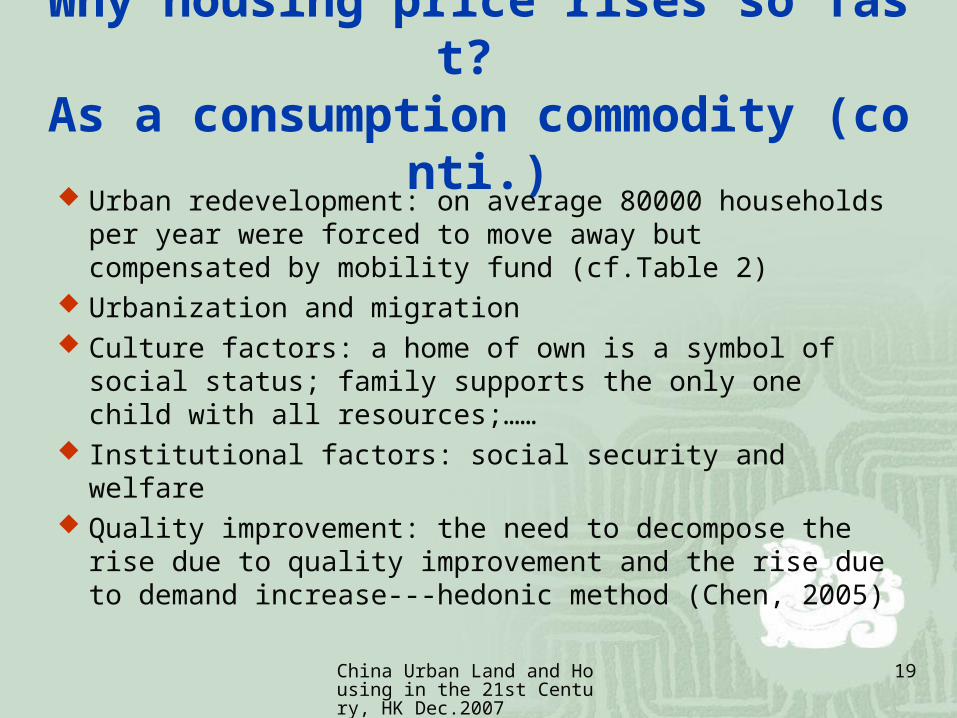
Why housing price rises so fast? As a consumption commodity (conti.)
Urban redevelopment: on average 80000 households per year were forced to move away but compensated by mobility fund (cf.Table 2)
Urbanization and migration Culture factors: a home of own is a symbol of social
status; family supports the only one child with all resources;……
Institutional factors: social security and welfare Quality improvement: the need to decompose the rise
due to quality improvement and the rise due to demand increase---hedonic method (Chen, 2005)

China Urban Land and Housing in the 21st Century, HK Dec.2007
20
Completed Demolition and Resettlement Status in Shanghai(2000~2004)
Year No. of Households of Completed Demolition
and Resettlement
Gross Floor Area(10,000㎡ )
2000 68293 288.35
2001 71909 386.66
2002 98714 485.00
2003 79077 475.47
2004 41552 232.52

China Urban Land and Housing in the 21st Century, HK Dec.2007
21
Why housing price rises so fast?----As an investment commodity
Lacking investment channels for the new riches
The lack of investment channel and the bearish stock market
The development of home mortgage marketExcess Liquidity?Record-low interest rate, 6% for long-term
loan; although eight-times interest rate adjustment in 2007

China Urban Land and Housing in the 21st Century, HK Dec.2007
22
The bearish stock market
Figure 7: the Shanghai Stock Index 1993-2006
0
500
1000
1500
2000
2500
19
93
/01
/29
19
93
/07
/30
19
94
/01
/31
19
94
/07
/29
19
95
/01
/27
19
95
/07
/31
19
96
/01
/31
19
96
/07
/31
19
97
/01
/31
19
97
/07
/31
19
98
/01
/23
19
98
/07
/31
19
99
/01
/29
19
99
/07
/30
20
00
/01
/28
20
00
/07
/31
20
01
/01
/19
20
01
/07
/31
20
02
/01
/31
20
02
/07
/31
20
03
/01
/29
20
03
/07
/31
20
04
/01
/30
20
04
/07
/30
20
05
/01
/31
20
05
/07
/29
20
06
/01
/25
China Urban Land and Housing in the 21st Century, HK Dec.2007
23
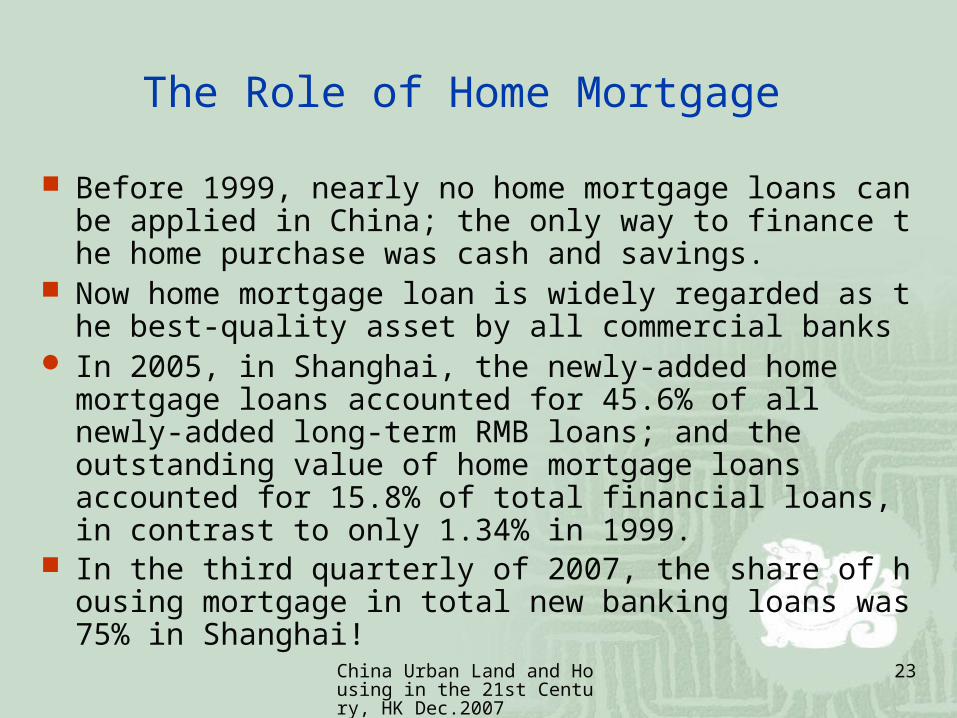
The Role of Home Mortgage
Before 1999, nearly no home mortgage loans can be applied in China; the only way to finance the home purchase was cash and savings.
Now home mortgage loan is widely regarded as the best-quality asset by all commercial banks
In 2005, in Shanghai, the newly-added home mortgage loans accounted for 45.6% of all newly-added long-term RMB loans; and the outstanding value of home mortgage loans accounted for 15.8% of total financial loans, in contrast to only 1.34% in 1999.
In the third quarterly of 2007, the share of housing mortgage in total new banking loans was 75% in Shanghai!

China Urban Land and Housing in the 21st Century, HK Dec.2007
24
The Growth of Home Mortgage Market in Shanghai 1999-2006
The Home Mortgage Market in Shanghai 1999-2006
0
500
1000
1500
2000
2500
3000
1999 2000 2001 2002 2003 2004 2005 2006
0.1
Billio
n R
MB
0
2
4
6
8
10
12
14
16
18
%
The Si ze of Home Mortage LoansHome Mortgage as % of Total Banki ng Loans

China Urban Land and Housing in the 21st Century, HK Dec.2007
25
Housing finance in Shanghai
0
1000
2000
3000
4000
5000
6000
7000
8000
9000
2001 2002 2003 2004 2005
Figure 8: The savings and housing mortgage in Shanghai Unit: 100 million
Total savings Consumption loan housing mortgage

China Urban Land and Housing in the 21st Century, HK Dec.2007
26
Home mortgage market in Shanghai, 1995-2006 Year Total
Household Savings(unit: 100 million RMB)
Total Financial Loans (unit: 100 million RMB)
Mortgage InterestRate (%)
Growth of CPI (Consumer Price Index ) (%)
Mortgage Loan(unit: 100 million RMB)
Share of Mortgage in total loans (%)
1995 1396.13 3235 14.76% 8.7 / /1996 1868.34 3780 15.12% 9.2 / /1997 2109.18 4325 12.42% 2.8 / /1998 2372.94 4870 10.35% 0.0 / /1999 2597.12 5415 5.58% 1.5 72.37 1.34 2000 2524.05 5960 5.58% 2.5 343.93 5.77 2001 3001.89 7188 5.58% 0.0 650.00 9.04 2002 4915.54 9074 5.04% 0.5 1086.71 11.98 2003 6054.60 11182 5.04% 0.1 1709.13 15.28 2004 6960.99 14972.01 5.04% 2.2 2455.53 16.40 2005 8432.49 16789.12 5.51% 1.0 2644.94 15.75 2006 9480.28 18603.92 5.85% 1.2 2483.73 13.35

China Urban Land and Housing in the 21st Century, HK Dec.2007
27
Why property price rises so fast?----As an investment commodity (continued)
Very strong demand from outside of Shanghai
nouveau riche from all other parts of China overseas hot-money investors rushing in speculation on RMB appreciation …….

China Urban Land and Housing in the 21st Century, HK Dec.2007
28
Pre-sale Registration of Commodity Buildings in Shanghai(1997~2003)
Year Targets of Pre-sale is domestic
(Number of suite)
Outside Shanghai (Number of suite)
Overseas (Number of suite)
Ratio of Outside Shanghai and Overseas(%)
1997 42956 1862 62 4.29
1998 76278 1737 35 2.27
1999 90977 5221 36 5.46
2000 107686 9355 52 8.03
2001 125657 24617 / 16.38*
2002 174870 39348 / 18.37*
2003 174279 46090 8644 23.90
Notes: The ratio of Outside Shanghai and Overseas in 2001 and 2002 excludes the number of pre-sale registration of overseas sales commodity buildings.
China Urban Land and Housing in the 21st Century, HK Dec.2007
29
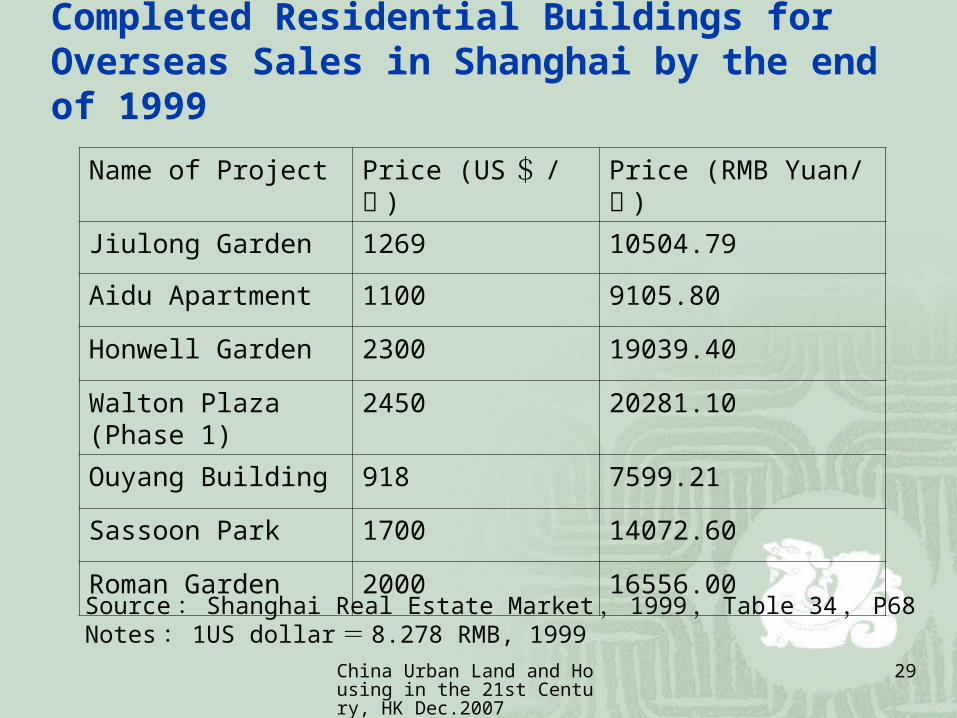
Completed Residential Buildings for Overseas Sales in Shanghai by the end of 1999
Name of Project Price (US$ /㎡ ) Price (RMB Yuan/ ㎡ )
Jiulong Garden 1269 10504.79
Aidu Apartment 1100 9105.80
Honwell Garden 2300 19039.40
Walton Plaza (Phase 1) 2450 20281.10
Ouyang Building 918 7599.21
Sassoon Park 1700 14072.60
Roman Garden 2000 16556.00
Source: Shanghai Real Estate Market, 1999, Table 34, P68Notes: 1US dollar= 8.278 RMB, 1999

China Urban Land and Housing in the 21st Century, HK Dec.2007
30
Inelastic supply
Land us regulations in mega cities like Shanghai become increasing strict
Revenues from land auctions are important in the fiscal incomes of local governments.
Property developers intentionally slow down the speed of building and selling to bolster the prices

China Urban Land and Housing in the 21st Century, HK Dec.2007
31
Inelastic response of housing supply
Figure 5: The supply responseness to changes in house prices,Shanghai (1996-2005)
-30
-20
-10
0
10
20
30
40
50
60
70
-5 0 5 10 15 20 25 30
Changes in house prices
Ch
an
ge
s in
su
pp
ly
Changes of dwellings newly started Changes of dwellings under construction
China Urban Land and Housing in the 21st Century, HK Dec.2007
32
Assessing Housing Affordability in Shanghai

China Urban Land and Housing in the 21st Century, HK Dec.2007
33
The concept and methodology of housing affordability
The meaning of “housing affordability” still remains virtually unclear
The popular price-to-income ratio or its alternative forms: logical weakness
The residual income approach: cares whether the income after housing expenditures falls below the level of shelter poverty or housing-induced poverty.

China Urban Land and Housing in the 21st Century, HK Dec.2007
34
Applying the static price-to-income ratio
Shanghai households’ income and expenditure structure (cf. Table 5): high-income is 5 times of low-income
The Ratio of House Price to Income (in 2004): Take the average sale price 6,385 RMB/sqm and floor size of 9
0 sqm, a typical housing costs 574,650 RMB Times of Low-income total family disposable income: lowest 2
0%, 25; lowest 20-40%: 18; 40-60% income: 13; 60-80% income: 10; highest 20%: 6; Average: 11.
Large disparity in home buying capability Nearly 60% no chance to borrow a mortgage Worsening trend in the home affordability for the mass populac
e since 1999, but not for top rich

China Urban Land and Housing in the 21st Century, HK Dec.2007
35
The static price-to-income ratio indicator in Shanghai, 1995-2006, by income category
YearMean Bottom
10%10-20% 20-40% 40-60% 60-80% 80-90% Top 10%
1995 9.99 21.32 16.20 13.73 11.26 9.28 7.41 5.39
1996 10.73 22.36 17.40 14.71 11.90 9.68 8.04 5.73
1997 10.01 21.26 16.15 13.39 10.92 8.98 7.33 5.45
1998 10.05 21.88 16.14 13.47 11.16 9.08 7.49 5.52
1999 8.29 15.72 12.96 11.48 9.01 7.72 6.28 3.96
2000 8.40 14.84 13.76 10.88 9.29 7.64 6.29 4.33
2001 8.52 16.50 14.06 12.60 10.04 7.79 6.23 3.75
2002 9.84 20.21 16.86 14.12 11.06 9.12 7.47 4.28
2003 10.10 24.02 19.16 15.99 11.72 9.30 7.06 4.34
Bottom 20% 20-40% 40-60% 60-80% Top 20%
2004 11.33 24.80 17.90 13.32 9.89 5.842005 10.74 24.45 16.59 12.91 9.56 5.53
2006 10.15 22.77 15.66 12.80 9.09 5.08
China Urban Land and Housing in the 21st Century, HK Dec.2007
36
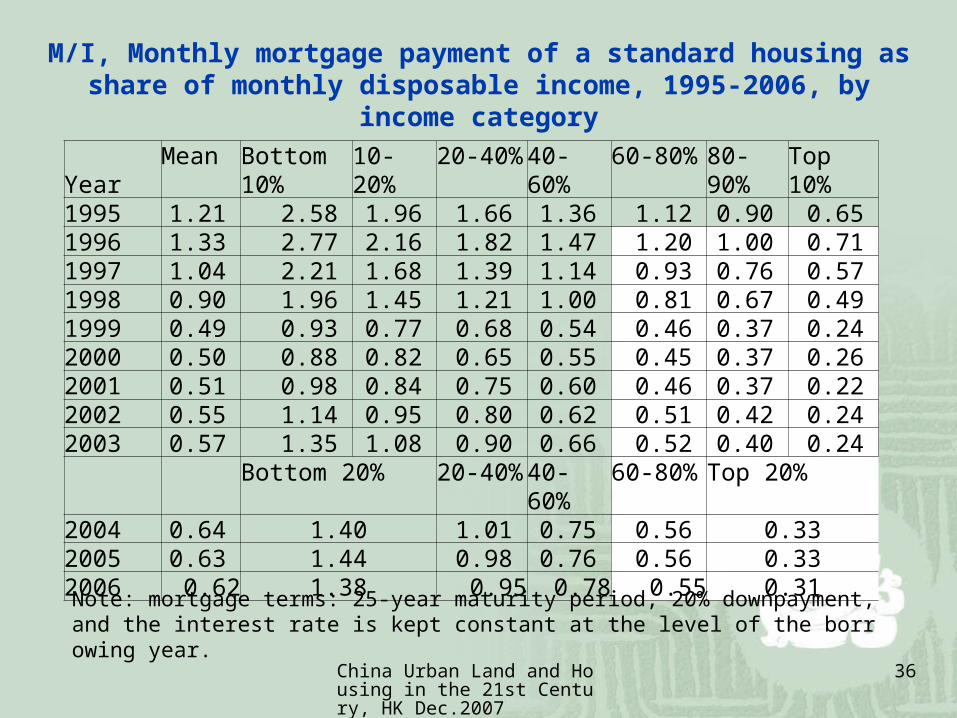
M/I, Monthly mortgage payment of a standard housing as share of monthly disposable income, 1995-2006, by income category
YearMean Bottom
10%10-20% 20-40% 40-60% 60-80% 80-90% Top 10%
1995 1.21 2.58 1.96 1.66 1.36 1.12 0.90 0.65 1996 1.33 2.77 2.16 1.82 1.47 1.20 1.00 0.71 1997 1.04 2.21 1.68 1.39 1.14 0.93 0.76 0.57 1998 0.90 1.96 1.45 1.21 1.00 0.81 0.67 0.49 1999 0.49 0.93 0.77 0.68 0.54 0.46 0.37 0.24 2000 0.50 0.88 0.82 0.65 0.55 0.45 0.37 0.26 2001 0.51 0.98 0.84 0.75 0.60 0.46 0.37 0.22 2002 0.55 1.14 0.95 0.80 0.62 0.51 0.42 0.24 2003 0.57 1.35 1.08 0.90 0.66 0.52 0.40 0.24
Bottom 20% 20-40% 40-60% 60-80% Top 20%
2004 0.64 1.40 1.01 0.75 0.56 0.332005 0.63 1.44 0.98 0.76 0.56 0.332006 0.62 1.38 0.95 0.78 0.55 0.31
Note: mortgage terms: 25-year maturity period, 20% downpayment, and the interest rate is kept constant at the level of the borrowing year.

China Urban Land and Housing in the 21st Century, HK Dec.2007
37
Housing affordability and supply mismatch
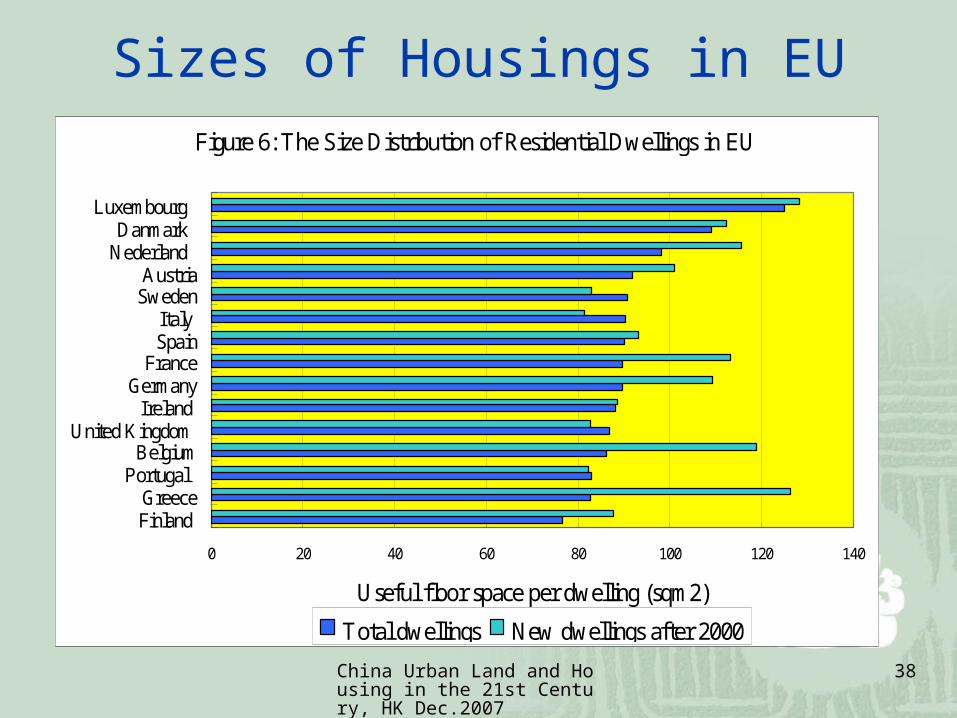
Very few small-sized new residential housings in the Shanghai housing market.
In 2003, for the whole city, less than 8% new dwellings sold were with the construction floor space less than 90 sqm.
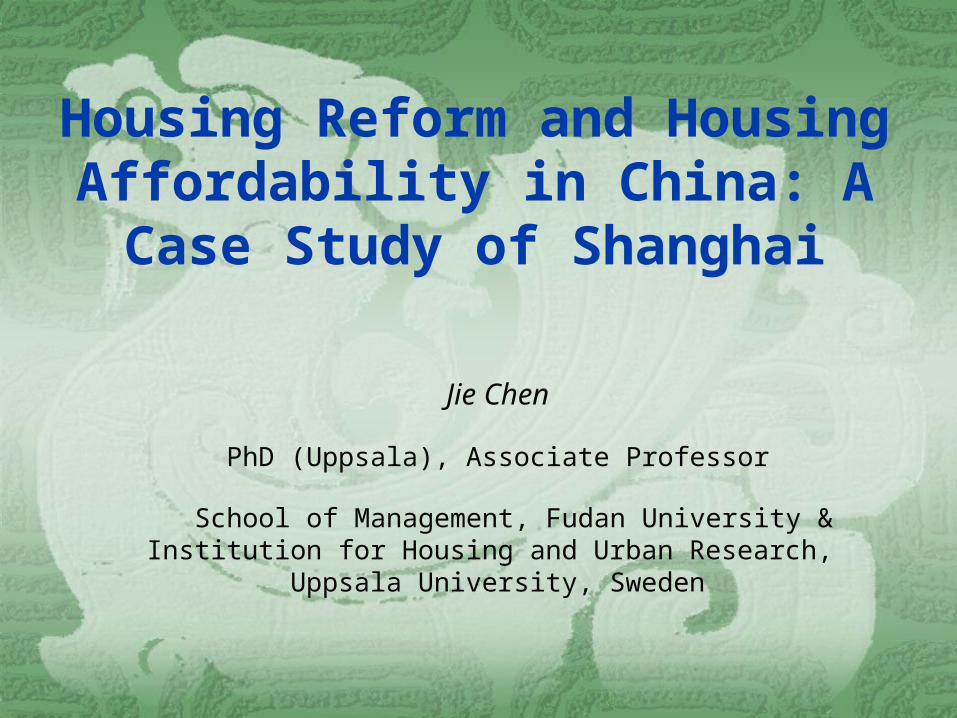
New housings are larger than most EU countries
The size distribution of new residential dwelling sold in Shanghai (2003, construction space, sqm)
Locationbelow
90 m2
90-110 m2
110-130 m2
130-150 m2
150 m2
above
All city 7.38 20.42 22.58 24.58 23.16
Inner circle 13.82 10.17 21.33 19.99 34.69
Inner-outer circle
6.39 23.29 24.7 24.36 21.26
Outer-circle 4.94 22.66 20.61 27.51 24.29
China Urban Land and Housing in the 21st Century, HK Dec.2007
38
Figure 6: The Size Distribution of Residential Dwellings in EU
0 20 40 60 80 100 120 140
Finland Greece
Portugal Belgium
United Kingdom Ireland
GermanyFrance
SpainItaly
SwedenAustria
Nederland Danmark
Luxembourg
Useful floor space per dwelling (sqm2)
Total dwellings New dwellings after 2000
Sizes of Housings in EU

China Urban Land and Housing in the 21st Century, HK Dec.2007
39
The dynamic price-to-income ratioBetween 1995 and 2005, the mean housing price in
Shanghai increased 270%. But the real disposable income per capita during
same period increased 214%, roughly matchable. However, the income disparity between different
groups is widening.Recalculate the price-to-income ratio by simulating
households bought homes at earlier years and their incomes keep growing.
The housing costs are fixed but income grows. The affordability will improve as the economy improves.

China Urban Land and Housing in the 21st Century, HK Dec.2007
40
Fig.6. The income growth of Shanghai residents by income group, 1990-2003
0
5000
10000
15000
20000
25000
30000
35000
40000
1990 1991 1992 1993 1994 1995 1996 1997 1998 1999 2000 2001 2002 2003
Disp
osab
le in
com
e per
capi
ta, R
MB
lowest 10% 10-20% 20-40% 40-60% 60-80% 80-90% highest 10%
Note: Disposable income per capita in Shanghai 2004-2005, by income categoryYear 2004: bottom 20%, 7065; 20%-40%, 10664; 40%-60%, 14149; 60%-80%, 19371; Top 20%, 34404; Year 2005: bottom 20%, 7851; 20%-40%, 11800; 40%-60%, 15668; 60%-80%, 21313; Top 20%, 37722.

China Urban Land and Housing in the 21st Century, HK Dec.2007
41
The price-to-income ratios dynamically simulated for households bought home in 1995
Year Mean Bottom 10% 10-20% 20-40% 40-60% 60-80% 80-90% Top 10%
1995 9.99 21.32 16.20 13.73 11.26 9.28 7.41 5.391996 8.90 18.55 14.44 12.20 9.87 8.03 6.67 4.751997 8.58 18.21 13.84 11.48 9.36 7.69 6.28 4.671998 8.22 17.91 13.21 11.02 9.14 7.43 6.13 4.521999 6.62 12.56 10.35 9.16 7.19 6.17 5.02 3.162000 6.26 11.05 10.25 8.11 6.92 5.69 4.68 3.222001 5.77 11.17 9.52 8.53 6.80 5.27 4.22 2.542002 5.80 11.92 9.94 8.33 6.52 5.38 4.40 2.532003 5.01 11.92 9.51 7.94 5.82 4.62 3.50 2.15
Bottom 20% 20-40% 40-60% 60-80% Top 20%2004 4.40 9.62 6.95 5.17 3.84 2.272005 3.97 9.04 6.13 4.77 3.53 2.042006 3.57 8.01 5.51 4.51 3.20 1.79

China Urban Land and Housing in the 21st Century, HK Dec.2007
42
(M/I) Monthly mortgage payment as share of monthly disposable income, dynamically simulated for households bought homes in 1999
Note: The mortgage is assumed for 80% value of a mean-priced home, 25-year maturity period and the interest rate is kept constant at 5.58%, the level in 1999.
Year Mean Bottom 10% 10-20% 20-40% 40-60% 60-80% 80-90% Top 10%
1999 0.49 0.93 0.77 0.68 0.54 0.46 0.37 0.24
2000 0.47 0.82 0.76 0.60 0.51 0.42 0.35 0.24
2001 0.43 0.83 0.71 0.63 0.51 0.39 0.31 0.19
2002 0.43 0.89 0.74 0.62 0.49 0.40 0.33 0.19
2003 0.37 0.89 0.71 0.59 0.43 0.34 0.26 0.16
Bottom 20% 20-40% 40-60% 60-80% Top 20%
2004 0.33 0.72 0.52 0.38 0.29 0.17
2005 0.30 0.67 0.46 0.36 0.26 0.15
2006 0.27 0.60 0.41 0.34 0.24 0.13

China Urban Land and Housing in the 21st Century, HK Dec.2007
43
The price-to-income ratio approach: for homes bought at 2002
Year Mean Bottom10% 10-20%
20-40%40-60%60-80%80-90%
Top 10%
2002 9.84 20.21 16.86 14.12 11.06 9.12 7.47 4.28 2003 8.50 20.22 16.13 13.46 9.87 7.83 5.94 3.65
Bottom 20% Top 20%
2004 7.45 16.31 11.78 8.76 6.50 3.842005 6.76
Monthly mortgage payment as share of monthly disposable income, for homes bought at 20022002 0.63 1.30 1.08 0.91 0.71 0.59 0.48 0.27 2003 0.55 1.30 1.04 0.86 0.63 0.50 0.38 0.23
Bottom 20% Top 20%
2004 0.48 1.05 0.76 0.56 0.42 0.252005 0.43

China Urban Land and Housing in the 21st Century, HK Dec.2007
44
The residual-income approach
Measuring whether the money remained after deducting the standard housing expenditures is sufficient to satisfy basic living needs
When the after-housing residual income could not satisfy basic needs, this is defined as housing-induced poverty.
The housing-induced poverty line is defined from the non-shelter consumption expenditure of the bottom 20% income group in each year.

China Urban Land and Housing in the 21st Century, HK Dec.2007
45
Income and Expenditure Structure of Shanghai Households in 2004
Item AverageLow Income
Households
Lower Middle Income Households
Middle Income Households
Upper Middle Income Households
HighIncomeHouseholds
Household size 3.04 3.28 3.01 3.05 3.00 2.86
Total annual family disposable income (RMB)
50716 23173 32099 43154 58113 98395
Annual disposable income per capita
16683 7065 10664 14149 19371 34404
#Income From Wages 11422 4804 7511 10078 15220 30257
Property Income 215 49 72 193 240 560
Renting 1057 860 801 3929
Ratio of renting (% ) 5.71 0 0 5.54 3.72 10.2
Actual Expenditures per capita (RMB)
20272 7671 10563 17287 21517 47526
#Expenditures on Purchasing and Building Houses
4651 98 137 3394 4140 16808
Share in total(%) 22.94 1.28 1.3 19.63 19.24 35.37
Living Expenditure 12631 6684 8814 11646 13753 23629
#Residence directly related 1327 719 812 1405 1262 2580
Share in living exp(%) 10.51 10.76 9.21 12.06 9.18 10.92

China Urban Land and Housing in the 21st Century, HK Dec.2007
46
Housing expenditures as share of consumption expenditures (%) in Shanghai, 2000-2005
Year Mean Bottom 10% 10-20% 20-40% 40-60% 60-80% 80-90% Top 10%
2000 Share 1 5.18 6.76 6.23 5.71 5.30 4.67 4.55 4.38
Share 2 8.73 11.52 10.35 9.70 7.42 8.00 7.89 8.97
2001 Share 1 5.43 6.86 6.26 6.20 5.90 5.12 4.74 4.06
Share 2 7.85 8.39 8.56 8.05 7.64 6.53 7.03 9.75
2002 Share 1 5.29 6.46 5.90 5.84 5.73 5.13 4.95 3.91
Share 2 11.36 8.86 11.49 12.00 10.76 8.95 9.85 16.23
2003 Share 1 4.92 6.49 6.64 5.81 5.07 4.70 4.59 3.73Share 2 11.59 10.04 10.57 9.70 8.40 13.11 13.30 10.44
Bottom 20% 20-40% 40-60% 60-80% Top 20%
2004 Share 1 5.39 6.70 6.49 5.59 5.42 4.41
Share 2 10.51 10.76 9.21 12.06 9.18 10.92
2005 Share 1 5.31 6.46 6.39 6.10 5.19 4.17Share 2 10.25 11.68 10.94 8.28 10.94 10.01
Note: share1 = maintenance /consumption expenditures; share2 = Living/consumption expenditures.
China Urban Land and Housing in the 21st Century, HK Dec.2007
47
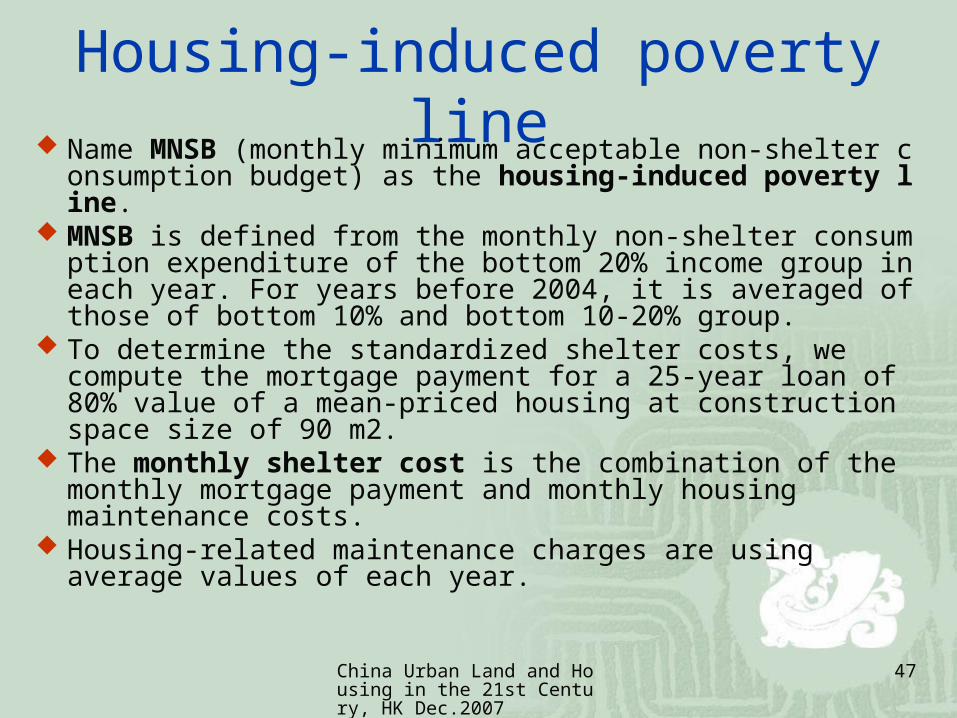
Housing-induced poverty line Name MNSB (monthly minimum acceptable non-shelter consum
ption budget) as the housing-induced poverty line. MNSB is defined from the monthly non-shelter consumption exp
enditure of the bottom 20% income group in each year. For years before 2004, it is averaged of those of bottom 10% and bottom 10-20% group.
To determine the standardized shelter costs, we compute the mortgage payment for a 25-year loan of 80% value of a mean-priced housing at construction space size of 90 m2.
The monthly shelter cost is the combination of the monthly mortgage payment and monthly housing maintenance costs.
Housing-related maintenance charges are using average values of each year.
China Urban Land and Housing in the 21st Century, HK Dec.2007
48
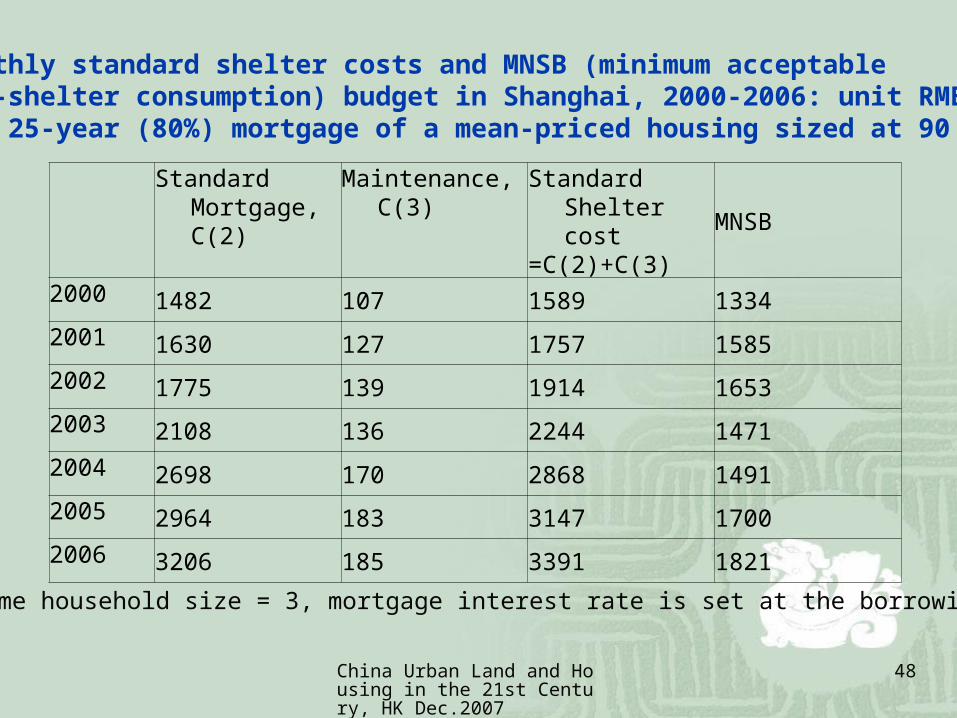
Monthly standard shelter costs and MNSB (minimum acceptable non-shelter consumption) budget in Shanghai, 2000-2006: unit RMB,for 25-year (80%) mortgage of a mean-priced housing sized at 90 m2.
Note: assume household size = 3, mortgage interest rate is set at the borrowing year
Standard Mortgage, C(2)
Maintenance, C(3) Standard Shelter cost
=C(2)+C(3)MNSB
2000 1482 107 1589 1334
2001 1630 127 1757 1585
2002 1775 139 1914 1653
2003 2108 136 2244 1471
2004 2698 170 2868 1491
2005 2964 183 3147 1700
2006 3206 185 3391 1821

China Urban Land and Housing in the 21st Century, HK Dec.2007
49
Housing-induced poverty incidences in Shanghai, 2000-2006
The numbers are what the after-shelter incomes -MNSB. If negative, as those numbers with parentheses, the households are falling in housing-induced poverty.
Year Mean Bottom 10%
10-20% 20-40% 40-60% 60-80% 80-90% Top 10%
2000 46 (1241) (1109) (630) (237) 344 1044 2841
2001 (121) (1679) (1391) (1164) (609) 180 1061 3980
2002 (364) (2008) (1698) (1336) (717) (113) 652 3785
2003 (10) (2156) (1762) (1375) (522) 308 1587 4916
Bottom 20% 20-40% 40-60% 60-80% Top 20%
2004 (133) (2428) (1685) (763) 483 3840
2005 (170) (2792) (1818) (956) 411 4238
2006 (11) (2894) (1842) (1088) 594 5187

China Urban Land and Housing in the 21st Century, HK Dec.2007
50
Maximum affordable housing costs in Shanghai 2000-2005Year Mean Bottom
10%10-20% 20-40% 40-60% 60-80% 80-90% Top
10%2000 1635 348 480 958 1351 1932 2633 4430
2001 1636 78 366 593 1148 1937 2818 5737
2002 1549 (94) 216 578 1196 1800 2566 5699
2003 2234 88 482 869 1722 2552 3830 7159
Bottom 20% 20-40% 40-60% 60-80% Top 20%
2004 2735 440 1184 2105 3352 6708
2005 2977 355 1329 2191 3557 7385
Maximum affordable housing cost, the which level below a household will not fall in the housing-induced poverty after paying their housing costs.

China Urban Land and Housing in the 21st Century, HK Dec.2007
51
Further Studies Needed Housing purchase power crisis ≠housing affordability crisis; Peculiarly, home price growth is largely uncorrelated with
rents in Shanghai Rental housing affordable by most (but barely for low-income) Most Shanghai residents actually own their homes free and
clear, obtained at discounted prices when the massive transfer of public housings in late 1990s
The most urgent pressure is placed on the young people and inter-city migrating people

China Urban Land and Housing in the 21st Century, HK Dec.2007
52
The homeowner-ship ratio in urban China and Shanghai
Fi gure 8: Esti mated Homeownershi p Rati o i n Chi na (2004)
9397
85
59
82
73
14
40
18
0
10
20
30
40
50
60
70
80
90
100
Nati onal Rural Urban Bei j i ng Shanghai
OwnRent
Data source: Gallup survey data (2005)
China Urban Land and Housing in the 21st Century, HK Dec.2007
53
Housing Affordability and Housing Inequality
Old welfare housing system: no affordability issue but inequality based on occupation and political reasons
Housing reform recognized the old housing inequalityHousing market: housing affordability and new housing
inequalityHousing inequality is not only the outcome but also one
reason for socioeconomic inequalityPolicy dilemma: should we encourage the poor to be ho
meowners at any cost?

China Urban Land and Housing in the 21st Century, HK Dec.2007
54
Conclusions The restructuring of China housing system, is
basically smooth and successfully. But the market could not solve the problem of distrib
ution: the benefits of reform are not distributed evenly and large disparity in the home buying capability
Housing affordability has become an urgent urban issue, esp. for the low-income group.
More flexible financial instruments and innovations in housing finance system are warranted.
However, market could not be the solution to all’s housing needs.
The government should provide different solutions to different groups.

China Urban Land and Housing in the 21st Century, HK Dec.2007
55
Thank you all!
Recommended