House Finance Committee January 29, 2015
2
November briefing covered FY 2014 closing, overall fiscal situation for current year, budget and out-years Economy Projections
Today’s briefing will recap and update those issues and discuss budget process

3
Additional briefings will consider specific expenditure areas in depth Medicaid and Human Services Personnel Expenses Local Aid and other items of interest
Governor’s FY 2016 and FY 2015 revised budgets due by law February 5 – submission anticipated March 12
State budgetary problems persist and this will be another challenging year
Overall fiscal situation for current year, budget and out-years Economy Projections Issues
4

House Fiscal Staff Estimates Use November revenue and caseload
conference estimates Use first quarter reports from agencies,
Budget Office Q1, and staff estimates for FY 2015 Staff estimates for FY 2016 and beyond Estimates vary – this is HFAS perspective
5

Preliminary Closing – Aug 30 Agency Q1 reports – Oct 30 Caseload estimates – November 5 Revenue estimates – November 10 Budget Office Q1 report – Nov 17 Audited Closing – December 30 Agencies Q2 – Jan 30 Governor’s Budget – Feb 5 March 12?
6

The state continues its slow recovery from severe economic distress
Current year picture is clearer and more challenging than recent years with close to $30 million shortfall
Facing continued budget year and out-year issues growing from about $186.5 million to over $460 million
7

The current year has overspending problems The budget and out year gaps are a
function of both cyclical economic and continued and worsening structural issues
8

Economic Forecast

Revenue Estimating Conference adopts a consensus economic forecast It takes testimony from Moody’s
Economy.com The firm builds U.S. macroeconomic models
from which they derive their Rhode Island forecasts Updated in November will do again in May
10

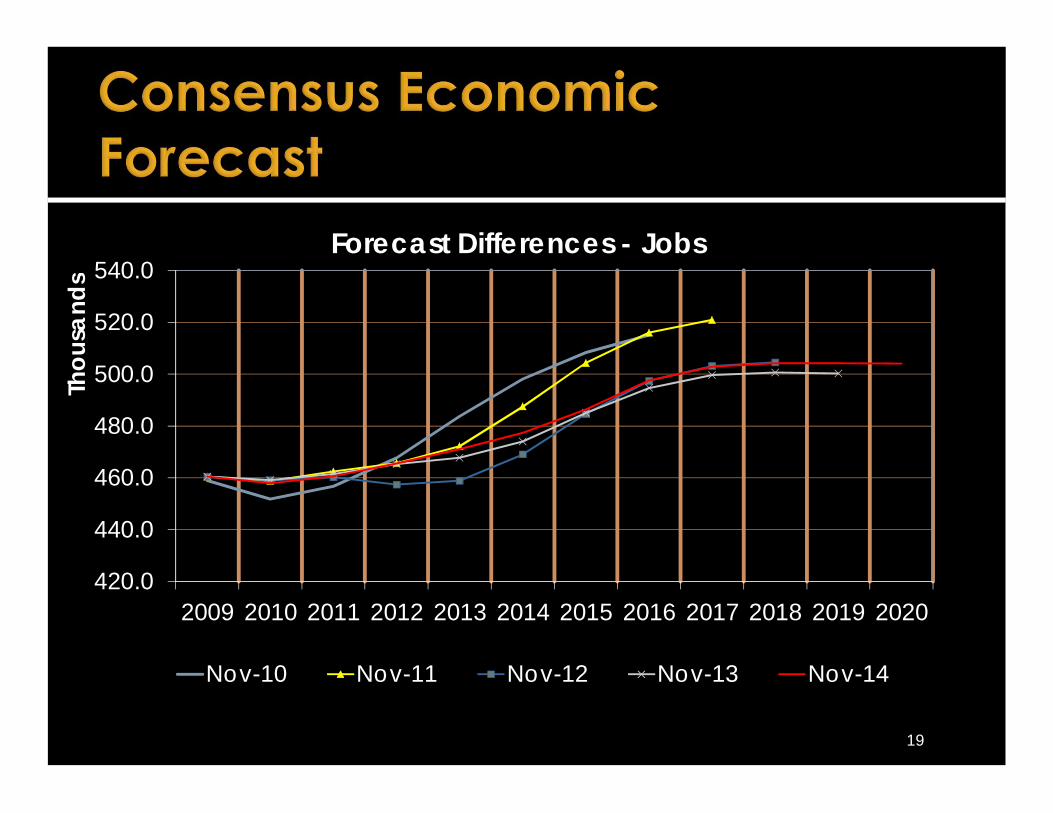
November forecast more pessimistic than May 2014 forecast
Personal income, jobs, and wage & salary growth rates all projected to slow FY 2015
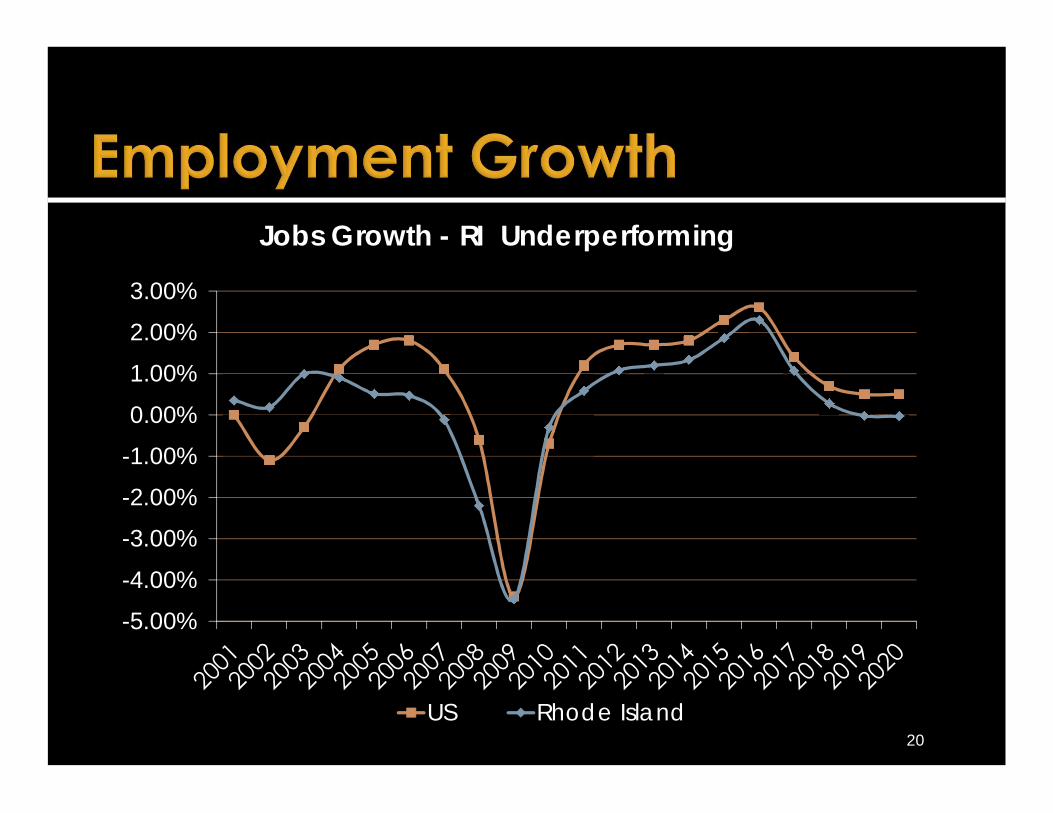
RI recovery continues to lag U.S. Still significant slack in the labor
market
11

460,000
470,000
480,000
490,000
500,000
510,000
520,000
530,000
540,000
550,000
4.0%
5.0%
6.0%
7.0%
8.0%
9.0%
10.0%
11.0%
12.0%
13.0%
Unemployment Rate and Total JobsDecember 2006 – December 2014

Dec. 2006 - 577k in workforce (peak) 28,272 – 4.9% unemployed
March 2010 – 574k in the workforce 68,079 - 11.9% unemployed
Dec. 2014 – 553k in the workforce 37,313 - 6.8% Unemployed 33,559 fewer employed than start of
recession Jobs regained not as good as ones lost
13
14
-2% 3% 8% 13%
High Wage Tier
Mid Wage Tier
Low Wage Tier
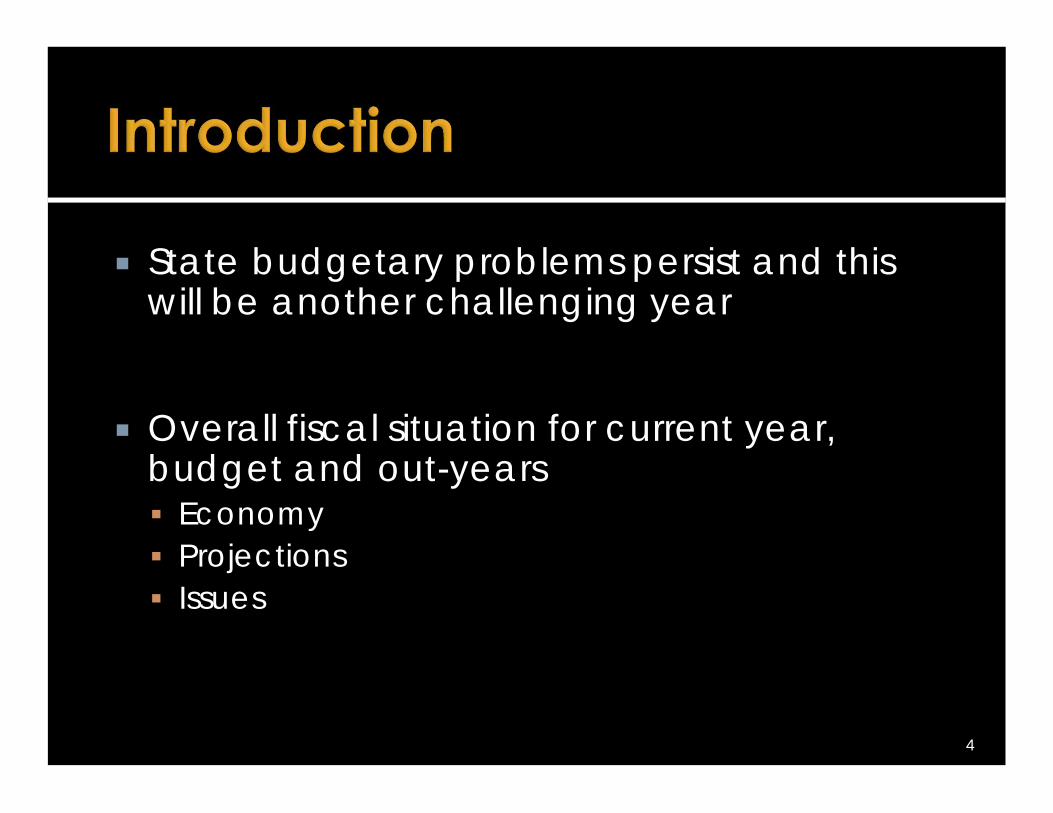
Recovered Jobs by Wage Tier Nov 2014 Testimony
ProvidenceMetro percentincrease sinceJune 2009U.S. percentincrease sinceJune 2009
Sources: BLS, Moody’s Analytics

Workforce Employed UnemployedDec 2006 577,158 548,886 28,272 4.9%Mar 2010 573,930 505,851 68,079 11.9%Sept 2014 555,771 513,446 42,325 7.6%Dec 2014 552,640 515,327 37,313 6.8%12/14 vs 12/6 (24,518) (33,559) 9,041 1.9%12/14 vs 3/10 (21,290) 9,476 (30,766) (5.1%)Source: DLT Labor Market information
15
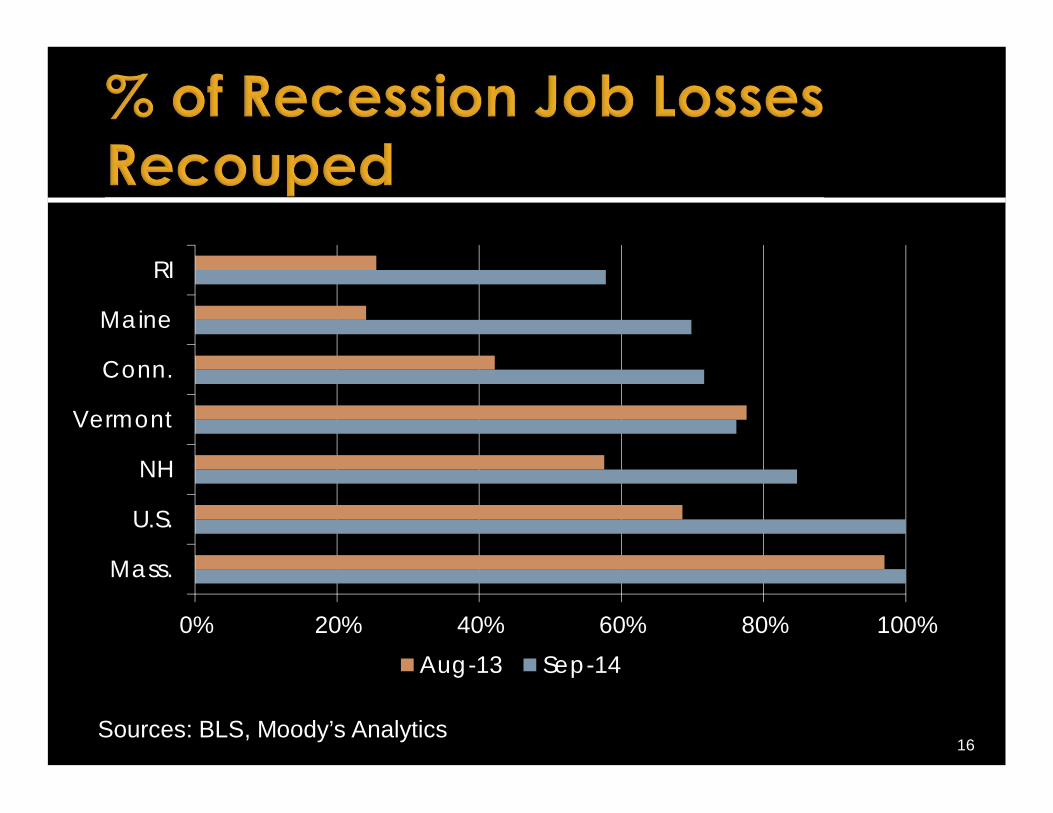
0% 20% 40% 60% 80% 100%
Mass.
U.S.
NH
Vermont
Conn.
Maine
RI
Aug-13 Sep-14
16Sources: BLS, Moody’s Analytics

UnemploymentRates
U.S. Average
New England Average
Rhode Island
Dec 2006 4.4% 4.5% 4.9%Mar 2010 9.9% 8.7% 11.9%Sept 2014 5.9% 6.0% 7.6%Dec 2014 5.6% 5.6% 6.8%12/14 vs 12/06 1.2% 1.1% 1.9%12/14 vs 3/10 (4.3%) (3.1%) (5.1%)Source: DLT Labor Market information
17
Recovery again slower than prior projections 4th consecutive overall downward revision US Economy more structurally impacted
by recession than previous estimates RI economy continues to under-perform
compared to US as a whole and closest neighbors
18
420.0
440.0
460.0
480.0
500.0
520.0
540.0
2009 2010 2011 2012 2013 2014 2015 2016 2017 2018 2019 2020
Thou
sand
s
Forecast Differences - Jobs
Nov-10 Nov-11 Nov-12 Nov-13 Nov-14
19
-5.00%
-4.00%
-3.00%
-2.00%
-1.00%
0.00%
1.00%
2.00%
3.00%
Jobs Growth - RI Underperforming
US Rhode Island20

0.0%
2.0%
4.0%
6.0%
8.0%
10.0%
12.0%
2001 2003 2005 2007 2009 2011 2013 2015 2017 2019
RI has Consistently Higher Unemployment
US Rhode Island21

-4.0%
-2.0%
0.0%
2.0%
4.0%
6.0%
8.0%
2009 2010 2011 2012 2013 2014 2015 2016 2017 2018 2019 2020
Forecast Differences - Personal Income Growth
Nov-10 Nov-11 Nov-12 Nov-13 Nov-14
22
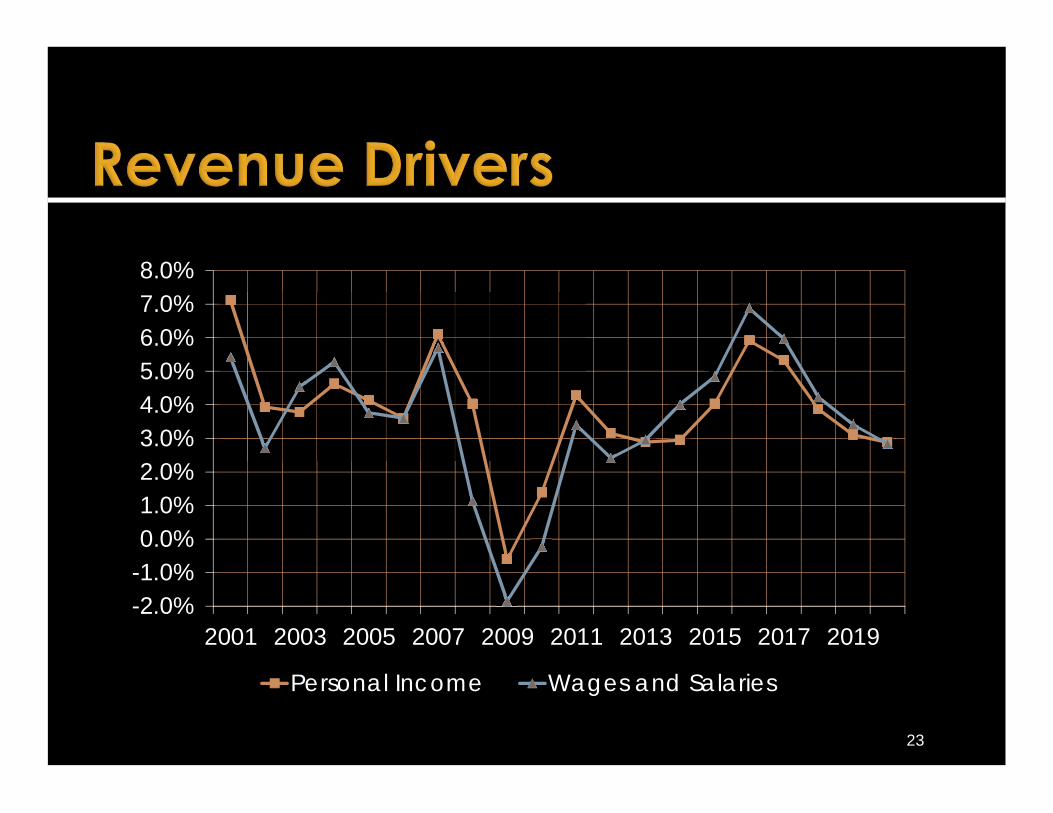
-2.0%-1.0%0.0%1.0%2.0%3.0%4.0%5.0%6.0%7.0%8.0%
2001 2003 2005 2007 2009 2011 2013 2015 2017 2019
Personal Income Wages and Salaries
23

Projections
Revenue estimates are driven by trends, collections to date, and the economic forecasts FY 2014 were more than anticipated▪ All excess revenues sent to retirement system
Projections assume losses from gaming in Massachusetts in FY 2016
25

Taxes in FY 2015 = $2,757.5 million $77.0 million or 2.9% above FY 2014 actuals $18.5 million above the enacted estimate▪ $25.9 million is from Income and Sales
Taxes in FY 2016 = $2,836.9 million 2.9% increase to FY 2015 revised▪ $79.4 million with $93.9 million from Income and
Sales
26

(in millions)
FY 2014 Prelim
FY 2015 Rev. Est.
Change to
Enacted
FY 2016Estimate
Change to FY 2015 Rev. Est.
Personal Income $1,115.5 $1,167.7 $10.6 $1,216.6 $48.9Business Taxes 385.6 391.7 (10.7) 403.4 11.7Sales & Use Taxes 1,126.7 1,161.2 18.3 1,187.3 26.1Other Taxes 52.7 36.9 0.3 29.6 (7.3)
Total Taxes $2,680.5 $2,757.5 $18.5 $2,836.9 $79.4Departmental 360.3 349.3 (2.4) 199.3 (150.0)Other Misc. 6.4 7.8 0.3 1.1 (6.7)Lottery 376.3 383.3 (1.2) 334.8 (48.5)Unclaimed Prop. 12.7 11.0 0.5 8.1 (2.9)
Total $3,436.3 $3,508.9 $15.8 $3,380.2 $(128.7)
27

$600$700$800$900
$1,000$1,100$1,200$1,300$1,400$1,500
FY2002
FY2004
FY2006
FY2008
FY2010
FY2012
FY2014
FY2016
FY2018Proj.
FY2020Proj.
PIT Sales28

Lottery Revenues – first major decline has been estimated for FY 2016
FY 2014 FY 2015 FY 2016Games $ 58.1 $ 56.5 $ 56.5VLT (Slots) 306.5 314.9 266.1
Table Games 11.7 11.9 12.2Total $376.3 $383.3 $334.8Y-O-Y % (-0.8)% 1.9% (-12.7)%
29
FY 2015 budget counted on surplus from FY 2014 to help fund FY 2015
Preliminary FY 2014 data showed $8.7 million gain to that assumption Subject to audit adjustment before final
Audited data $8.6 million Revenues had bigger revision – impacting
retirement transfer only30

Enacted Current Diff.Opening $ 111.2 $111.2 $ 0.0Revenues 3,416.0 3,436.3 20.3 Rainy Day (105.6) (106.2) (0.6)Expenditures* (3,352.4) (3,336.3) 16.1Closing Surplus 59.2 95.0 35.8 Reappropriation - (7.4) (7.4)Txfer: Retirement (19.7) (19.7)
Free Surplus $ 59.2 $ 68.0 $ 8.7*Includes $10 million transfer to accelerated depr. fund
31
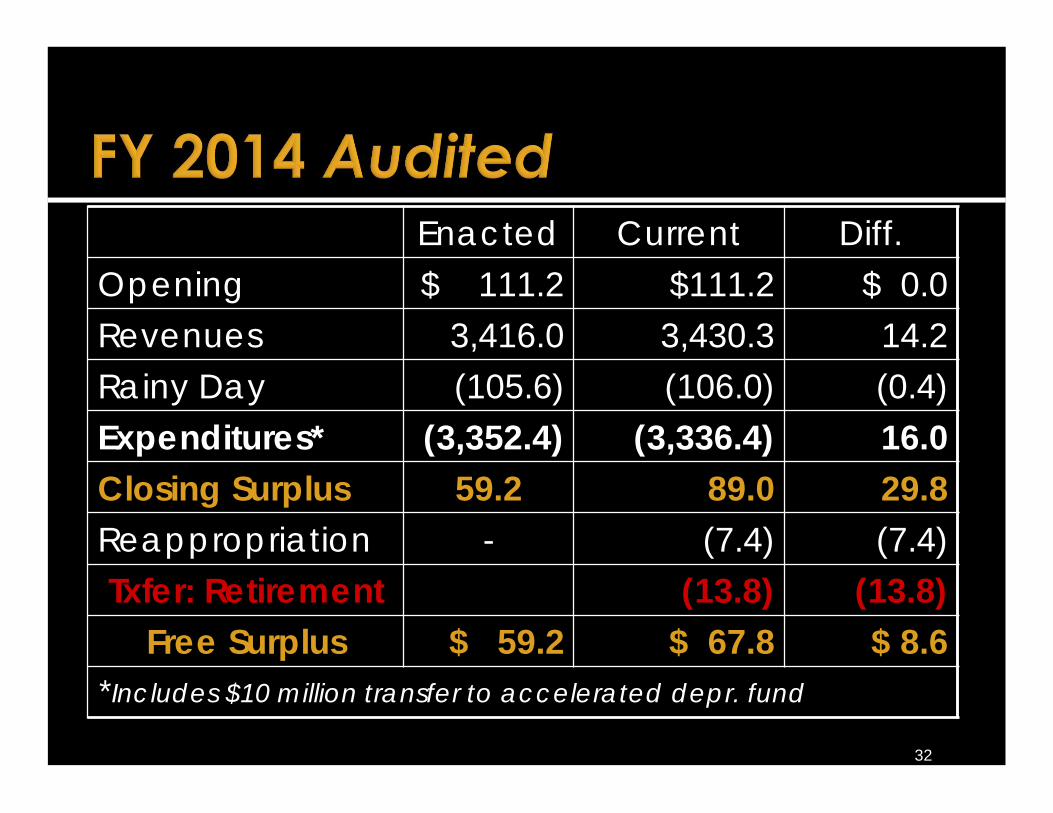
Enacted Current Diff.Opening $ 111.2 $111.2 $ 0.0Revenues 3,416.0 3,430.3 14.2 Rainy Day (105.6) (106.0) (0.4)Expenditures* (3,352.4) (3,336.4) 16.0Closing Surplus 59.2 89.0 29.8 Reappropriation - (7.4) (7.4)Txfer: Retirement (13.8) (13.8)
Free Surplus $ 59.2 $ 67.8 $ 8.6*Includes $10 million transfer to accelerated depr. fund
32
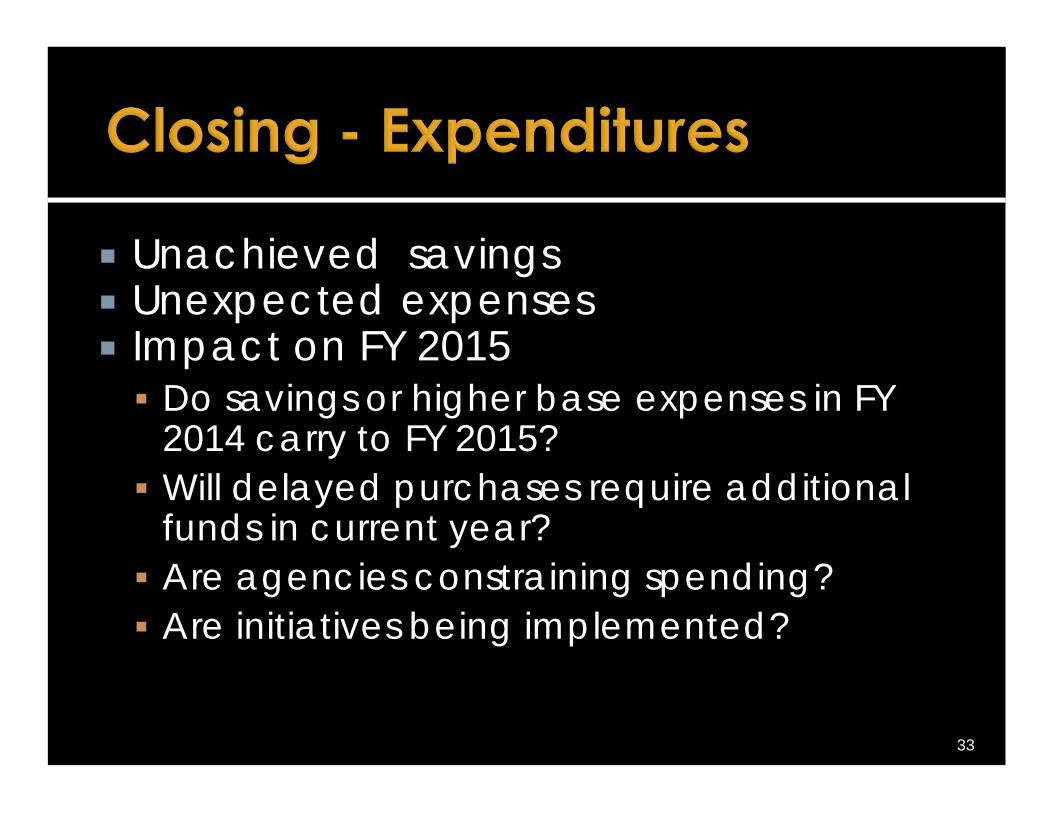
Unachieved savings Unexpected expenses Impact on FY 2015 Do savings or higher base expenses in FY
2014 carry to FY 2015? Will delayed purchases require additional
funds in current year? Are agencies constraining spending? Are initiatives being implemented?
33
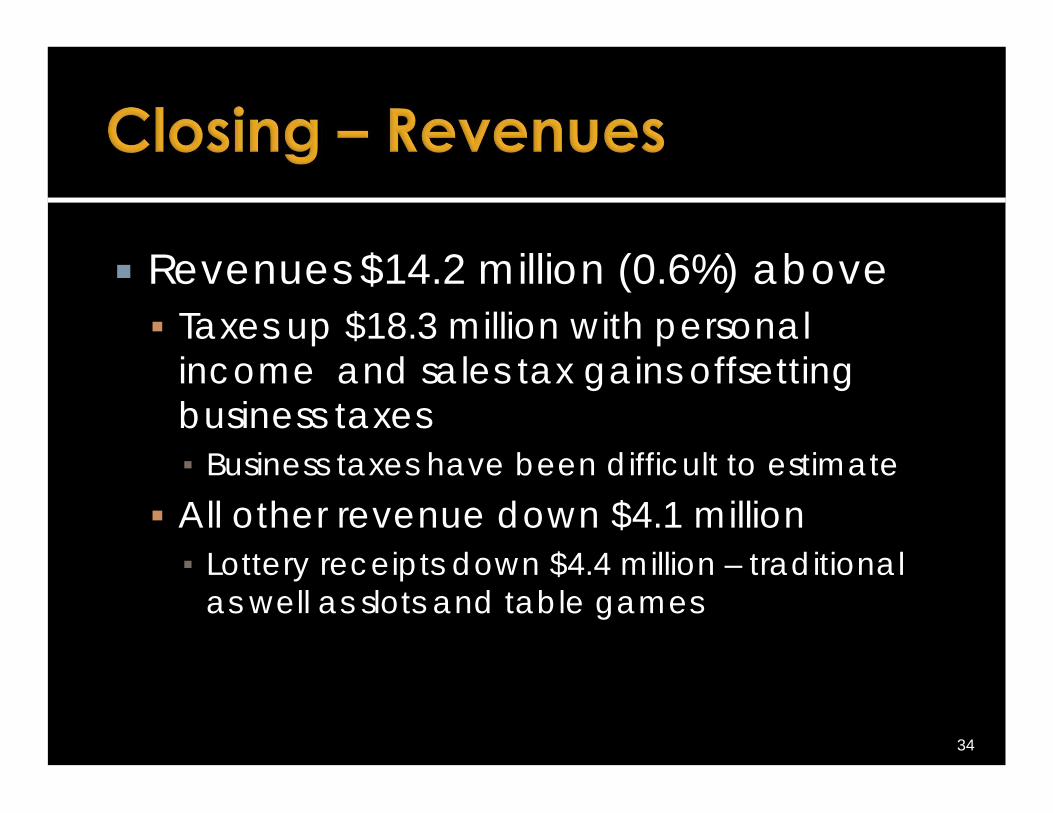
Revenues $14.2 million (0.6%) above Taxes up $18.3 million with personal
income and sales tax gains offsetting business taxes▪ Business taxes have been difficult to estimate
All other revenue down $4.1 million▪ Lottery receipts down $4.4 million – traditional
as well as slots and table games
34

Revenues $14.2 million more Law requires final revenues above
estimates be transferred to the Employees’ Retirement System to pay down unfunded liability Transfer = $13.8 million which is net of 3%
transfer to rainy day fund Prior year transfers $0.2 million in FY 2013 $12.5 million in FY 2012
35

General revenue spending $16.0 million (0.5%) below budgeted amounts – but areas of overspending 5 agencies overspent when undistributed
COLA funding is considered Appropriation lines overspent even if
agency totals were not 31% of general revenue lines were
overspent… Ongoing pattern not completely explained by COLA issue
Last year it was 22%36

Spending $16.0 million below: $7.4 million unspent & re-appropriated $8.8 million Medicaid savings
$2.5 million overspent in DCYF $1.4 million overspent Public Safety $0.8 million overspent in DOC $0.3 million overspent in DEM
37
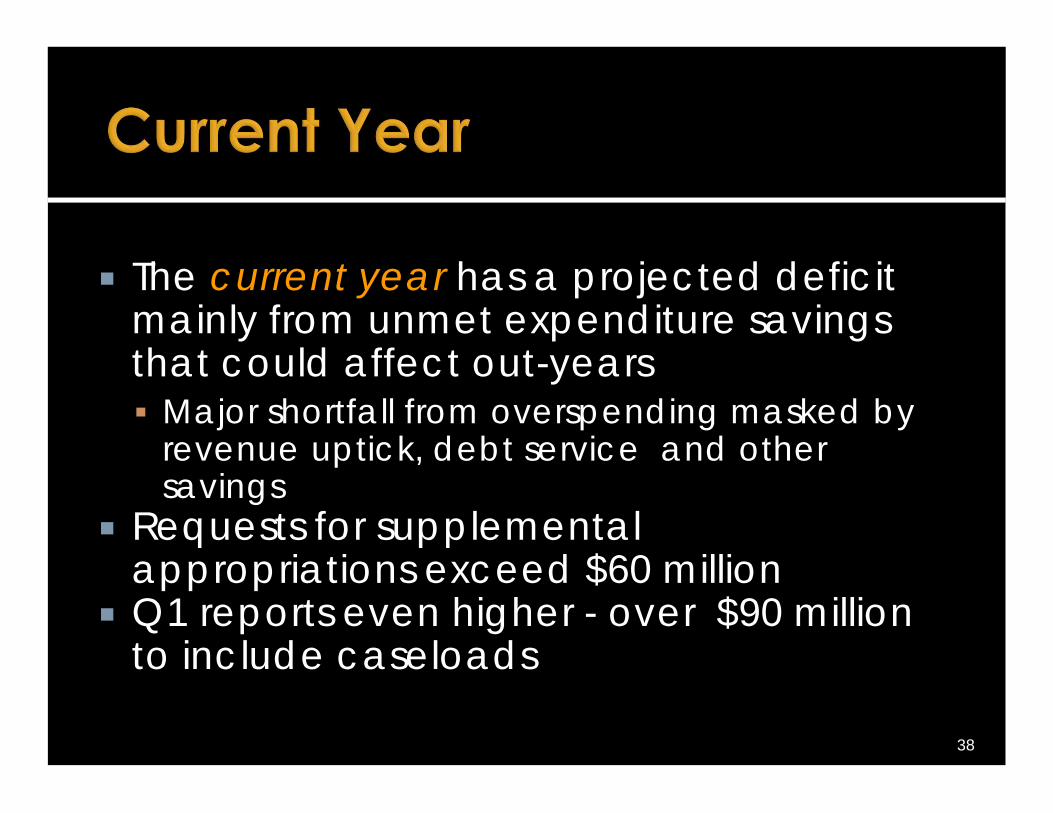
The current year has a projected deficit mainly from unmet expenditure savings that could affect out-years Major shortfall from overspending masked by
revenue uptick, debt service and other savings
Requests for supplemental appropriations exceed $60 million
Q1 reports even higher - over $90 million to include caseloads
38

Most agencies are projecting to spend more than authorized in FY 2015
Corrective action plans required by law submitted after Nov. briefing and reviewed in Dec. follow-up hearing
Budget Office continues to work with agencies on spending issues
39

Enacted Current Diff.
Opening $ 59.2 $75.2 $16.0* Revenues 3,493.1 3,508.9 15.8Rainy Day (106.6) (107.3) (0.7)Expenditures (3,445.2) (3,505.1)* 59.9
Total FY 2015 $ 0.6 ($ 28.3) ($28.8)*Includes $7.4 million reappropriation
40

Revenues are up by $15.8 million Added resources increase rainy day
transfer by $0.7 million Expenditures appear up by $15.5 million
net of re-appropriations and November Caseload increase
Closing surplus down by $28.8 million
41

Reappropriation $ 7.4Legislature (1.1)Employee COLAs 20.2Debt Service (20.4)OHHS: Caseload Conference 37.0OHHS: Other Programs* 11.8Corrections* 5.0Other * -Total $59.9* Items different than Budget Office Q1 estimates 42

Statutory requirement: $4.4 million Legislature rev. budget lowers by $2.0 million
Governor discretionary: $3.0 million I-195 = $0.6 million E-Permitting = $0.5 million AG Tobacco Litigation = $0.4 million DLT Jobs programs= $0.4 million Personnel Study= $0.3 million DOA, DOR, DOH total = $0.7 million
43

Governor’s FY 2015 budget did not include funding for COLAs Most employee contracts expired at the
end of FY 2013 April 2014, Council 94 agreed to a
new 4-year contract July 1, 2013 – June 30, 2017
44

Main provisions of new contract: Increase in co-pays for office visits and
prescription drugs Health insurance deductibles of $250/$500
for individuals/families COLAs▪ April 6, 2014 – 2%▪ October 5, 2014 – 2%▪ October 4, 2015 – 2%
45
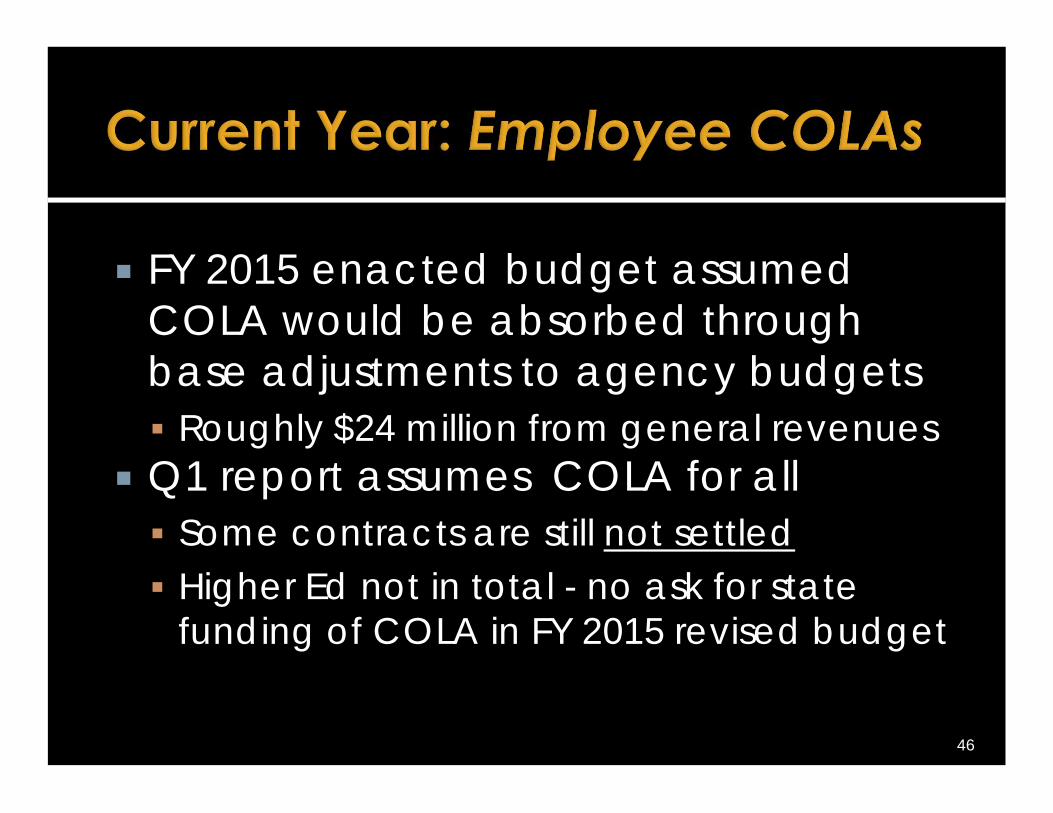
FY 2015 enacted budget assumed COLA would be absorbed through base adjustments to agency budgets Roughly $24 million from general revenues
Q1 report assumes COLA for all Some contracts are still not settled Higher Ed not in total - no ask for state
funding of COLA in FY 2015 revised budget
46

Impact on out-years Some growth in FY 2016 was assumed
from raises but not full impact▪ Full impact estimated at around $47.4 million
from general revenues for all employees Out-year estimates used for deficit
projections assumed about ½ would be absorbed, essentially the FY 2015 value
47

Debt Service - $20.4 million less Historic Tax issuance delay $10.3 million Refunding $5.8 million New Issuance - $4.3 million
48

Nov Caseload Conf. : $37.0 million Medical Assistance - $37.2 million more▪ $12.3 million treatment for Hepatitis C▪ $6.9 million for long term care▪ $6.4 million for managed care▪ $4.8 million for hospital costs▪ $4.6 million more for unachieved savings
Cash Assistance – $0.1 million less
49

Other Programs: $11.8 million UHIP - $4.2 million DCYF – $7.3 million BHDDH – Consent Decree $0.3 million▪ Oversight▪ Training
50

Unified Health Infrastructure Project – UHIP In coordination with the Health Benefits Exchange
to implement ACA Apply through the Exchange & if Medicaid eligible
directed to UHIP Eventually one system to apply for medical and
cash assistance benefits ▪ Opportunity to build a new system with federal match
Replace decades old systems that did not “talk” to each other
51

OHHS/DHS - $4.2 million – UHIP▪ Shortfall based on updated estimates ▪ Match differs based on use▪ 90% match for development costs▪ Other services – 75% to 50% match▪ Plan requires federal approval ▪ $229.6 million; $51.7 m general revenue total
through 2020
52

Is this the final cost for project? Updated plan filed October 2014
What is the net cost when only have one system? Currently funded systems will not be
needed – those savings have not been identified Additional program integrity and personnel
efficiencies Unresolved issue of Exchange funding
impacts this53

DCYF - $7.3 million Still many unknowns and moving parts Agency and Budget estimates appear
inflated but there are clearly major issues System of Care related issues -$5.0 million Foster Care rate Proposal - $1.7 million Caseworker related - $1.0 million Other unachieved savings - $0.3 million Other new expenses - $0.5 million Offsetting savings – ($1.3) million
54
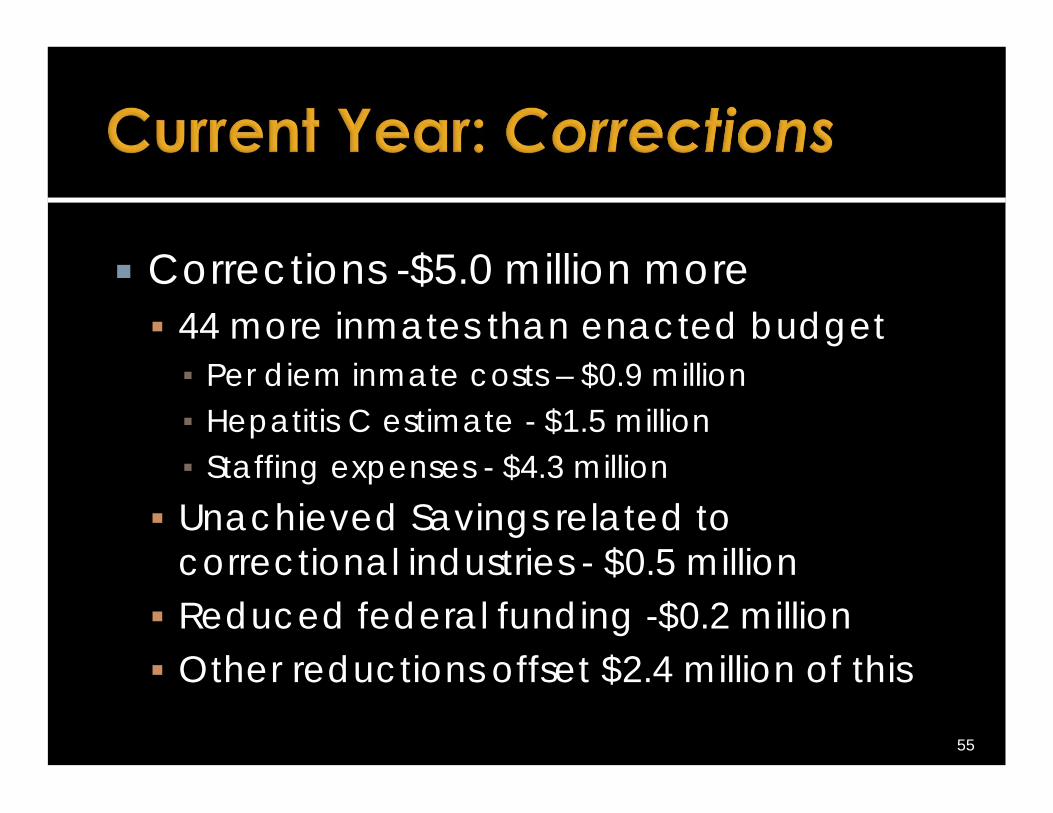
Corrections -$5.0 million more 44 more inmates than enacted budget▪ Per diem inmate costs – $0.9 million▪ Hepatitis C estimate - $1.5 million▪ Staffing expenses - $4.3 million
Unachieved Savings related to correctional industries - $0.5 million Reduced federal funding -$0.2 million Other reductions offset $2.4 million of this
55

All other projected adjustments to agency expenditures net to zero Utilities Increases - $0.8M Elections Public Matching Funds - $0.7M Higher Education Admin Office - $0.8M Education Aid Adjustments - $0.5M
56

All other projected adjustments to agency expenditures net to zero DEM Seasonal/Park & Rec - $0.6M State Police retirement - $0.6M Turnover Savings in many agencies
partially offsetting COLA – DOA,DOR, DBR
57
Difference from Budget Office – Neither is a recommendation, but staff
estimates exclude many new spending items included in agency requests
58

Only five months left to solve and fewer if legislation is required
Prior Administration’s efforts? May memo – constrained spending September memo – hiring freeze
Filled Positions Staff is monitoring changes Some needed to generate revenue
59

There are also budget year and out-year problems FY 2016 was estimated in July to have a
gap of approximately $122 million Budget Office estimated higher gap -
mainly to revenue projection differences and COLA treatment General size of issue in later years not likely
to change significantly
60

Economic impact of federal action Oil/Gas Prices True Hepatitis C costs Regional gaming issues Sustainable funding for state health
benefits exchange Control of current year spending to
mitigate budget year deficit Weather events
61

62
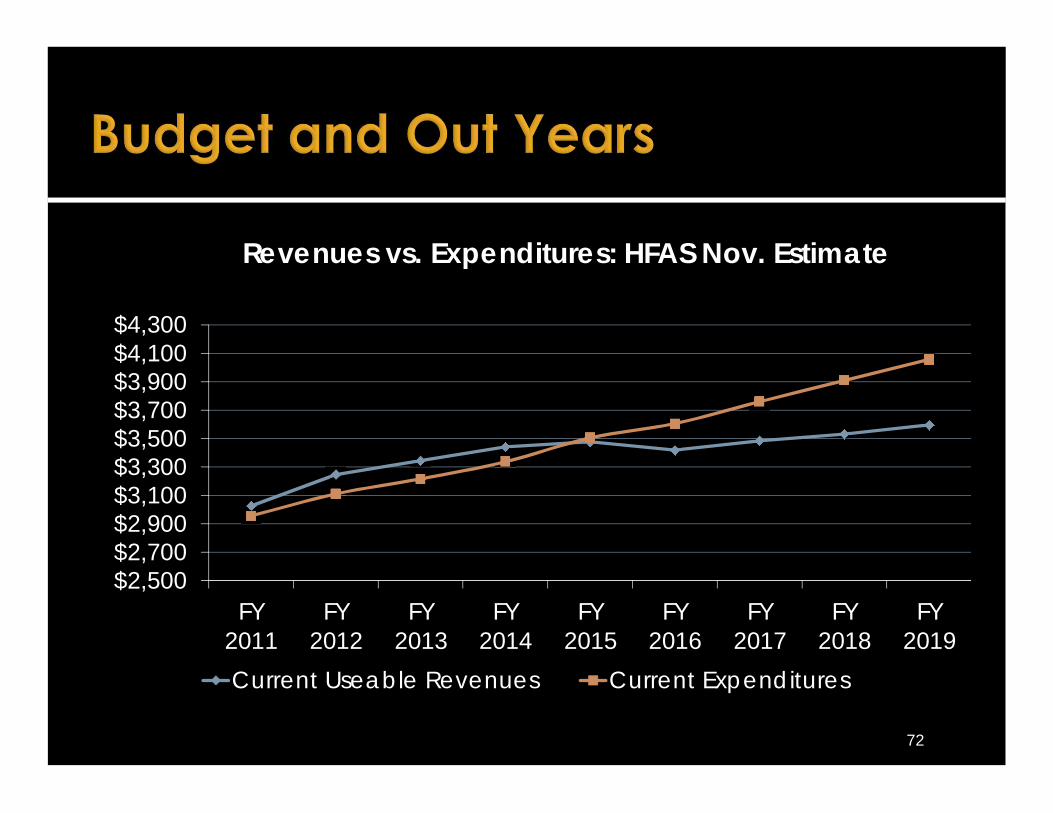
$2,500$2,700$2,900$3,100$3,300$3,500$3,700$3,900$4,100$4,300
FY2011
FY2012
FY2013
FY2014
FY2015
FY2016
FY2017
FY2018
FY2019
Revenues vs. Expenditures: HFAS Nov. Estimate
Current Useable Revenues Current Expenditures
These gaps continue to be a function of both cyclical economic and continued structural issues
Use of surplus to close budget gaps Expected reductions in revenues Gaming revenue losses begin in FY 2016 Increasing dedication of revenues to
transportation Annualized impact of tax law changes
63

Continued issue of problematic expenditure structure Many enacted structural changes
implemented… still others not achieved Growth rates exceeding revenue growth
rates
64

0 500 1,000 1,500 2,000 2,500 3,000 3,500
Federal GrantsPersonal Income
SalesUniversity & College
Misc.OtherUI and TDI
Business TaxesLottery
DepartmentalsRestr. Receipts
Other TaxesGas Tax
65
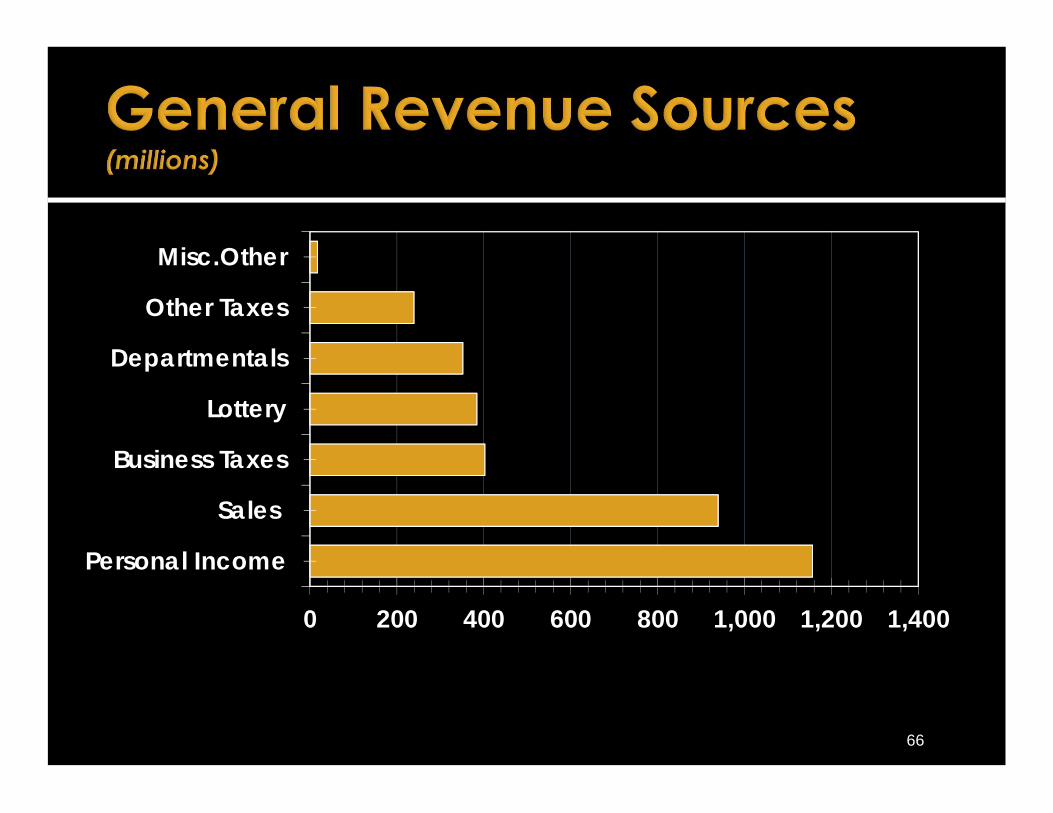
0 200 400 600 800 1,000 1,200 1,400
Personal Income
Sales
Business Taxes
Lottery
Departmentals
Other Taxes
Misc.Other
66

Gen. Govt.17.2%
Human Svcs.42.6%
Education26.9%
Public Safety6.0%
Nat. Res.1.2%
Transp.6.3%
67

Personnel & Operating
30.3%
Local Aid13.7%
Asst., Grants, Benefits46.3%
Capital7.9%
Operating Xfers1.8%
68

Gen. Govt.13.1%
Human Svcs.39.0%
Education34.8%
Public Safety12.0%
Nat. Res.1.1%
69
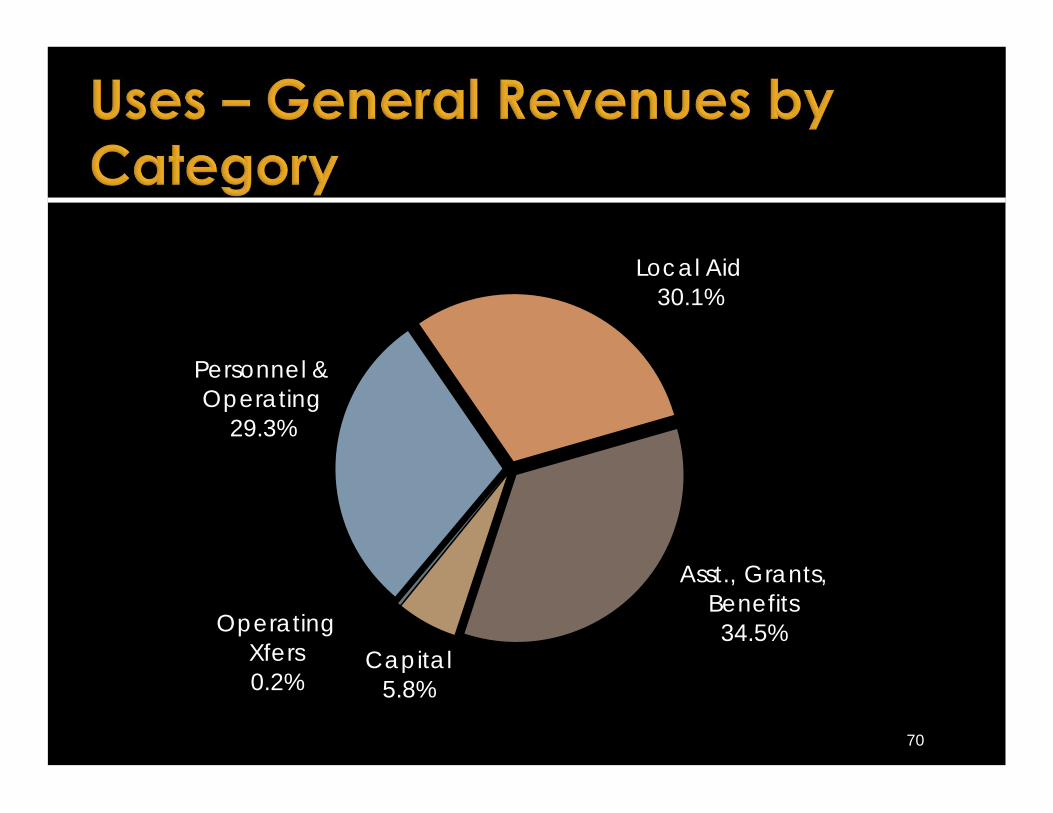
Personnel & Operating
29.3%
Local Aid30.1%
Asst., Grants, Benefits34.5%
Capital5.8%
Operating Xfers0.2%
70
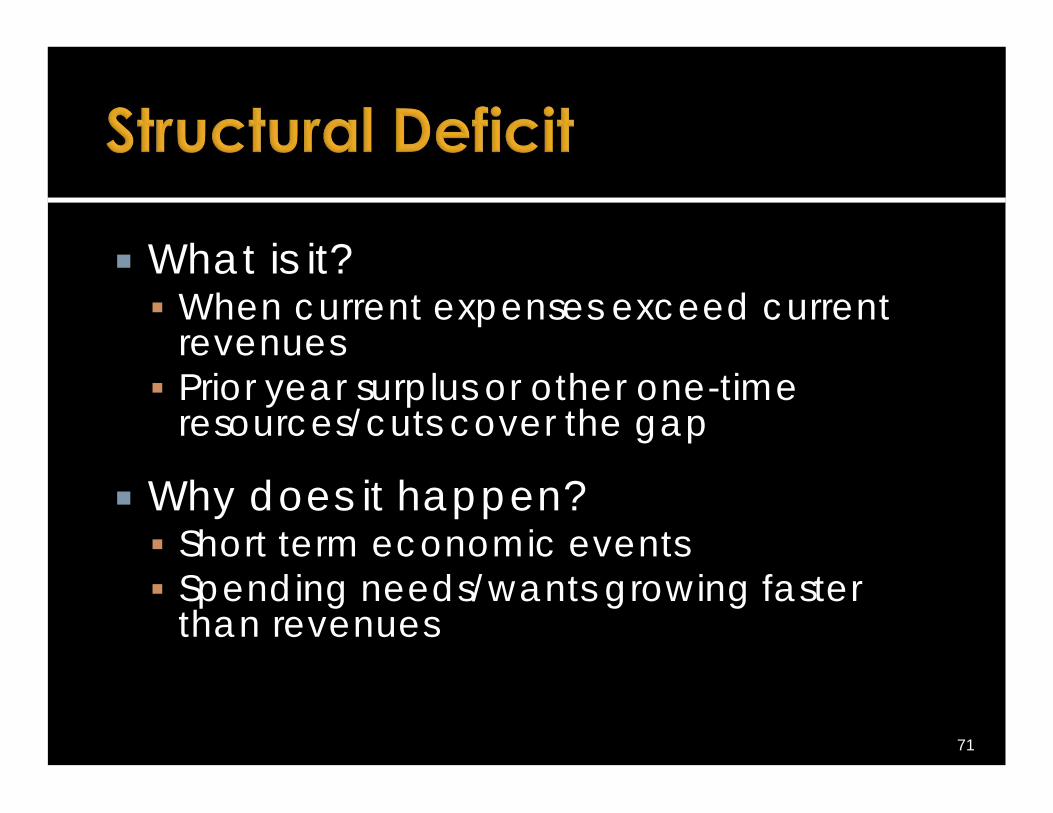
What is it? When current expenses exceed current
revenues Prior year surplus or other one-time
resources/cuts cover the gap
Why does it happen? Short term economic events Spending needs/wants growing faster
than revenues
71
72
$2,500$2,700$2,900$3,100$3,300$3,500$3,700$3,900$4,100$4,300
FY2011
FY2012
FY2013
FY2014
FY2015
FY2016
FY2017
FY2018
FY2019
Revenues vs. Expenditures: HFAS Nov. Estimate
Current Useable Revenues Current Expenditures

Item Est. Annual Growth
Jobs 1.2%State Personal Income 5.1%Taxes 2.7%Total Revenues 1.4%Total Expenditures 4.1%Salaries & Benefits – 25% of total 3.5%Medicaid – 31.5% of total 6.0%
73

How do you fix it? Align growth rates of revenues and
expenditures▪ Identify areas that are not in alignment▪ Identify highest priorities, greatest impact
and measure all decisions against those
74

How do you fix it? Sometimes this has to be done over a
longer time horizon – meaning one-time fixes can be used to bridge gaps to fully implemented structural solutions “Over-solve” for budget year with solutions
that have full impact in years 2 and 3
75
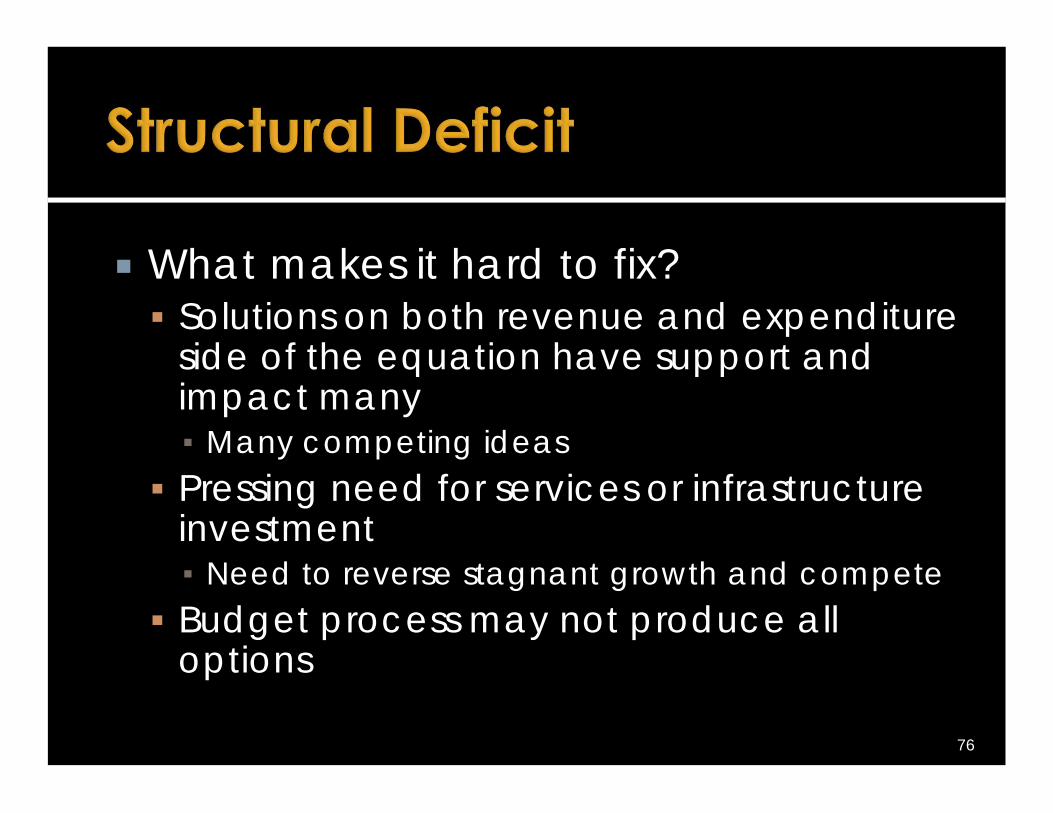
What makes it hard to fix? Solutions on both revenue and expenditure
side of the equation have support and impact many▪ Many competing ideas
Pressing need for services or infrastructure investment ▪ Need to reverse stagnant growth and compete
Budget process may not produce all options
76

Budget Office Instructions based on$166.6 million July deficit projection Includes calculation of current service
revenues and expenses Some revisions based on updated data Other revisions reflect different
methodology and “policy choices” Fully funds COLA – FY 2015 enacted
assumed portion absorbed into base
77

78
FY 2015 Enacted Budget (millions) Total S/B in totalEducation Aid $961.0 -Local Aid 77.3 -Medicaid Programs 1,083.8 72.2Other Human Service Programs 258.2 112.5Public Safety 413.2 336.0Environment 37.7 29.8Higher Education (incl. debt) 191.0 105.1Other Education 47.3 31.6Debt Service (excl. higher ed.) 168.1 -Other State Government 207.6 141.3Total FY 2015 General Revenues $3,445.2 $828.6

79
FY 2016 Budget Gap Calculation Total S/B in TotalFY 2015 General Revenues $3,445.2 $828.6Statewide Benefit Adj.(no COLA) 5.4 5.4COLA 37.4 37.4Caseload & Medicaid Match Adj. 45.6 -Debt Service 3.9 -Local Aid (3.5) -Education Aid 46.0 -Nonrecurring and Other Items 15.5 -Subtotal: Current Service Adjust. $150.3 $42.8FY 2015 Current Services $3,595.5 $871.4FY 2016 Revenues (BO Estimate) $3,428.9Budget Gap ($166.6)

Agencies asked to submit budgets that reflect current service “target” as calculated by Budget Office
Agency requests exceed current service estimates by over $62 million Not all same items included
Agency requests are $212.1 million over the FY 2015 enacted budget
80
81
Budget Office also asked for options for reductions of 7.5%, adjusted for certain exclusions
Those reductions represent $166.6 million of savings from Budget Office current service estimate
Prior years’ targets have been larger than estimated deficit

That design gives adequate options when proposals are rejected or softened
Options allow decision makers to consider all choices and implications
But prior years’ actions limit options
82
Governor’s Budget currently expected around March 12
Major budget challenges Slow growing economy Structural tax and expenditure issues▪ Long anticipated gaming losses now
immediate factor▪ Deficit fatigue▪ Specific agency issues
83

84
Wednesday February 4 – Medicaid and Human Services programs and issues
Wednesday February 11 – Personnel and related issues
Wednesday February 25 – Local Aid and other issues of interest

House Finance Committee January 29, 2015
Recommended