Hot Water Distribution System Model Enhancements
M. Hoeschele and E. Weitzel Alliance for Residential Building Innovation (ARBI)
November 2012

NOTICE
This report was prepared as an account of work sponsored by an agency of the United States government. Neither the United States government nor any agency thereof, nor any of their employees, subcontractors, or affiliated parties makes any warranty, express or implied, or assumes any legal liability or responsibility for the accuracy, completeness, or usefulness of any information, apparatus, product, or process disclosed, or represents that its use would not infringe privately owned rights. Reference herein to any specific commercial product, process, or service by trade name, trademark, manufacturer, or otherwise does not necessarily constitute or imply its endorsement, recommendation, or favoring by the United States government or any agency thereof. The views and opinions of authors expressed herein do not necessarily state or reflect those of the United States government or any agency thereof.
Available electronically at http://www.osti.gov/bridge
Available for a processing fee to U.S. Department of Energy and its contractors, in paper, from:
U.S. Department of Energy Office of Scientific and Technical Information
P.O. Box 62 Oak Ridge, TN 37831-0062
phone: 865.576.8401 fax: 865.576.5728
email: mailto:[email protected]
Available for sale to the public, in paper, from: U.S. Department of Commerce
National Technical Information Service 5285 Port Royal Road Springfield, VA 22161 phone: 800.553.6847
fax: 703.605.6900 email: [email protected]
online ordering: http://www.ntis.gov/ordering.htm
Printed on paper containing at least 50% wastepaper, including 20% postconsumer waste

iii
Hot Water Distribution System Model Enhancements
Prepared for:
The National Renewable Energy Laboratory
On behalf of the U.S. Department of Energy’s Building America Program
Office of Energy Efficiency and Renewable Energy
15013 Denver West Parkway
Golden, CO 80401
NREL Contract No. DE-AC36-08GO28308
Prepared by:
M. Hoeschele and E. Weitzel
Alliance for Residential Building Innovation (ARBI)
Davis Energy Group, Team Lead
123 C Street
Davis, California 95616
NREL Technical Monitor: Cheryn Metzger
Prepared under Subcontract No. KNDJ-0-40340-00
November 2012

iv
[This page left blank]

v
Contents List of Figures ............................................................................................................................................ vi List of Tables .............................................................................................................................................. vi Definitions .................................................................................................................................................. vii Executive Summary ................................................................................................................................. viii 1 Introduction ........................................................................................................................................... 1
1.1 Background and Motivation ................................................................................................1 1.1.1 HWSIM Background ...............................................................................................2
1.2 Research Questions ..............................................................................................................3 2 Methodology ......................................................................................................................................... 4
2.1 Modeling Methodology .......................................................................................................4 3 Results ................................................................................................................................................... 5 4 Conclusions and Recommendations ................................................................................................. 9 References ................................................................................................................................................. 11

vi
List of Figures Figure 1. Comparison of lab and simulated uninsulated pipe UAs ....................................................... 7 Figure 2. Insulated pipe UAs as a function of insulation conductivity ................................................. 8 Figure 3. Comparison of lab and simulated insulated pipe UAs ............................................................ 9
Unless otherwise noted, all figures were created by the ARBI team.
List of Tables Table 1. HWSIM Required Inputs for Combined Convective/Radiant Heat Transfer Modeling .......... 4 Table 2. Combined Convective/Radiant Heat Transfer Modeling Algorithms ...................................... 5 Table 3. Comparison of Lab and Simulated Plastic Pipe Outlet Temperatures and UAs .................... 6 Table 4. Comparison of Lab and Simulated Copper Pipe Outlet Temperatures and UAs ................... 6
Unless otherwise noted, all tables were created by the ARBI team.

vii
Definitions
ARBI Alliance for Residential Building Innovation
ARIES Advanced Residential Integrated Energy Solutions
AET Applied Energy Technology
CARB Consortium for Advanced Residential Buildings
CEC California Energy Commission
CU University of Colorado
CPVC Chlorinated Polyvinyl Chloride
DEG Davis Energy Group
k Thermal conductivity
LBNL Lawrence Berkeley National Laboratory
PIER Public Interest Energy Research
PEX Cross-linked Polyethylene
UA Product of overall heat transfer coefficient (U) and pipe surface area (A)

viii
Executive Summary
Hot water distribution systems deliver heated water from the heat source to the use points throughout the house. As house size and number of fixtures has increased in recent years, the impact of distribution systems on overall performance has become more significant. Inefficient distribution systems contribute to unnecessary energy and water waste, as well as excessive hot water wait time.
This project involves enhancement of the HWSIM distribution system model to more accurately model pipe heat transfer. Recent laboratory testing efforts have indicated that the modeling of radiant heat transfer effects is needed to accurately characterize piping heat loss. An analytical methodology for integrating radiant heat transfer was implemented with HWSIM. Laboratory test data collected in another project was then used to validate the model for a variety of uninsulated and insulated pipe cases (copper, PEX, and CPVC). Results appear favorable, with typical deviations from lab results less than 8%. Improving the modeling capabilities of distribution system models is a critical step in improving the accuracy of projecting hot water distribution system performance. Future efforts should include using detailed field data from the National Renewable Energy Laboratory’s (NREL) Solar Row project (Barley et al 2010) to further validate the HWSIM model, as well as a recently developed TRNSYS model.

1
1 Introduction
1.1 Background and Motivation The delivery characteristics of hot water distribution systems are a critical factor affecting overall water heating system performance in terms of both energy and water use (and waste). Accurate simulation tools, such as the HWSIM distribution system model and recent modeling work completed by CU Boulder and NREL (Maquire et al 2011), are needed to quantify the impacts of distribution system performance, which is the first step in identifying cost-effective improvement options that will contribute to Building America’s goal of 30%-50% energy savings.
Little data currently exists in quantifying distribution losses, especially in terms of understanding how climate, plumbing practices (i.e. pipe layout and house vintage), hot water usage patterns, and user behavior affect overall losses. A variety of factors contribute to this poor understanding of distribution system performance, including the following:
• Detailed monitoring of water heater energy and water flows to use points is challenging and expensive, since remote temperature sensors and individual flow meters are required. Few studies have been completed that accurately assess distribution losses in single family homes.
• Modeling tools have historically been limited in their predictive capability, especially given the uncertainties of typical piping layouts, hot water usage patterns, and how pipe (surrounding) environment temperatures affect thermal losses. The short duration of typical residential water heating loads (typically 20-60 minutes of hot water flow per day), results in hourly simulation tools being largely ineffective at accurately modeling these high resolution events.
• For many homes and apartments, much of the distribution piping is largely hidden from view, making accurate quantification of pipe routing, and pipe lengths and diameters difficult. Without knowledge of the pipe layout, it is challenging to understand the system interactions.
• Hot water loads, usage patterns, and user behavior varies widely among households and vary significantly from day to day. How loads are imposed on a system can significantly affect distribution system performance in terms of heat loss and water waste. Addressing all of these issues is critical in developing a better understanding of distribution system performance. Work is proceeding in some of the identified gap areas, but additional effort is needed to generate the input data and improve tools required to properly assess distribution system performance. Jim Lutz of Lawrence Berkeley National Laboratory (LBNL) has been working for several years on developing a database for archiving high resolution hot water use data from field monitoring studies1. The Building America team, Advanced Residential Integrated Energy Solutions (ARIES), is starting a field effort to assess the impact of water heater and distribution system upgrades at three or more existing homes in central New York. Davis Energy Group (DEG), who leads the ARBI team, is currently completing simulation enhancements to HWSIM (focused on integrating both gas storage and gas tankless water heater models with the distribution
1 http://www.aceee.org/files/pdf/conferences/hwf/2010/3D_Jim_Lutz.pdf

2
model), as part of a California Energy Commission (CEC) Public Interest Energy Research (PIER) sponsored advanced water heating project being led by the Gas Technology Institute. The PIER simulation enhancement work complements the work presented in this report.
1.1.1 HWSIM Background In 2004, working under funding from the Building America team Consortium for Advanced Residential Buildings (CARB), DEG began an extensive enhancement of the HWSIM distribution system model. (The model was originally developed in a simplistic BASIC coded form for use in DEG’s development of the 1990 detailed California Title 24 water heating methodology.) The 2004 Building America funding was designed to increase the analytical rigor and flexibility of the modeling tool, improve the user interface, and develop a user’s manual for the public domain software tool.
HWSIM was originally designed to model in detail the energy and water use (and waste) effects associated with residential-scale hot water distribution systems. Impacts of pipe heat loss both during draws and between draws are modeled. The software requires the user to specify a water heater setpoint temperature, a plumbing network (separated into elements of various lengths, with each pipe element characterized by pipe material, pipe diameter, insulation, and pipe environment temperature), plumbing environment temperatures, and hot water end use points. The piping network serves individual use points such as showers, tubs, sinks, and appliances. A full weekly schedule of hot water draws is then input to characterize the various demands of hot water through the course of a day. Seasonal effects are captured by varying monthly cold water inlet temperatures and the temperatures of the pipe heat loss environments, which can vary both monthly and hourly. Draws are characterized by start time, flow rate, volume or energy content desired, and minimum use temperature (in the case of showers or other draws where a comfort threshold applies). The representative week of draws is scaled to develop monthly, and ultimately, annual summaries of piping energy waste, hot and cold water wasted, and water heater energy consumption (Springer et al 2008).
Each unique pipe element is comprised of a series of nodes of discrete volume (dV) to improve the resolution of the heat transfer calculations. Typical node size is 0.075 gallons, although the user has the ability to increase or decrease with resulting implications on both computing time and resolution. Heat transfer from the pipe to the environment is calculated continuously as each dV flows through the piping network towards the use point. As the piping network moves from the water heater to the use points, the pipe environment and pipe diameter may change, varying the calculated heat loss. During periods between draws, the distribution piping undergoes a thermal decay based on material properties, presence of insulation, and the hourly surrounding environment temperature.
As part of the CEC PIER project currently underway, the following program enhancements are being implemented:
• Integrate the center flue storage water heater simulation program TANK (originally developed by Batelle in the early 1990’s) with HWSIM to more accurately simulate system performance by recognizing the interactions between the water heater and the distribution system.
3
• Integrate the single node tankless water heater model used in TRNSYS (Type 940 model) to evaluate tankless water heater performance in terms of efficiency, hot water delivery characteristics, and water waste.
• Utilize test data on pipe heat loss performance developed by Applied Energy Technology (AET) to validate the HWSIM model.
The AET laboratory testing led to the conclusion that integrating radiant heat transfer was needed to accurately model pipe heat transfer. During lab testing of plastic piping, it was observed that uninsulated ¾ in. PEX piping exhibited considerably higher heat loss per foot than uninsulated ¾ in. copper pipe, while the addition of identical pipe insulation to each resulted in roughly comparable heat loss between PEX and copper pipes (Hiller 2005; 2006; 2008; 2011). Further investigation indicated that the surface emissivity of PEX (and other plastic pipes) is equal to 0.91, while copper piping has a much lower emissivity, depending upon the level of oxidation on the pipe surface. An extreme case for highly polished copper suggests an emissivity of 0.02, although any level of oxidation will quickly increase the surface emissivity2.
This laboratory finding suggested the need for radiant heat transfer integration within HWSIM. Integrating radiant heat transfer is just the first step of the process, since now an assumption must be made for the mean radiant temperature for each pipe environment that is being modeled. Specification of the air temperature is challenging enough for many applications such as attics or garages, where conditions can vary significantly, especially in summer months. With input from AET, we have simplified the assumption that pipe radiant environment temperature is equal to the surrounding air temperature. Future monitoring and model validation efforts will provide insights to the validity of this assumption.
1.2 Research Questions The work presented here represents a key step in the development of the tools needed to assess the performance of distribution systems. A better understanding of distribution systems, hot water usage magnitude and patterns, and use behavior, are all critical building blocks to accurately assessing the overall performance of existing and alternative hot water systems, and identifying cost-effective strategies leading to the Building America goal of 30%-50% whole house energy savings. The enhancement of the HWSIM program is an important step in improving understanding of system performance. The following research questions have been identified for this technical report:
• What analytical method should be used to accurately model pipe heat transfer?
• How well does the model predict performance relative to detailed laboratory measurements?
• What are the limitations of the model?
• What should be the next step in the model validation process?
2 Standard heat transfer reference texts present typical emissivity values for copper ranging from 0.02 for highly polished, 0.04-0.05 for “polished”, 0.07 for “scraped, shiny”, 0.15 for “slightly polished”, to 0.78 for “black oxidized”.

4
2 Methodology
2.1 Modeling Methodology The development of the combined convective/radiant pipe heat transfer relied on calculating a combined surface heat transfer coefficient based on the input parameters shown in Table 1.
Table 1. HWSIM Required Inputs for Combined Convective/Radiant Heat Transfer Modeling
Variable Description Equation (or value) INPUTS Tw, water temperature (deg F) Te, environment temperature (deg F) Tr, Mean radiant temperature (deg F) F, flow rate (gpm) kp, pipe conductivity (Btu/hr-ft-degF) ki, insulation conductivity (Btu/hr-ft-degF) Li, insulation thickness (inches) S, Stephan-Boltzmann constant (Btu/hr-ft^2-degR^4) 1.714 x 10⁻⁹ e, surface emissivity (non-dimensional) Ri, inside pipe radius (ft) Ro, outside pipe radius (ft) Rs, outer surface radius (ft) Ro+Li/12 Tsi, initial surface temperature estimate (deg F) (Tw+Te)/2
The calculation methodology, outlined in Table 2, is based on standard heat transfer calculations for free convection and radiation (Kreith 1973). The calculation process involves first determining an exterior surface coefficient based on an initial estimate of surface temperature equal to the average of the pipe element water temperature and the surrounding environment temperature. The initial coefficient was calculated using standard pipe heat transfer modeling for horizontal cylinders at moderate surface temperatures. The interior coefficient is then calculated based on the pipe fluid velocity. The methodology utilizes Newton’s method to iterate in estimating a final surface temperature to be used for determination of the combined convective and radiant heat transfer. This technique is then used for each dV of the piping network where water is flowing, accommodating changes in fluid temperature (from one dV to the next), environment air and mean radiant temperature, and fluid velocity (as pipe diameters change).

5
Table 2. Combined Convective/Radiant Heat Transfer Modeling Algorithms
Variable Description Equation CALCULATIONS hoi, initial surface air film estimate (Btu/hr-ft^2-degF)
V, fluid velocity (ft/sec)
hi, inside film coefficient estimate (Btu/hr-ft^2-degF)
Ui, inside total U-value (Btu/hr-ft^2-degF)
f, Ts written as a function
f/, derivative of f Tsf, final surface temperature (deg F)
ho, final surface air film (Btu/hr-ft^2-degF)
Q/l, heat flow to environment (Btu/hr-ft)
UA, overall pipe UA (Btu/ft-degF) Q / (Tw - Te)
3 Results
Upon implementation of the heat transfer calculation methodology outlined in Table 2, a series of runs were completed to compare results to the laboratory data collected by AET over the past several years. Tables 3 and 4 summarize the findings for various uninsulated pipe cases with plastic pipes listed in Table 3 and copper in Table 4. The surface emissivity of plastic and copper pipe was assumed to be 0.91 and 0.40, respectively. Hot water inlet temperature, air and radiant environment temperature (assumed equal), and fluid flow rates were all specified to match the reported test conditions for horizontal pipes in air. Outlet water temperatures were calculated based on the lab-reported UAs, inlet hot water temperature, and environment (air and radiant) temperatures. These input conditions were also fed into the model to simulate a 100-foot long pipe section. A 20-gal draw was imposed and the end of draw outlet temperature (reported in the Tables) was used to calculate the steady state “UA per foot” listed under HWSIM Results.

6
Table 3. Comparison of Lab and Simulated Plastic Pipe Outlet Temperatures and UAs
Table 4. Comparison of Lab and Simulated Copper Pipe Outlet Temperatures and UAs
For the plastic pipe cases, HWSIM underpredicts the lab UAs by 0% to 10%. This falls within a reasonable range of accuracy given the expected experimental accuracy in the lab of utilizing immersion thermocouples. UA is highly sensitive to the accuracy in the entering and leaving water temperature measurements, which in some of the lab test cases varied by as little as 3°F from inlet water to outlet. For the copper pipe data shown in Table 4, the rigid piping simulated cases (with the 0.4 emissivity assumption) show good correlation with the lab data. The last four columns show a second ¾ in. rolled copper tubing case tested in the lab. HWSIM results are shown for two cases (0.02 and 0.20 emissivity), in an attempt to approximate the actual “new
Pipe 3/4PEX 3/4PEX 1/2PEX 1/2PEX 3/8PEX 3/8PEX 3/4CPVC 3/4CPVC
Pipe Insulation Level R-0 R-0 R-0 R-0 R-0 R-0 R-0 R-0Insulation Conductivity Assumption 0 0 0 0 0 0 0 0Assumed Surface Emissivity (e) 0.91 0.91 0.91 0.91 0.91 0.91 0.91 0.91Hot Water Inlet Temperature (F) 135 135 136 136 135 135 137 137Air and Radiant Environment Temp (F) 54 54 55 55 56 56 70 70Flow Rate (gpm) 1.0 2.0 1.0 2.0 1.0 2.0 1.0 2.0
Lab Test ResultsPipe "UA per foot" target (Btu/hr-ft-F) 0.545 0.555 0.438 0.438 0.368 0.368 0.460 0.480Calculate Outlet Temperature (F) 126.27 130.55 128.98 132.49 129.25 132.13 130.91 133.82
HWSIM RESULTSCalculate Outlet Temperature (F) 127.00 130.86 129.53 132.68 129.88 132.39 130.97 133.90Calculated Pipe "UA per foot" (Btu/hr-ft-F) 0.503 0.520 0.406 0.417 0.330 0.336 0.458 0.472UA Difference vs. Lab Data (%) -7.7% -6.3% -7.2% -4.8% -10.3% -8.6% -0.5% -1.8%Outlet Temperature Difference vs. Lab (F) 0.73 0.31 0.55 0.19 0.63 0.26 0.07 0.08
Pipe 1/2 Cu 1/2 Cu 3/4 Cu 3/4 Cu 3/4 Cu 3/4 Cu 3/4 Cu 3/4 Cu Rolled Rolled Rolled Rolled
Pipe Insulation Level R-0 R-0 R-0 R-0 R-0 R-0 R-0 R-0Insulation Conductivity Assumption n/a n/a n/a n/a n/a n/a n/a n/aAssumed Surface Emissivity (e) 0.4 0.4 0.4 0.4 0.02 0.02 0.2 0.2Hot Water Inlet Temperature (F) 136 136 136 136 133 133 133 133Air and Radiant Environment Temp (F) 65 65 58 58 56 56 56 56Flow Rate (gpm) 1.0 2.0 1.0 2.0 1.0 2.0 1.0 2.0
Lab Test ResultsPipe "UA per foot" target (Btu/hr-ft-F) 0.345 0.360 0.417 0.421 0.334 0.334 0.334 0.334Calculate Outlet Temperature (F) 131.16 133.47 129.57 132.75 127.91 130.46 127.91 130.46
HWSIM RESULTSCalculate Outlet Temperature (F) 131.30 133.60 129.10 132.44 127.66 130.26 126.97 129.90Calculated Pipe "UA per foot" (Btu/hr-ft-F) 0.335 0.342 0.447 0.461 0.351 0.359 0.396 0.407UA Difference vs. Lab Data (%) -3.0% -5.0% 7.3% 9.6% 5.0% 7.6% 18.5% 21.8%Outlet Temperature Difference vs. Lab (F) 0.14 0.13 -0.47 -0.31 -0.26 -0.19 -0.94 -0.55

7
pipe” condition when it was tested. The sensitivity in UA to emissivity is evident. To achieve a match to within 10% of the lab test value of 0.334, a highly polished emissivity of 0.02 was assumed. It is not clear why the rolled copper tubing comparison of lab versus simulated differs to a greater extent that the rigid ½ in. and ¾ in. copper results.
Figure 1 plots the lab and simulated UA values for each of the cases reported in Tables 3 and 4.
Figure 1. Comparison of lab and simulated uninsulated pipe UAs
The second step in the validation process was to model insulated piping and compare to the laboratory test data. Prior AET lab findings suggested that pipe insulation performance was not meeting the manufacturer’s performance specifications with typical reported conductivity values of 0.02-0.021 Btu/hr-ft-°F (or 0.25 Btu-inch/hr-ft2-°F). HWSIM runs performed prior to the incorporation of the current heat transfer methodology suggested that an insulation conductivity of ~ 0.042 Btu/hr-ft-°F provided the best match with the lab data. With the enhanced radiant/convective heat loss model in place, a series of runs were completed to assess the best fit”k” value for each pipe configuration. Figure 2 summarizes the findings for the case of a 100-ft pipe at a 1 gpm flow rate. The values of 0.02 and 0.042 Btu/hr-ft-°F insulation conductivity are presented to bound the range, with the corresponding calculated UAs shown. The blue-shaded values represent the best modeling match with the lab data. Other than the ¾ in. PEX with ¾ in. insulation, all plastic pipe and copper pipe cases center in fairly tight conductivity ranges, however, the difference between copper and plastic is fairly significant. The reason for this and
0.368
0.330
0.438
0.406
0.545
0.503
0.460 0.458
0.345 0.335
0.417
0.447
0.3340.351
0.396
0.00
0.10
0.20
0.30
0.40
0.50
0.60
3/8"
PEX
3/8"
PEX
1/2"
PEX
1/2"
PEX
3/4"
PEX
3/4"
PEX
3/4"
CPV
C
3/4"
CPV
C
1/2"
CU
1/2"
CU
3/4"
CU
3/4"
CU
Rolle
d 3/
4" C
U
Rolle
d 3/
4" C
U 0.
02
Rolle
d 3/
4" C
U 0.
20
Pipe
UA
per F
oot (
Btu/
hr-ft
-deg
F)
3/8" PEX
Lab
Simulated

8
the deviation of the ¾ in. PEX case are not entirely clear, and may be an artifact related to the laboratory testing. Averaging the eight cases results in a mean conductivity value of 0.030 Btu/hr-ft-°F.
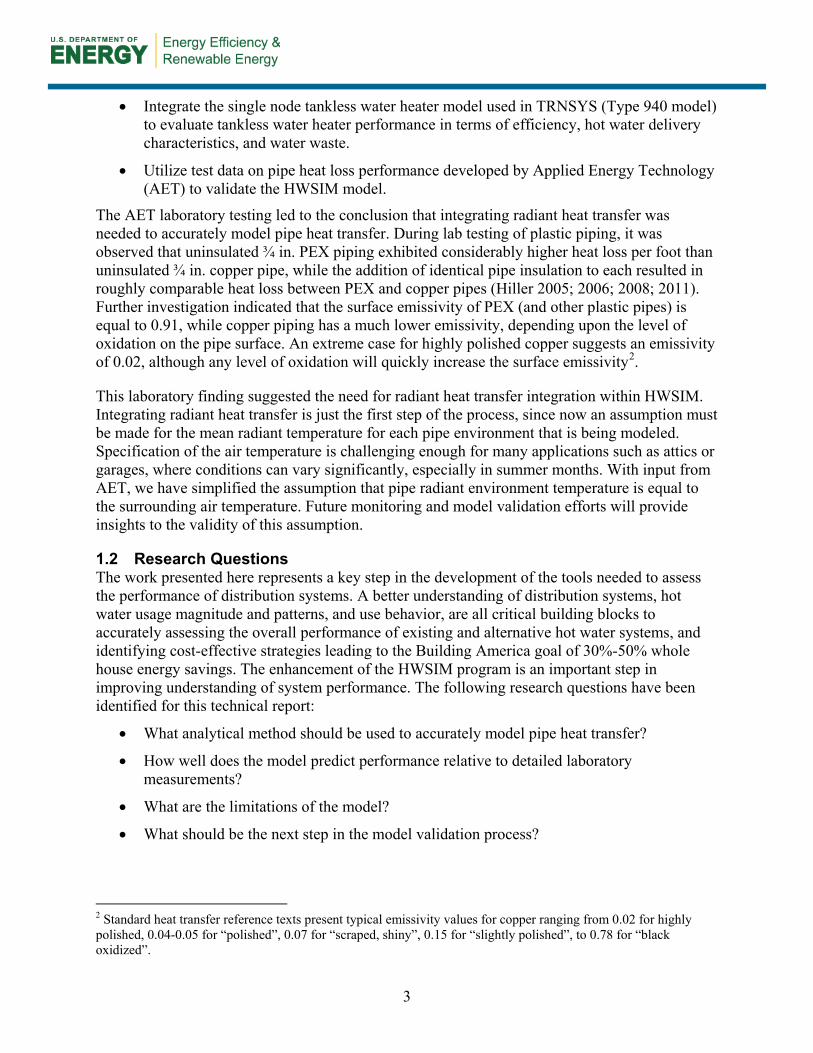
Figure 3 shows the comparison of insulated pipe data from the lab relative to the simulated cases. With the exception of the ¾ in. PEX with ¾ in. insulation, all of the UA comparisons fall within 10% of the lab values. Since the thermal characteristics of the pipe insulation dominate the heat transfer, one would expect the performance of the ¾ in. PEX case to fall more in line with the other values. Our hypothesis is that the lab result for this particular case may be inaccurate.
Figure 2. Insulated pipe UAs as a function of insulation conductivity
3/4" PEX 1/2" PEX 3/8" PEX 3/4" CPVC 1/2" CU 1/2 Cu 3/4" CU 3/4" CU3/4" Insl 3/4" Insl 3/4" Insl 3/4" Insl 1/2" Insl 3/4" Insl 1/2" Insl 3/4" Insl
0.02 0.108 0.093 0.081 0.107 0.105 0.091 0.133 0.1120.0210.0220.0230.0240.025 0.1320.026 0.117 0.1650.0270.028 0.1480.0290.03
0.0310.032 0.1210.033 0.130 0.1600.0340.0350.0360.0370.0380.0390.04 0.188
0.0410.042 0.191 0.165 0.149 0.189 0.185 0.165 0.231 0.202
Insl Conductivity (Btu/hr-ft-°F)

9
Figure 3. Comparison of lab and simulated insulated pipe UAs
4 Conclusions and Recommendations
The implementation of standard horizontal pipe heat transfer calculation utilizing fluid velocity for determining interior pipe heat transfer coefficient, and a combined radiant and convective outside coefficient was found to provide a good match with AET laboratory data. On average, simulation results are within 8% of the laboratory findings. Some level of uncertainty lies in the identification of the mean radiant temperature, both in the lab environment, and more significantly, in many real-world piping applications such as attics and garages. In addition, copper surface emissivities, which will vary over time due to oxidation, are difficult to determine. Overall, based on the validation results, we feel confident that the enhanced HWSIM model, and the recently developed TRNSYS model (Maguire et al 2011), are ready for the next validation step of using detailed site monitoring data (NREL’s Solar Row dataset) to drive the model. Model outputs in the form of end use point hot water outlet temperatures can then be compared to model-predicted outlet temperatures. This work has been proposed by ARBI for 2012, with the primary validation effort focused on the TRNSYS model.
The development and validation of these enhanced tools is a critical step in the process towards accurately evaluating the performance of residential distribution systems and the resulting impact on the water heater. Much fundamental work needs to be completed to address the broader water heating research questions presented earlier in this technical report. For residential, non-recirculating distribution systems, the authors estimate that distribution losses may range from
0.121
0.110
0.1300.126
0.180
0.147
0.160
0.144
0.132
0.146
0.1170.126
0.165
0.184
0.1480.155
0.00
0.02
0.04
0.06
0.08
0.10
0.12
0.14
0.16
0.18
0.20
3/8"
PEX
3/4
"
3/8"
PEX
3/4
"
1/2"
PEX
3/4
"
1/2"
PEX
3/4
"
3/4"
PEX
3/4
"
3/4"
PEX
3/4
"
3/4"
CPV
C 3/
4"
3/4"
CPV
C 3/
4"
1/2"
Cu
1/2"
1/2"
Cu
1/2"
1/2"
Cu
3/4"
1/2"
Cu
3/4"
3/4"
Cu
1/2"
3/4"
Cu
1/2"
3/4"
Cu
3/4"
3/4"
Cu
3/4"
Pipe
UA
per F
oot (
Btu/
hr-ft
-deg
F)
3/8" PEX 3/4"
Lab
Simulated

10
10%-40% of annual hot water energy consumption, depending upon factors such as plumbing layout, pipe sizing and location, and hot water use quantity and patterns. Critical factors that affect the magnitude of the distribution loss include the layout of the distribution system and the magnitude and pattern of hot water loads within the household, which are highly variable from one house to the next. Both of these factors are currently not well understood, especially in terms of how they vary in different vintages of homes and what effect climate has in affecting heat loss due to varying environment temperatures and pipe locations (attic piping is common in milder regions). Improved knowledge in all these fronts will lead to validated simulation tools that can reliably provide results for a range of applications and climates.

11
References
Barley, C. Dennis; Hendron, R.; and Magnusson, L. (2010). “Field Test of a DHW Distribution System: Temperature and Flow Analyses.” NREL/PR-550-48385. Presented at the 2010 ACEEE Hot Water Forum. Accessed at: http://www.nrel.gov/docs/fy10osti/48385.pdf .
Hiller, C. (2005). Hot Water Distribution System Research – Phase I Final Report. California Energy Commission report 500-2005-161.
Hiller, C. (2006a). Hot Water Distribution System Piping Time, Water, and Energy Waste - Phase I Test Results. ASHRAE Transactions, vol. 114, pt. 1, 415-425.
Hiller, C. (2006b). Hot Water Distribution System Piping Heat Loss Factors - Phase I Test Results. ASHRAE Transactions, vol. 114, pt. 1, 436-446.
Hiller, C. (2008). Hot Water Distribution System Piping Heat Loss Factors, Both In-air and Buried--Phase II: Test Results. ASHRAE paper no. SL-08-010.
Hiller, C. (2011). Hot Water Distribution System Piping Time, Water, and Energy Waste--Phase III: Test Results. ASHRAE Transactions, vol 117, pt. 1.
Kreith, F. (1973). Principles of Heat Transfer, Third Edition. New York: Harper and Row. 1973.
Lutz, J.D. (2008). Water Heaters and Hot Water Distribution Systems. California Energy Commission, PIER Buildings End-Use Energy Efficiency. CEC-500-2005-082. Maguire, J.; Krarti, M.; and Fang, X. (2011). “An Analysis Model for Domestic Hot Water Distribution Systems,” Conference Paper. NREL/CP-5500-51674. Accessed at: http://www.nrel.gov/docs/fy12osti/51674.pdf Springer, D.; Rainer, L.; and Hoeschele, M. (2008). “HWSIM: Development and Validation of a Residential Hot Water Distribution System Model,” Proceedings of the 2008 ACEEE Summer Study on Energy Efficiency in Buildings.

DOE/GO-102012-3626 ▪ November 2012
Printed with a renewable-source ink on paper containing at least 50% wastepaper, including 10% post-consumer waste.
Recommended