His Royal Highness Hussein Abdullah, Crown Prince


5
Contents Page
Board of Directors 7
Chairman’s Message 9
Board of Directors’ Report
Economy Highlights 15
Results of Operations 20
The Bank’s Activities During 2011 24
Business Plan for 2012 31
Risk Management 32
Corporate Governance and Other Disclosures 33
Corporate Governance Code 51
Financial Statements with Auditors’ Report 61
Our Branches 120
Table of Contents


7
Mr. Khaled Sabih Al-Masri Chairman
Mr. Yazid Adnan Al-Mufti Vice Chairman
Mr. Mohammad Kamal Eddin Barakat Representing Banque Misr
Mr. Ibrahim Hussien Abu Al-Ragheb Representing Ishraq Investment Company
Mr. Yasin Khalil Talhouni Representing Levant Investment Company
Dr. Farouq Ahmad Zuaiter Representing Palestine Development & Investment Company (Padico)
Mr. Nashat Taher Al-Masri Representing Palestine Development & Investment Company (Padico)
Mr. Ghassan Ibrahim Akeel Representing Arab Supply and Trading Company
Dr. Bassam Ali Subaihi Representing Social Security Corporation
Mrs. Suhair Sayed Ibrahim Representing Misr Investment Company
Mr. Sharif Mahdi Al-Saifi Representing Misr Investment Company
Mr. Arfan Khalil Ayass Representing Al-Massira Investment Company(from 3/11/2011)
Dr. Abdul Malek Ahmad Jaber Representing Al-Massira Investment Company(until 3/11/2011)
Mr. Kamal Ghareeb Al-Bakri General Manager
Ernst & Young External Auditors(Member of Ernst & Young Global)
Board of Directors


9
Dear Shareholders,
It is with great pride and pleasure that I present to you Cairo Amman Bank’s annual report for the year 2011, an eventful and challenging year where the Arab world stepped into conceptual leaps in their visions and prospects. Arab Spring movements extended to most of the Middle East and North African countries, and political and security instability had a direct effect on the economic situation of the region, ranging from posting negative growth in the Arab Spring countries to achieve higher growth rates driven by the increase in oil prices in most of the GCC countries. In Jordan, the economy continued its slow growth and is expected to reach 2.6% for 2011, accompanied with volatility in the core economic sectors which some, such as the mining sector, posted exceptional growth rates, while adverse regional situations negatively affected other sectors such as tourism.
The slowdown in the gtlobal activity has created an uneven expansion in the international economies increasing the downside risks, which accompanied massive bouts of global financial market volatility. The European debt crisis remains the core shock of the hour; in its folds it carries the threat of becoming the recessionary tipping point for the global economy.
Despite all adversaries Cairo Amman Bank was able to surpass expectations in Jordan and Palestine attaining outstanding results and high growth levels in all operating areas. Net income posted a record of JD 36.6 million compared to JD 34.7 million in the previous year, achieving growth of 5.3%. By adding income from investments that were booked during the year directly into the retained earnings account as a result of applying IFRS (9), net income for the year becomes JD 39.1 million, 12.5% higher than last year. The growth in net income was accompanied with an increase in other operational indicators such as net interest and commission which grew by 5.6% to reach JD 100 million. Gross income amounted to JD 115.2 million achieving growth of 12.5% over last year. In addition, total assets grew by 5.3%, reaching JD 1940.4 million, while customers’ deposits increased by 2.9%, reaching JD 1375.1 million. The Bank’s credit facilities increased by 15.1%, reaching JD 947.6 million. This increase was accompanied by ongoing improvement in the quality of the credit portfolio, as the level of non-performing loans was 4.83% which is lower than the average level of the banking sector in Jordan. The Bank capital adequacy ratio reached 15% which is higher than the minimum required by the Central Bank of Jordan of 12% and minimum required by Basel committee of 8%. Behind all these exceptional results were the conservative and effective credit policies adopted by the Bank during the past years in addition to the extensive improvement in risk management practices. The Bank capitalizes on its strong financial position, sufficient liquidity levels, and high capital adequacy ratio.
In 2011, Cairo Amman Bank continued developing its operations, enhancing its competitive position and improving the level of services it provided to its customers, through increasing its branches, offices and ATMs to extend its geographical reach. In addition, it continued improving products offered to customers in the arenas of deposits, credit facilities and other banking services. The Bank also started implementing the Internal Capital Adequacy Assessment Process (ICAAP) framework as part of implementing the second pillar of Basel II requirements and to improve the quality of risk measurement within the Bank as well as complying with Central Bank of Jordan requirements.
Despite the negative outlook for 2012, which is characterized by continued political instability in the region and low growth rates in Jordan, the Bank will strive to implement its strategic policies and plans, to develop its operations, to improve its services, and to enhance its performance efficiency. We will extend our outreach through opening new branches throughout the country, expanding our ATM network and renovating the branches to be in line with Cairo Amman Bank’s identity. The year 2012 will witness the comprehensive implementation of the new core banking system which will lead to the development of automated and operational systems. Consequently, revising work procedures will ensure simplicity and efficiency and will reinforce the expansion plans and facilitate the launching of products and services with the assurance of the best safety and security controls.
Based on the financial performance of the Bank, the Board of Directors have recommended that the General Assembly distribute dividends of 17% of the share’s par value to the shareholders, amounting to JD 17 million. This decision is expected to solidify the capital base so as to cater to further expansion in operations and more competitiveness.
In conclusion, I would like to extend our sincere thanks for the shareholders’ tremendous support, and to our customers for their valuable trust in the services of Cairo Amman Bank. Our appreciation is also extended to all employees for their commitment and hard work and to the Central Bank of Jordan for its efforts and ongoing support. We are fully confident that we will endeavor to provide excellent banking services and achieve better results in the coming years.
Khalid Sabih Al-MasriChairman of the Board
Chairman’s Message


Boardof
DirectorsReport


Cairo Amman Bank Art Gallery
7x7 Art Exhibition - 7 paintings by 7 Jordanian Artists Exhibition featuring the pioneer of Arab Sculpturing, the late Mohammad Ghani Hikmat
Second Annual Children’s Art Competition Elia Kahvedjian Exhibition‘Palestine Remembers’ - photos taken before Al-Nakba


15
World Economy
The year 2011 was a crucial year for the global economy where political uncertainty took precedence to economics, interest rates and earnings; a trend likely to prevail into 2012.
Global activity has slowed, and the expansion has become more uneven with increasing downside risks, accompanied by bouts of global financial market volatility. Although the transient factors that contributed to the slowdown in the first half of the year have partially dissipated, the loss of confidence associated with perceived policy paralysis in many advanced economies, along with deepening balance sheet fragilities, hindered growth in the second half of the year. These factors have already unnerved markets in recent weeks.
Growth in emerging economies has thus far been somewhat more resilient, though there are increasing signs of soft landing as global financial conditions have deteriorated. The European debt crisis remains the core shock of the hour, which carries the threat – although still not the likelihood – of becoming the recessionary tipping point for the global economy. The global economy seems capable of withstanding a mild euro area recession, yet a more severe and disorderly outcome in Europe could still overwhelm the rest of the world, and the risks to our global forecast are still to the downside.
The world’s largest economy stalled in 2011, as the U.S. recovery lost its momentum, reflecting both temporary factors and weaker-than-anticipated private consumption resulting from persistent fragilities in household balance sheets and stubbornly high unemployment.
Political bickering between republicans and democrats over raising the US debt ceiling brought the U.S. to the brink of default in August. An eleventh hour deal that coalesced $2.8 trillion to the ceiling and left decisions regarding the size of spending cuts for a so-called “Super-committee” to decide on November, was viewed as inefficient, failing to put the economy on track of fiscal consolidation. In the end, Standard & Poor’s stripped the country of its gold-platted AAA rating. The impasses are likely to continue into 2012, especially with the presidential election in November highlighting the divide. In this environment of political uncertainty and stalling recovery, the Federal Reserve was forced to announce that it will keep its close to zero benchmark rates on hold into 2013.
Nevertheless, growth seems to have picked up after the wobble of the summer when concerns about the debt ceiling and Europe were at their height. Data released in the last months of the year suggests improvement in the overall macroeconomic environment, or at least sentiment. Employers stepped up hiring in December, pushing the unemployment rate to its lowest level in nearly three years at 8.5%. Private sector activity as well as consumer sentiment continued to improve, but big challenges remain, and the economy remains vulnerable to setback from a deepening crisis in Europe or surging oil prices that would pinch consumers and companies. There is even less clarity when it comes to Europe where multiple attempts failed to prevent a debt crisis from spreading. The eurozone crisis reached a critical stage when Italy joined the seven percent club; as borrowing costs hovered around the believed-to-be unsustainable 7% in the second half of the year. Policymakers’ scramble, at summit after summit to get ahead of the crisis, sparked wild fluctuations in the market. Investor fears escalated as Greek default became more of a probability than possibility, and discussions regarding a euro break-up were no longer a taboo.
The government debt crunch continued to rattle Europe’s financial system and weighed on the fragile global economy. Portugal became the third European country, after Greece and Ireland the year before, to require a €78 billion bailout as its borrowing costs soared and reached unsustainable levels. Later, investors grew worried as contagion spread to other debt-laden countries, such as Italy and Spain, the area’s third and fourth largest economies. The euro area sovereign debt crisis took another turn for the worse in the summer of 2011, when Greece returned to the fore and the possibility of disorderly default increased. Initially, it was the continued lack of cohesion among European policymakers, especially in the debate on private sector haircuts—which unnerved markets and triggered further volatility. Again, the ECB, and the EU tried to tailor further bailout, which was complicated by numerous legal hindrances and private sector haircut stalemate.
Negative sentiment was further exacerbated in the eurozone as growth outturns disappointed, and European economy defined a two-tiered growth, one in Germany, France and the northern league, which embodied fragile recovery. On the other side, the peripherals continued their stagnation and even contraction as Greece marked its fourth year of recession.
With growth momentum waning and financial tensions rising, policy adjustments are called for. Fiscal adjustment became a necessity to stem spiraling debt. As peripheral governments toughened their austerity packages and incorporated further reforms even toppled their governments, in Italy, Greece and Spain, growth remained subdued and deficit targets missed. Contagion engulfed other exposed sovereign markets, which until then had been very liquid (such as Belgium, Italy, and Spain), also affecting stock valuations and interbank markets.
Markets remained tense and the credit freeze escalated by year-end, as investors became more reluctant to lend to European banks exposed to peripheral government debt. In an attempt to soothe market nerves and address the financial credit crisis, European leaders agreed to recapitalize European banks by attempting to inject an extra €200 billion in capital in order to create a satisfactory cash buffer to absorb losses from peripheral bonds.Credit agencies also tried to grasp the headline with a spiral of downgrades on euro area sovereign ratings. As the year drew to a close, Greece went to junk and the AAA status of France came under fire, jeopardizing Europe’s bailout fund.
Economy Highlight

16
European leaders attempted to take important steps to strengthen their crisis management framework at their summits. In particular, to stem contagion, they agreed to make their bailout fund - the European Financial Stability Facility (EFSF) - more flexible and agreed to leverage its capital to €2 trillion. Nevertheless, policymakers have been unsuccessful, as of yet, when it comes to boosting the firepower of the fund or providing a firewall to the crisis ridden economies.
The heightened uncertainty led many to believe that the only institution capable of stemming the crisis and calming markets was the European Central Bank. This began the question of whether the ECB should take on the controversial role of lender of last resort. Jean Claude Trichet, the ECB president at the time, repeatedly stated that the ECB is the lender of last resort for banks not for governments. Mario Draghi, his Italian successor, later re-affirmed that neither the ECB’s mandate nor the European treaties cater for such a massive action.
However, in view of deteriorating economic activity and increasing downside risks, the Central Bank reversed its rate hike cycle, starting in Draghi’s debut policy meeting in November; the benchmark refinancing rate ended the year at the historical low 1.0%. The Central Bank also introduced additional unorthodox liquidity measures, including unprecedented low-interest loans to eurozone banks for a maturity of three years in order to ease the liquidity crunch. In its pre-Christmas offer the ECB extended an unmatched €489 billion to European banks. Moreover, the Central Bank continued with its Securities Market Purchases (SMP), buying Italian and Spanish government bonds to keep yields from rising too high.
Concomitantly, European Union leaders backed by the full power of Germany and France have endorsed a series of rules tightening budget surveillance and institutionalizing limits on public spending - the ‘fiscal compact’ that the European Central Bank (ECB) has demanded before it can more aggressively purchase Italian and Spanish debt.
In the last month of the year, European Union leaders settled on an inter-governmental agreement, outside the judicial and institutional framework of the EU. However, how effective the agreement is remains to be seen, considering the sole focus on austerity while neglecting boosting growth and competitiveness.
The past year unfolded with Japan’s unprecedented triple disaster, the March 11 Great Tohoku earthquake and tsunami. Besides the tragic loss of life and property, the disaster disrupted global supply chains and plunged the Japanese economy into a recession. The nuclear meltdown in Fukushima also led many countries to question the future of nuclear energy—this will have long-lasting consequences for global energy markets and efforts to deal with climate change.
Later throughout the year, the highly indebted country introduced expansionary fiscal stimulus in order to boost the economy and increase reconstruction expenditures. The Japanese economy returned to healthy growth in the second part of the year despite its growing fiscal woes, and it is expected to lead the growth of the advanced economies in 2012.
China, one of the world’s fastest-growing economies, added to the worries as investors fretted about the central government’s ability to rein in inflation, in particular runaway property prices. The country’s manufacturing engine also showed signs of soft landing, as the eurozone, China’s biggest trading partner, appeared to be heading towards recession.
The Chinese officials used monetary policy tools and banking regulations to rein in inflation. They tightened banks reserves requirements, allowed a calculated revaluation of the Yuan and curbed mortgage lending. Towards the fourth quarter of the year, China reaped the benefits of these tightening policies as inflation witnessed a satisfactory drop allowing the People’s Bank of China to reverse its monetary policy and cut benchmark rates in order to stimulate growth. Nevertheless, as we head into 2012, worries of a growth slowdown dominate the scene, enforced by signs of deterioration in China’s trade surplus with the rest of the world. This left room for the country’s officials to return to easing monetary policy and focus back on expansion and growth as inflation is brought under control.
On the commodities front, prices of commodities trended upwards throughout 2011. Buoyed by the disruption of oil supplies following the revolution in Libya, oil prices skyrocketed in the first half of 2011. Saudi Arabia helped cool the prices as the Kingdom increased its oil supply to calm the markets and fill the shortage.
The first three quarters of the year definitely witnessed a gold boom, as gold reached new record highs surpassing $1900 per troy ounce. Gold benefited from its safe haven status amid the geopolitical turmoil in the Middle East and its ramifications on the international economy and the consequences of the spiraling debt crisis in Europe. However, as recovery signs started to show in the US and the war in Libya saw an end, gold receded partially paring its earlier gains.
Economy Highlight

17
Arab Economies
GDP in the MENA region continued to expand in 2011, notwithstanding the political upheaval. The recent geo-political developments have produced mixed effects in various countries of the region, with both Egypt and Libya witnessing contraction in GDP. Egypt’s growth is projected to fall from 5.1% in 2010 to -1% in 2011. Political unrest in Libya has hampered oil production, resulting in unsatisfactory growth estimates. Nonetheless, the Syrian economy is expected to stall given the hit in the tourism sector in addition to the disruption of economic activities and global economic sanctions.
On the other hand, GCC benefited from high oil prices to boost their hydrocarbon dependent economic growth, and enjoyed an international safe haven status. Qatar continues to see impressive growth from 16.6% to 18.7% between 2010 and 2011. The economies of the United Arab Emirates and Saudi Arabia have expanded by 4%, while the Bahraini economy suffered from the aftermath of the political uprising.
Inflationary pressures remained under control throughout the region, with consumer prices in 2011 increased by 3% as MENA countries in the region opted to boost spending in areas including social security, food and fuel subsidies, higher wages for civil servants as well as improved pension packages and tax reductions. These measures served to widen the fiscal deficit from 2.1% of GDP in 2010 to 4.9% of GDP in 2011 for the region. The surplus on the current account is expected to expand significantly from 7.7% of GDP to 11.2% of GDP in 2011.
However, the outlook for this region remains highly dependent on how the political scene unfolds. If the geopolitical conditions stabilize, the MENA economies are expected to post better growth yet can be hampered by huge fiscal deficits and high financing needs.
The performance of Arab stock markets went in the red in 2011, as all of them, with the exception of Qatar, witnessed persistent losses amid liquidity shortages.
The Jordanian Economy
The Kingdom’s economy continued its growth, albeit at a slow pace. Real gross domestic product (GDP) grew by an average of 2.4% in the first nine months of 2011 while it is expected to average around 2.6% throughout 2011. This growth was bolstered by strong activity in the mining, quarrying, finance, and real estate industries.
The main economic sectors posted positive performance in the third quarter of 2011. The quarrying sector has achieved the highest growth rate by 13.4% in the third quarter of 2011 compared with the same period of 2010 at market fixed prices, followed by the sector of agriculture, hunting and fishing by 5.4%. The manufacturing industries followed by 4.3%, then came the producers of government services sector by 3.7%, the transport, storage and communications sector by 3.4%, while the finance, insurance and business services sector, trade, restaurants & hotels sector grew by 2.7% for each of both sectors.
Inflation stabilized in 2011. According to the Department of Statistics (DOS), it was reported that average change in consumer price index during 2011 increased to 4.4% compared with 5% in 2010. Earlier in 2011, the government introduced an economic relief package, subsidizing fuel prices and food prices. This program cost the government direct costs of JD 460 million, while the disruptions of gas supply from Egypt aggravated the situation further, causing the government to incur additional JD 1 billion as additional current expenses.
The Monetary Sector
The Central Bank of Jordan (CBJ) maintained a neutral monetary policy throughout 2011, despite the increased pressure on the foreign reserves. The Central Bank increased its overnight window rate by 0.25%, in the first half of 2010 to reach 2.25% in order to boost the attractiveness of the Jordanian Dinar and to counter inflationary pressures that might rise from disruptions in the supply chain. Moreover, the extension of private credit by the banking sector has improved throughout 2011 despite the fact that access to credit remained on the difficult side, such that credit growth increased by 7.9% in the first ten months of 2011.In addition, CBJ’s foreign currency reserves were under pressure throughout 2011, given the repercussions of the unstable geopolitical situation in the
Leba
non
Egyp
t
Bahr
ain
Kuw
ait
Dub
ai
Jord
an
Om
an
Mor
occo
Abu
Dha
bi
Tuni
sia
Saud
i Ara
bia
Pale
stin
e
Qat
ar
Yearly Percentage Change
1.12%
-2.59% -3.07%
-7.62%-11.68% -12.86%
-15.69%-15.94%-17.00%
-19.78%-20.15%
-20.25%
-49.28%
2004 2005 2006 2007 2008 2009 2010 2011F 2012F
RGDP GDP (%)
8.6%8.1% 7.9%
8.5%7.6%
2.3%
3.1%2.6% 2.8%
2004 2005 2006 2007 2008 2009 2010 2011F
Inflation
2.6%3.5%
6.3%4.7%
13.9%
-0.7%
5.0%4.4%
Economy Highlight

18
Middle East that triggered lower tourism revenues and caused a serious drop in workers’ remittances and foreign investments. Gross official reserves declined by JD 953 million, or 11%, at the end of November 2011 compared to their level at the end of 2010. This level of reserves is equivalent to cover around 6.5 months of the Kingdom’s imports of goods and services.
External Sector
Jordan’s total exports increased by 14.5% during the first 11 months of 2011, as they reached JD 5.14 billion. This increase came as a direct result of a 14.6% increase in national exports that reached JD 4341.5 million, coupled with a 14% increase in re-exports, resulting in JD 803 million in November 2011, compared to the same period of 2010.
Government Budget
The year 2011 was challenging in terms of containing the ballooning state budget deficit that was adversely affected by lower revenues and strikingly high social expenditures. Earlier in 2011, the government introduced its economic relief program, which fixed the rising prices of fuel and staples, increased public sectors’ wages and partially subsidized ballooning electricity costs.
The year 2011 was also characterized by unprecedented levels of foreign grants which exceeded JD 1 billion. Saudi Arabia was the main donor for the Jordanian economy.
The government was successful in controlling and cutting the state budget deficit including grants during the first 11 months of the year. Such that the budget deficit after grants was around JD 738.9 million compared to JD 803 million during the same period in 2010. The decline in the budget deficit was mainly a result of the unprecedented rebound in external grants, which helped in reducing the effect of a tough economic year on the economy.
However, the budget deficit excluding grants ballooned this year, given the 19% increase in current expenditures. Thus, budget deficit excluding grants deteriorated to JD 1840.2 million compared to a deficit of JD 1090.4 million during the same period of 2010.
On a different note, the public debt continued its surge to unsustainable levels. Both domestic debt and foreign debt increased. In light of the above mentioned developments, net outstanding public debt (domestic and external) increased at the end of November 2011 compared to its level at the end of 2010 by JD 1603.9 million or 14% to reach JD 13066.7 million or 64% of projected GDP for 2011, compared to JD 11462.8 million or 61.1% of GDP for 2010, reflecting a rise by 2.9 percentage points.
Amman Stock Exchange
Amman Stock Exchange continued its fifth consecutive year in the red. Characterized with lack of investor’s confidence and meager liquidity, the trading value reached JD 2.9 billion compared to JD 6.7 billion for 2010. The ASE price index weighted by free float shares closed at 1995 points, a decrease of 15.9% compared with the closing of 2010 which stood at 2,374 points.
The number of traded shares also witnessed a decrease during 2011 of 41.7% and reached 4.1 billion shares, traded through 1.3 million transactions, compared with 7 billion shares traded during 2010 through 1.9 million transactions. The share turnover ratio has decreased to reach 58.2% during 2011, compared with 102.2% during 2010.
The non-Jordanian ownership as a percentage of market capitalization has increased to 51.0% at the end of November 2011, compared with 49.6% at the end of the year 2010.
Two new companies have been listed at the ASE during 2011, bringing the number of listed companies to 247. In addition, the market capitalization of listed shares at the ASE has amounted to JD 19.3 billion, constituting 102.7% of the GDP.
Economic Outlook in 2012
The economic environment is expected to continue its moderate growth in 2012, buoyed by the unstable political scene in the Middle East. The economic activity in Jordan is likely to focus on the manufacturing and local services sectors, as the tourism sector is not expected to recover soon. Foreign direct investments are expected to be a major support for the economy in 2012 if the GCC starts to implement new development projects in Jordan as part of its newly launched development fund. Consequently, flat shaped growth is expected to rein in 2012, where the local economic output is forecasted to expand by 2.8%.
2004 2005 2006 2007 2008 2009 2010 2011
10.000
8.000 8
9
7
6.000 6
54.000 4
3
2.000 2
1
0 0
FX ReservesMonths of Imports
FX Reserves
FX R
eser
ves
Mon
ths
of Im
port
s
5.2%4.7% 4.7%
6.2%
8.2%8.5%
6.5%
5.1%
Economy Highlight

19
Export growth is expected to continue its rebound, where annual growth is forecasted to be 12%, but this will be offset by an increase in commodity imports, and raising the fuel import bill. Moreover, the external current account deficit is expected to widen to reach around 9% of GDP in 2012.
The 2012 fiscal policy will focus on maintaining economic stability and absorbing the effect of the geopolitical risks. The state budget for 2012 revealed that fiscal deficit including grants was estimated to trim to at JD 1.027 billion, 4.6% of GDP, compared to a 5.6% level in 2011.
Fiscal consolidation in the medium term is becoming a high necessity in order to bring fiscal and external balances back on track and reduce unsustainable imbalances. This includes putting forward a plan to reduce the budget deficit gradually to reach the international standard of 3% of GDP.
As for the monetary policy, the Central Bank of Jordan is expected to continue on its neutral policy stance. Nonetheless, authorities should also be prepared to take action to boost foreign reserves in case the current decline persists to dangerous levels.
Economy Highlight
20
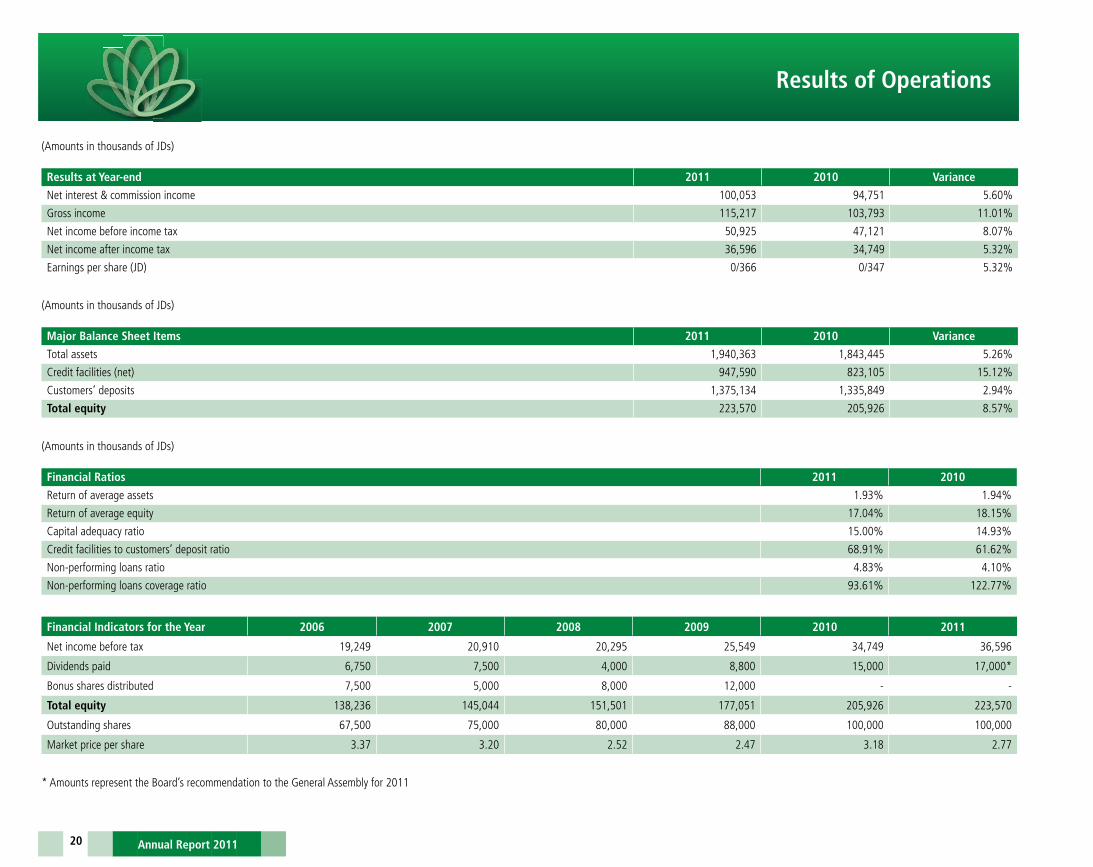
(Amounts in thousands of JDs)
Results at Year-end 2011 2010 Variance
Net interest & commission income 100,053 94,751 5.60%
Gross income 115,217 103,793 11.01%
Net income before income tax 50,925 47,121 8.07%
Net income after income tax 36,596 34,749 5.32%
Earnings per share (JD) 0/366 0/347 5.32%
(Amounts in thousands of JDs)
Major Balance Sheet Items 2011 2010 Variance
Total assets 1,940,363 1,843,445 5.26%
Credit facilities (net) 947,590 823,105 15.12%
Customers’ deposits 1,375,134 1,335,849 2.94%
Total equity 223,570 205,926 8.57%
(Amounts in thousands of JDs)
Financial Ratios 2011 2010
Return of average assets 1.93% 1.94%
Return of average equity 17.04% 18.15%
Capital adequacy ratio 15.00% 14.93%
Credit facilities to customers’ deposit ratio 68.91% 61.62%
Non-performing loans ratio 4.83% 4.10%
Non-performing loans coverage ratio 93.61% 122.77%
Financial Indicators for the Year 2006 2007 2008 2009 2010 2011
Net income before tax 19,249 20,910 20,295 25,549 34,749 36,596
Dividends paid 6,750 7,500 4,000 8,800 15,000 17,000*
Bonus shares distributed 7,500 5,000 8,000 12,000 - -
Total equity 138,236 145,044 151,501 177,051 205,926 223,570
Outstanding shares 67,500 75,000 80,000 88,000 100,000 100,000
Market price per share 3.37 3.20 2.52 2.47 3.18 2.77
* Amounts represent the Board’s recommendation to the General Assembly for 2011
Results of Operations

21
138.236 145.044151.501
177.051
205.926
223.570
2006 2007 2008 2009 2010 2011
Shareholders’ Equity
889.357
994.859
1.125.348
1.264.097
1.335.849
1.375.134
2006 2007 2008 2009 2010 2011
Customers’ Deposits
119.01%122.77%
93.61%
116.68%
91.33%
70.96%
2006 2007 2008 2009 2010 2011
Provision Coverage
2006 2007 2008 2009 2010 2011
Total Assets
1.178.850
1.319.245
1.465.244
1.746.914
1.843.445
1.940.363
567.326
595.211
687.476
784.546
878.294
1.003.354
2006 2007 2008 2009 2010 2011
Gross Credit Facilities
10.81%
6.02%4.94%
4.53%4.10%
4.83%
2006 2007 2008 2009 2010 2011
Non-Performing Loans Ratio
Results of Operations

22
Analysis of Results of Operations
Despite the decline in the growth rate of the economy and its effect on the growth on various economic sectors, the Bank managed to achieve record results surpassing the amount budgeted for the year. Net income before taxes amounted to JD 50.9 million compared to JD 47.1 million in 2010, attaining a growth of 8.1%; while net income after tax amounted to JD 36.6 million compared to JD 34.7 million in the previous year, an increase of 5.3%, bringing the earnings per share to JD 0.366 compared to JD 0.347 in the previous year. It is worth mentioning that as a result of the early adoption of IFRS (9), income of JD 2.5 million that resulted from selling financial assets were reflected directly in the shareholders equity without passing by the Profit & Loss accounts, as a result, compared to the previous year results, net income was JD 39.1 million, 12.5% higher than the previous year.
These results were driven by robust growth in all operational indicators. The net interest income increased by 7.3%, reaching JD 80.8 million compared to JD 75.3 million in 2010. Net commission income continued to post strong results at JD 19.3 million, while the Bank’s investment portfolio posted a profit of JD 8.3 million compared to JD 1.3 million in the previous year. As a result, gross income amounted to JD 115.2 million, compared with JD 103.8 million by year end 2010, thereby increasing by 11%. Moreover, the Bank reinforced its operational capability, as its earnings from interest and commission comprised 86.8% of the gross income.
Conversely, gross expenditure, including provisions against decline in credit facilities, rose by 13.4% or JD 7.6 million to reach JD 64.3 million. This also includes a 12% increase in employees expenses resulting from the implementation of the new salary scheme in Jordan and thus granting employees annual increases of a minimum of 7% in addition to the increase in the number of employees to accommodate new branches and expansion of the Bank’s activities. Furthermore, other operating expenses increased by JD 1.1 million, or 6.4%, as a result of new branches which contributed to increasing rent expense as well as other related expenses. Rent expenses also increased as a result of renewing some of the existing lease agreements at higher costs.
The operating expenses include JD 1.7 million as additional provisioning against non-performing loans, compared to JD 2.2 million for the previous year. The Bank also increased the provision against law suits by JD 4.4 million, JD 2.9 million higher than the previous year.
These results were accompanied by a notable improvement in the Bank’s performance indicators and profitability. Gross expenditure to gross income decreased to 50.4% compared to 51% in 2010. The return on the average assets amounted to 1.93%, and the return on equity reached 17.04%.
Analysis of the Bank’s Financial Position
During the year, the Bank achieved high growth rates in most of its operating indicators. Total assets grew by 5.3% to reach JD 1940.4 million, an increase of JD 96.9 million over the end of the previous year. Gross credit facilities increased to JD 1003.4 million compared to JD 878.3 million in 2010, a growth of 14.2%, which was achieved through the Bank’s policy of diversifying its customer base and focusing on retail loan targeting reputable companies. This policy has contributed largely to improving the quality of the credit facilities portfolio, as net non-performing loans ratio slightly increased to reach 4.83% of the gross loans versus 4.1% for 2010. As a result, the net credit facilities portfolio amounted to JD 947.6 million compared to JD 823.1 million for the previous year, witnessing an increase of JD 124.5 million; a growth rate of 15.1%. The Bank also improved its level of provisions for loan loss to JD 45.2 million, where coverage ratio now stands at 93.6%.
The Bank and its subsidiaries adopted the early implementation of IFRS (9) starting from January 1st of 2011, and resulted in reclassifying its investments in stocks and bonds as explained in disclosure (54) to the financial statements. The investment portfolio amounted to JD 490.9 million compared to JD 420.6 million in the previous year. This increase emanated from additional investments in bonds, mainly government bonds, and other financial instruments held to maturity as their balance rose by JD 63.8 million to reach JD 375 million at year-end. This all conforms to the Bank’s plan of preserving its liquidity by ensuring an acceptable tradeoff between low-risk instruments and higher return. However, investments in shares declined due to the decline of market value of some local stocks in addition to selling some of those investments.
Results of Operations
Financial Instruments Income 7%
Other Income 6%
Net Interest Income 70%
Net Commission Income 17%
Gross Income
Retail 51%
Government and Public Sector 10%
Small and Medium Enterprises 5%
Corporate 21%
Real Estate 13%
Credit Facility Portfolio

23
Despite the competition amongst banks to attract deposits, the Bank was able to widen its customer base, as customers’ deposits increased to JD 1375.1 million compared to JD 1335.8 million for 2010, achieving a growth of 2.94%. The Bank maintains a high liquidity level that conforms to international standards and regulatory authorities, which provides a source of reassurance to all parties dealing with the Bank. Credit facilities constitute 68.9% of the customers’ deposits which in turn constitute 71% of the overall sources of funds.
Shareholders’ equity amounted to JD 223.6 million at the end of 2011 compared to JD 205.9 million at the end of 2010, an increase of 8.6%. The Bank’s dividends policy solidified the capital adequacy ratio (CAR) which reached 15% compared to 14.93% as of the end of the previous year. The Bank’s CAR is above the minimum level set by the Central Bank of Jordan of 12%. The ratio of the core capital reached 14.04%, and the leverage ratio of weighted shareholders’ equity to gross assets reached 9.55% which places the Bank in the first “well-capitalized” category under the solvency scale.
Proposed Dividends
The Board of Directors recommended that the general assembly distribute 17% cash dividends to the shareholders. This recommendation is part of the Bank’s strategy to reinforce its paid-in capital and fortify its ability to expand the scope of its operations and activities as well as increase its competitiveness.
Results of Operations
Customers’ Deposits 71%
Borrowings 3%
Equity 12%
Others 3%
Bank’s Deposits 10%Margin Accounts 2%

24
Retail Banking
Cairo Amman Bank maintained its leading role in providing banking services to individuals while holding a sizeable share of the market, which is considered the main pillar of the Bank’s strategy. The Bank focused on providing direct sales and presenting special offers to target segments, and continued developing such offers to cater for its customers’ needs. The Bank also continued offering ATM loans and increasing the number of customers eligible for this program, as well as expanding some of its competitive products such as consumer lending including increasing the number of companies approved under this program. In addition, the Bank launched its Platinum credit card accompanied with a loyalty program with “e-points” to encourage the holders of Platinum and Golden credit cards to use them. Moreover, the Bank’s marketing and promotional campaigns supported its activities in this field. This includes several incentive campaigns directed at customers such as the Savings Accounts campaign, and the Quarter Million Room campaign. Other incentive campaigns included the Salary Transfer campaign, the Mother’s Day campaign, and Eid related campaigns providing customers with the opportunity to defer payment of loan installments.
The Bank continued expanding its micro financing project, which provides loans to small craftsmen and professionals; through capitalizing on the Bank’s wide spread presence in the Jordan Post Company offices.
Furthermore, the Bank continues to finance beneficiaries of the Royal Initiative “Decent Housing for Decent Living” through granting fixed-interest loans with a repayment period of 30 years.
The Bank’s policies and programs during the year increased retail loans and housing loans by 17.2% and 9.4% respectively, bringing the balances thereof to JD 512.4 million and JD 124 million respectively.
Small and Medium Enterprise (SME) Credit
Cairo Amman Bank continued to reinforce its leading role in SME lending despite the challenging economic conditions through understanding its clients’ business process and needs and accordingly tailor comprehensive solutions and products.
The Bank was able to surpass the year’s target in terms of a number of customers as well as balances of direct and indirect facilities. The outstanding portfolio of SME loans grew by 8.4%, reaching JD 50.5 million. The quality of the portfolio was maintained through reducing over-due payments, default risk, and conforming to the Central Bank of Jordan’s instructions.
Corporate Credit
Despite the challenges that deterred the performance of core economic sectors this year, the Bank continued to cater for their corporate customers’ financial needs in accordance to the directions set by the Board, aiming at achieving satisfactory returns while maintaining a moderate level of credit risk. These guidelines translated into attracting credit worthy customers, as well as increasing the ceiling of facilities for existing customers with high solvency and excellent records, all the while encouraging them to make optimal use of the new ceilings and focusing on indirect facilities and trade finance. The year witnessed a growth in corporate credits by 12.6% to reach JD 316.5 million accompanied by a notable growth in indirect facilities.
Treasury and Developing Sources of Funds
The aftermath of the global economic crisis characterized by lower local and international interest rates in addition to higher market volatility, steered the Bank to adopt unorthodox measures to manage money and FX markets’ risks. These measures did not curtail the Bank’s ability to sustain its profitability and customers’ deposits. In addition the Bank continued to efficiently manage its assets and liabilities to maintain adequate liquidity levels consistent with its policy as well as those of regulatory authorities.
Cairo Amman Bank maintained its pioneering trading platform “CABFX”, a service that allows its customers to trade in foreign currencies and precious metals at spot market prices through the Bank’s website, using a secured platform that is consistent with the rates and legislations set by the Central Bank of Jordan. This platform attracted new customers as local investors found the service very appealing. The Bank further continued to offer its customers with a broader spectrum of products such as option contracts, future contracts, and structured FX products, which are customized to suit the client’s needs in addition to hedging solutions tailored to cover risks of foreign exchange fluctuation.
The Bank continued to foster its relations with local and international banks, widening its network of correspondent banks. This in turn increased the credit ceilings granted to Cairo Amman Bank, and allowed the Bank to offer the best services and rates to its clients.
The Bank’s Activities During 2011

25
Investment Services
The Bank offers through its subsidiaries – Awraq Investment in Jordan and Al-Wataniyah Securities Company in Palestine – local, regional and international brokerage services. It also offers asset management services, such as management of customers’ investment portfolios, establishment and management of multi-purpose investment funds, as well as financial and investment consultation services, in addition to conducting studies and researches.
Branch Network
In order to achieve the largest geographical spread and spacious outlets that offer the best banking service to customers, and complies with the Bank’s corporate identity, Cairo Amman Bank opened nine new branches and offices during 2011, bringing the number of the Bank’s operating branches and offices to 94 branches, out of which 21 branches in Palestine. The Bank also renovated five branches in accordance to the Bank’s corporate identity.
In addition, the Bank increased its ATM network, adding seven ATMs in Jordan and five in Palestine bringing the total number of ATMs to 224. Furthermore, the Bank provides its services through 96 of the Jordan Post Company’s offices dispersed throughout the Kingdom, in order to provide banking services to customers in municipalities and remote areas that lack such financial services.
The Bank added a digital dimension to its services to save time and effort of the customers by developing its own smartphone application. This application includes the locations and detailed information about the branches, enables customers to locate the nearest branch, as well as the location of Jordan Post Company offices and the companies approved by the Bank for the easy installment program.
The outlets providing Western Union services including the Bank’s branches and other sub-agents achieved during the year increase in the transfers by 6% compared to the previous year. Annual transfers amounted to more than JD 210 million divided between inbound and outbound transfers done through 185 outlets. In addition, the Bank completed its plans to develop the money transfers services through Western Union, thus increasing the number of outlets and implementing unified quality standards for providing the service to customers. In collaboration with Western Union Company, the Bank organized several activities targeted to the foreign communities in Jordan.
Information Technology
Following through with the improvements introduced in the past years, the Bank focused its efforts during the year in upgrading the infrastructure as well as improving the business continuity and security systems.
The Bank worked on laying the foundation for implementing the new core banking system, expected to be fully implemented in 2012. Furthermore, several enhancements were made to the electronic system that provides customers with a variety of new services and products. The communication network was upgraded to become a Wide Area Network to cover all of the Bank’s branches and ATM networks, the head office and regional office in Palestine, as well as the data recovery center using Multiprotocol Label Switching (MPLS).
Human Resources
During 2011, Cairo Amman Bank continued implementing its Human Resources strategy of employing qualified staff with proper education, experience, and skills, aiming at placing the right person into the right position and giving the priority to existing employees to fill vacancies ahead of outside recruitment.
In addition, the Bank implemented the new employment structure including a new salary scheme that was developed in coordination with Hay Group. Implementing the new structure was accompanied with developing a career path for most of the positions, which included the required education, experience, and skills of the position and allowing employees to acquire necessary training to be able to fulfill those requirements.
Al-Karak Branch - Althaniah Jabal Amman Branch - Islamic Scientific College st.
Jordan University Hospital Branch Salt Branch - King Abdullah II st.
Jabal Al-Hussein Branch - Beer Al-sabe’a
The Bank’s Activities During 2011

26
The total number of the employees of the Bank and its subsidiaries is 2088 employees with academic qualifications as shown below:The Bank Awraq Investments Al-Wataniyah Securities Total
Masters 76 3 3 82
Higher Diploma 8 - - 8
Bachelor 1255 23 9 1287
Diploma 344 2 2 348
High School 219 - 4 223
Lower than High School 137 3 - 140
Total 2039 31 18 2088
The Bank’s employee training, development and re-qualifying policy aims at improving employees’ knowledge, skills, and capabilities. This is essential to develop their competencies and capabilities so that they may best perform their duties and consequently raise their efficiency and productivity, providing the best banking services to the customers. Employees are qualified to hold supervisory and managerial responsibilities through specialized training courses.
The Human Resources Division identifies the employees’ training needs based on the following:
• Present and future strategic plans and directions • New procedures and instructions• Employee performance appraisal• New business systems and technology• Succession and career development plans
An annual training program is prepared consisting of a variety of courses in various fields to meet training needs and enhance employee efficiency. The Bank’s training and development plans cover all banking and non-banking aspects and are designed to fulfill the technical, managerial, and behavioral needs of all employees.
By the end of 2011, the Bank trained a total of 2,799 participants in a variety of courses and conferences that were conducted by training experts from the Bank, as well as local and international institutions as follows:
Subject Number of courses Number of participants
Information Technology 29 246
Trade Finance 12 217
Management, Behavior & Safety 56 501
Finance & Accounting 19 124
Credit Facilities 39 402
Internal Audit 13 76
Risk & AML 37 295
Treasury & Investment 13 98
Legal 16 190
Marketing & Sales 27 337
Procedures & Systems 6 188
Security & Safety 2 94
Other 9 31
Total 278 2799
The Bank’s Activities During 2011

27
The Bank also continued its “Future Bankers” program, and qualified 20 new employees using this program. A selection of Jordanian graduates with distinction were given banking, technical, behavioral, and on-the-job training and were then assigned to positions in all of the Bank’s departments.
In addition, the Bank encouraged the continuous education of the employees by allowing them to continue their graduate studies, as well as providing scholarships to their children. Furthermore, the Bank provided 345 training opportunities for students of local universities and colleges all around the Kingdom and coordinated with various local community centers on providing training and workshops for students and graduates.
The Bank and Local Communities
The Bank continued its commitment to actively support the local community. Accordingly, the Bank has been keen on assisting various organizations in compliance with its vision based on the importance of interconnecting with all strata of the community concerning various activities and functions in its areas of operation. For the consecutive year, the Bank sponsored the Hussein Cancer Foundation Children’s Summer Camp which is considered to be one of the most successful activities of the Foundation. In addition, the Bank continued its support to HM Queen Rania’s “Madrasati Initiative” for improving the educational environment in disadvantaged schools in the Kingdom through support in Abu Bakr Al-Saddiq School in Al-Mafraq, refurbishing its facilities and repairing the infrastructure in the school. Our employees paid visits to the school to reach out to the students through recreational functions and extracurricular activities. The employees participated with the students in painting the school walls to revamp the school and cultivate the students’ sense of responsibility toward their schools. This activity would be added to previous similar activities done by the Bank in Raymon Elementary School in Jerash and Qurayqirah School in Aqaba.
Future Bankers Program Bank Employee Workshop
King Hussein Cancer Center Summer Camp King Hussein Cancer Center Summer Camp
Madrasati InitiativeRaymon Elementary School - Jerash
Madrasati InitiativeQurayqirah Elementary School - Aqaba
Madrasati InitiativeAbu Bakr Al-Saddiq Elementary - Mafraq
The Bank’s Activities During 2011

28
Believing in the importance of investing in the youth, the Bank provided its support to Luthan Center for Youth Development in its “Loyac Summer Camps” as well as Elia Nuqul Foundation “Today’s Youth for Tomorrow’s World” through providing 10 training and work opportunities for students of Jordanian public universities. In addition, the Bank supported the Save the Children Foundation School-to-Career Program whose broad aim is to support students transitioning from school into meaningful work or further education by integrating the School-to-Career concept within the educational system.
Moreover, the Bank sponsored a number of soccer and basketball tournaments at schools, emphasizing its unflagging support to
sports and youth activities in the Kingdom. It also supported Amman Baccalaureate’s School Marathon as well as the Students’ Counsel elections in New English School.
In recognition of its responsibility towards the local Palestinian community, the Bank continued implementing the Banks in Action program in collaboration with Enjaz Palestine through providing a number of qualified employees to conduct specialized training courses and supervise the implementation of the program at the Palestinian schools and universities. The importance of this program stems from the notion that experts introduce the youth to the banking environment, hence, qualifying them for practical life and preparing a generation of bankers capable of leading the banking industry in Palestine and lifting it to the highest levels. In addition, the Bank sponsored a number of cultural and sports activities such as the Cultural Festival in Tulkarem, the opening day at Birzeit University, and other events.
Save the Children Foundation SOS program
Stars Sports Club Baccalaureate School Marathon
Soccer and Basketball Tournament - National Orthodox School
Student Counsel Elections - New English School
The Bank’s Activities During 2011

29
During the year, the Bank donated a total of JD 435.2 thousand to accomplish the aforementioned activities. These donations were distributed upon the following sectors:
(Amount in thousands of JDs)
Health Sector 58.2Educational Sector 165.6Social and Community Services 192.6Sports Activities 13.5Other 5.3
Cairo Amman Bank Gallery
Cairo Amman Bank Gallery officially opened in August of 2008 and hosted its first activity; An Exhibition for 7 Jordanian Artists. Following, the Gallery held exhibitions for more than 60 Jordanian and Arab artists including the leading Arab Iraqi sculpturer, the late Mohammed Ghani Hikmat. The Gallery managed to translate its vision of supporting art, multi-generational and multi-method exhibitions into a reality to become a cultural forum and to present the vital role large corporations can play in supporting the cultural movement.
In addition to hosting exhibitions, the Gallery went beyond to include support in printing of books, festivals of theatre and the arts in Jordan, such as Amman International Theatre Festival, the Free Theatre, and various cultural events.
Exhibition 2 for Easy Financing and Investment
Philadelphia University Career Day Exhibition
Fifth International exhibition for the Building, Contruction and Engineering Industries
7x7 Art Exhibition7 paintings by 7 artists
The pioneer of Arab Sculpturing The late Mohammad Ghani Hikmat
The Bank’s Activities During 2011

30
In collaboration with Fabiriano International Company, the Gallery invited students of different age groups to participate in the second children’s drawings contest held by the Bank annually. The competition included different topics such as, the environment, the pride in homeland and identity, daily life, and Jerusalem in the Eyes of our Children, allowing participants the opportunity to express on these topics using water colors, wood, oil, graphic art and poster. The Bank awarded winners in each age group with a savings account; and the grand prize was a trip to Italy to visit the Fabiriano factories. The Bank also printed a booklet including the winning works of art and the others presented in the gallery. The number of participants in the competition was 80 students. The Bank’s Competitiveness
The Bank strengthened its position as one of the leading banks in Jordan, bolstered by its achievements during this year and the preceding years. The Bank was awarded by the London Media News World as the “Best Commercial Bank in Jordan” in 2011. Capital Intelligence confirmed its rating of the Bank for the year despite the adverse economic situation in the country which did not allow for improving the rating.
Cairo Amman Bank is considered a pioneer in retail banking, offering loan programs that cover individual, micro-financing and small enterprises. It has special programs for granting loans to low-income persons and small enterprises. The Bank stands out for its wide-spread branches and offices, totaling 94 in Jordan and Palestine, inter-connected with a well-developed communication network, enabling the Bank’s customers to complete all their banking transactions at any branch or office. Additionally, the Bank has a network of 224 ATMs.
The Bank’s market share of total deposits in Jordan is 3.47%, and 4.8% in credit facilities respectively, and 8.95% and 8.23% in Palestine.
Profile of Subsidiary Companies
Al-Watanieh Securities CompanyAl-Watanieh Securities Company was established in Ramallah, Palestine in 1995, as a limited liability company. It acts as a broker at the Palestine Stock Exchange. Currently, it has offices in Gaza, Nablus and Bethlehem. The Bank owns 100% of its paid-up capital totaling JD 1,500,000.
Al-Watanieh for Financial Services Company “Awraq Investment”Al-Watanieh for Financial Services Company “Awraq Investment” was established in Amman during 1992 as a limited liability company to operate as a broker in the Amman Stock Exchange. The Bank owns 100% of its paid- up capital totaling JD 5 million. The Company’s operations include local, regional and international brokerage services, consulting services, assets management and managing investments funds.
The Bank commissioned the Company to manage its investment portfolio in bonds.
Second Annual Children’s Art CompetitionSecond Annual Children’s Art Competition
The Bank’s Activities During 2011

31
The Bank will strive to maintain its 2011 achievements and to post good growth rates through improving the efficiency of its banking services and expanding its customer base while maintaining the quality of the credit facilities portfolio.
Following are the most important items of the business plan for 2012:
• Implementation of Basel II agreement, especially clauses related to the second pillar “managerial review” and to prepare for Basel III requirements, as well as reinforcing sound corporate governance
• Maintain adequate liquidity levels by increasing customers’ deposits, and continue the cash and in-kind prizes schemes
• Solidifying the Bank’s leading position of providing banking services to individuals by expanding cross-selling and preparing specific programs that fulfill the needs of all customers
• Maintaing the quality of the credit facilities portfolio, through expanding the size of the portfolio while continuing efforts to settle non-performing loans and increase the coverage ratio
• Continuing to implement the IT development plan to enhance the Bank’s performance, including the new core banking system and communication channels
• Increasing performance efficiency and cost control while maintaining the quality of services
• Expanding sales outlets by opening 3 new branches in several targeted areas in Jordan and Palestine
• Continuing with the renovation of the Bank’s branches in accordance to its corporate identity through the renovation of 5 branches in Jordan and Palestine
• Improving the efficiency and skills of the Bank’s employees through implementation of the annual training plan, and continue with the Future Bankers program
• Continuing the Bank’s participation in supporting the local community, which is part of the Bank’s social responsibility
Business Plan for 2012

32
Risk is inherent in the Bank’s activities; the process of risk management is critical to the Bank’s continuing profitability through implementing a comprehensive strategy for risk management by addressing the risks and attempting to mitigate them through specialized risk management committees such as the Risk Committee, Assets & Liabilities Committee, Investment Committee, and Procedures Development Committee, in addition to specialized departments within the Bank such as the Risk Management Department, Compliance and Anti-money Laundering Department and Internal Audit Department. Further, each individual and department within the Bank is responsible for the risk exposures related to his or her responsibilities.
The risk management process include identification, measurement, and evaluation of risks whether financial or non-financial risks that could negatively affect the Bank’s operations or reputation.
During the year and in accordance with the Central Bank of Jordan’s requirements related to the implementation of the second pillar “managerial review” of Basel II, the Bank developed and implemented the overall framework for internal capital adequacy assessment process (ICAAP) including: documenting the methodologies used to measure and manage all financial and non-financial risks in addition to determining the Bank’s capital requirements that align with various risks levels, the Bank’s control environment, business plan and the volume of its operations.
The risks facing the Bank include:
Credit Risk Credit risk is the risk that one party to the financial instrument will fail to discharge an obligation and cause the other party to incur a financial loss. The Bank manages credit risk by setting limits for individual borrowers, and groups of borrowers and for geographical and industry segments. The Bank also monitors credit exposures, and continually assesses the credit worthiness of counterparties.
The Board of Directors’ approves on an annual basis credit granting budgets that observes the geographical and segmental limits.
The Bank follows different procedures to mitigate the risks, including determining the acceptable types of collaterals and their conditions, taking into consideration that the value of the collateral is not related to the business of the customer. Moreover, the Bank requires insurance policies on certain properties as a means of mitigating risks.
The Bank has several departments for monitoring credit facilities and reporting any warning signs in advance in order to ensure proper monitoring and follow-up.
Market Risk Market risk arises from fluctuations in fair value or cash flows of financial instruments as a result of changes in interest rates, foreign exchange rates and equity prices. Market risks are monitored according to policies and procedures set by the Bank that includes sensitivity analysis in addition to stop loss limits. Market risks include interest rate risk, liquidity risk and equity price risk.
Liquidity RiskLiquidity risk is the risk that the Bank will be unable to meet its payment obligations when they fall due under normal and stress circumstances. To limit this risk, management has arranged diversified funding sources in addition to its core deposit base, manages assets with liquidity in mind, and monitors future cash flows and liquidity on a daily basis. In addition, the Bank has a liquidity contingency plan.
Operational RiskOperational risk is the risk of loss arising from systems failure, human resources, fraud or external events.
Maintaining an adequate internal control structure is key in managing operational risk. Accordingly, the Bank’s management paid considerable attention in continued development of the control environment in all activities and operations of the Bank, as the operational risk policy covers all of the Bank’s divisions, branches and subsidiaries.
The Bank also implemented a business continuity plan through the completion of business impact analysis in addition to setting a disaster recovery site fully equipped with the necessary technology and required human resources to continue the Bank’s operations during emergency situations.
Compliance RiskCompliance risk is the risk of legal sanctions, financial losses or reputational risk as a result of non-compliance with laws, regulations, standards of conduct and sound banking practices issued by the local and international regulatory authorities.
The Bank issued compliance and the Anti-money Laundering policy, approved by the Board of Directors, whereby database of all related laws and regulations is maintained in addition to designing a guide of regulations related to the Anti-money Laundering and Terrorist Financing Acts, including all related financial and non-financial reports.
The Bank has set up a risk-based classification of laws and regulations to determine the degree of risk for non-complying with each, within the regulatory risk-based matrix.
Risk Management

33
The Bank gives a great deal of importance to proper corporate governance practices based on the principles of transparency and responsibility. The Bank follows sound professional practices that is in compliance with Central Bank of Jordan regulations, as well as the regulatory requirements of other countries in which it operates.
The presence of an effective, professional and independent Board of Directors is one of the most important requirements of sound corporate governance practices. The Board’s primary role is to protect and enhance the shareholders’ long-term value through the establishment of strategic direction and monitoring achieving the goals by the executive management.The Bank’s Board of Directors is composed of 12 members that were elected for a period of four years by the General Assembly during its meeting held on March 24, 2010. The members of the Board have a range of skills and experiences that increases the effectiveness of the Boards. All members of the Board are non-executive members.
To assist it in carrying its duties, the Board of Directors have established several specialized committees, each having their own roles and duties:
Corporate Governance CommitteeThe Corporate Governance Committee is composed of the following members:Mr. Khaled Al-Masri (Chairman)Mr. Nashat Al-MasriMr. Sharif Al-Saifi
The duties of the Committee include directing the preparation, updating and the implementation of the Bank’s Corporate Governance Code.
Audit & Compliance CommitteeThe Audit & Compliance Committee is composed of the following non-executive members:Mr. Ghassan Akeel (Chairman)Dr. Bassam Al-SubaihiMr. Sharif Al-Saifi
The duties of the Audit & Compliance Committee includes:- Reviewing the financial statements before being presented to the Board of Directors, in addition to meeting with external auditors and making necessary recommendations- Supervising internal audit activities, including reviewing the annual internal audit plan, and the internal audit reposts- Recommending to the Board of Directors with the accounting policies and practices of the Bank as well as reviewing all accounting issues that have a significant effect of the financial statements- Reviewing the Bank’s internal controls and its adequacy through the reports of the internal audit department and the external auditors- Recommending to the Board of Directors the appointment or the removal, the remuneration and other contractual terms of the external auditors, in addition to assessing the objectivity of the external auditors, including the
consideration of any other non-audit work performed by the external auditors- Receiving and reviewing compliance reports
The Audit & Compliance Committee meets on a regular basis every three months, and meets with the Head of Internal Audit Department as well as the external auditors and Head of Compliance at least one time during the year without the presence of members of the executive management.
Risk Management CommitteeThe Risk Management Committee is composed of the following members:Mr. Khaled Al-Masri (Chairman)Mr. Yazid Al-MuftiMrs. Suhair Sayed
The duties of the Risk Management Committee includes:- Reviewing the Risk Management strategy before being approved by the Board, and assessing its effectiveness on a continuous basis- Ensuring the existence of policies and framework of the risk management function, and reviewing it on a regular basis- Reviewing and recommending to the Board, in conjunction with executive management, proposed aggregate loss limit targets for various risk categories (e.g. loan losses, market losses, operational losses), paying special
attention to capital adequacy and liquidity requirements- Submitting regular reports to the Board indicating risk- Overseeing the Head of Risk Management and the annual plan of the department activities- Ensuring that the risk management function has adequate expertise and resources to fulfill its responsibilities- Reviewing assumptions used in risk measurement models
Corporate Governance and Other Disclosures

34
- Overseeing the development of the risks database- Reviewing stress tests on credit, liquidity, market and operational risks and approving contingency planning- Reviewing the reports of the Risk Management department- Monitoring the Bank’s preparation and implementation of Basel II with respect to risk management and measurement issues- Receiving regular reports from the Assets Liabilities committee- Ensuring the existence of business continuity plan and testing it on a regular basisThe Risk Management Committee meets at least four times a year, and submits reports to the Board of Directors on a regular basis. The General Manager, Deputy General Manager for Banking Operations, Deputy General Manager and Regional Manager of Palestine Branches, Head of Finance and Head of Risk Management attend its meetings.
Investment CommitteeThe Investment Committee is composed of the following members:Mr. Khaled Al-Masri (Chairman)Mr. Yazid Al-MuftiDr. Farouq Zuaiter
The Committee sets and reviews the Bank’s investment policy and looks into new investments opportunities.
Real Estate CommitteeThe Real Estate Committee is composed of the following members:Mr. Khaled Al-Masri (Chairman)Mr. Ibrahim Abu Al-RaghebMr. Yasin Al-Talhouni
The Committee reviews and approves management’s real estate sales recommendation.
Nomination & Remuneration CommitteeThe Nomination & Remuneration Committee is composed of the following members:Mr. Khaled Al-Masri (Chairman)Mr. Yazid Al-MuftiMr. Mohammad Barakat
The duties of the Risk Management Committee include:- Setting the method to assess the effectiveness of the Board and its Committees- Determining whether a director is independent considering the minimum standards for independence set out in this code- Nominating board appointments to the General Assembly- Providing background briefing material for directors as requested, as well as ensuring that they are kept up-to-date on relevant banking topics- Recommending to the Board the remuneration of the General Manager including monthly salary and other benefits. The Nominations & Remuneration Committee also reviews the bonuses and other remuneration of other
executive management- The Nomination & Remuneration Committee ensures that the Bank has a remuneration policy sufficient to attract and retain qualified individuals and is in line with the Bank’s peers in the market- The Committee meets on a regular basis, and members of the executive management are invited to attend its meetings, if necessary.
Corporate Governance and Other Disclosures

35
Board of Directors as of December 31, 2011
Khaled Sabih Al-MasriChairman of the BoardMember since: 1995Date of birth: 1966Academic Qualifications:Masters in Business AdministrationBachelor in Computer EngineeringProfessional Experience:Chairman since July 1999Chief Executive Officer from October 2004 until December 31, 2007Chairman of Jordan Himmeh Mineral CompanyBoard member in several companies including Zara Investment (Holding) Company, Jordan Hotel and Tourism Company and Royal Jordanian Air Academy
Yazid Adnan Al-MufitMember since: 1991Date of birth: 1953Academic Qualifications:Bachelor in Business AdministrationProfessional Experience:General Manager of Cairo Amman Bank from 1989 until October 2004Experience in banking through his work at CitibankBoard member in many companies such as Zara Investment (Holding) Company, Palestine Development and Investment Company (PADICO) and Middle East Insurance Company
Mohammad Kamal Eddin BarakatVice ChairmanMember since: 2006Date of birth: 1952Academic Qualifications:Masters in Finance and MarketingBachelor in BusinessProfessional Experience:Chairman of Banque Misr since December 2002Experience in banking for more than 30 years through his work as the General Manager of Egyptian American Bank since April 1980 to February 1996, Deputy Chairman and CEO of Egyptian Gulf Bank from March 1996 to December 2002, and Chairman of Banque Du Caire from September 2005 to September 2011Chairman of Banque Misr LibanBoard member of Central Bank of Egypt, Egyptian Banking Institute, the Arab Academy for Banking and Financial Sciences, Union of Arab Banks and Visa, inc.
Ibrahim Hussein Abu Al-RaghebMember since: 1992Date of birth: 1945Academic Qualifications:Bachelor in Business AdministrationProfessional Experience:Chairman and General Manager of Arab Steel Manufacturing CompanyVarious administrative experience
Yasin Khalil Al-TalhouniMember since: 1998Date of birth: 1973Academic Qualifications:Bachelor in EconomicsProfessional Experience:Board member in various companies such as Zara Investment (Holding) Company, Jordan Hotel and Tourism Company, Jordan Project for Tourism Development and Jordan Electricity Company
Dr. Farouq Ahmad ZuaiterMember since: 2002Date of birth: 1936Academic Qualifications:Ph.D in Accounting, Economics and StatisticsMasters in AccountingBachelor in AccountingProfessional Experience:Former CEO of Palestine Development and Investment Company (Padico)Financial and administrative experience through working as deputy CEO of Trust Company, deputy general manager and Projects Manager in Al-Sahel Development and Investment Company (Kuwait)Chairman of Hisham Hijjawi College of TechnologyVice Chairman of Najah University board of trusteesFormer assistant professor in DePaul University and University of ChicagoBoard member of Palestine Telecommunication Company, Jordan Vegetable Oil Industries Company, Palestine Investment Bank and VTel Holding
Nashat Taher Al-MasriMember since: 2002Date of birth: 1971Academic Qualifications:Masters in Public PolicyBachelor in EconomicsProfessional Experience:Partner in Foursan GroupWorked as Vice President - Investment Banking in J.P. MorganBoard member in many companies such as Isra Investment Company, Siniora Food Industries, Aqaba Development Company and Royal Jordanian Air Academy
Corporate Governance and Other Disclosures

36
Ghassan Ibrahim AkeelMember since: 2002Date of birth: 1968Academic Qualifications:Masters in Business AdministrationBachelor in AccountingCertified Public Accountant (CPA)Professional Experience:Deputy General Manager of Astra Group – Saudi ArabiaExperience in public accounting through his work as Audit Manager in Big Five accounting firmBoard member of Astra Industrial Group, Vtel Holding Company, Arab Cooperative Insurance Company
Bassam Ali Al-SubaihiMember since: 2009Date of birth: 1963Academic Qualifications:Ph.D in EconomicsMasters in Business AdministrationBachelor in Business AdministrationProfessional Experience:Head of Risk Management Department in the Social Security Corporation.Former lecturer at Coventry Technical College – UKExperience in audit, risk management and finance through his previous work in Social Security Corporation and other companies
Suhair Sayed IbrahimMember since: 2007Date of birth: 1938Academic Qualifications:Masters in AccountingDiplomas in Finance, Banking Studies, and AccountingBachelor in AccountingProfessional Experience:General Manager and member of the Management Committee of Banque Du Caire Experience in banking from working in various departments in Banque Du Caire
Sharif Mahdi Al-SaifiMember since: 2010Date of birth: 1972Academic Qualifications:Masters in Marine Environmental ProtectionBachelor of Science in Foreign ServicesProfessional Experience:Deputy General Manager/Partner Masar United Contracting CoFormer CEO of United Garment Manufacturing CoMarine Park Manager of Aqaba Marine ParkOperations Manager at Masar Contracting CoBoard Member The Queen Rania Excellence in Education AwardBoard member of VTEL Holding, South Coast Hotels Company and United Garment Manufacturing Co
Arfan Khalil AyassMember since: 2011Date of birth: 1942Academic Qualifications:Masters in AccountingBachelor of Science in AccountingCertified Public Accountant (CPA)Professional Experience:Experience in public accounting for more than 30 years in Lebanon and Saudi Arabia; ended as managing partner in Ernst & Young (Riyadh)Board member and chairman of the Audit committee of First National Bank (Lebanon), a member of the Board and Audit committee of Al Ahli International Bank (Lebanon), and a member of the audit committee of the IMF in Washington D.C.Member of the American Institute of Certified Public Accountants, the Lebanese Society of Certified Public Accountants, and the Arab Society of Accountants
Corporate Governance and Other Disclosures

37
Executive Management as of December 31, 2011
Kamal Ghareeb Al-BakriGeneral ManagerDate of Hiring: 2003Date of birth: 1969Academic Qualifications:Bachelor in LawProfessional Experience:Experience in banking sector through his work as the Deputy General Manager of Cairo Amman Bank and previously as the Head of Legal Department and Legal Advisor Board member in several companies including Zara Investment (Holding) Company, Jordan Insurance Company and Jordan Tourist Transport Company (JETT)
Khaled Mahmoud QasimDeputy General Manager for Operations and Support ServicesDate of Hiring: 2008Date of birth: 1963Academic Qualifications:Masters in Business AdministrationBachelor in FinanceHolder of CIB certificateProfessional Experience:Experience in banking sector for more than 25 years through his work in Jazeera Bank, Arab Bank, Cairo Amman Bank, Jordan National Bank and Kuwait National Bank
Rana Sami SunnaDeputy General Manager for Banking OperationsDate of Hiring: 1995Date of birth: 1966Academic Qualifications:Masters in Business AdministrationBachelor in AccountingProfessional Experience:Deputy General Manager for Banking Operations since December 2009Experience in the field of risk management through her work and the Manager of Risk Management Department in the Bank since 1998. Worked as the Head of local facilities department in the Central Bank of JordanBoard member in the Jordan Mortgage Refinancing Company
Qasim Mohammad TawfeeqHead of Internal AuditDate of Hiring: 2002Date of birth: 1954Academic Qualifications:Bachelor in ArabicHolder of ICFA, CERT.I.A, CAFC and CFE certificatesProfessional Experience:Experience in banking sector and in internal audit through his work in Arab Bank from 1978 to 2002
Ghaddah Mohammad NazzalHead of Human Resources Date of Hiring: 2003Date of birth: 1959Academic Qualifications:Masters in Business AdministrationBachelor in Human ResourcesProfessional Experience:Experience in human resources through her work as Human Resources Manager in Arab Banking Corporation (Jordan) and Jordan Projects for Tourism Development Company, and Administrative Development Manager in Arabtec- Jardaneh Company
Nizar Tayseer MohammedHead of Finance & Risk ManagementDate of Hiring: 2004Date of birth: 1972Academic Qualifications:Bachelor in AccountingCertified Public Accountant (CPA)Professional Experience:Experience in public accounting through his work as an Audit Manager in a large public accounting firmBoard member of Jordan Association of Management AccountantsBoard member in Daman Investment Company and Jordan Vegetable Oil Industries Company
Hamed Ibrahim KreishanHead of Branches and SalesDate of Hiring: 2000Date of birth: 1955Academic Qualifications:Masters in Business AdministrationBachelor in Aeronautical EngineeringProfessional Experience:Experience in sales and marketing through his work in Coca Cola and Ahleya for Trading Centers Company
Omar Ahmad YaqoubHead of Information TechnologyDate of Hiring: 2004Date of birth: 1957Academic Qualifications:Bachelor in Business AdministrationDiploma in Information TechnologyProfessional Experience:Experience in Information Technology in banks for more than 27 years through his work as IT manager in Arab Banking Corporation (Jordan) and Jordan National Bank, and assistant manager in Arab Jordan Investment Bank
Corporate Governance and Other Disclosures

38
Azmi Mohammad OwaidahHead of Retail BankingDate of Hiring: 1996Date of birth: 1964Academic Qualifications:Bachelor in AccountingProfessional Experience:Experience in the field of credit in Banks through his work in Cairo Amman Bank and Jordan Kuwaiti Bank
Yazeed Sitan AmmariHead of Corporate CreditDate of Hiring: 2006Date of birth: 1965Academic Qualifications:Masters in FinanceBachelor in Business AdministrationProfessional Experience:Experience in the field of credit in Banks through his work in Jordan National Bank, Amman Investment Bank and Arab Real-estate Bank
Naser Abdul Karim Al-QudsehHead of Engineering and AdministrationDate of Hiring: 2003Date of birth: 1961Academic Qualifications:Bachelor in Marketing and SalesProfessional Experience:Administrative experience through his work in Astra Group Farouq Mohammad AmawiHead of ComplianceDate of Hiring: 2008Date of birth: 1951Academic Qualifications:DiplomaProfessional Experience:Experience in banking for more than 25 years sector through his work in Jordan National Bank, Arab Bank/Syria, Middle East Investment Bank and Arab Jordan Investment Bank
Reem Younis EsesHead of TreasuryDate of Hiring: 190Date of birth: 1964Academic Qualifications:Masters in EconomicsBachelor in EconomicsProfessional Experience:Experience in banking through her work as the Treasurer in the Bank since 1990Worked as a researcher in the Royal Scientific Society since 1997
Izzidin Rushdi Abu SalamehHead of OperationsDate of Hiring: 2003Date of birth: 1971Academic Qualifications:Masters in Business AdministrationBachelor in EnglishProfessional Experience:Head of Operations since November 2009Experience in operations through working as Assistant Regional Manager, Palestine Branches for Operations and Information Technology since 2003Operations Manager in Standard Chartered, Palestine since 1995
Jan Shawkat YadajHead of Business Support and ProceduresDate of Hiring: 1990Date of birth: 1968Academic Qualifications:Bachelor in EnglishProfessional Experience:Experience in banking since 1990 in the fields of operations, branches and procedures
Omar Sarhan AqelHead of Documentation and Credit Control Date of Hiring: 1989Date of birth: 1963Academic Qualifications:Bachelor in AccountingProfessional Experience:Experience in banking n the field of operations, internal audit, documentation and credit control
Olginia Jamal HaddadHead of SMEs and Palestine CreditDate of Hiring: 1990Date of birth: 1969Academic Qualifications:Bachelor in FinanceProfessional Experience:Experience in the field of credit in the Bank
Mary Wade’ HannaSecretary of the BoardDate of Hiring: 1960Date of birth: 1943Academic Qualifications:Diploma in BusinessProfessional Experience:Secretary of the Board since 1982.Experience in banking since 1960 in the fields of human resources and administration
Corporate Governance and Other Disclosures

39
Directors’ Shareholdings
20102011NationalityName
5,0005,000JordanianMr. Khaled Al-Masri
---Relatives shareholdings
1,1361,136JordanianMr. Yazid Al-Mufti
---Relatives shareholdings
10,777,58010,777,580EgyptianBanque Misr
--EgyptianMr. Mohammad Barakat
---Relatives shareholdings
6,1376,137JordanianIshraq Investment Company
249,000249,000JordanianMr. Ibrahim Abu Al-Ragheb
1,4961,496JordanianRelatives shareholdings
5,0005,000JordanianLevant Investment Company
6,054,0956,054,095JordanianMr. Yasin Al-Talhouni
---Relatives shareholdings
2,266,4372,266,437LiberianPalestine Development & Investment Co. represented by Dr. Farouq Zuaiter
113,863113,863JordanianDr. Farouq Zuaiter
94,084105,084JordanianRelatives shareholdings
11,387,80311,387,803JordanianAl-Massira Investment Company
--LebaneseMr. Arfan Ayass
56,818-JordanianDr. Abdul Malek Jaber
---Relatives shareholdings
2,7762,776JordanianMr. Nashat Al-Masri
---Relatives shareholdings
2,039,4652,039,465Saudi ArabianArab Investment and Trade Company represented by Mr. Ghassan Akeel
20,00020,000JordanianMr. Ghassan Akeel
19,07919,079JordanianRelatives shareholdings
5,790,8435,790,843JordanianSocial Security Corporation represented by Mr. Bassam Al-Subaihi
--JordanianMr. Bassam Al-Subaihi
---Relatives shareholdings
1,3311,331EgyptianMisr Investment Company represented by Mrs. Suhair Sayed
--EgyptianMrs. Suhair Sayed
---Relatives shareholdings
223,047223,047JordanianMr. Sharif Al-Saifi
69,30569,305JordanianRelatives shareholdings
Corporate Governance and Other Disclosures

40
Executives and Informed Employees Shareholdings
Name Position Nationality2011 2010
Personal Relatives Personal Relatives
Mr. Kamal Al-Bakri General Manager Jordanian - - - -
Mr. Khaled Qasim Deputy GM for Operations and Support Services Jordanian - - - -
Mrs. Rana Sunna Deputy GM for Banking Operations Jordanian 4,000 - 4,000 -
Mr. Qasim Tawfeeq Head of Internal Audit Jordanian - - - -
Miss Ghaddah Nazzal Head of Human Resources Jordanian - - - -
Mr. Nizar Mohammed Head of Finance & Risk Management Jordanian 1,310 650 - -
Mr. Hamed Kreishan Head of Branches and Sales Jordanian - - - -
Mr. Omar Yaqoub Head of Information Technology Jordanian - - - -
Mr. Azmi Owaidah Head of Retail Banking Jordanian - - - -
Mr. Yazid Ammari Head of Corporate Credit Jordanian - - - -
Mr. Naser Qudseh Head of Engineering and Administration Jordanian - - - -
Mr. Farouq Amawi Head of Compliance Jordanian - - - -
Mrs. Reem Eses Head of Treasury Jordanian - - - -
Mr. Izzidin Abu Salameh Head of Operations Palestinian - - - -
Miss Jan Yadaj Head of Business Support and Procedures Jordanian - - - -
Mr. Omar Aqel Head of Documentation and Credit Control Jordanian - - - -
Mrs. Olginia Haddad Head of SMEs Jordanian - - - -
Miss Mary Hanna Secretary of the Board of Directors Jordanian - - - -
Shareholders with 5% or More Ownership
20102011Name
%Shares%Shares
11.3911,387,80311.3911,387,803Al-Massira Investment Company
10.7810,777,58010.7810,777,580Banque Misr
10.4510,450,00010.4510,450,000Najwa Mohammad Madi
6.056,054,0956.056,054,095Yasin Khalil Al-Talhouni
5,945,939,0675.815,814,417Hamzah Khalil Al-Talhouni
5.795,790,8435.795,790,843Social Security Corporation
5.215,213,6965.215,213,696Sabih Taher Al-Masri
The ownership of Mr. Sabih Al-Masri Group represents 29.5% of the Bank’s paid in capitalThe ownership of Mr. Yasin Al- Talhouni Group represents 16.9% of the Bank’s paid in capital
Corporate Governance and Other Disclosures

41
Board of Directors Remunerations during 2011
BonusTravelTransportationName
5,000-9,000Mr. Khaled Al-Masri
5,000-9,000Mr. Yazid Al-Mufit
5,00011,211-Mr. Mohammad Barakat
5,000-9,000Mr. Ibrahim Abu Al-Ragheb
5,000-9,000Mr. Yasin Al-Talhouni
5,000-9,000Dr. Farouq Zuaiter
4,167-7,500Dr. Abdul Malek Jaber
5,00018,669-Mr. Ghassan Akeel
5,000-9,000Mr. Nashat Al-Masri
5,000-9,000Social Security Corporation
5,00017,114-Mrs. Suhair Sayed
--9,000Mr. Shrif Al-Saifi
833410-Mr. Arfan Ayass
60,00047,40479,500Total
- Total salaries, bonuses and other benefits paid to the members of the Bank’s executive management during 2011 was JD 2,564,745
- The Bank does not rely on any particular vendors and/or customers that constitute 10% or more of the Bank’s purchases and/or revenues
- The Bank does not enjoy any privilege of governmental protection on any products or activities and did not receive any patents or franchises during 2011
- Government decisions during 2011 did not have any material effect on the Bank’s operations.
- All activities and operations performed during 2011 were of a recurring nature and in line with the Bank’s main activities. There were not extraordinary activities that had a significant financial effect during the year.
- Capital expenditures during 2011 were JD 8,525,119
- Audit fees for 2011 were JD 145,334 in addition to sales and value added taxes, and were distributed as follows:
JD
Cairo Amman Bank 134,000
Awraq Investment 7,000
Al-Watanieh Securities 4,334
Total 145,334
Other consulting fees paid to the external auditors during the year amounted to JD 75,581
Awraq Investment manages the Bank’s portfolio in bonds and other instruments for an annual fee. The Bank did not have any other contracts, projects and commitments with subsidiary companies, or Chairman and members of the Board of Directors except for regular banking operations that are fully disclosed in note 44 to the financial statement. Those transactions are made in accordance with Central Bank of Jordan regulations.- Statement from the Board of Director
Corporate Governance and Other Disclosures

42
The Board of Directors affirms that according to its knowledge and beliefs, there are no significant issues, which would affect the sustainability of the Bank’s operations during the next fiscal year of 2012.
The Board of Directors also acknowledges its responsibility for the preparation of the financial statements for the year 2011 noting that the Bank maintains an effective internal control structure.
Chairman Vice ChairmanKhaled Sabih Al-Masri Yazid Adnan Al-Mufti Mohamed Kamal Eldin Barakat
Ibrahim Hussein Abu Al-Ragheb Yasin Khalil Al-Talhouni Dr. Farouq Ahmad Zuaiter
Nashat Taher Al-Masri Ghassan Ibrahim Akeel Suhir Sayed Ibrahim
Bassam Ali-Subaihi Sharif Mahdi Al-Saifi Arfan Khalil Ayass
* Mr. Arfan Ayass’ signature did not appear due to his presence outside of Jordan when the statements were signed.The Chairman, General Manager and the Head of Finance acknowledge the accuracy and completeness of the information and financial data provided in the annual report.
Chairman General Manager Head of FinanceKhaled Sabih Al-Masri Kamal Ghareeb Al-Bakri Nizar Tayseer Mohammed
Corporate Governance and Other Disclosures
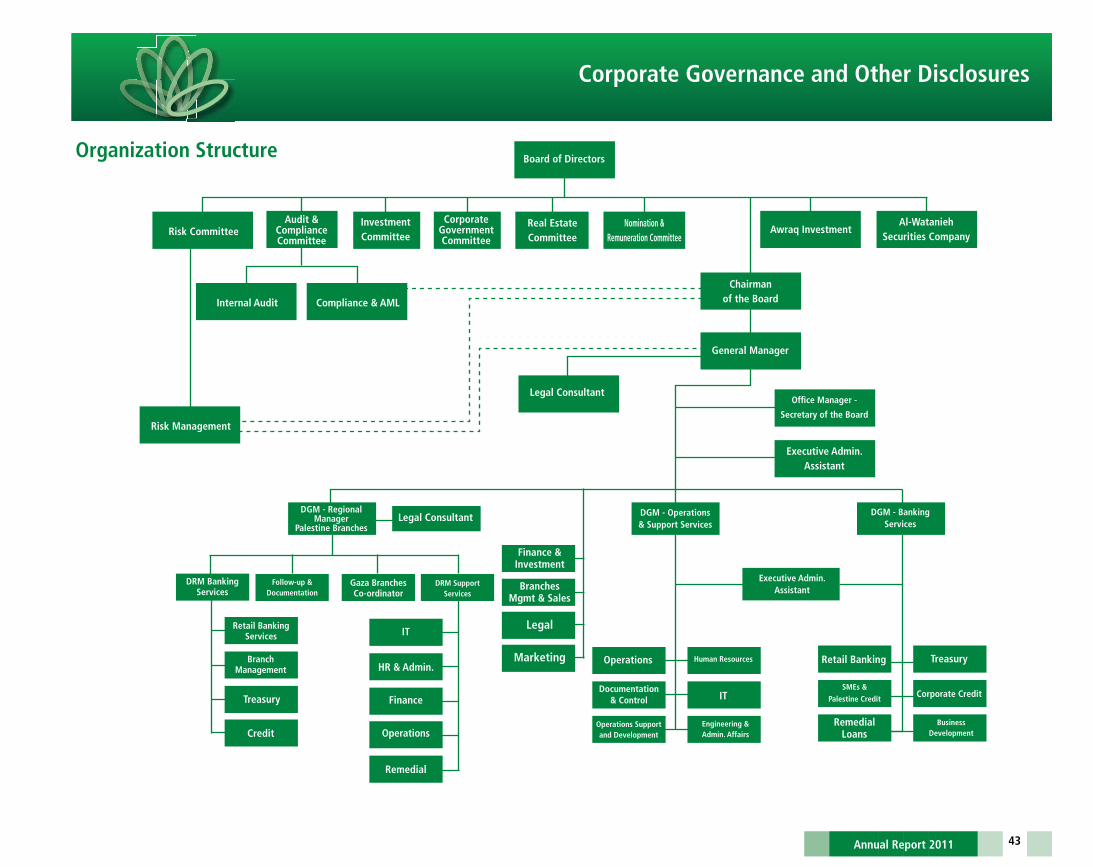
43
Corporate Governance and Other Disclosures
Risk Management
Legal ConsultantOffice Manager -
Secretary of the Board
Executive Admin. Assistant
DGM - Banking Services
Executive Admin.Assistant
Human ResourcesOperations
Finance &Investment
DRM Banking Services
Follow-up &Documentation
Retail Banking Services IT
BranchManagement HR & Admin.
Treasury Finance
Credit Operations
Remedial
Gaza BranchesCo-ordinator
DRM SupportServices
Legal
Branches Mgmt & Sales
ITDocumentation
& Control
Engineering & Admin. Affairs
Operations Support and Development
Legal ConsultantDGM - Regional
Manager Palestine Branches
Treasury
Corporate CreditSMEs &
Palestine Credit
BusinessDevelopment
RemedialLoans
Retail Banking
DGM - Operations& Support Services
General Manager
Chairmanof the Board
Risk Committee
Board of Directors
Nomination &Remuneration Committee
Real EstateCommittee
Corporate Government Committee
InvestmentCommittee
Awraq InvestmentAl-Watanieh
Securities Company
Internal Audit Compliance & AML
Audit &ComplianceCommittee
Marketing
Organization Structure

44
Awraq Investments
Corporate Governance and Other Disclosures
Board of Directors
Internal Audit
BrokerageMarketing
& CustomerService
AssetsManagement
Human Resources Reaserch ComplianceFinance &
Operations
Legal Advisor
InformationTechnology
Local Brokerage Regional &International
InvestmentPortfolio
Investment Funds
Fixed Income
Chief Executive Officer

45
Board of Directors
Legal AdvisorGeneral Manager
Deputy General Manager
Internal Audit
ComplianceOfficer
InformationTechnologyBranches
CustomerServices Brokerage
Regional &InternationalLocal
Finance
Corporate Governance and Other Disclosures
Al-Watanieh Securities Company


CorporateGovernance
Code


King Hussein Cancer Center Summer Camp


51
Introduction
Cairo Amman Bank (“The Bank”) gives a great deal of importance to proper corporate governance practices based on the principles of fairness, transparency, accountability and responsibility in order to enhance the trust of depositors, shareholders and other stakeholders and to ensure continuous monitoring of the Bank’s adherence to set policies and limits, and with the Bank’s goals. The Bank is also committed to the highest professional standards in all activities that conform to the regulations of the Central Bank of Jordan and of the regulatory authorities in countries where the Bank is present, and comply with best international practices. Accordingly, the Board of Directors (“The Board”) has adopted this Corporate Governance Code.
Board of Directors
Duties and Responsibilities of the BoardThe Board of Directors is responsible for supervising and monitoring all of the Bank’s activities and the executive management, in addition to ensuring that all activities comply with the Central Bank of Jordan regulations and other regulatory authorities, for the interest of the shareholders, depositors and all relevant parties.
The main responsibilities of the Board of Directors include the following:a- Setting the Bank’s strategic goals and overseeing the implementation thereof, in addition to directing the executive management to design plans for the implementation of these goals.b- Ensuring and certifying that internal control systems are effective.c- Reviewing all risks that face the Bank, and ensuring that they are managed properly by the executive management.d- Ensuring that the Bank complies with all related law and regulations.e- Appointing a General Manager with integrity, technical competence and experience in banking and monitoring his/her performance as well as approving the appointment of certain members of the executive management
and ensuring they have the required expertise.
Composition of the Boarda- The Board of Directors is composed of 12 members elected by the General Assembly for a period of four years. The members of the Board have a range of skills and experiences that increases the effectiveness of the Board.b- Among the Board’s non-executive directors, there are at least three independent directors. An “Independent Director” should meet the following requirements:- Has not been employed by the Bank for the preceding three years- Is not a relative (up to the second degree) of a member of the Bank’s management- Is not receiving a salary or compensation from the Bank except for the Board membership- Is not a director or owner of a company with which the Bank does business with, other than a business relationship made in the ordinary course of the Bank’s business and substantially on the same terms as those prevailing
at the time for comparable transactions with non-affiliated parties- Is not, nor in the past three years, been affiliated with or employed by a present or former external auditor of the Bank- Is neither a shareholder with effective interest in the capital of the Bank, nor affiliated with onec- The Board of Directors may include executive members that occupy position in the Bank, but should not exceed three members.
The Chairman of the Boarda- The Chairman of the Board (“The Chairman”) may have executive authorities.b- If the Chairman is an executive, the Bank will consider appointing an independent member of the Board as Deputy Chairman.c- The position of the Chairman is separate from that of the General Manager and the division in responsibilities is set in writing and subject to review and revision from time to time as necessary as approved by the Board.d- There should be no family connection between the Chairman and the General Manager up to the third degree.e- The Chairman promotes a constructive relationship between the Board and the executive management, and between the executive directors and the non-executive directors within the Board.f- The Chairman ensures that both directors and shareholders receive adequate information on a timely basis.
Board Practices
a- The Board holds no less than six meetings every year, with no more than two months between each two meetings, to discuss matters proposed by the executive management and all other matters the Board deems necessary.b- The executive management provides board members with adequate information sufficiently in advance of the meetings to enable them to reach informed decisions.c- Each Board member is provided with a formal appointment letter upon his/her election, in which he/she is advised about his/her rights, responsibilities and duties including activities that require the Board authorization limit.d- A permanent written record of the Board’s discussions and votes is kept by the Board Secretary who is also responsible in ensuring that Board procedures are followed, and that information is conveyed between members of
the Board, the members of the Board Committees, and the executive management.
Corporate Governance Code

52
e- The Board reaches its decisions based on the absolute majority of members’ votes, in the case of an even vote, the decision that the Chairman voted for is approved. f- Board members and any of the Board’s Committees have access to executive management. In addition, members of the executive management may, upon the request of the Chairman, attend Board meetings and present
information related to their area of responsibility.g- Board members and any of the Board’s Committees are entitled to use external sources to enable them to adequately fulfill their duties.
Board Committees
The Board of Directors has several specialized committees, each has its own duties and responsibilities according to its charter and they work integrally with the Board to achieve the Bank’s goals and enhance its efficiency. The Bank utilizes formal and transparent processes for appointments to the Board Committees:
Corporate Governance CommitteeThe Corporate Governance Committee is comprised of the Chairman of the Board and two non-executive directors.The duties of the Corporate Governance Committee include directing the preparation of the Bank’s Corporate Governance Code and supervising its implementation. In addition to constantly reviewing the code and recommending changes or additions to it, in order to improve the code and the efficiency of the Board.
Audit CommitteeThe Audit Committee comprises of at least three non-executive members, at least two of them are independent directors. The Bank’s policy is that at least two members of the Audit Committee should have relevant financial management qualifications and/or expertise.
The duties of the Audit Committee include:- Reviewing the financial statements before being presented to the Board of Directors, in addition to meeting with external auditors and making necessary recommendations- Supervising internal audit activities, including reviewing the annual internal audit plan, and the internal audit reposts- Recommending to the Board of Directors the accounting policies and practices of the Bank as well as reviewing all accounting issues that have a significant effect of the financial statements- Reviewing the Bank’s internal controls and its adequacy through the reports of the Internal Audit Department and the external auditors- Recommending to the Board of Directors the appointment or the removal, the remuneration and other contractual terms of the external auditors, in addition to assessing the objectivity of the external auditors, including the
consideration of any other non-audit work performed by the external auditors
The Audit Committee meets on a regular basis every three months, and the Head of the Internal Audit Department attends its meetings. The Audit Committee has the ability to obtain any information from executive management, and the ability to call any executive or director to attend its meetings.The Audit Committee meets each of the Bank’s external auditors, its internal auditors, and its compliance officers, without executive management being present, at least once a year.The Bank recognizes that the Audit Committee does not substitute for the responsibilities of the Board of Directors or the Bank’s executive management for the supervision and adequacy of the Bank’s internal control structure.
The Nominations & Remuneration CommitteeThe Nominations & Remuneration Committee is comprised of three non-executive directors, the majority of which, including the Committee Chairman, are independent.
The Committee’s duties include:- Setting the method to assess the effectiveness of the Board and its Committees- Making the determination of whether a director is independent, considering the minimum standards for independence set out in this code- Nominating board appointments to the General Assembly- Providing background briefing material for Directors as requested, as well as ensuring that they are kept up-to-date on relevant banking topics- Recommending to the Board the remuneration, including monthly salary and other benefits, of the General Manager- The Nominations & Remuneration Committee also reviews the bonuses and other remuneration of other executive management- The Nomination & Remuneration Committee ensures that the Bank has a remuneration policy sufficient to attract and retain qualified individuals and is in line with the Bank’s peers in the market- The Committee meets on a regular basis, and members of the executive management are invited to attend its meetings, if necessary.
Risk Management CommitteeThe Risk Management Committee is comprised of the Chairman of the Board and two non-executive directors.
Corporate Governance Code

53
The duties of the Risk Management Committee includes:- Reviewing the Risk Management strategy before being approved by the Board, and assessing its effectiveness on a continuous basis- Ensuring the existence of policies and the framework of risk management function, and reviewing them on a regular basis- Overseeing the Head of Risk Management and the annual plan of the department activities- Ensuring that the risk management function has adequate expertise and resources to fulfill its responsibilities- Reviewing assumptions used in risk measurement models- Overseeing the development of the risks database- Reviewing stress tests on credit, liquidity, market, and operational risks, and approving contingency planning- Reviewing the reports of the Risk Management department- Monitoring the Bank’s preparation and implementation of Basel II with respect to risk management and measurement issues- Receiving regular reports from the Assets Liabilities Committee- Receiving and acting on internal audit reports that are relevant and in compliance to the risk function - Ensuring the existence of business continuity plan and testing it on a regular basis
The Risk Management Committee meets at least four times a year, and submits reports to the Board of Directors on a regular basis. The General Manager, Deputy General Manager for Banking Operations, Head of Finance, Head of Risk and the Assistant General Manager/Regional Manager of Palestine Branches attend its meetings.
Investments Committee- The Investment Committee is comprised of the Chairman of the Board and two non-executive directors- The Committee sets and reviews the Bank’s investment policy and looks into new investment opportunities- The Committee meets on a regular basis, and members of the executive management may be invited to attend its meetings, if necessary
Self Assessment
a- The Board assesses its own performance and the performance of its committees on an annual basis. The Nominations and Remuneration Committee is responsible for receiving the assessment from the Directors, reviewing them and providing to the Board with a report summarizing the self assessment. The Board discusses this report in order to enhance its performance if needed.
b- The Nominations and Remuneration Committee in coordination with the Chairman formally evaluate the performance of the General Manager and submits its evaluation to the Board.c- The Board approves executive management succession plans, which set out the required qualifications and requirements of the positions.
Related Party Transactions
a- Related Party Transactions between the Bank and its employees, directors, their companies, or other related parties, including lending and share trading transactions, are done according to rules and procedures that comply with the Central Bank of Jordan regulations.
b- Credit extended to directors and their companies are made in accordance with the Bank’s related parties credit policies and are reported to the Board of Directors for review.c- Credit extended to directors and their companies are made at market rates and not on preferential terms.d- Directors involved in any credit transactions do not participate in discussions, nor do they vote on it.e- All Related Party Transactions are disclosed in the Bank’s annual report as well as all interim financial statements.f- The Bank’s internal controls ensure that all Related Party Transactions are handled in accordance with the set policies.
Corporate Governance Code

54
Internal Controls
a- The Board ensures that the Bank maintains a high degree of integrity in its operations. Formal policies, including a Code of Conduct, and definitions and controls on conflicts of interest and insider dealing, have been established and are published to all employees.
b- The Bank has written policies covering all banking operations. Such policies are regularly reviewed to ensure that they conform to any changes in laws and regulations, the economic environment and other circumstances affecting the Bank.
c- The Bank as part of its lending and credit approval process assesses the quality of corporate governance in its corporate borrowers; especially public shareholding companies, and includes the strength or weakness of their corporate governance practice in the borrower’s risk assessment.
d- Executive management is responsible for implementing the risk management strategies that have been approved by the Board, and for developing the policies and procedures for managing the various types of risk.e- The structure and development of a coherent and comprehensive risk management department within the Bank is proposed by the executive management, reviewed by the Risk Management Committee, and approved by
the Board.f- The Bank adopted the “Whistle Blowing Policy”, whereby employees can confidentially raise concerns about possible irregularities, and that allow for such concerns to be independently investigated and followed up.g- The Bank’s management is responsible for establishing and maintaining adequate internal control structure over financial reporting for the Bank.h- The Bank’s internal control structure is reviewed at least once a year by internal and external auditors.i- The Bank requires the regular rotation of the external audit between audit firms. Should this no longer be practical, the Bank will at a minimum require the regular rotation of the principal partner in charge of the external audit.
Internal Audit
a- The Bank provides the Internal Audit department with staff adequately resourced, trained and remunerated.b- The Internal Audit department has full access to the Bank’s records and employees, and is given sufficient standing and authority within the Bank to adequately carry out its tasks. The functions, duties and responsibilities of
the Internal Audit department are documented within the Internal Audit Charter, which is approved by the Board and published within the Bank.c- The Internal Audit department reports primarily to the Chairman of the Audit Committee.d- Internal Audit employees do not have any operational responsibilities. Internal Audit is responsible for proposing the structure and scope of the audit schedule, and any potential conflicts of interest are reported to the Audit Committee.e- Internal Audit reports may by discussed with the departments and operational units being audited, but the Internal Audit department is allowed to operate and make a full and honest report without outside influence or interference.f- The Internal Audit department reviews the Bank’s financial reporting as well as compliance with internal policies, international standards, procedures and applicable laws and regulations.
Risk Management
a- Risk Management is the responsibility of all departments and operational units within the Bank.b- The Risk Management department reports to the Risk Management Committee and on a day-to-day operational basis it reports to the General Manager.c- The functions of the Risk Management department are assisted by a network of properly constituted, authorized and documented committees such as Assets and Liabilities Committee, Investment Committee and Credit Committee.
The responsibilities of the Risk Management department include:a- Analyzing all risks including credit risk, market risk, liquidity risk and operational riskb- Developing methodologies for measuring and controlling each riskc- Recommending limits to Risk Management Committee and the approval, reporting and recording of exceptions to the risk policyd- Providing the Board and the executive management with information on risk metrics and on the Bank risk profile.e- Providing information about risks to be used in the Bank’s published statements and reports.
Corporate Governance Code

55
Compliance
a- The Bank has an independent compliance function, which is adequately resourced, trained and remunerated.b- The Compliance department establishes effective mechanisms to ensure that the Bank complies with all applicable laws and regulations. The Department’s functions, duties and responsibilities are documented and published
within the Bank.c- The Compliance department is responsible for developing the compliance policy of the Bank and ensuring its implementation throughout the Bank. The Board is responsible for approving the compliance policy and overseeing
its implementation.d- The Compliance Department reports to the Risk Management Committee, with copies of its reports sent to the General Manager.
Relationship with Shareholders
a- The Bank takes active steps to encourage shareholders, in particular minority shareholders, to participate in the annual General Assembly, and also to vote either in person or in their absence by proxy.b- The Bank’s policy is that the Chairmen of all Board Committees should be present at the annual General Assembly.c- Representatives from the external auditors attend the annual General Assembly to answer questions about the audit and their auditors’ report; and the shareholders elect external auditors at the General Assembly.d- Voting is done on each separate issue that is raised at the General Assembly.e- Notes, minutes and a report of the proceedings of the annual General Assembly, including the results of voting, and the questions from shareholders and executive management’s responses, are prepared and made available
to shareholders after the annual General Assembly.
Transparency and Disclosures
a- The Bank disclosures are made in accordance with the International Financial Reporting Standards (IFRS), the regulations issued pursuant to the Banking Law and to other related legislations.b- The Bank provides meaningful information on its activities to shareholders, depositors, financial market counterparties, regulators and the public in general. The Bank also discloses significant issues in accordance with Jordan
Securities Commission regulations.c- The Bank follows The Disclosure Regulation issued by Jordan Securities Commission and the regulation of the Central Bank of Jordan for information that should be disclosed in the Bank Annual Report.d- The Bank’s Annual Report includes information about the structure and operation of the Risk Management department, in addition to a detailed description of the Bank’s risks and the methods for managing them.e- The Annual Report includes a statement from the Board of Directors acknowledging their responsibility for the preparation of the financial statements and the contents of the Annual Report, and their accuracy and completeness
noting that the Bank maintains an effective internal control structure.f- The Bank prepares quarterly reports that include quarterly financial statement, as well as preparing analysis of the Bank’s results of operations, which allows investors to understand current and future operating results and
the financial condition of the Bank.g- The Head of Finance Department is handling the function of investor relations through providing comprehensive, objective and up-to-date information on the Bank, its financial condition and performance and its activities.h- The Bank discloses in its Annual Report its Corporate Governance Code and details of its compliance.i- The Bank discloses in its Annual Report a summary organization chart.j- The Bank discloses in its Annual Report summaries of the duties and responsibilities of Board Committees including the members of these committees.k- The Bank discloses in its Annual Report a summary of the remuneration policy, including the amounts paid to the members of the executive management.
The Bank complies with all articles of the Corporate Governance Code except:
- The Board does not conduct self-assessment- Having an approved succession plan for executive management- Having an approved remuneration and bonus policy
Corporate Governance Code

56
Corporate Governance Code issued by Jordan Securities Commission
Jordan Securities Commission approved the Governance Code for public shareholding companies listed in the Amman Stock Market. The Code took effect as of January 1, 2009; including mandatory rules formulated on the basis of binding legal provisions of effective legislations. The code states that in the initial stage, implementation of the directive rules must be consistent with the compliance method; otherwise proper justification for non-compliance must be stated.
The Bank is committed to the implementation of all mandatory and directive rules embodied in the Code with the exception of the following directive rules:
• Members of the Board of Directors are not elected by the General Assembly according to accumulative voting system, because that is a right of the shareholders as stated in the Companies Law.
• Rules for granting incentives and bonuses to members of the executive management are decided on an annual basis by the Board of Directors based on the Bank’s annual results.
• All Audit Committee members are non-executives. Only one independent board member serves on the Audit Committee, who accordingly will not assume the position of Head of the Committee.
• The Bank is not obligated to exclude from the General Assembly’s meeting any new items not listed in the agenda sent to the shareholders, because that is a right of the shareholders under the Companies Law.
• The background of shareholders wishing to run for the Board of Directors membership is not to be attached to the invitation sent to the shareholders to attend the General Assembly’s meeting.
• The Bank adheres to the provisions of the Companies Law as to calling for an extraordinary meeting of the General Assembly to request the resignation of the Board of Directors or one of its members, or to request an audit of the Company’s operations and records.
• The external auditor may do additional work that serves the Bank’s interest, provided that it does not constitute a conflict of interest and that it is reported in the Annual Report.
Corporate Governance Code

ConsolidatedFinancial
Statement


Madrasati Initiative
Raymon Elementary School - JerashQurayqirah Elementary School - Aqaba
Abu Bakr Al-Seddiq - Mafraq


61
Consolidated Financial Statement
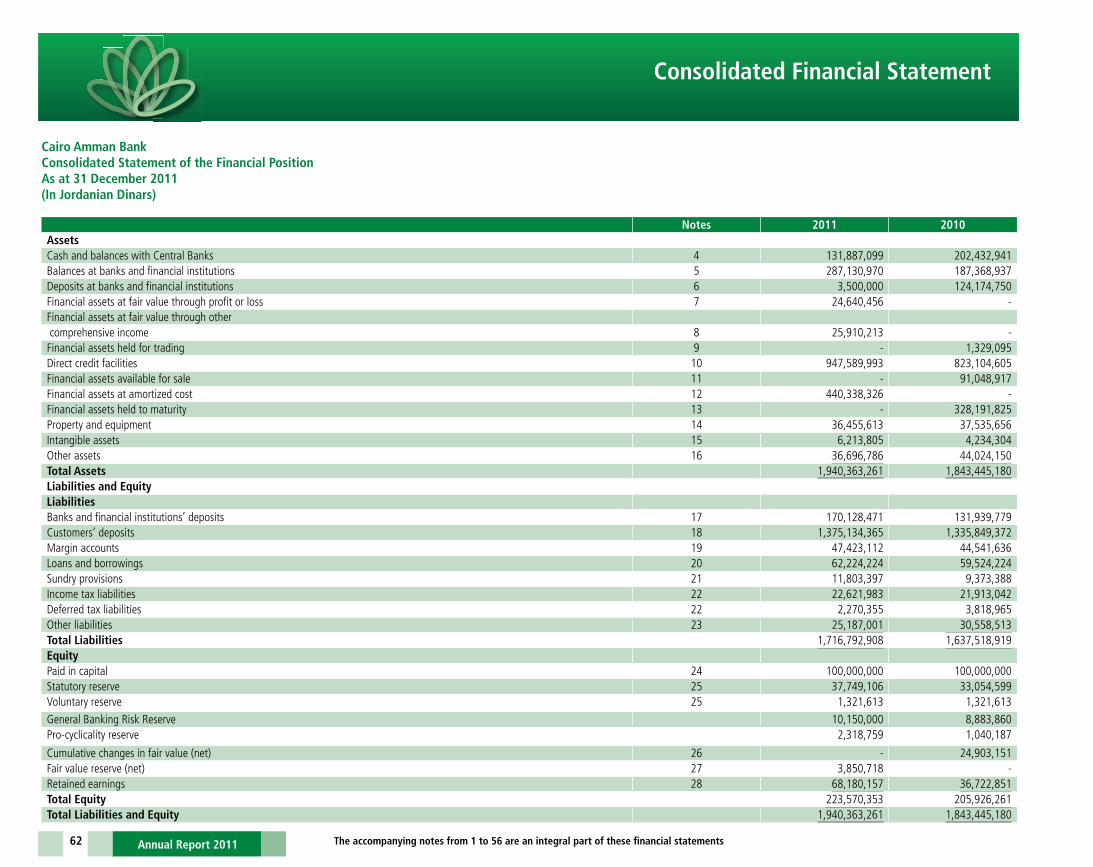
62
Cairo Amman BankConsolidated Statement of the Financial PositionAs at 31 December 2011(In Jordanian Dinars)
Notes 2011 2010AssetsCash and balances with Central Banks 4 131,887,099 202,432,941Balances at banks and financial institutions 5 287,130,970 187,368,937Deposits at banks and financial institutions 6 3,500,000 124,174,750Financial assets at fair value through profit or loss 7 24,640,456 -Financial assets at fair value through other comprehensive income 8 25,910,213 -Financial assets held for trading 9 - 1,329,095Direct credit facilities 10 947,589,993 823,104,605Financial assets available for sale 11 - 91,048,917Financial assets at amortized cost 12 440,338,326 -Financial assets held to maturity 13 - 328,191,825Property and equipment 14 36,455,613 37,535,656Intangible assets 15 6,213,805 4,234,304Other assets 16 36,696,786 44,024,150Total Assets 1,940,363,261 1,843,445,180Liabilities and EquityLiabilities Banks and financial institutions’ deposits 17 170,128,471 131,939,779Customers’ deposits 18 1,375,134,365 1,335,849,372Margin accounts 19 47,423,112 44,541,636Loans and borrowings 20 62,224,224 59,524,224Sundry provisions 21 11,803,397 9,373,388Income tax liabilities 22 22,621,983 21,913,042Deferred tax liabilities 22 2,270,355 3,818,965Other liabilities 23 25,187,001 30,558,513Total Liabilities 1,716,792,908 1,637,518,919EquityPaid in capital 24 100,000,000 100,000,000Statutory reserve 25 37,749,106 33,054,599Voluntary reserve 25 1,321,613 1,321,613
General Banking Risk Reserve 10,150,000 8,883,860Pro-cyclicality reserve 2,318,759 1,040,187
Cumulative changes in fair value (net) 26 - 24,903,151Fair value reserve (net) 27 3,850,718 -Retained earnings 28 68,180,157 36,722,851Total Equity 223,570,353 205,926,261Total Liabilities and Equity 1,940,363,261 1,843,445,180
Consolidated Financial Statement
The accompanying notes from 1 to 56 are an integral part of these financial statements

63
Cairo Amman BankConsolidated Income Statement For the Year Ended 31 December 2011(In Jordanian Dinars)
Notes 2011 2010
Interest income 30 111,438,690 105,838,068
Interest expense 31 30,669,937 30,584,608
Net interest income 80,768,753 75,253,460
Net commission income 32 19,283,958 19,497,704
Net interest and commission income 100,052,711 94,751,164
Other income
Gain from foreign currencies 33 3,121,113 2,312,243
Gain from financial assets held for trading 34 - 49,687
Gain from financial assets available for sale 37 - 1,237,062
Gain from financial assets at fair value through profit or loss 35 5,843,275 -
Dividends from financial assets at fair value
through other comprehensive income 36 870,151 -
Gain from financial assets at amortized cost 1,626,985 -
Other income 38 3,703,217 5,442,888
Gross Profit 115,217,452 103,793,044
Employees’ expenses 39 31,887,317 28,477,479
Depreciation and amortization 7,519,801 6,972,890
Other expenses 40 18,634,554 17,517,382
Impairment loss on direct credit facilities 10 1,707,073 2,179,439
Impairment loss on financial assets at amortized cost 141,800 -
Sundry provisions 21 4,402,312 1,524,743
Total Expenses 64,292,857 56,671,933
Profit Before Tax 50,924,595 47,121,111
Income tax expense 22 14,328,181 12,372,275
Profit for the Year 36,596,414 34,748,836
JD/Fils JD/Fils
Basic and diluted earnings per share 41 0/366 0/347
Consolidated Financial Statement
The accompanying notes from 1 to 56 are an integral part of these financial statements

64
Cairo Amman BankConsolidated Statement of Comprehensive IncomeFor the Year Ended 31 December 2011(In Jordanian Dinars)
2011 2010
Profit for the year 36,596,414 34,748,836
Other comprehensive income, net of tax:
Net movement in fair value reserve (2,517,908) -
Net movement in cumulative changes in fair value for available for sale investments - 2,926,846
Gain from sale of financial assets at fair value through other comprehensive income 429,926 -
Total Comprehensive Income for the Year 34,508,432 37,675,682
Consolidated Financial Statement
The accompanying notes from 1 to 56 are an integral part of these financial statements

65
Cairo Amman BankConsolidated Statement of Changes in Equity For the Year Ended 31 December 2011(In Jordanian Dinars)
Paid in Capital
RESERVESFair Value Reserve
Cumulative changes in fair values
Retained earnings
Total EquityStatutory Voluntary
General Banking
Risk
Pro-cyclicality
JD JD JD JD JD JD JD JD JD
2011 -
Balance at 1 January 2011 100,000,000 33,054,599 1,321,613 8,883,860 1,040,187 - 24,903,151 36,722,851 205,926,261
Effect of implementation of IFRS 9 - - - - - 6,368,626 (24,903,151) 16,670,185 (1,864,340)
Restated Balance at 1 January 2011 100,000,000 33,054,599 1,321,613 8,883,860 1,040,187 6,368,626 - 53,393,036 204,061,921
Dividends paid - - - - - - - (15,000,000) (15,000,000)
Gain from sale of financial assets at fair value through other comprehensive income
- - - - - (429,926) - 429,926 -
Total comprehensive income for the year - - - - - (2,087,982) - 36,596,414 34,508,432
Transferred to reserves - 4,694,507 - 1,266,140 1,278,572 - - (7,239,219) -
Balance at 31 December 2011 100,000,000 37,749,106 1,321,613 10,150,000 2,318,759 3,850,718 - 68,180,157 223,570,353
2010 -
Balance at 1 January 2010 88,000,000 27,532,671 1,321,613 7,767,932 - - 21,976,305 30,452,058 177,050,579
Increase in capital 12,000,000 - - - - - - (12,000,000) -
Dividends paid - - - - - - - (8,800,000) (8,800,000)
Total comprehensive income for the year - - - - - - 2,926,846 34,748,836 37,675,682
Transferred to reserves - 5,521,928 - 1,115,928 1,040,187 - - (7,678,043) -
Balance at 31 December 2010 100,000,000 33,054,599 1,321,613 8,883,860 1,040,187 - 24,903,151 36,722,851 205,926,261
- The general banking risk reserve and the credit balance of fair value reserve is restricted from use without a prior approval from the Central Bank of Jordan.
- The unrealized gains included in retained earnings and resulting from the early implementation of IFRS 9 amounted to JD 14,859,280. This amount is not available from distribution.
Consolidated Financial Statement
The accompanying notes from 1 to 56 are an integral part of these financial statements

66
Cairo Amman BankConsolidated Statement of Cash FlowsFor the Year Ended 31 December 2011(In Jordanian Dinars)
Notes 2011 2010Operating ActivitiesProfit before income tax 50,924,595 47,121,111Adjustments for -Depreciation and amortization 7,519,801 6,972,890Impairment loss on direct credit facilities 1,707,073 2,179,439Impairment loss on financial assets at amortized cost 141,800 -Sundry provisions 4,402,312 1,524,743Unrealized (gain) from trading financial assets - (40,917)Gain from sale of financial assets available for sale - (56,526)Unrealized (loss) from financial assets at fair value through profit or loss 205,806 -Impairment losses on available for sale investments - 1,035,437Gain from sale of property and equipment (89,299) (4,962)Impairment of repossessed properties 30,725 1,211Gain from sale of repossessed properties (167,626) (1,158,678)Effect of exchange rate changes on cash and cash equivalents (2,652,483) (1,962,904)Operating profit before changes in operating assets and liabilities 62,022,704 55,610,844Changes in assets and liabilities -Decrease (Increase) in deposits at banks and financial institutions maturing after more than three months 120,674,750 (43,650,100)(Increase) in financial assets held for trading - (1,026,935)Decrease in financial assets at fair value through profit or loss 208,614 -Increase in direct credit facilities (126,192,461) (95,483,801)Decrease (increase) in other assets 7,464,265 (10,942,687)Increase (decrease) in banks and financial institution deposits maturing after more than three months 3,455,000 (8,914,000)Increase in customers’ deposits 39,284,993 71,752,740Increase in margin accounts 2,881,476 5,096,497Sundry provisions paid (1,972,303) (1,960,864)Increase in other liabilities (5,371,512) 5,609,287Net cash (used in) from operating activities before income tax 102,455,526 (23,909,019)Income tax paid (14,401,383) (8,901,761)Net cash (used in) from operating activities 88,054,143 (32,810,780)Investing ActivitiesPurchase of financial assets available for sale - (17,360,316)Proceeds from sale of financial assets available for sale - 23,836,468Purchase of financial assets held to maturity - (153,821,442)Proceeds from maturity of financial assets held to maturity - 131,120,720Purchase of financial assets at fair value through OCI (1,945,916) -Sale of financial assets at fair value through OCI 475,832 -Purchase of financial assets at amortized cost (111,108,490) -Sale of financial assets at amortized cost 36,984,407 -Proceeds from sale of property and equipment 195,159 24,573Purchase of property and equipment (5,371,175) (9,484,579)Purchase of intangible assets ( 3,153,944) ( 1,222,442)Net cash used in investing activities (83,924,127) (26,907,018)Financing ActivitiesDividends paid (15,000,000) ( 8,800,000)Payments on loans and borrowings 2,700,000 36,338,656Payments from loans and borrowings - (15,000,000)Net cash (used in) from financing activities (12,300,000) 12,538,656Effect of exchange rate changes on cash and cash equivalents 2,652,483 1,962,904Net decrease in cash and cash equivalents (5,517,501) (45,216,238)Cash and cash equivalents, beginning of the year 254,317,099 299,533,337Cash and cash equivalents, end of the year 42 248,799,598 254,317,099
Consolidated Financial Statement
The accompanying notes from 1 to 56 are an integral part of these financial statements

67
Cairo Amman BankNotes to the Consolidated Financial Statements31 December 2011 (In Jordanian Dinars)
(1) General Information
The Bank is a public shareholding company registered and incorporated in Jordan during 1960 in accordance with the Companies Law No (12) of 1964. Its registered office is at Amman, Jordan.The Bank provides its banking services through its main branch located in Amman and through its 72 branches in Jordan, 21 branches in Palestine, and its subsidiaries.
The Bank is listed on the Amman Stock Exchange.
The financial statements were authorized for issue by the Bank’s Board of Directors no 1/2012 on 12 February 2012. These financial statements require the General Assembly’s approval.
(2) Significant Accounting Policies
Basis of preparation
The accompanying consolidated financial statements of the Bank and its subsidiaries have been prepared in accordance with International Financial Reporting Standards (IFRS) and its interpretations (IFRICs), and in conformity with the applicable laws and regulations of the Central Bank of Jordan.
The consolidated financial statements are prepared on a historical cost basis, except for financial assets at fair value through profit or loss and financial assets at fair value through other comprehensive income which have been measured at fair value.
The financial statements have been presented in Jordanian Dinars (JD) which is the functional currency of the Bank.
Changes in accounting policies:
The Bank’s accounting policies are consistent with those used in the previous year except for the following:
IFRS 9 Financial Instruments:The Bank and its subsidiaries early adopted IFRS 9 in the preparation of the consolidated financial statements as of 1 January 2011 in accordance with the requirements of the Central Bank of Jordan, Jordan Securities Commission as well as the transitional provision of the standard. Accordingly, the Bank elected not to restate the comparative financial statement as permitted by the standard. Investments have been reclassified and opening balances of retained earnings and accumulated changes in fair value have been restated as of 1 January 2011.The effect of the adoption of IFRS 9 is detailed in Note (54) to consolidated financial statements. The following is a summary of the categories of financial assets classification and measurement in accordance with IFRS 9:
A- Financial assets at amortized cost:a- Financial assets are measured at amortized cost only if these assets are held within a business model whose objective is to hold the asset to collect their contractual cash flows and that the contractual terms of the financial
asset give rise, on specified dates, to cash flows constituting solely principal and interest on the outstanding principal amount; andb- Debts instruments meeting these criteria are initially measured at amortized cost plus transaction costs. Subsequently they are amortized using the effective interest rate method, less allowance for impairment. The losses arising
from impairment are recognized in the income statement. c- The amount of the impairment consists of the difference between the book value and present value of the expected future cash flows discounted at the original effective interest rate.
Consolidated Financial Statement

68
d- It is not permitted to reclassify assets to or from this category except in certain circumstances determined in the International Financial Reporting Standards. If these assets are sold before maturity date, gain or loss from sale is recorded in a separate line item within the statement of comprehensive income.
B- Financial assets at fair value through profit or loss:a- Financial assets which are purchased with the aim of resale in the near future in order to generate profit from the short-term market prices fluctuation or the trading profit margins.b- Financial instruments at fair value through profit or loss are initially measured at fair value, transaction costs are recorded in the statement of income at the date of transaction. Subsequently, these assets are revalued at fair
value. Gains or losses arising on subsequent measurement of these financial assets including the change in fair value arising from non-monetary assets in foreign currencies are recognized in the income statement. Where these assets or portion of these assets are sold, the gain or loss arising are recorded in the income statement.
c- Dividend and interest income are recorded in the income statement.
C- Financial assets at fair value through other comprehensive income:a- Equity investments that are not held for sale in the near future.b- These financial instruments are initially measured at their fair value plus transaction costs. Subsequently, they are measured at fair value. Gains or losses arising on subsequent measurement of these equity investments including
the change in fair value arising from non-monetary assets in foreign currencies are recognized in other comprehensive income in the statement of changes in equity. The gain or loss on disposal of the asset is reclassified from fair value through other comprehensive income reserve to retained earnings.
c- These financial assets are not subject to impairment testing.d- Dividend income is recognized in the statement of income.
IAS 24 Related Party Disclosures (Amendment)The standard clarified the definition of a related party to simplify the identification of such relationships and to eliminate inconsistencies in its application.
No impact resulted from applying the amended standard on the statement of financial position and income statement .
IAS 32 Financial Instruments: Presentation – Classification of Rights Issues (Amendment)This amended the definition of a financial liability in order to classify rights issues (and certain options or warrants) as equity instruments in cases where such rights are given pro rata to all of the existing owners of the same class of an entity’s non-derivative equity instruments, or to acquire a fixed number of the entity’s own equity instruments for a fixed amount in any currency.
No impact resulted from applying the amended standard on the statement of financial position and income statement.
IFRIC (19) Extinguishing Financial Liabilities with Equity InstrumentsThe adoption of this interpretation did not have any impact on the financial position or performance of the Bank.
Summary of significant accounting policies:
Basis of consolidation
The consolidated financial statements comprise the financial statements of the Bank and its subsidiaries, being those entities under the control of the Bank. Control is achieved where the Bank has the power to control the operating and financial decisions of the subsidiaries to get benefit from their operations. Inter-company balances and transactions are eliminated between the Bank and the subsidiaries.
- Al-Watanieh for Financial Services Company – Jordan (established 1992): Owned 100% by the Bank, with a paid-up capital of JD 5,000,000 as of 31 December 2011. The company’s main activity is investment brokerage.
- Al-Watanieh Securities Company – Palestine (established 1995): Owned 100% by the Bank, with a paid-up capital of JD 1,500,000 as of 31 December 2011. The company’s main activity is investment brokerage.
- No consolidation has been made of the financial statements of Cairo Real Estate Company – LL-Jordan, of which the Bank owns 100% of the paid-up capital of JD 50,000 as of 31 December 2011, due to the fact that on July 31, 2002 all assets and liabilities of the company were transferred to the Bank. The Bank is in the process of completing legal procedures to liquidate the company.
The financial statements of the subsidiaries are prepared for the same reporting year as the Bank, using consistent accounting policies. If different accounting policies were applied by the subsidiaries, adjustments shall be made on their financial statements in order to comply with those of the Bank.
Consolidated Financial Statement

69
Subsidiaries are fully consolidated from the date on which control is transferred to the Bank. The results of subsidiaries acquired or disposed of during the year are included in the consolidated income statement from the date of acquisition or up to the date of disposal, as appropriate.
If separate financial statements are prepared for the Bank, the investments in subsidiaries will be shown at cost in the balance sheet.
Segmental reporting
Business segments represent distinguishable components of the Bank that are engaged in providing products or services which are subject to risks and rewards that are different from those of other segments and are measured in accordance with the requests sent to the chief operating decision maker.
Geographical segments are associated to products and services provided within a particular economic environment, which are subject to risks and rewards that are different from those of other economic environments.
Financial assets held for trading (implemented before 1 January 2011)
Financial assets held for trading are those purchased with the intent to be resold in the near future to generate gains as a result of changes in market prices of such investments.
They are initially recognized at the fair value of consideration given (transaction costs are recorded in the income statement) and subsequently re-measured at fair value. All realized and unrealized gains or losses are transferred to the income statement including any gains or losses resulting from the translation of such assets held in foreign currencies to the functional currency.
Interest earned and dividends received are recorded in the income statement.
Direct credit facilities
Impairment of direct credit facilities is recognized in the allowance for credit losses when collection of amounts due to the banks are not probable and when events occur after the initial recognition of the facility that have an impact on the estimated future cash flows of the facilities that can be reliably estimated. The impairment is recorded in the income statement.
Interest and commission arising on non-performing facilities is suspended when loans become impaired according to the Central Bank of Jordan’s regulations.
Loans and the related allowance for credit losses are written off when collection procedures become ineffective. The excess in the allowance of possible loan losses, if any, is transferred to the statement of income, and cash recoveries of loans that were previously written off are credited to the income statement.
Financial assets available-for-sale (implemented before 1 January 2011)
Available-for-sale financial investments are those which are designated as such or do not qualify to be classified as designated at fair value through profit or loss, held-to-maturity or loans and advances.
Available-for-sale financial investments are measured at fair value in addition to the transaction cost and subsequently are measured at fair value. Unrealized gains and losses are recognized directly in equity as ‘Cumulative change in fair value reserve’. When the security is disposed of, the cumulative gain or loss previously recognized in equity is recognized in the income statement.The losses arising from impairment of such investments are recognized in the income statement and removed from the cumulative change in fair value reserve. Reversal of impairment on equity instruments is reflected in the cumulative change in fair value, while reversal of impairment on debt instruments is recognized in to the income statement.
Gains or losses on debt instruments (with interest) resulting from foreign exchange rate changes are transferred to the income statement. On equity instruments, such gains and losses are transferred to the cumulative change in fair value.
Interest earned on available-for-sale financial investments is reported as interest income using the effective interest method and any impairment is recorded in the income statement when happened.
Financial assets available-for-sale that cannot be reliably measured at fair value are recorded at cost. Impairment on such assets is recognized in the income statement.
Consolidated Financial Statement

70
Financial assets held to maturity (implemented before 1 January 2011)
Held-to-maturity financial investments are those which carry fixed or determinable payments and have fixed maturities and which the Bank has the positive intention and ability to hold to maturity.Held-to-maturity investments are initially recognized at cost, being the fair value of consideration given including directly attributable transaction costs. After initial measurement, held-to-maturity financial investments are subsequently measured at amortized cost using the effective interest method, less allowance for impairment. Amortized cost is calculated by taking into account any discount or premium on acquisition and fees that are an integral part of the effective interest rate.
Fair value
For investments and derivatives quoted in an active market, fair value is determined by reference to quoted market prices. Bid prices are used for assets and offer prices are used for liabilities.
For financial instruments where there is no active market fair value is normally based on one of the following methods:
- Comparison with the current market value of a highly similar financial instrument.- The expected cash flows discounted at current rates applicable for items with similar terms and risk characteristics.- Option pricing models.
The objective of the valuation method is to show a fair value that reflects market expectations.
Where the fair value of an investment cannot be reliably measured, it is stated at cost less any impairment in the value.
Impairment of financial assets
The Bank assesses at each balance sheet date whether there is any objective evidence that a financial asset or a group of financial assets is impaired. If such evidence exists, the recoverable amount is estimated in order to determine the amount of impairment loss to be recognized in the income statement.
Impairment is determined as follows:
- For assets carried at amortized cost, impairment is based on the difference between the carrying value and the estimated cash flows discounted at the original effective interest method.- For AFS financial assets carried at fair value, impairment is the difference between the cost and the fair value.- For assets carried at cost, impairment is based on the difference between the carrying value and the present value of future cash flows discounted at the current market rate of return from a similar financial asset.
Impairment is recognized in the income statement. If, in a subsequent period, the amount of the impairment loss decreases, the carrying value of the asset is increased to its recoverable amount. The amount of the reversal is recognized in the income statement except for equity instruments classified as available for sale investments for which the reversal is recognized in the statement of equity.
Property and equipment
Property and equipment is measured at cost less accumulated depreciation and accumulated impairment in value. Depreciation is calculated using the straight-line method to write down the cost of property and equipment to their residual values over their estimated useful lives. Land is not depreciated. Depreciation rates used are as follows:
% Buildings 2Equipment and furniture 9-15Vehicles 15Computers 20
Consolidated Financial Statement

71
The carrying values of property and equipment are reviewed for impairment when events or changes in circumstances indicate that the carrying values may not be recoverable. If any such indication exists and where the carrying values exceed the estimated recoverable amounts, the assets are written down to their recoverable amount, and the impairment is recorded in the income statement.Useful life for property and equipment is reviewed every year. If expected useful life is different from the previous one, the difference is recorded in the current and subsequent periods as a change in accounting estimate.
Elimination at the property and equipment happens when the asset is disposed of and there is no future benefit from using it.
Provisions
Provisions are recognized when the Bank has a present obligation (legal or constructive) the date at the financials arising from a past event and the costs to settle the obligation are both probable and able to be reliably measured.
Employees end of service indemnity
Provision for end of service indemnity is established by the Bank to face any legal or contractual obligations at the end of employees’ services and is calculated based on the service terms as of the financial statements date.
Income tax
Tax expense comprises current tax and deferred taxes.
Current tax is based on taxable profits, which may differ from accounting profits published in the income statement. Accounting profits may include non-taxable profits or non-deductible expenses which may be exempted in the current or subsequent financial years or accumulated losses that are acceptable as a tax deduction or items that are non-taxable or non-deductable for tax purposes.
Tax is calculated based on tax rates and laws that are applicable in the countries of operation.
Deferred tax is provided on temporary differences on the balance sheet date between the tax bases of assets and liabilities and their carrying amounts for financial reporting purposes. Deferred tax assets and liabilities are measured at the tax rates that are expected to apply in the period when the asset is realized or the liability is settled, based on laws that have been enacted or substantially enacted at the balance sheet date.
The Bank calculates the deferred tax in accordance with IAS12. Management have made a judgment that it is more appropriate not to record the deferred tax effect as an asset in the financial statements.
Fiduciary assets
Assets held in a fiduciary capacity are not recognized as assets of the Bank. Allowances for impairment are recorded for capital guaranteed portfolios that are managed on behalf of clients. Fees and commissions received for administering such assets are recognized in the income statement.
Offsetting
Financial assets and financial liabilities are only offset and the net amount reported in the statement of financial position when there is a legally enforceable right to set off the recognized amounts and the Bank intends to either settle on a net basis, or to realize the asset and settle the liability simultaneously.
Derivatives and hedge accounting
For hedge accounting purposes, derivative instruments are fair valued and hedges are classified as follows:
Fair value hedges
A fair value hedge is a hedge of the exposure to changes in the fair value of the Bank’s recognized assets or liabilities that is attributable to a particular risk.
Consolidated Financial Statement

72
For designated and qualifying fair value hedges, the change in the fair value of a hedging derivative is recognized in the income statement. The change in the fair value of the hedged item attributable to the risk hedged is recorded as adjustment to the carrying value of the hedged item and is also recognized in the income statement.
Cash flow hedges
A cash flow hedge is a hedge of the exposure to variability in the Bank’s actual and expected cash flows, which is attributable to a particular risk associated with a recognized asset or liability.
For designated and qualifying cash flow hedges, the effective portion of the gain or loss on the hedging instrument is initially recognized directly in equity, and is subsequently transferred to the income statement in the period in which the hedged cash flows affect income.
Hedge of net investments in foreign operations
Hedges of net investments in a foreign operation are accounted for by measuring the fair value of the hedging instrument. The effective portion of the gain or loss on the hedging instrument is initially recognized directly in equity, while the ineffective portion of the gain or loss on the hedging instrument is recognized immediately in the income statement. On disposal of the foreign operation, the cumulative value of any such gains or losses recognized directly in equity is transferred to the income statement.
For hedges which become ineffective, gains or losses resulting from the change in fair value of the hedge instrument is recognized directly in the income statement.
Derivative financial instruments held for trading
Derivative financial instruments such as foreign currency forward and future deals, interest rate forward and future deals, swaps, foreign currency options and others, are recorded at fair value in the balance sheet. Fair value is determined by reference to current market prices. In case such prices were not available, the method of valuation is stated. Changes in fair value are transferred to the income statement.
Repurchase and resale agreements
Assets sold with a simultaneous commitment to repurchase at a specified future date (repos) will continue to be recognized in the Bank’s financial statements due to the Bank’s continuing exposure to the risks and rewards of these assets, using the same accounting policies.
The proceeds of the sale are recorded under loans and borrowings. The difference between the sale and the repurchase price is recognized as an interest expense over the agreement term using the effective interest method.
Assets purchased with a corresponding commitment to resell at a specified future date (reverse repos) are not recognized in the Bank’s financial statements as assets since the Bank is not able to control these assets. The related payments are recognized as part of deposits at banks and financial institutions or direct credit facilities as applicable, and the difference between purchase and resale price is recognized in the income statement over the agreement term using the effective interest method.
Pledged financial assets as collateral
These are the financial assets that are pledged for other parties, and the other parties have the right to control the asset (sell or re-pledge). These financial assets continue to be valued using the same accounting policies and classification.
Revenue and expense recognition
Interest income is recorded using the effective interest method except for fees and interest on non-performing facilities, on which interest is transferred to the interest in suspense account and not recognized in the income statement.
Expenses are recognized on an accrual basis.
Commission income is recognized upon the rendering of services. Dividend income is recognized when the right to receive payment is established.
Consolidated Financial Statement

73
Trade date accounting
Sale or purchase of financial assets is recognized at the trade date, i.e. the date that the Bank commits to purchase or sell the asset.
Assets seized by the Bank against non-performing loans
Assets seized by the Bank through calling upon collateral are shown in the balance sheet under “other assets” at the lower of their carrying value or fair value. Assets are revalued at the balance sheet date on an individual basis and losses from impairment are transferred directly to the income statement, while revaluation gains are not recognized as income. Reversal of previous impairment losses shall not result in a carrying value that exceeds the carrying amount that would have been determined had no impairment loss been recognized for the asset in prior years.
Intangible assets
Intangible assets acquired through a business combination are recorded at their fair value on that date. Other intangible assets are measured on initial recognition at cost.
Intangible assets are classified on the basis of their useful life as definite and indefinite useful lives. Intangible assets with finite lives are amortized over the useful economic life, while intangible assets with indefinite useful lives are assessed for impairment at each reporting date or when there is an indication that the intangible asset may be impaired.
Internally generated intangible assets are not capitalized and are expensed in the income statement.
Indications of impairment of intangible assets are reviewed for and their useful economic lives are reassessed at each reporting date. Adjustments are reflected in the current and subsequent periods.
Intangible assets include computer software and programmers. These intangibles are amortized evenly over their estimated useful economic life of five years.
Foreign currencies
Transactions in foreign currencies are initially recorded in the functional currency at the rate of exchange ruling at the date of the transaction.
Monetary assets and liabilities in foreign currencies are translated into respective functional currencies at rates of exchange prevailing at the balance sheet date as issued by the Central Bank of Jordan. Any gains or losses are taken to the income statement.
Non-monetary items measured at fair value in a foreign currency are translated using the exchange rates at the date when the fair value was determined.
Exchange differences for non-monetary assets and liabilities in foreign currencies (such as equity instruments) are recorded as part of the change in fair value.
Upon the consolidation of the financial statements at the reporting date, the assets and liabilities of foreign subsidiaries and overseas branches are translated into the Bank’s presentation currency at the rate of exchange ruling at the balance sheet date, and their income statements are translated at the weighted average exchange rates for the year. Exchange differences arising on translation are taken directly to a separate component of equity. On disposal of an entity, the deferred cumulative amount recognized in equity relating to that particular foreign operation is transferred to the income statement.
Cash and cash equivalents
Cash and cash equivalents comprises cash on hand and cash balances with banks and financial institutions that mature within three months, less banks and financial institutions deposits that mature within three months and restricted balances.
Consolidated Financial Statement

74
(3) Use of estimates
The preparation of the financial statements requires management to make estimates and assumptions that affect the reported amounts of financial assets and liabilities and disclosure of contingent liabilities. These estimates and assumptions also affect the revenues and expenses and the resultant provisions as well as fair value changes reported in equity. In particular, considerable judgment by management is required in the estimation of the amount and timing of future cash flows. Such estimates are necessarily based on assumptions about several factors involving varying degrees of judgment and uncertainty and actual results may differ resulting in future changes in such provisions. The management believes that their estimates are reasonable:
- Allowance for credit losses: The Bank reviews and provides for its loan portfolios according to the Central Bank of Jordan regulations and IFRS.- Impairment losses on the valuation of possessed real estate properties are determined based on appraisal reports prepared by certified appraisers and reviewed periodically. - The income tax provision is calculated based on the applications of relevant laws.- Management periodically revaluates the useful lives of tangible and intangible assets in order to assess the amortization and depreciation for the year based on the useful life and future economic benefits. Any impairment is
taken to the income statement.- Legal provisions are provided for lawsuits raised against the Bank based on the Bank’s legal advisors’ opinion.
(4) Cash and Balances with Central Banks
2011 2010
JD JD
Cash on hand 41,037,801 46,913,899
Balances at Central Banks:
Current and demand deposits 5,819,280 21,035,163
Time and notice deposits 12,444,500 64,008,203
Statutory cash reserve 72,585,518 70,475,676
131,887,099 202,432,941
In addition to the statutory cash reserve held at Central Banks, restricted balances amounted to JD 7,090,000 as of 31 December 2011 (2010: JD 7,090,000).
(5) Balances at Banks and Financial Institutions
Local Banks and Financial Institutions Foreign Banks and Financial Institutions Total
2011 2010 2011 2010 2011 2010
JD JD JD JD JD JD
Current and demand deposits 2,321,079 2,462,794 21,736,535 21,001,828 24,057,614 23,464,622
Deposits maturing within 3 months 142,315,807 76,994,760 120,757,549 86,909,555 263,073,356 163,904,315
144,636,886 79,457,554 142,494,084 107,911,383 287,130,970 187,368,937
Non-interest bearing balances at banks and financial institutions amounted to JD 21,194,536 as of 31 December 2011 (2010: JD 19,298,167).
There are no restricted balances as of 31 December 2011 and 2010.
Consolidated Financial Statement

75
(6) Deposits at Banks and Financial Institutions
Local Banks and Financial Institutions Foreign Banks and Financial Institutions Total
2011 2010 2011 2010 2011 2010
JD JD JD JD JD JD
Deposit maturing within
More than 3 to 6 months - 15,000,000 3,500,000 33,629,750 3,500,000 48,629,750
More than 6 to 9 months - 35,000,000 - - - 35,000,000
More than 9 to 12 months - 40,545,000 - - - 40,545,000
- 90,545,000 3,500,000 33,629,750 3,500,000 124,174,750
There are no restricted balances as of 31 December 2011 and 2010.
(7) Financial Assets at Fair Value Through Profit or Loss
2011 2010
JD JD
Quoted Equities 22,928,930 -
Funds 1,711,526 -
Total 24,640,456 -
(8) Financial Assets at Fair Value Through other Comprehensive Income
2011 2010
JD JD
Quoted Investments
Quoted equities 25,261,478 -
Total quoted investments 25,261,478 -
Unquoted Investments
Quoted equities 648,735 -
Total unquoted investments 648,735 -
Total 25,910,213 -
Consolidated Financial Statement

76
(9) Financial Assets Held for Trading
2011 2010
JD JD
Quoted equities - 1,329,095
(10) Direct Credit Facilities
2011 2010
JD JD
Consumer lending
Overdrafts 7,286,517 7,653,350
Loans and bills* 487,882,144 412,360,653
Credit cards 10,337,775 10,280,900
Others 6,915,578 7,090,554
Residential mortgages 123,994,676 113,377,729
Corporate lending
Overdrafts 61,519,982 55,536,855
Loans and bills* 150,276,944 161,440,694
Small and medium enterprises lending “SMEs”
Overdrafts 19,823,858 19,391,650
Loans and bills* 30,630,027 27,171,110
Lending to governmental sectors 104,686,198 63,990,268
Total 1,003,353,699 878,293,763
Less: Suspended interest (10,528,884) (10,904,297)
Less: Allowance for impairment losses (45,234,822) (44,284,861)
Direct credit facilities, net 947,589,993 823,104,605
* Net of interest and commissions received in advance of JD 7,909,985 as of 31 December 2011 (2010: JD 10,643,097).
Consolidated Financial Statement

77
- At 31 December 2011, non-performing credit facilities amounted to JD 58,288,553 (2010: JD 46,257,486), representing 5.81% (2010: 5.27%) of gross facilities granted.
- At 31 December 2011, non-performing credit facilities, net of suspended interest, amounted to JD 47,956,902 (2010: JD 35,544,381), representing 4.83% (2010: 4.10%) of gross facilities granted after excluding the suspended interest.
- At 31 December 2011, credit facilities granted to the Government of Jordan amounted to JD 48,717,355 (2010: JD 13,643,045), representing 4,86% (2010: 1,55%) of gross facilities granted.
- At 31 December 2011, credit facilities granted to the public sector in Palestine amounted to JD 42,330,087 (2010: JD 43,482,310), representing 4.22% (2010: 4,95%) of gross facilities granted.
- A reconciliation of the allowance for impairment losses for direct credit facilities by class is as follows:
2011-Consumer Residential mortgages Corporate SMEs Total
JD JD JD JD JD
At 1 January 2011 28,439,784 452,524 13,596,656 1,795,897 44,284,861
Charge (surplus) for the year (5,366,194) 113,150 6,665,218 294,899 1,707,073
Amounts written off (662,748) - - (3,602) (666,350)
Revaluation difference (90,762) - - - (90,762)
At 31 December 2011 22,320,080 565,674 20,261,874 2,087,194 45,234,822
Specific impairment on individual loans 17,808,142 534,269 20,158,473 2,064,354 40,565,238
Watch list 184,826 31,405 103,401 22,840 342,472
Collective impairment 4,327,112 - - - 4,327,112
At 31 December 2011 22,320,080 565,674 20,261,874 2,087,194 45,234,822
2010-
At 1 January 2010 28,664,724 453,965 11,742,314 1,788,413 42,649,416
Charge (surplus) for the year 319,054 (1,441) 1,854,342 7,484 2,179,439
Amounts written off (425,657) - - - (425,657)
Revaluation difference (118,337) - - - (118,337)
At 31 December 2010 28,439,784 452,524 13,596,656 1,795,897 44,284,861
Specific impairment on individual loans 16,475,686 430,833 13,339,916 1,768,884 32,015,319
Watch list 341,828 21,691 256,740 27,013 647,272
Collective impairment 11,622,270 - - - 11,622,270
At 31 December 2010 28,439,784 452,524 13,596,656 1,795,897 44,284,861
Allowance for impairment related to non-performing credit facilities that were settled or collected amounted to JD 4,660,046 during 31 December 2011 (2010: JD 4,819,544).
Consolidated Financial Statement
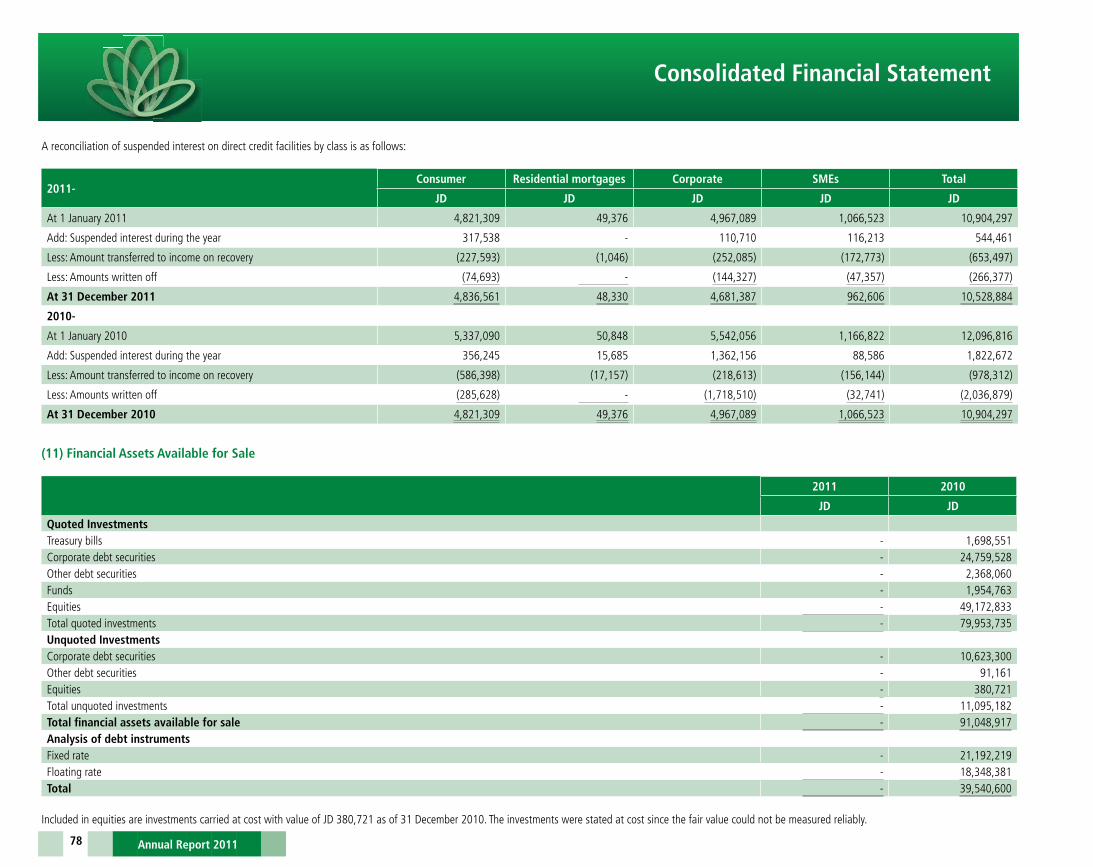
78
A reconciliation of suspended interest on direct credit facilities by class is as follows:
2011-Consumer Residential mortgages Corporate SMEs Total
JD JD JD JD JD
At 1 January 2011 4,821,309 49,376 4,967,089 1,066,523 10,904,297
Add: Suspended interest during the year 317,538 - 110,710 116,213 544,461
Less: Amount transferred to income on recovery (227,593) (1,046) (252,085) (172,773) (653,497)
Less: Amounts written off (74,693) - (144,327) (47,357) (266,377)
At 31 December 2011 4,836,561 48,330 4,681,387 962,606 10,528,884
2010-
At 1 January 2010 5,337,090 50,848 5,542,056 1,166,822 12,096,816
Add: Suspended interest during the year 356,245 15,685 1,362,156 88,586 1,822,672
Less: Amount transferred to income on recovery (586,398) (17,157) (218,613) (156,144) (978,312)
Less: Amounts written off (285,628) - (1,718,510) (32,741) (2,036,879)
At 31 December 2010 4,821,309 49,376 4,967,089 1,066,523 10,904,297
(11) Financial Assets Available for Sale
2011 2010
JD JD
Quoted InvestmentsTreasury bills - 1,698,551Corporate debt securities - 24,759,528Other debt securities - 2,368,060Funds - 1,954,763Equities - 49,172,833Total quoted investments - 79,953,735Unquoted InvestmentsCorporate debt securities - 10,623,300Other debt securities - 91,161Equities - 380,721Total unquoted investments - 11,095,182Total financial assets available for sale - 91,048,917Analysis of debt instrumentsFixed rate - 21,192,219Floating rate - 18,348,381Total - 39,540,600
Included in equities are investments carried at cost with value of JD 380,721 as of 31 December 2010. The investments were stated at cost since the fair value could not be measured reliably.
Consolidated Financial Statement
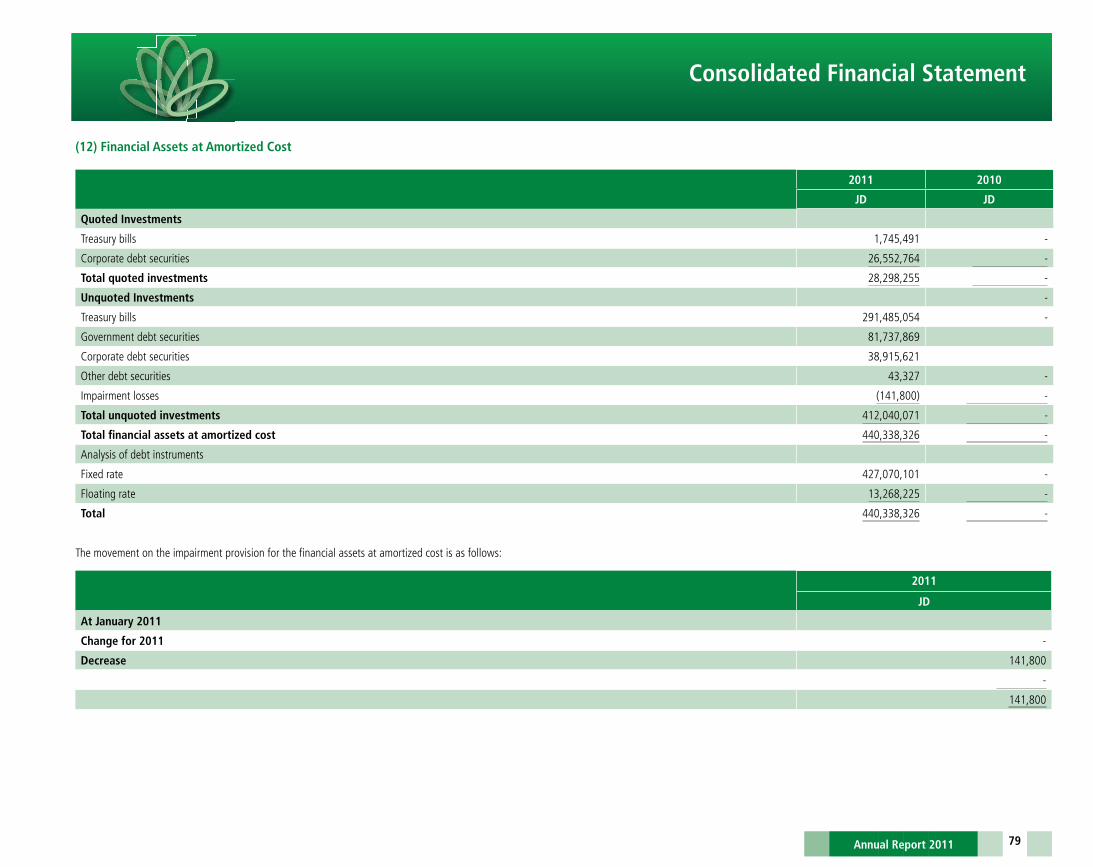
79
(12) Financial Assets at Amortized Cost
2011 2010
JD JD
Quoted Investments
Treasury bills 1,745,491 -
Corporate debt securities 26,552,764 -
Total quoted investments 28,298,255 -
Unquoted Investments -
Treasury bills 291,485,054 -
Government debt securities 81,737,869
Corporate debt securities 38,915,621
Other debt securities 43,327 -
Impairment losses (141,800) -
Total unquoted investments 412,040,071 -
Total financial assets at amortized cost 440,338,326 -
Analysis of debt instruments
Fixed rate 427,070,101 -
Floating rate 13,268,225 -
Total 440,338,326 -
The movement on the impairment provision for the financial assets at amortized cost is as follows:
Consolidated Financial Statement
2011
JD
At January 2011
Change for 2011 -
Decrease 141,800
-
141,800

80
(13) Financial Assets Held to Maturity
2011 2010
JD JD
Unquoted Investments
Treasury bills - 256,838,152
Government debt securities - 52,674,179
Corporate debt securities - 18,679,494
- 328,191,825
Analysis of debt instruments
Fixed rate - 328,191,825
Variable rate - -
Total - 328,191,825
Consolidated Financial Statement

81
(14) Property and Equipment
2011Land Buildings
Furniture & Fixtures
Vehicles ComputersProjects in Progress
Total
JD JD JD JD JD JD JD
Cost:
At 1 January 2011 1,274,880 13,349,796 31,244,587 1,393,531 20,497,480 4,424,427 72,184,701
Additions - - 3,093,928 37,000 1,588,548 651,699 5,371,175
Transferred - 508,279 2,101,846 - 486,578 (3,096,703) -
Disposals - - (678,152) (196,977) (408,405) - (1,283,534)
At 31 December 2011 1,274,880 13,858,075 35,762,209 1,233,554 22,164,201 1,979,423 76,272,342
Accumulated depreciation:
At 1 January 2011 - 2,283,332 17,650,528 915,114 13,800,071 - 34,649,045
Depreciation charge during the year - 273,771 3,244,088 116,796 2,710,703 - 6,345,358
Disposals - - (634,288) (185,175) (358,211) - (1,177,674)
At 31 December 2011 - 2,557,103 20,260,328 846,735 16,152,563 - 39,816,729
Net book value at 31 December 2011 1,274,880 11,300,972 15,501,881 386,819 6,011,638 1,979,423 36,455,613
2010-
Cost:
At 1 January 2010 1,274,880 13,349,796 28,044,318 1,113,448 18,218,579 1,476,994 63,478,015
Additions - - 2,989,998 280,083 2,128,733 4,085,765 9,484,579
Transferred - - 850,303 - 288,029 (1,138,332) -
Disposals - - (640,032) - (137,861) - (777,893)
At 31 December 2010 1,274,880 13,349,796 31,244,587 1,393,531 20,497,480 4,424,427 72,184,701
Accumulated depreciation:
At 1 January 2010 - 2,016,336 15,450,499 806,129 11,376,906 - 29,649,870
Depreciation charge during the year - 266,996 2,822,318 108,985 2,559,158 - 5,757,457
Disposals - - (622,289) - (135,993) - (758,282)
At 31 December 2010 - 2,283,332 17,650,528 915,114 13,800,071 - 34,649,045
Net book value at 31 December 2010 1,274,880 11,066,464 13,594,059 478,417 6,697,409 4,424,427 37,535,656
Fully depreciated property and equipment amounted to JD 23,732,286 as of 31 December 2011 (2010: JD 19,593,998).
The estimated cost to complete the purchase of assets and projects under construction amounts to JD 1,951,911 as of 31 December 2011 (2010: JD 2,770,981).
Consolidated Financial Statement

82
(15) Intangible Assets
Computer software
2011 2010
JD JD
Cost:
At 1 January 4,234,304 4,227,295
Additions 3,153,944 1,222,442
Amortization during the year (1,174,443) (1,215,433)
6,213,805 4,234,304
(16) Other Assets
2011 2010
JD JD
Accrued interest and revenue 9,623,611 8,149,597
Prepaid expenses 5,088,302 5,779,766
Assets obtained by the Bank by calling on collateral 11,040,584 10,982,216
Accounts receivable - net 713,529 691,112
Clearing checks 7,444,350 15,648,464
Trading settlement account 25,000 25,000
Refundable deposits 197,509 95,657
Deposit at Visa International 1,042,230 1,042,230
Temporary expenses - 3,600
Others 1,521,671 1,606,508
36,696,786 44,024,150
Central Bank of Jordan regulations require the sale of assets obtained by the Bank by calling on collateral within a maximum two years from the date of assignment.
Consolidated Financial Statement
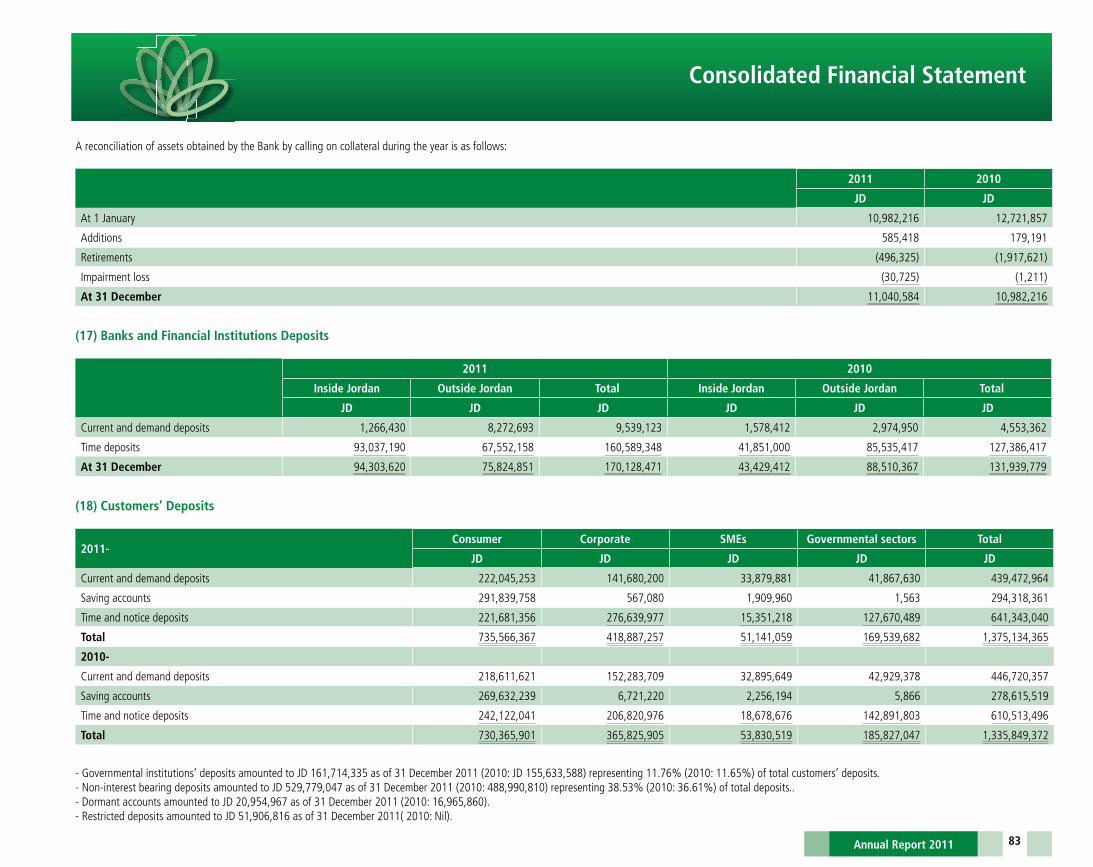
83
A reconciliation of assets obtained by the Bank by calling on collateral during the year is as follows:
2011 2010
JD JD
At 1 January 10,982,216 12,721,857
Additions 585,418 179,191
Retirements (496,325) (1,917,621)
Impairment loss (30,725) (1,211)
At 31 December 11,040,584 10,982,216
(17) Banks and Financial Institutions Deposits
2011 2010
Inside Jordan Outside Jordan Total Inside Jordan Outside Jordan Total
JD JD JD JD JD JD
Current and demand deposits 1,266,430 8,272,693 9,539,123 1,578,412 2,974,950 4,553,362
Time deposits 93,037,190 67,552,158 160,589,348 41,851,000 85,535,417 127,386,417
At 31 December 94,303,620 75,824,851 170,128,471 43,429,412 88,510,367 131,939,779
(18) Customers’ Deposits
2011-Consumer Corporate SMEs Governmental sectors Total
JD JD JD JD JD
Current and demand deposits 222,045,253 141,680,200 33,879,881 41,867,630 439,472,964
Saving accounts 291,839,758 567,080 1,909,960 1,563 294,318,361
Time and notice deposits 221,681,356 276,639,977 15,351,218 127,670,489 641,343,040
Total 735,566,367 418,887,257 51,141,059 169,539,682 1,375,134,365
2010-
Current and demand deposits 218,611,621 152,283,709 32,895,649 42,929,378 446,720,357
Saving accounts 269,632,239 6,721,220 2,256,194 5,866 278,615,519
Time and notice deposits 242,122,041 206,820,976 18,678,676 142,891,803 610,513,496
Total 730,365,901 365,825,905 53,830,519 185,827,047 1,335,849,372
- Governmental institutions’ deposits amounted to JD 161,714,335 as of 31 December 2011 (2010: JD 155,633,588) representing 11.76% (2010: 11.65%) of total customers’ deposits.- Non-interest bearing deposits amounted to JD 529,779,047 as of 31 December 2011 (2010: 488,990,810) representing 38.53% (2010: 36.61%) of total deposits..- Dormant accounts amounted to JD 20,954,967 as of 31 December 2011 (2010: 16,965,860). - Restricted deposits amounted to JD 51,906,816 as of 31 December 2011( 2010: Nil).
Consolidated Financial Statement
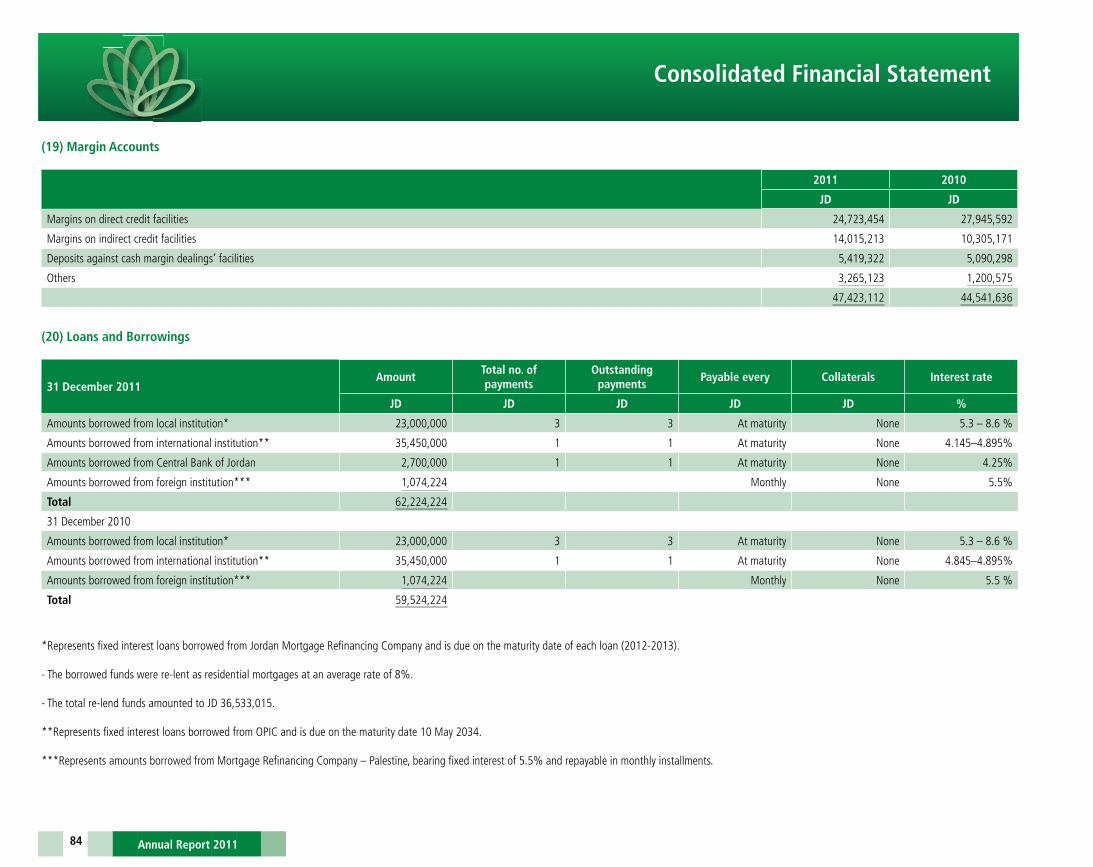
84
(19) Margin Accounts
2011 2010
JD JD
Margins on direct credit facilities 24,723,454 27,945,592
Margins on indirect credit facilities 14,015,213 10,305,171
Deposits against cash margin dealings’ facilities 5,419,322 5,090,298
Others 3,265,123 1,200,575
47,423,112 44,541,636
(20) Loans and Borrowings
31 December 2011Amount
Total no. of payments
Outstanding payments
Payable every Collaterals Interest rate
JD JD JD JD JD %
Amounts borrowed from local institution* 23,000,000 3 3 At maturity None 5.3 – 8.6 %
Amounts borrowed from international institution** 35,450,000 1 1 At maturity None 4.145–4.895%
Amounts borrowed from Central Bank of Jordan 2,700,000 1 1 At maturity None 4.25%
Amounts borrowed from foreign institution*** 1,074,224 Monthly None 5.5%
Total 62,224,224
31 December 2010
Amounts borrowed from local institution* 23,000,000 3 3 At maturity None 5.3 – 8.6 %
Amounts borrowed from international institution** 35,450,000 1 1 At maturity None 4.845–4.895%
Amounts borrowed from foreign institution*** 1,074,224 Monthly None 5.5 %
Total 59,524,224
*Represents fixed interest loans borrowed from Jordan Mortgage Refinancing Company and is due on the maturity date of each loan (2012-2013).
- The borrowed funds were re-lent as residential mortgages at an average rate of 8%.
- The total re-lend funds amounted to JD 36,533,015.
**Represents fixed interest loans borrowed from OPIC and is due on the maturity date 10 May 2034.
***Represents amounts borrowed from Mortgage Refinancing Company – Palestine, bearing fixed interest of 5.5% and repayable in monthly installments.
Consolidated Financial Statement

85
(21) Sundry Provisions
2011Balance at January 1
Provided during the period
Utilised during the year
Balance at December 31
JD JD JD JD
Provision for lawsuits against the bank 2,713,562 2,806,064 (125,248) 5,394,378
Provision for end of service indemnity 6,596,783 1,596,248 (1,847,055) 6,345,976
Other contingent liabilities 63,043 - - 63,043
Total 9,373,388 4,402,312 (1,972,303) 11,803,397
2010-
Provision for lawsuits against the Bank 2,830,188 - (116,626) 2,713,562
Provision for end of service indemnity 6,916,278 1,524,743 (1,844,238) 6,596,783
Other contingent liabilities 63,043 - - 63,043
Total 9,809,509 1,524,743 (1,960,864) 9,373,388
(22) Income Tax
Income tax liabilities
The movements on the income tax liability were as follows:
2011 2010
JD JD
At January 1 21,913,042 18,442,528
Income tax paid (14,401,383) (8,901,761)
Income tax payable 15,110,324 12,372,275
At December 31 22,621,983 21,913,042
Income tax appearing in the statement of income represents the following:
2011 2010
JD JD
Provision for income tax for the year 15,110,324 12,372,275
Amortization of deferred tax liabilities (782,143) -
Income tax charge for the year 14,328,181 12,372,275
Consolidated Financial Statement

86
The statutory tax rate on banks in Jordan is 30% and the statutory tax rate on foreign branches and subsidiaries range between 15%-30%.
The Bank reached a final settlement with the Income and Sales Tax Department for the year ended 31 December 2010.
A final settlement was reached with the tax authorities for Palestine branches for the year up to 2007. The Income Tax Department had a re-claim for the Bank with extra amount for the year 2006 and 2007. The Bank has appealed against the court decision. Also, a tax assessment was issued from the Tax Department for the year 2008 but the Bank disputed it. For the year 2009 and 2010 no reviews took place up to the date of preparing the financial statement.
Al-Watanieh Financial Services Company reached a final settlement with the Income Tax Department up to the year 2009 except for the year 1996, which is at court; the Income Tax Department did not review the 2010 account yet.
Al-Watanieh Securities Company – Palestine reached a final settlement with the Income Tax Department for the year 2009. The Income Tax Department did not review 2010 accounts.
The Income Tax Department has not reviewed the accounts of Cairo Real Estate Investments Company for the years from 1997 to 2010.
In the opinion of the Bank’s management, income tax provisions as of 31 December 2011 are sufficient.
Deferred Tax Liabilities
The movement on temporary differences giving rise to deferred tax liabilities are:
2011 2010
Balance at January 1 Released during the year
Additions during the year
Balance at December 31
Deferred Tax Deferred Tax
JD JD JD JD JD JD
Unrealized gain – financial assets OCI 28,722,116 25,319,814 819,562 4,221,864 371,146 3,818,965
Unrealized profit transferred to retained earnings - - 6,330,695 6,330,695 1,899,209 -
28,722,116 25,319,814 7,150,257 10,552,559 2,270,355 3,818,965
Included in deferred tax liabilities an amount of JD 371,146 (2010: JD 3,818,965) resulting from gains from the revaluation of financial assets at fair value through other comprehensive income which are included in the fair value reserve in equity. Also, deferred tax liabilities include an amount of JD 1,899,209 which represents unrealized gains transferred to retained earnings resulted from the early implementation of IFRS 9.
The movement on deferred tax liabilities account is as follows:
2011 2010
JD JD
At 1 January 3,818,965 7,877,838
Additions 2,142,764 529,407
Released (3,691,374) (4,588,280)
At 31 December 2,270,355 3,818,965
Consolidated Financial Statement

87
A reconciliation between tax expense and the accounting profit is as follows:
2011 2010
JD JD
Accounting profit 50,924,595 47,121,111
Non-taxable profit (12,823,364) (5,082,297)
Non-deductible expenses 9,348,698 1,119,174
Taxable profit 47,449,929 43,157,988
Effective rate of income tax 28,14% 26,26 %
(23) Other Liabilities
2011 2010
JD JD
Accrued interest expense 2,301,745 1,990,170
Accounts payable 2,880,611 4,064,878
Accrued expenses 5,184,193 4,522,434
Temporary deposits 6,750,662 8,382,702
Checks and withdrawals 6,424,887 10,004,289
Settlement guarantee fund 15,242 173,312
Others 1,629,661 1,420,728
25,187,001 30,558,513
(24) Paid in Capital
The authorized and paid in capital amounted to JD 100,000,000 divided into 100,000,000 shares at a par value of JD 1 per share.
(25) Reserves
Statutory ReserveAs required by the Law, 10% of the profit before tax is transferred to the statutory reserve. This reserve is not available for distribution to shareholders.
Voluntary ReserveThe balance represents 20% of the profit before tax transferred to the voluntary reserve during previous years. The reserve shall be used at the discretion of the Board of Directors, and it is distributable to shareholders in part or in full.
General Banking Risk ReserveThis reserve is appropriated from retained earnings in compliance with the regulations of the Central Bank of Jordan and Palestine Monetary Authority.
Consolidated Financial Statement

88
Pro-cyclicality ReserveThis reserve is appropriated from retained earnings in compliance with the regulations of the Palestine Monetary Authority.
The use of the following reserves is restricted law:
Description Amount Restriction Law
Statutory Reserve 37,749,106 Banks and companies Law
General Banking Risk Reserve 10,150,000 Central Bank of Jordan regulations
Pro-cyclicality Reserve 2,318,759 Palestine Monetary Authority regulations
(26) Cumulative Change in Fair Value
2010
Financial assets available for sale
Stocks Funds Bonds Total
JD JD JD JD
Balance at 1 January 21,916,512 172,723 (112,930) 21,976,305
Net unrealized gains (losses) (3,147,393) 39,314 997,141 (2,110,938)
Deferred tax liabilities 4,058,873 - - 4,058,873
(Profit) loss transferred to income statement (91,558) - 35,032 (56,526)
Impairment loss transferred to income statement 90,340 - 945,097 1,035,437
Balance at 31 December 22,826,774 212,037 1,864,340 24,903,151
The cumulative change in fair value is presented net of deferred tax liabilities of JD 3,818,965 as of 31 December 2010.
(27) Fair Value Reserve
The movement is as follows:
2011 2010
JD JD
Beginning balance - -
Effect of implementation IFRS9 6,368,626 -
Unrealized loss (2,913,206)
Gain from sale financial assets at fair value through other (429,926) -
Deferred tax liability 825,224 -
Ending balance 3,850,718 -
The fair value reserve is presented net of deferred tax liabilities of JD 371,146 as of 31 December 2011.
Consolidated Financial Statement
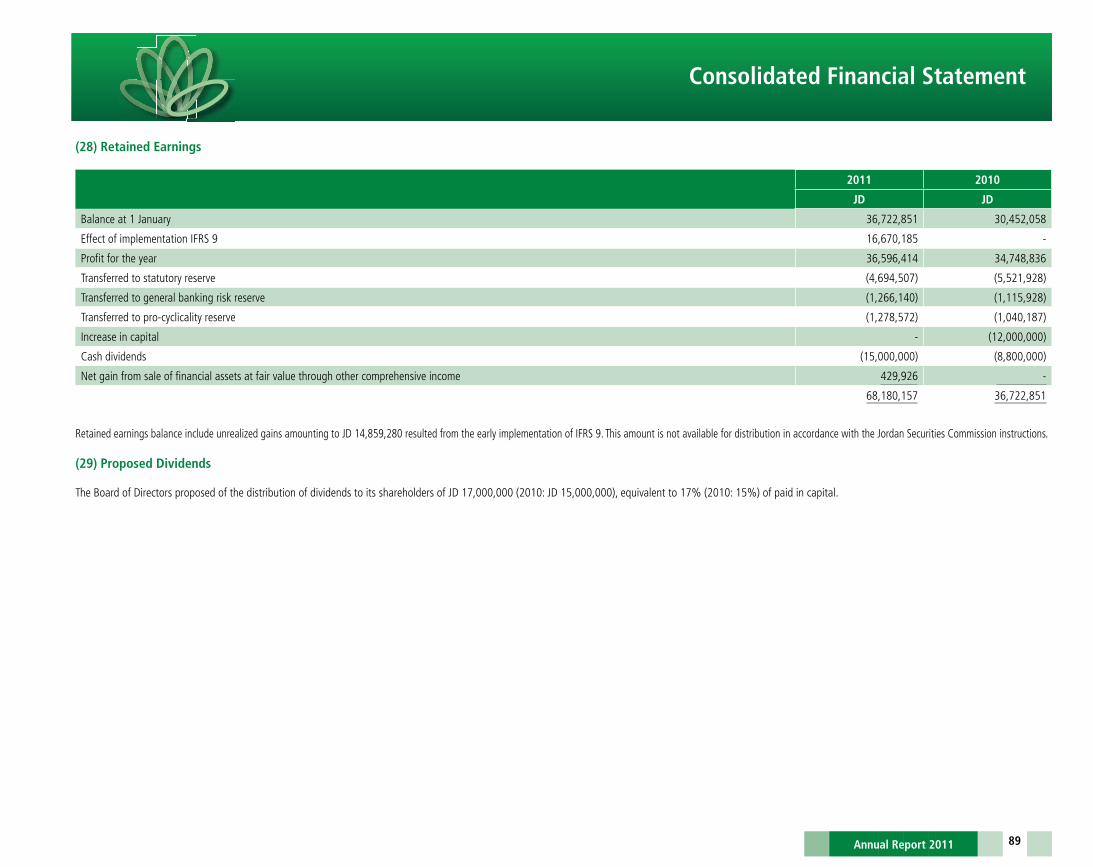
89
(28) Retained Earnings
2011 2010
JD JD
Balance at 1 January 36,722,851 30,452,058
Effect of implementation IFRS 9 16,670,185 -
Profit for the year 36,596,414 34,748,836
Transferred to statutory reserve (4,694,507) (5,521,928)
Transferred to general banking risk reserve (1,266,140) (1,115,928)
Transferred to pro-cyclicality reserve (1,278,572) (1,040,187)
Increase in capital - (12,000,000)
Cash dividends (15,000,000) (8,800,000)
Net gain from sale of financial assets at fair value through other comprehensive income 429,926 -
68,180,157 36,722,851
Retained earnings balance include unrealized gains amounting to JD 14,859,280 resulted from the early implementation of IFRS 9. This amount is not available for distribution in accordance with the Jordan Securities Commission instructions.
(29) Proposed Dividends
The Board of Directors proposed of the distribution of dividends to its shareholders of JD 17,000,000 (2010: JD 15,000,000), equivalent to 17% (2010: 15%) of paid in capital.
Consolidated Financial Statement

90
(30) Interest Income
2011 2010
JD JD
Consumer lending
Overdrafts 510,992 579,914
Loans and bills 49,798,719 42,542,392
Credit cards 2,495,032 2,364,925
Others 331,603 399,274
Residential mortgages 8,672,957 8,520,420
Corporate lending
Overdrafts 4,031,097 4,016,988
Loans and bills 8,643,065 8,927,499
Small and medium enterprises lending
Overdrafts 1,062,829 982,192
Loans and bills 2,149,080 1,967,723
Public and governmental sectors 5,245,662 5,411,338
Balances at Central Banks 227,636 771,130
Balances at banks and financial institutions 7,398,382 5,885,623
Financial assets at amortized cost 20,868,471 -
Financial assets at fair value through other comprehensive income 3,165 -
Financial assets available for sale - 1,713,618
Financial assets held to maturity - 21,755,032
Total 111,438,690 105,838,068
Consolidated Financial Statement

91
(31) Interest Expense
2011 2010
JD JD
Banks and financial institution deposits 1,512,509 1,933,045
Customers’ deposits:
Current accounts and deposits 3,524,900 3,343,373
Saving accounts 2,132,587 2,431,523
Time and notice placements 17,635,576 17,142,830
Margin accounts 773,937 310,656
Loans and borrowings 3,256,628 3,745,811
Deposit guarantee fees 1,833,800 1,677,370
30,669,937 30,584,608
(32) Net Commission
2011 2010
JD JD
Commission income:
Direct credit facilities 7,304,759 7,706,053
Indirect credit facilities 1,773,901 1,884,487
Other commission 10,248,858 9,931,363
Less: commission expense (43,560) (24,199)
19,283,958 19,497,704
(33) Gain from Foreign Currencies
2011 2010
JD JD
Resulting from:
Trading in foreign currencies 468,630 349,339
Revaluation of foreign currencies 2,652,483 1,962,904
3,121,113 2,312,243
Consolidated Financial Statement

92
(34) Gain from Financial Assets Held for Trading
Realized (loss) Unrealized gain Cash dividends Total
2011
Equities - - - -
2010
Equities (2,909) 40,917 11,679 49,687
(35) Net Gain from Financial Assets at Fair Value Through Profit or Loss
Realized gain (loss) Unrealized gain (loss) Cash dividends Total
2011
Equities 4,264,103 37,431 1,784,978 6,086,512
Funds - (243,237) - (243,237)
4,264,103 (205,806) 1,784,978 5,843,275
2010
Equities - - - -
Funds - - - -
- - - -
(36) Dividends from Financial Assets at Fair Value Through Other Comprehensive Income
2011 2010
JD JD
Dividend income 870,151 -
870,151 -
(37) Gain from Financial Assets Available for Sale
2011 2010
JD JD
Dividend income - 2,215,973
Gain from sale of financial assets available-for-sale - 56,526
Less: impairment losses on AFS investments - (1,035,437)
- 1,237,062
Consolidated Financial Statement
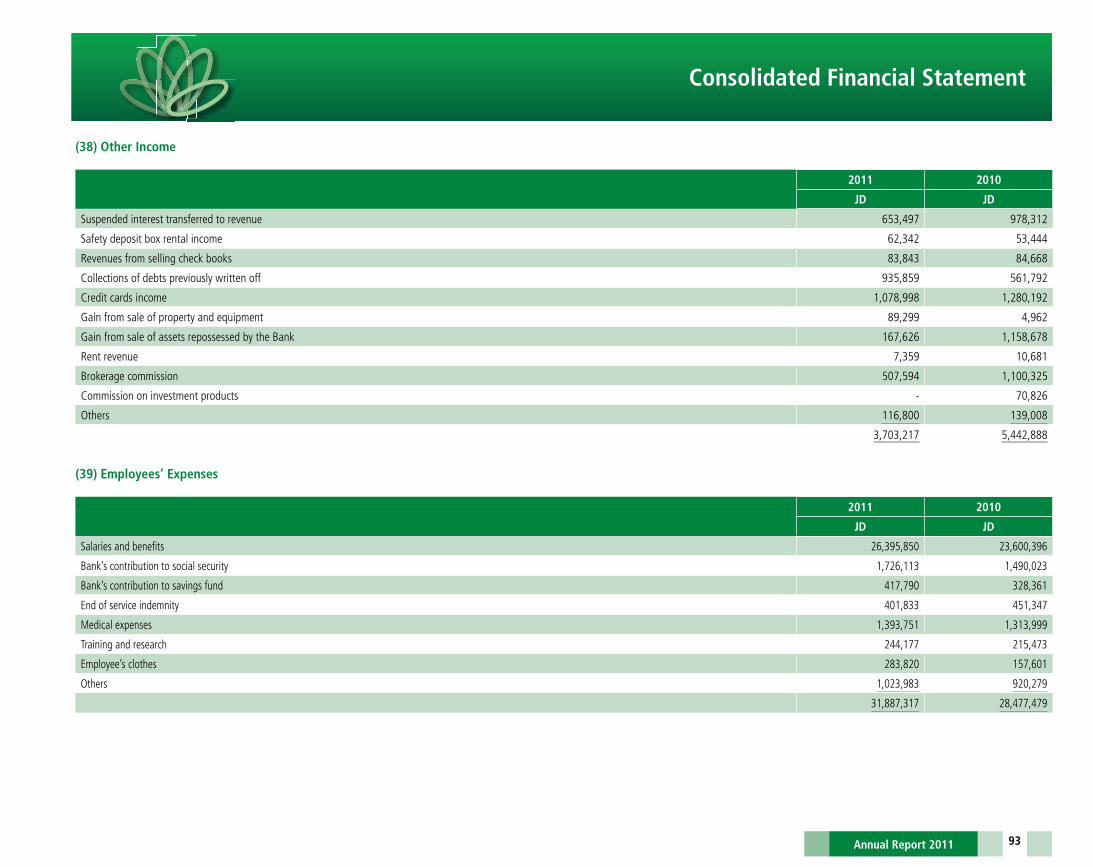
93
(38) Other Income
2011 2010
JD JD
Suspended interest transferred to revenue 653,497 978,312
Safety deposit box rental income 62,342 53,444
Revenues from selling check books 83,843 84,668
Collections of debts previously written off 935,859 561,792
Credit cards income 1,078,998 1,280,192
Gain from sale of property and equipment 89,299 4,962
Gain from sale of assets repossessed by the Bank 167,626 1,158,678
Rent revenue 7,359 10,681
Brokerage commission 507,594 1,100,325
Commission on investment products - 70,826
Others 116,800 139,008
3,703,217 5,442,888
(39) Employees’ Expenses
2011 2010
JD JD
Salaries and benefits 26,395,850 23,600,396
Bank’s contribution to social security 1,726,113 1,490,023
Bank’s contribution to savings fund 417,790 328,361
End of service indemnity 401,833 451,347
Medical expenses 1,393,751 1,313,999
Training and research 244,177 215,473
Employee’s clothes 283,820 157,601
Others 1,023,983 920,279
31,887,317 28,477,479
Consolidated Financial Statement
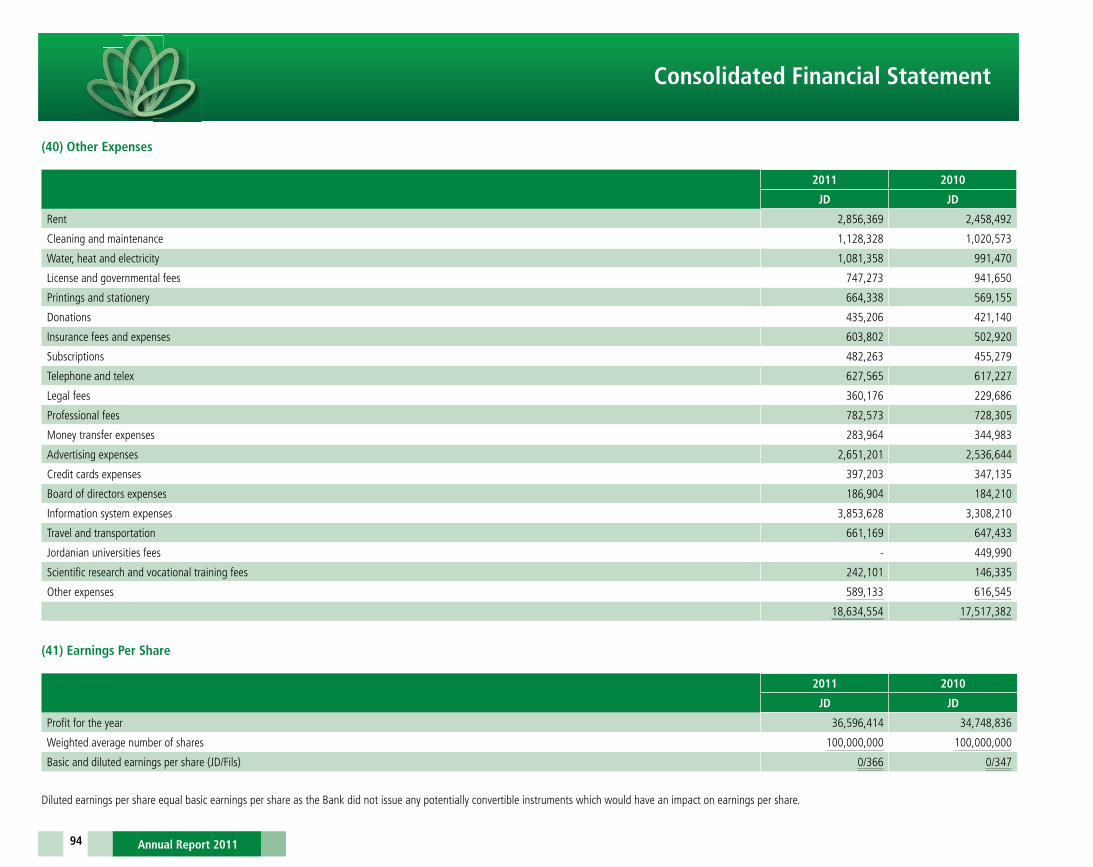
94
(40) Other Expenses
2011 2010
JD JD
Rent 2,856,369 2,458,492
Cleaning and maintenance 1,128,328 1,020,573
Water, heat and electricity 1,081,358 991,470
License and governmental fees 747,273 941,650
Printings and stationery 664,338 569,155
Donations 435,206 421,140
Insurance fees and expenses 603,802 502,920
Subscriptions 482,263 455,279
Telephone and telex 627,565 617,227
Legal fees 360,176 229,686
Professional fees 782,573 728,305
Money transfer expenses 283,964 344,983
Advertising expenses 2,651,201 2,536,644
Credit cards expenses 397,203 347,135
Board of directors expenses 186,904 184,210
Information system expenses 3,853,628 3,308,210
Travel and transportation 661,169 647,433
Jordanian universities fees - 449,990
Scientific research and vocational training fees 242,101 146,335
Other expenses 589,133 616,545
18,634,554 17,517,382
(41) Earnings Per Share
2011 2010
JD JD
Profit for the year 36,596,414 34,748,836
Weighted average number of shares 100,000,000 100,000,000
Basic and diluted earnings per share (JD/Fils) 0/366 0/347
Diluted earnings per share equal basic earnings per share as the Bank did not issue any potentially convertible instruments which would have an impact on earnings per share.
Consolidated Financial Statement
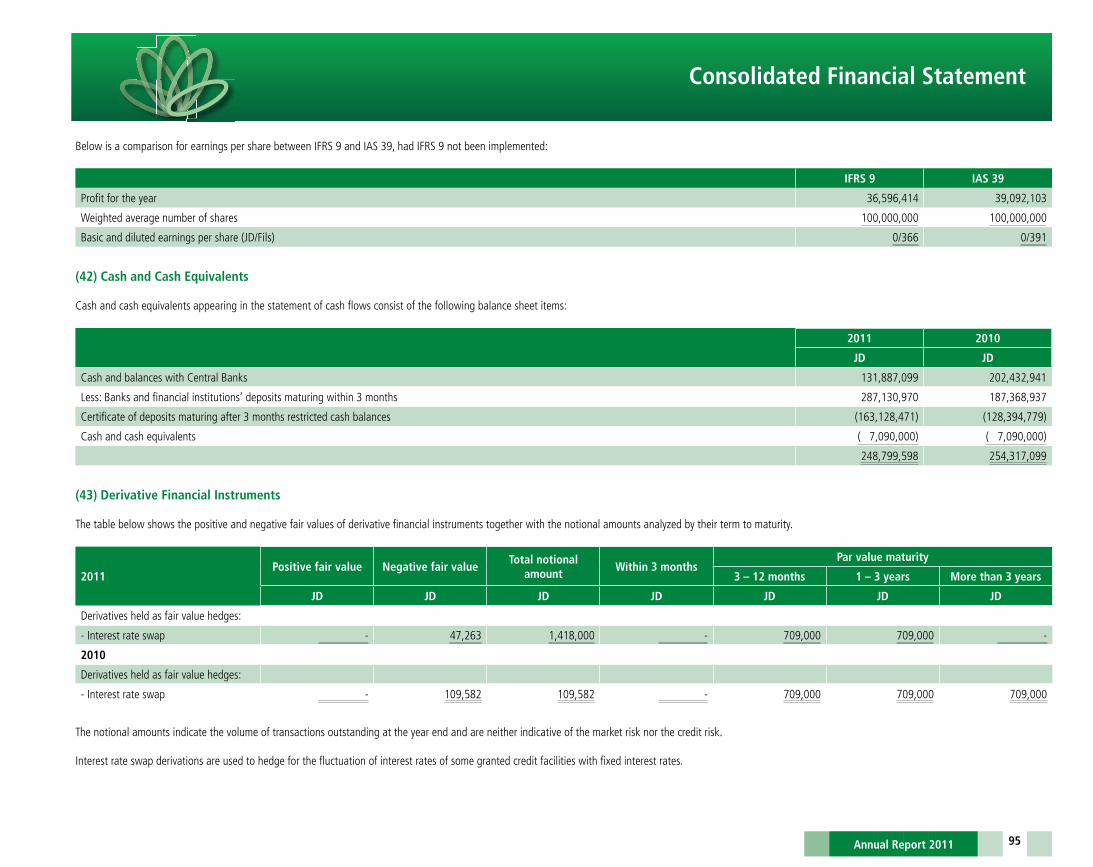
95
Below is a comparison for earnings per share between IFRS 9 and IAS 39, had IFRS 9 not been implemented:
IFRS 9 IAS 39
Profit for the year 36,596,414 39,092,103
Weighted average number of shares 100,000,000 100,000,000
Basic and diluted earnings per share (JD/Fils) 0/366 0/391
(42) Cash and Cash Equivalents
Cash and cash equivalents appearing in the statement of cash flows consist of the following balance sheet items:
2011 2010
JD JD
Cash and balances with Central Banks 131,887,099 202,432,941
Less: Banks and financial institutions’ deposits maturing within 3 months 287,130,970 187,368,937
Certificate of deposits maturing after 3 months restricted cash balances (163,128,471) (128,394,779)
Cash and cash equivalents ( 7,090,000) ( 7,090,000)
248,799,598 254,317,099
(43) Derivative Financial Instruments
The table below shows the positive and negative fair values of derivative financial instruments together with the notional amounts analyzed by their term to maturity.
2011Positive fair value Negative fair value
Total notional amount
Within 3 monthsPar value maturity
3 – 12 months 1 – 3 years More than 3 years
JD JD JD JD JD JD JD
Derivatives held as fair value hedges:
- Interest rate swap - 47,263 1,418,000 - 709,000 709,000 -
2010
Derivatives held as fair value hedges:
- Interest rate swap - 109,582 109,582 - 709,000 709,000 709,000
The notional amounts indicate the volume of transactions outstanding at the year end and are neither indicative of the market risk nor the credit risk.
Interest rate swap derivations are used to hedge for the fluctuation of interest rates of some granted credit facilities with fixed interest rates.
Consolidated Financial Statement

96
(44) Related Party Transactions
The accompanying consolidated financial statements of the Bank include the following subsidiaries:
Company name Ownership
Paid in capital
2011 2010
JD JD
Al-Watanieh Financial Services Company 100 % 5,000,000 5,000,000
Al-Watanieh Securities Company 100 % 1,500,000 1,500,000
The Bank entered into transactions with major shareholders, directors, senior management and their related concerns in the ordinary course of business at commercial interest and commission rates. All the loans and advances to related parties are performing advances and are free of any provision for credit losses.
The following related party transactions took place during the year:
Board of Directors Executive management Others* Total 2011 Total 2010
JD JD JD JD JD
Balance sheet items:
Direct credit facilities 12,615,657 2,419,668 15,297,662 30,332,987 19,964,329
Deposits at the Bank 1,711,025 2,943,893 6,148,817 10,803,735 39,268,710
Margin accounts 822,320 - 98,372 920,692 691,131
Off balance items:
Indirect credit facilities 2,090,878 - 390,803 2,481,681 2,195,819
Income statements items:
Interest and commission income 323,169 97,119 171,452 591,740 1,183,077
Interest and commission expense 108,028 114,725 88,827 311,580 354,480
Debit interest rates on credit facilities in Jordanian Dinar range between 4% - 8.85%Debit interest rates on credit facilities in foreign currency range between 1.98% - 7% Credit interest rates on deposits in Jordanian Dinar range between 0% - 4.75%Credit interest rates on deposits in foreign currency range between 0% - 1.25%
Inter-company balances and transactions are eliminated on consolidation.
Compensation of the key management personnel is as follows:
2011 2010
JD JD
Benefits (Salaries, wages, and bonuses) of senior management 2,564,745 2,229,409
Consolidated Financial Statement

97
(45) Fair Value of Financial Instruments
Financial instruments include cash balances, deposits at central banks and financial institutions, direct credit facilities, financial investments available for sale, financial assets held for trading, other financial assets, customers’ deposits, banks’ deposits and other financial liabilities.
There are no material differences between the carrying values and fair values of the on and off balance sheet financial instruments as of 31 December 2011 and 2010.
The Bank uses the following hierarchy for determining and disclosing the fair value of financial instruments by valuation technique:Level 1: quoted (unadjusted) prices in active markets for identical assets or liabilities;Level 2: other techniques for which all inputs which have a significant effect on the recorded fair value are observable, either directly or indirectly; andLevel 3: techniques which use inputs which have a significant effect on the recorded fair value that are not based on observable market data.
2011-First Level Second Level Third Level Total
JD JD JD JD
Financial assets at fair value through profit or loss 24,640,456 - - 24,640,456
Financial assets at fair value through other comprehensive income 24,006,303 1,255,175 - 25,261,478
2010-
Financial assets held for trading 1,329,095 - - 1,329,095
Financial assets available for sale 65,307,843 14,645,892 - 79,953,735
(46) Fair Value of the Financial Assets and Liabilities that are not Shown at Fair Value in the Financial Statements:
As explained in note (8) to the financial statements, financial assets at fair value through other comprehensive income included unquoted equities amounting to JD 648,735 as of 31 December 2011.
There are no material differences between the carrying values and fair values of the financial assets and financial liabilities as of 31 December 2011 and 2010.
(47) Risk Management
The Bank manages its risks through a comprehensive strategy for risk management by which the roles and responsibilities of all parties concerned are identified. These include the Board of Directors and subcommittees such as the Risk Committee, the Investment Committee and Audit Committee, in addition to the executive management and its subcommittees, such as Assets and Liabilities Committee, Procedures Development Committee, Credit Committees and other specialized Departments such as the Risk Management Department and the Audit Department. Furthermore, all of the Bank’s business units are considered responsible for identifying the risks associated within their banking operations and committed to applying the appropriate controls and monitoring their effectiveness and maintaining integrity within the internal control system.
The process of managing the risks within Cairo Amman Bank’s activities include the identification, measurement, assessment and monitoring of financial and non-financial risks which could negatively affect the Bank’s performance and reputation or its goals ensuring that the Bank achieves optimum yield in return for the risks taken.
The Bank is exposed at least to the following risk categories:- Credit Risk- Market Risk - Liquidity Risk- Operational Risk - Compliance Risk
Consolidated Financial Statement

98
The general framework of risk management at the Bank is in line with the size, complexity and nature of its operations, and in harmony with local regulations as well as taking into account the best international practices in this regard.
The Bank’s set of principles include the following:
1 - The Board of Directors’ responsibility for risk management. The Risk Committee of the Board of Directors does a periodic review of policies, strategies and risk management procedures of the Bank, including setting acceptable risk limits.
2 - The responsibility of the Board of Directors, represented by the Risk Committee in the development of the internal assessment of capital and analysis of current and future requirements for capital and as appropriate with the structure of the Bank’s risk and strategic goals and taking action on particular in addition to its responsibility in ensuring a good system to evaluate the types of risks faced by the Bank and the development of the system to link these risks with the level of capital required to cover.
3 - The responsibility of the Board of Directors to approve the policies developed by the executive management.4 - The Risk Management Department, which is independent of other bank’s operations, reports to the Risk Committee on risk issues. For daily operations it is linked with the General Manager, and analyses all the risks including
credit, market, liquidity and operational risk in addition to the development of measurement methodologies and controls for each type of risk as needed.5 - Internal Audit Department provides independent confirmation of the compliance of the working units with the policies and procedures set to manage risks and their efficiency.6 - Managing risk is considered the responsibility of each unit and every employee of the Bank in relation to those risks, which are within their functions.
Credit Risks
Credit risk is the risk that may result from a lack of commitment or the inability of the other party of the financial instrument to fulfil its obligations to the Bank, leading to a financial loss. The Bank manages its credit risk through the design and development of various policies that identify and address all aspects of granting and maintenance of credit in addition to determining the limits of credit facilities granted to clients and/or related groups as well as diversifying total credit facilities across sectors and geographical regions. The Bank also works continuously to evaluate the credit worthiness of customers, in addition to having appropriate collaterals.The general framework for Credit Risk Management includes:
Credit Policies: The Bank manages its credit risk through the annual policies set by the Board of Directors including credit ceilings and various credit conditions, which are renewed annually according to several changing factors and the results of the analysis and studies. These policies define maximum credit limits given to any customer and/or group of related customers in addition to the distribution of credit according to geographical regions and different economic sectors. The Bank considers the diversification of portfolios an important risk mitigation factor.
Customer Rating: Customer credit risk rating is performed internally; customers are rated according to their credit-worthiness and ability to pay, in addition to assessing the quality of the facilities granted to clients, in terms of account activity and regularity of payment of principal and interest. The collaterals are classified according to type and percentage coverage of risk. Moreover the Bank periodically monitors the portfolios and their diversification, according to several classifications.
Mitigation Methodologies:The Bank follows different procedures to mitigate risks, including determining the acceptable types of collaterals and their conditions, whereby good collaterals that can be liquidated at a reasonable time and value are accepted by the Bank taking into consideration that the value of the collateral is not related to the business of the customer. Moreover, the Bank requires insurance policies on certain properties as a means of mitigating risks. The values of the collaterals are monitored on a regular basis, and in the event of decrease in its value, additional collaterals are required. Credit Granting: The Bank adopts the principle of segregation of functions in line with best practices in this regard, clarifying the roles and responsibilities between each of the different credit functions (sales, credit approvals, credit administration, credit operations), to ensure a strong control over credit granting operations.Credit decisions are checked against the credit policies and authority limits. All documentations and contracts are reviewed before executing the credit.
Maintenance and Follow-up of Credit - The performance of the credit portfolio is continuously monitored to make sure it is within the acceptable risk limits and to identify any increasing risk levels.- The Bank continuously monitors its performing portfolios to identify any need for additional provisions.- There are specialized and independent departments responsible for managing irregular credit facilities and handle the task of their administration and collection.
Consolidated Financial Statement

99
The table below shows the maximum exposure to credit risk net of allowances for impairment and suspended interest and before the effect of mitigation through the use of collateral agreements:
2011 2010
JD JD
Statement of financial position
Cash and balances at Central Banks 90,849,298 155,519,042
Balances at banks and financial institutions 287,130,970 187,368,937
Deposits at banks and financial institutions 3,500,000 124,174,750
Direct credit facilities:
Consumer lending 485,265,373 404,124,364
Residential mortgages 123,380,672 112,875,829
Corporate lending:
Large corporations 186,853,665 198,413,804
Small and medium enterprises 47,404,085 43,700,340
Lending to governmental sectors 104,686,198 63,990,268
Bonds and treasury bills:
Within financial assets available for sale - 39,540,600
Within financial assets amortized cost 440,338,326 -
Within financial assets held to maturity - 328,191,825
Other assets 18,848,720 25,556,403
Total 1,788,257,307 1,683,456,162
Contingent liabilities
Letters of guarantee 51,407,174 40,229,532
Letters of credit 55,382,633 30,994,924
Acceptances 4,282,350 1,870,499
Irrevocable commitments to extend credit 79,575,208 75,047,592
Total 190,647,365 148,142,547
1,978,904,672 1,831,598,709
Types of collaterals against loans and credit facilities are as follows:
- Real estate properties- Financial instruments (equities and bonds)- Bank guarantees- Cash collateral- Government guarantees
The management reviews the fair value of collateral periodically and in case of drop of the fair value the Bank requests additional collaterals to cover the shortage. Also, the Bank revaluates the collaterals of non-performing loans periodically.
Consolidated Financial Statement

100
1) The distribution of credit exposures in accordance with their risk classification is as follows:
ConsumerResidential Mortgages
Corporate SMEsGovernment
sectorsFinancial
InstitutionsTotal
JD JD JD JD JD JD JD
2011
Low risk 3,166,673 225,242 4,348,993 3,670,148 512,583,609 - 523,994,665
Acceptable risk 485,867,263 120,021,453 206,200,360 38,739,575 65,344,056 331,693,739 1,247,866,446
Maturing:**
Up to 30 days 159,164 143,239 1,095,000 173,007 - - 1,570,410
From 31 to 60 days 152,286 11,798 - 730 - - 164,814
Watch list 4,369,792 2,093,657 6,192,982 1,214,918 - - 13,871,349
Non performing:
Substandard 2,140,797 227,436 - 639,181 - - 3,007,414
Doubtful 2,086,455 435,001 9,685,721 493,983 - - 12,701,160
Loss 17,495,402 1,336,583 16,278,323 7,469,671 - - 42,579,979
Total 515,126,382 124,339,372 242,706,379 52,227,476 577,927,665 331,693,739 1,844,021,013
Less: Suspended interest 4,836,561 48,330 4,681,387 962,606 - - 10,528,884
Less: provision for impairment losses 22,320,080 565,674 20,261,874 2,087,194 - - 45,234,822
Net 487,969,741 123,725,368 217,763,118 49,177,676 577,927,665 331,693,739 1,788,257,307
2010
Low risk 1,438,930 448,506 7,980,811 6,636,980 409,831,292 - 426,336,519
Acceptable risk 413,425,594 109,694,276 187,368,089 34,880,127 130,445,501 363,376,532 1,239,190,119
Maturing:
Up to 30 days 57,630 39,422 1,774 94,557 - - 193,383
From 31 to 60 days 270,945 140,486 584,636 117,826 - - 1,113,893
Watch list 7,266,449 1,446,041 17,116,038 1,032,668 - - 26,861,196
Non performing:
Substandard 1,183,482 341,827 - 366,746 - - 1,892,055
Doubtful 2,376,761 620,201 115,878 850,646 - - 3,963,486
Loss 14,656,426 988,537 18,462,480 6,294,502 - - 40,401,945
Total 440,347,642 113,539,388 231,043,296 50,061,669 540,276,793 363,376,532 1,738,645,320
Less: Suspended interest 4,821,309 49,376 4,967,089 1,066,523 - - 10,904,297
Less: provision for impairment losses 28,439,784 452,524 13,596,656 1,795,897 - - 44,284,861
Net 407,086,549 113,037,488 212,479,551 47,199,249 540,276,793 363,376,532 1,683,456,162
*Include exposures to credit facilities, balances and deposit at banks and financial institutions, bonds and treasury bills and any assets with credit exposures.**Total balance of facilities due if one of the installment or interest is due, and the overdraft account is due if it exceeds the limit.
Consolidated Financial Statement

101
2) Distribution of collaterals measured at fair value over credit facilities:
2011-Consumer
Residential mortgages
Corporate SMEsGovernmental
sectorsTotal
JD JD JD JD JD JD
Collaterals
Low risk 3,124,513 67,386 4,346,369 3,556,962 7,820,676 18,915,906
Acceptable risk 22,940,796 123,380,672 31,308,054 36,332,702 - 213,962,224
Watch list 379,997 2,093,657 5,345,149 417,866 - 8,236,669
Non performing:
Substandard 106,876 227,436 - 468,685 - 802,997
Doubtful - 435,001 4,243,938 493,982 - 5,172,921
Loss 2,702,818 1,317,906 4,521,454 2,386,015 - 10,928,193
Total 29,255,000 127,522,058 49,764,964 43,656,212 7,820,676 258,018,910
Comprising of:
Cash margin 3,166,673 225,242 4,348,993 3,670,148 7,820,676 19,231,732
Letters of guarantee - - 70,900 - - 70,900
Real estate 13,183,226 127,296,816 35,647,024 36,600,180 - 212,727,246
Traded equities 7,206,370 - 6,833,233 1,844,300 - 15,883,903
Vehicles and machinery 5,698,731 - 2,864,814 1,541,584 - 10,105,129
Total 29,255,000 127,522,058 49,764,964 43,656,212 7,820,676 258,018,910
2010-
Collaterals
Low risk 2,782,835 335,693 8,956,360 4,300,478 10,480,580 26,855,946
Acceptable risk 20,483,270 110,905,327 28,681,691 33,607,451 - 193,677,739
Watch list 350,357 1,446,041 13,075,293 812,668 - 15,684,359
Non performing:
Substandard - 340,998 - 365,964 - 706,962
Doubtful - 606,275 115,878 848,079 - 1,570,232
Loss 2,731,664 962,220 5,433,845 1,051,230 - 10,178,959
Total 26,348,126 114,596,554 56,263,067 40,985,870 10,480,580 248,674,197
Comprising of:
Cash margin 2,795,355 448,506 8,956,360 4,305,006 10,480,580 26,985,807
Letters of guarantee - - - 372,453 - 372,453
Real estate 11,099,149 114,148,048 39,101,372 33,443,519 - 197,792,088
Traded equities 7,823,743 - 5,814,772 1,627,299 - 15,265,814
Vehicles and machinery 4,629,879 - 2,390,563 1,237,593 - 8,258,035
Total 26,348,126 114,596,554 56,263,067 40,985,870 10,480,580 248,674,197
Consolidated Financial Statement

102
Rescheduled Debts
Rescheduled debts are debts that have been previously classified as non-performing credit facilities, then excluded from the non-performing credit facilities as a result of a rescheduling process, and then classified as watch list. Rescheduled debt totalled JD 4,189,239 as of 31 December 2011, compared to JD 12,949,800 as of 31 December 2010.
The balance of the debt rescheduling where scheduled are still classified under watch list or converted to performing.
Restructured Debts
Restructuring process refers to reorganizing the credit facilities’ standing with respect to adjusting premiums, extending the life of the credit facilities, postponing some premiums or extending the grace period etc, and then classifying such facilities as watch list. Reconstructed debts totalled JD 6,042,263 as of 31 December 2011, compared to JD 2,018,577 as of 31 December, 2010.
3) Bonds and Treasury Bills:
The table below shows the classifications of bonds and treasury bills and their grading according to external rating agencies:
Risk Rating Class External rating agencyIncluded in financial assets at amortized cost
JD
AA S&P 2,305,080
A+ S&P 3,534,410
A S&P 9,371,528
A- S&P 706,746
BBB S&P 3,545,000
Non-rated 45,907,148
Governmental 374,968,414
Total 440,338,326
Consolidated Financial Statement

103
4) The Bank’s financial assets, before taking into account any collateral held or other credit enhancements can be analyzed by the following geographical regions:
2011Inside Jordan
Other Middle Eastern countries
Europe Asia* Americas Other Total
JD JD JD JD JD JD JD
Balances at Central Banks 36,704,934 54,144,364 - - - - 90,849,298
Balances at banks and financial institutions 144,636,886 83,791,990 41,744,827 69,270 16,870,818 17,179 287,130,970
Deposits at banks and financial institutions - 3,500,000 - - - - 3,500,000
Consumer lending 433,521,660 51,743,713 - - - - 485,265,373
Residential mortgages 112,010,928 11,369,744 - - - - 123,380,672
Corporate lending:
Large corporations 135,720,270 51,133,395 - - - - 186,853,665
Small and medium enterprises 33,894,257 13,509,828 - - - - 47,404,085
Lending to governmental sectors 62,356,111 42,330,087 - - - - 104,686,198
Bonds and treasury bills within:
Financial assets at amortized cost 413,742,235 14,923,116 11,672,975 - - - 440,338,326
Other assets 15,830,715 1,879,770 1,109,752 117 28,337 29 18,848,720
Total 2011 1,388,417,996 328,326,007 54,527,554 69,387 16,899,155 17,208 1,788,257,307
Total 2010 1,278,494,585 333,527,546 42,226,427 37,626 29,154,752 15,226 1,683,456,162
5) An industry sector analysis of the Bank’s financial assets, before and after taking into account collateral held or other credit enhancements, is as follows:
2011Financial Industrial Commercial Real estate* Agriculture Trading Consumer
Public and government
Total
JD JD JD JD JD JD JD JD JD
Balances at Central Banks - - - - - - - 90,849,298 90,849,298
Balances at banks and financial institutions 287,130,970 - - - - - - - 287,130,970
Deposits at banks and financial institutions 3,500,000 - - - - - - - 3,500,000
Direct credit facilities - 46,441,702 160,435,395 144,643,891 3,117,434 7,890,082 480,375,291 104,686,198 947,589,993
Bonds and treasury bills within:
Financial assets at amortized cost 39,207,458 15,168,865 8,872,849 - - - - 377,089,154 440,338,326
Other assets 1,855,311 2,542,357 5,962,547 344,696 136,426 - 2,704,368 5,303,015 18,848,720
Total 2011 331,693,739 64,152,924 175,270,791 144,988,587 3,253,860 7,890,082 483,079,659 577,927,665 1,788,257,307
Total 2010 363,376,532 21,376,252 198,306,757 150,092,197 2,941,082 5,751,043 401,335,506 540,276,793 1,683,456,162
*Real estate sector includes loans granted to corporate and mortgage loans.
Consolidated Financial Statement

104
Market Risk
Market risk is the risk resulting from fluctuations in the fair value or cash flows of financial instruments caused by the change in market prices such as interest rates and exchange rates and equity prices. Market risk arises due to the existence of open positions in interest rates, currencies and equity investments. Such risks are controlled in accordance to a specific set of policies and procedures and through specialized committees and related departments. Market risk includes interest rates risk, foreign exchange risks and the risk of change in equity prices.Market risk is measured and controlled through several methods, including sensitivity analysis and stress testing in addition to stop loss limits.
Interest Rate Risk
Interest rate risk results from the possible impact of changes in interest rates on the profits of the Bank or the value of financial instruments. The Bank is exposed to interest rate risk due to re-pricing mismatches between its interest rate’s sensitive assets and liabilities according to the different maturities and re-pricing terms. The Bank manages these risks through the continuous review of interest rates on its assets and liabilities in the course of its risk management strategy.
The ALM Committee reviews the sensitivity gaps of interest rates during its regular meetings and studies its effect on the Bank’s profitability in the light of any expected changes in market interest rates.
The Bank seeks to obtain long-term financing to fund long-term investments at fixed rates whenever possible. Furthermore, the Bank uses hedging instruments such as interest rate swaps to reduce any negative effects.
The following table demonstrates the sensitivity analysis of interest rates.
CurrencyIncrease in interest rate Sensitivity of net interest income Decrease in interest rate Sensitivity of net interest income
Basis points JD Basis points JD
2011-
USD 100 (426,593) 100 426,593
EURO 100 64,285 100 (64,285)
GBP 100 5,944 100 (5,944)
YEN 100 34,547 100 (34,547)
Other Currency 100 28,307 100 (28,307)
2010-
USD 100 57,234 100 (57,234)
EURO 100 (32,502) 100 32,502
GBP 100 (20,865) 100 20,865
YEN 100 8,878 100 (8,878)
Other Currency 100 33,548 100 (33,548)
Consolidated Financial Statement

105
Sensitivity of interest rates as of 31 December 2011:
Less than 1 month
1 – 3 months 3 – 6 months 6 – 12 months 1 – 3 years 3 or more yearsNon-interest
bearingTotal
JD JD JD JD JD JD JD JD
2011-
Assets
Cash and balances at Central Banks 15,144,500 - - - - - 116,742,599 131,887,099
Balances at banks and financial institutions 149,787,718 116,148,716 - - - - 21,194,536 287,130,970
Deposits at banks and financial institutions - - 3,500,000 - - - - 3,500,000
Financial assets at fair value through profit or loss - - - - - - 24,640,456 24,640,456
Direct credit facilities 689,623,822 16,668,145 70,445,374 20,916,691 50,576,275 99,359,686 - 947,589,993
Financial assets at fair value through OCI - - - - - - 25,910,213 25,910,213
Financial assets at amortized cost 39,206,005 15,207,385 44,046,068 116,393,240 198,767,185 26,718,443 - 440,338,326
Property and equipment - - - - - - 36,455,613 36,455,613
Intangible assets - - - - - - 6,213,805 6,213,805
Other assets - - - - - - 36,696,786 36,696,786
Total Assets 893,762,045 148,024,246 117,991,442 137,309,931 249,343,460 126,078,129 267,854,008 1,940,363,261
Liabilities
Banks and financial institution deposits 149,563,745 - - - 7,000,000 - 13,564,726 170,128,471
Customers’ deposits 528,023,147 137,655,962 55,470,126 31,763,852 92,442,231 - 529,779,047 1,375,134,365
Margin accounts 3,621,283 1,598,948 6,240,200 5,476,092 5,039,865 6,403,498 19,043,226 47,423,112
Loans and borrowings 2,715,340 32,679 4,049,134 4,099,148 15,877,923 35,450,000 - 62,224,224
Sundry provisions - - - - - - 11,803,397 11,803,397
Income tax liabilities - - - - - - 22,621,983 22,621,983
Deferred tax - - - - - - 2,270,355 2,270,355
Other liabilities - - - - - - 25,187,001 25,187,001
Total Liabilities 683,923,515 139,287,589 65,759,460 41,339,092 120,360,019 41,853,498 624,269,735 1,716,792,908
Interest rate sensitivity gap 209,838,530 8,736,657 52,231,982 95,970,839 128,983,441 84,224,631 (356,415,727) 223,570,353
2010-
Total Assets 802,441,319 115,306,161 143,035,840 109,424,500 317,060,989 93,597,256 262,579,115 1,843,445,180
Total Liabilities 607,070,970 187,352,921 41,636,590 44,583,991 82,059,194 41,575,144 633,240,109 1,637,518,919
Interest rate sensitivity gap 195,370,349 (72,046,760) 101,399,250 64,840,509 235,001,795 52,022,112 (370,660,994) 205,926,261
Currency Risk
Foreign currency risk is the risk of change in value of financial instruments due to the change in the foreign currency prices. The Bank’s functional currency is the Jordanian Dinar. The Board of Directors identify the set of currencies in which it is acceptable to take positions in and the limits of these positions for each currency. Foreign currencies positions are monitored on a daily basis to make sure that the Bank will not exceed those acceptable levels.
Consolidated Financial Statement
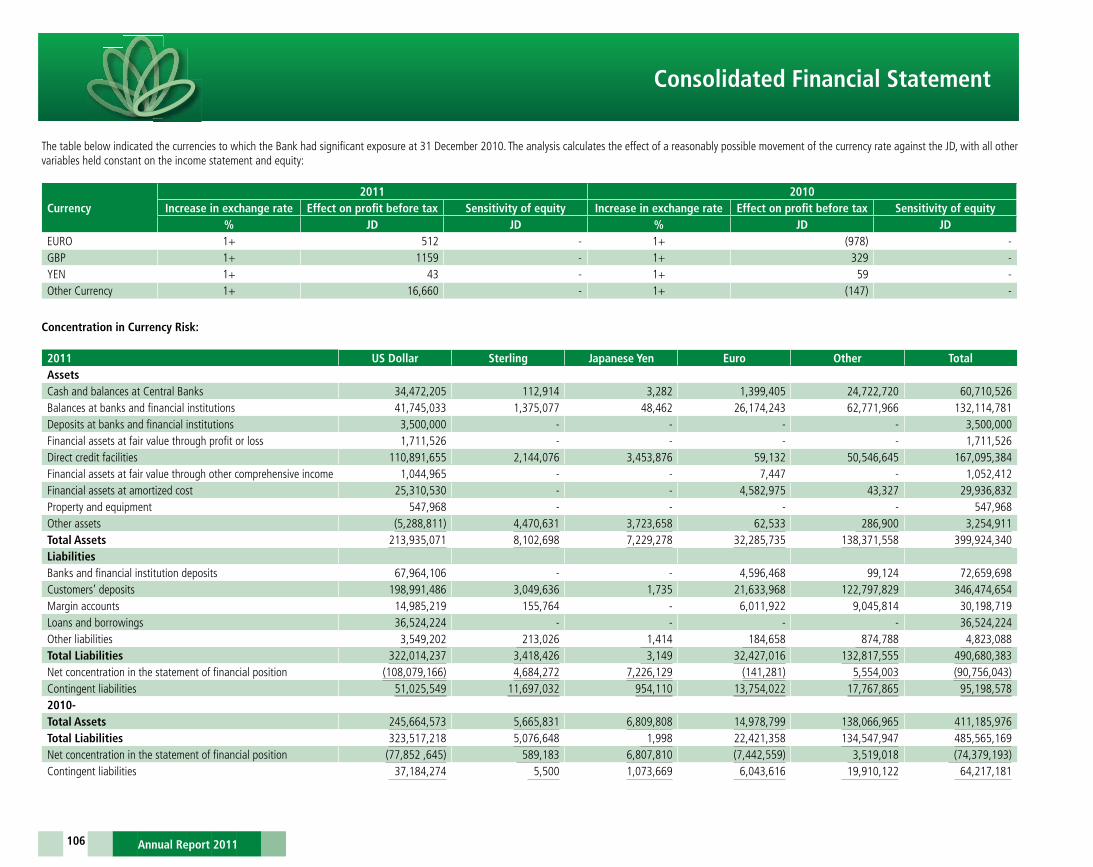
106
The table below indicated the currencies to which the Bank had significant exposure at 31 December 2010. The analysis calculates the effect of a reasonably possible movement of the currency rate against the JD, with all other variables held constant on the income statement and equity:
Currency2011 2010
Increase in exchange rate Effect on profit before tax Sensitivity of equity Increase in exchange rate Effect on profit before tax Sensitivity of equity% JD JD % JD JD
EURO 1+ 512 - 1+ (978) -GBP 1+ 1159 - 1+ 329 -YEN 1+ 43 - 1+ 59 -Other Currency 1+ 16,660 - 1+ (147) -
Concentration in Currency Risk:
2011 US Dollar Sterling Japanese Yen Euro Other TotalAssetsCash and balances at Central Banks 34,472,205 112,914 3,282 1,399,405 24,722,720 60,710,526Balances at banks and financial institutions 41,745,033 1,375,077 48,462 26,174,243 62,771,966 132,114,781Deposits at banks and financial institutions 3,500,000 - - - - 3,500,000Financial assets at fair value through profit or loss 1,711,526 - - - - 1,711,526Direct credit facilities 110,891,655 2,144,076 3,453,876 59,132 50,546,645 167,095,384Financial assets at fair value through other comprehensive income 1,044,965 - - 7,447 - 1,052,412Financial assets at amortized cost 25,310,530 - - 4,582,975 43,327 29,936,832Property and equipment 547,968 - - - - 547,968Other assets (5,288,811) 4,470,631 3,723,658 62,533 286,900 3,254,911Total Assets 213,935,071 8,102,698 7,229,278 32,285,735 138,371,558 399,924,340LiabilitiesBanks and financial institution deposits 67,964,106 - - 4,596,468 99,124 72,659,698Customers’ deposits 198,991,486 3,049,636 1,735 21,633,968 122,797,829 346,474,654Margin accounts 14,985,219 155,764 - 6,011,922 9,045,814 30,198,719Loans and borrowings 36,524,224 - - - - 36,524,224Other liabilities 3,549,202 213,026 1,414 184,658 874,788 4,823,088Total Liabilities 322,014,237 3,418,426 3,149 32,427,016 132,817,555 490,680,383Net concentration in the statement of financial position (108,079,166) 4,684,272 7,226,129 (141,281) 5,554,003 (90,756,043)Contingent liabilities 51,025,549 11,697,032 954,110 13,754,022 17,767,865 95,198,5782010-Total Assets 245,664,573 5,665,831 6,809,808 14,978,799 138,066,965 411,185,976Total Liabilities 323,517,218 5,076,648 1,998 22,421,358 134,547,947 485,565,169Net concentration in the statement of financial position (77,852 ,645) 589,183 6,807,810 (7,442,559) 3,519,018 (74,379,193)Contingent liabilities 37,184,274 5,500 1,073,669 6,043,616 19,910,122 64,217,181
Consolidated Financial Statement
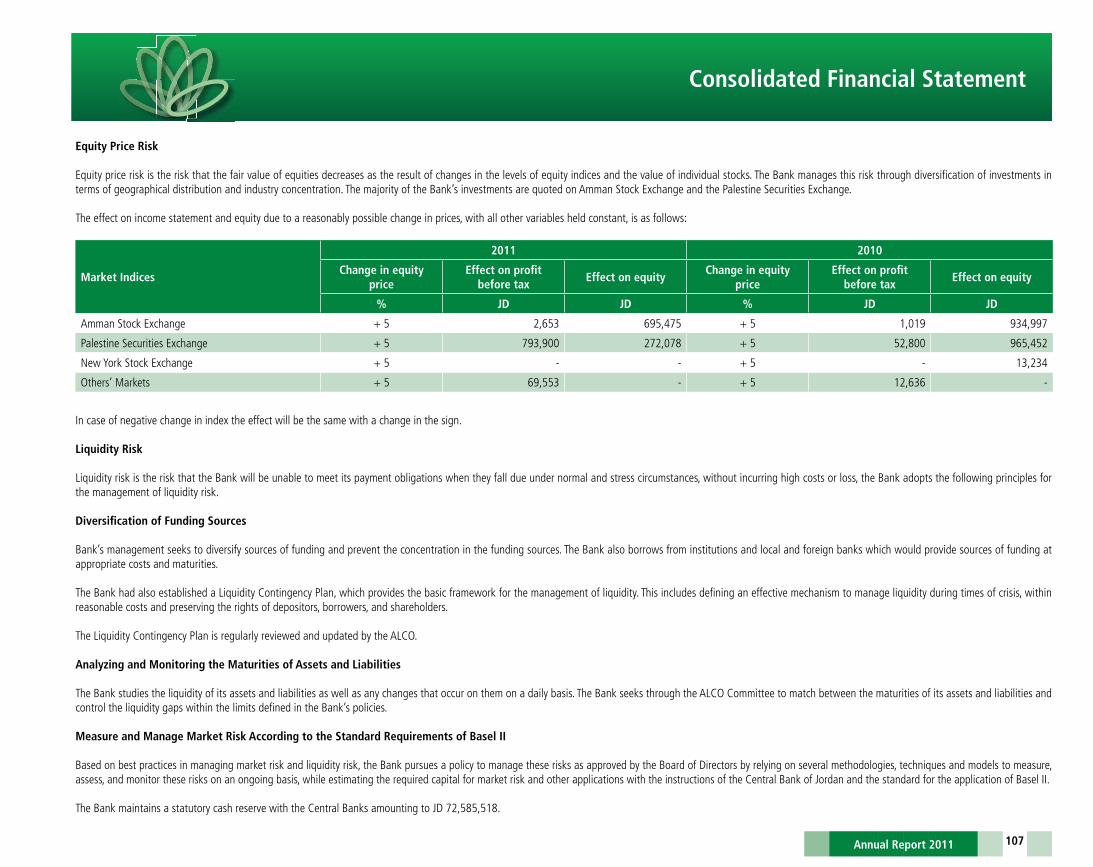
107
Equity Price Risk
Equity price risk is the risk that the fair value of equities decreases as the result of changes in the levels of equity indices and the value of individual stocks. The Bank manages this risk through diversification of investments in terms of geographical distribution and industry concentration. The majority of the Bank’s investments are quoted on Amman Stock Exchange and the Palestine Securities Exchange.
The effect on income statement and equity due to a reasonably possible change in prices, with all other variables held constant, is as follows:
Market Indices
2011 2010
Change in equity price
Effect on profit before tax
Effect on equityChange in equity
priceEffect on profit
before taxEffect on equity
% JD JD % JD JD
Amman Stock Exchange + 5 2,653 695,475 + 5 1,019 934,997
Palestine Securities Exchange + 5 793,900 272,078 + 5 52,800 965,452
New York Stock Exchange + 5 - - + 5 - 13,234
Others’ Markets + 5 69,553 - + 5 12,636 -
In case of negative change in index the effect will be the same with a change in the sign.
Liquidity Risk
Liquidity risk is the risk that the Bank will be unable to meet its payment obligations when they fall due under normal and stress circumstances, without incurring high costs or loss, the Bank adopts the following principles for the management of liquidity risk.
Diversification of Funding Sources Bank’s management seeks to diversify sources of funding and prevent the concentration in the funding sources. The Bank also borrows from institutions and local and foreign banks which would provide sources of funding at appropriate costs and maturities.
The Bank had also established a Liquidity Contingency Plan, which provides the basic framework for the management of liquidity. This includes defining an effective mechanism to manage liquidity during times of crisis, within reasonable costs and preserving the rights of depositors, borrowers, and shareholders.
The Liquidity Contingency Plan is regularly reviewed and updated by the ALCO.
Analyzing and Monitoring the Maturities of Assets and Liabilities
The Bank studies the liquidity of its assets and liabilities as well as any changes that occur on them on a daily basis. The Bank seeks through the ALCO Committee to match between the maturities of its assets and liabilities and control the liquidity gaps within the limits defined in the Bank’s policies.
Measure and Manage Market Risk According to the Standard Requirements of Basel II
Based on best practices in managing market risk and liquidity risk, the Bank pursues a policy to manage these risks as approved by the Board of Directors by relying on several methodologies, techniques and models to measure, assess, and monitor these risks on an ongoing basis, while estimating the required capital for market risk and other applications with the instructions of the Central Bank of Jordan and the standard for the application of Basel II.
The Bank maintains a statutory cash reserve with the Central Banks amounting to JD 72,585,518.
Consolidated Financial Statement
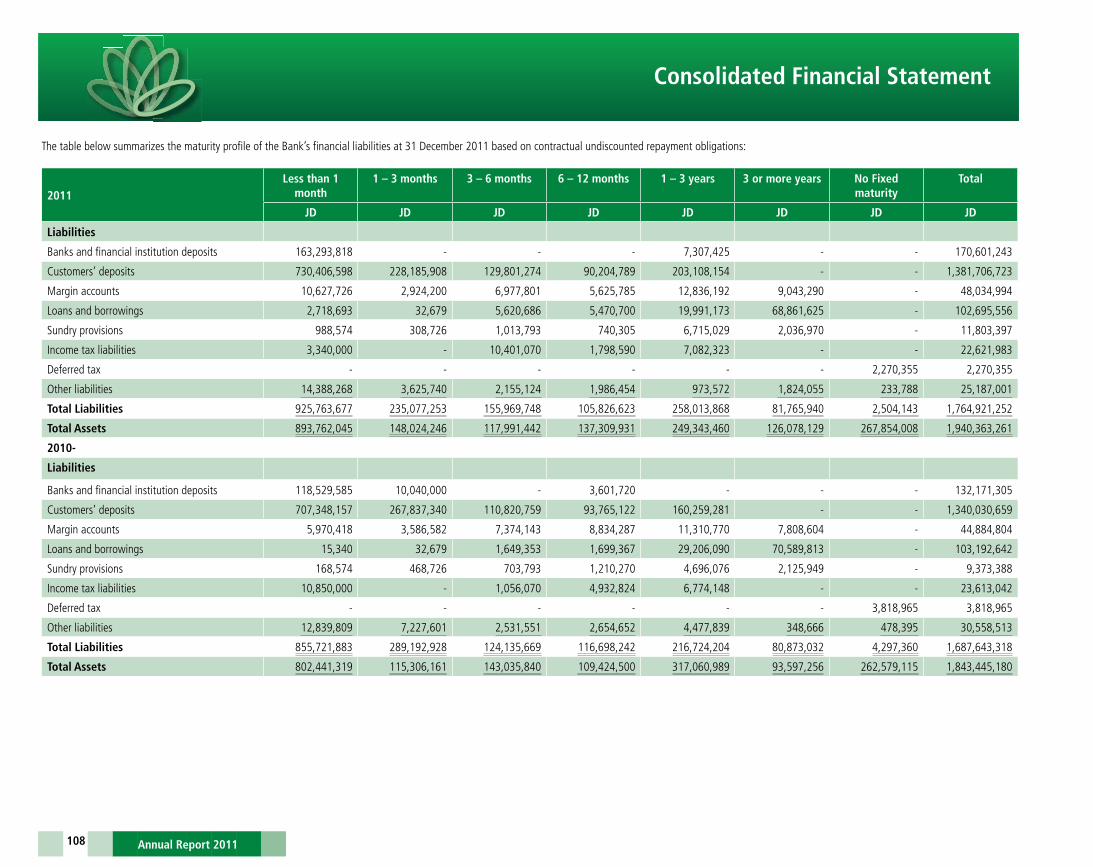
108
The table below summarizes the maturity profile of the Bank’s financial liabilities at 31 December 2011 based on contractual undiscounted repayment obligations:
2011Less than 1
month1 – 3 months 3 – 6 months 6 – 12 months 1 – 3 years 3 or more years No Fixed
maturityTotal
JD JD JD JD JD JD JD JD
Liabilities
Banks and financial institution deposits 163,293,818 - - - 7,307,425 - - 170,601,243
Customers’ deposits 730,406,598 228,185,908 129,801,274 90,204,789 203,108,154 - - 1,381,706,723
Margin accounts 10,627,726 2,924,200 6,977,801 5,625,785 12,836,192 9,043,290 - 48,034,994
Loans and borrowings 2,718,693 32,679 5,620,686 5,470,700 19,991,173 68,861,625 - 102,695,556
Sundry provisions 988,574 308,726 1,013,793 740,305 6,715,029 2,036,970 - 11,803,397
Income tax liabilities 3,340,000 - 10,401,070 1,798,590 7,082,323 - - 22,621,983
Deferred tax - - - - - - 2,270,355 2,270,355
Other liabilities 14,388,268 3,625,740 2,155,124 1,986,454 973,572 1,824,055 233,788 25,187,001
Total Liabilities 925,763,677 235,077,253 155,969,748 105,826,623 258,013,868 81,765,940 2,504,143 1,764,921,252
Total Assets 893,762,045 148,024,246 117,991,442 137,309,931 249,343,460 126,078,129 267,854,008 1,940,363,261
2010-
Liabilities
Banks and financial institution deposits 118,529,585 10,040,000 - 3,601,720 - - - 132,171,305
Customers’ deposits 707,348,157 267,837,340 110,820,759 93,765,122 160,259,281 - - 1,340,030,659
Margin accounts 5,970,418 3,586,582 7,374,143 8,834,287 11,310,770 7,808,604 - 44,884,804
Loans and borrowings 15,340 32,679 1,649,353 1,699,367 29,206,090 70,589,813 - 103,192,642
Sundry provisions 168,574 468,726 703,793 1,210,270 4,696,076 2,125,949 - 9,373,388
Income tax liabilities 10,850,000 - 1,056,070 4,932,824 6,774,148 - - 23,613,042
Deferred tax - - - - - - 3,818,965 3,818,965
Other liabilities 12,839,809 7,227,601 2,531,551 2,654,652 4,477,839 348,666 478,395 30,558,513
Total Liabilities 855,721,883 289,192,928 124,135,669 116,698,242 216,724,204 80,873,032 4,297,360 1,687,643,318
Total Assets 802,441,319 115,306,161 143,035,840 109,424,500 317,060,989 93,597,256 262,579,115 1,843,445,180
Consolidated Financial Statement
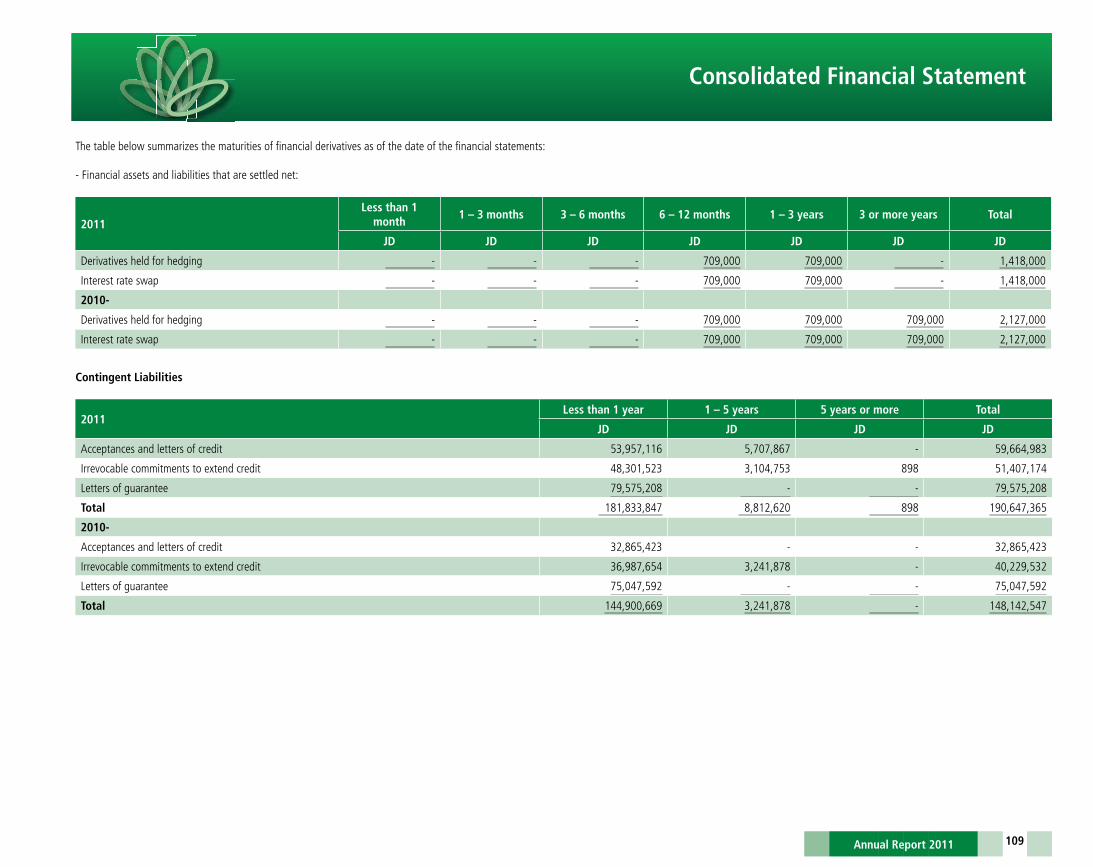
109
The table below summarizes the maturities of financial derivatives as of the date of the financial statements:
- Financial assets and liabilities that are settled net:
2011Less than 1
month1 – 3 months 3 – 6 months 6 – 12 months 1 – 3 years 3 or more years Total
JD JD JD JD JD JD JD
Derivatives held for hedging - - - 709,000 709,000 - 1,418,000
Interest rate swap - - - 709,000 709,000 - 1,418,000
2010-
Derivatives held for hedging - - - 709,000 709,000 709,000 2,127,000
Interest rate swap - - - 709,000 709,000 709,000 2,127,000
Contingent Liabilities
2011Less than 1 year 1 – 5 years 5 years or more Total
JD JD JD JD
Acceptances and letters of credit 53,957,116 5,707,867 - 59,664,983
Irrevocable commitments to extend credit 48,301,523 3,104,753 898 51,407,174
Letters of guarantee 79,575,208 - - 79,575,208
Total 181,833,847 8,812,620 898 190,647,365
2010-
Acceptances and letters of credit 32,865,423 - - 32,865,423
Irrevocable commitments to extend credit 36,987,654 3,241,878 - 40,229,532
Letters of guarantee 75,047,592 - - 75,047,592
Total 144,900,669 3,241,878 - 148,142,547
Consolidated Financial Statement

110
Operational Risk
Operational risk is the risk of loss arising from system failure, human resources, fraud, or external events.
The general framework for the operational risk management is as follows:
• Managing operational risk is the responsibility of all employees in the Bank through the proper application of policies and procedures that would curb these risks and exposures that arise during daily operations. A special department was established since 2005 to facilitate and support all departments of the Bank to carry out their duties in managing those risks.
• Because of the constant change in the environment of work as a result of the willingness of the Bank management to keep pace with technology and new banking products and services, the Bank has adopted and implemented several procedures to help the different departments identifying, measuring, following-up and controlling operating risks that arise from the introduction of new products and services.
• An operational risk policy was developed to cover all the Bank’s departments, branches and subsidiaries which includes risk appetite thresholds and risk limits.• Defining the general operational risk management framework of risk management, including defining the roles and responsibilities of all: the Board of Directors, the Risk Committee, senior management, directors of
departments, Risk Management and Audit.
Implementing operational risk measurement techniques that aim at identifying risks to the Bank and evaluating them in terms of the magnitude of the impact and frequency of occurrence, in order to take appropriate action that would mitigate these risks through the implementation of the Control and Self Assessment System (CRSA), as well as data collection and review of actual and potential losses resulting from operations.
Compliance Risk
Compliance risk is the risk of legal sanctions or financial losses or reputational risk that the Bank might be exposed to as a result of non-compliance with laws, regulations, instructions, rules or standards of conduct and banking practices issued by the regulatory authorities of local and international authorities.
According to the Central Bank of Jordan and in line with the trends and global developments and instructions of Basel, in order to ensure compliance with the Bank and the domestic policies of all laws, regulations, instructions and rules of conduct, standards and banking practices issued by the regulatory authorities of local and international authorities have been issuing policy compliance and Anti-money Laundering procedures approved by the Board of Directors, as been restructured by management compliance and Anti-money Laundering development cycle control compliance function to monitor the Bank compliance with of the laws, regulations and instructions issued by the regulatory authorities Best Practices and industry standards through work programs and procedures based on the principles of control risk “Risk Based Approach”, one of the main objectives of the Department:
• Identify, assess, and manage the risks of non-compliance.• The classification and the availability of the laws and regulations that govern the nature of the department management and activities of various departments within the Bank’s internal database and constantly update it with
any legal or regulatory developments to help the executive management of the Bank manage the risk and comply with it.• Provide advice and guidance to the Bank’s management with regard to compliance with the laws and regulations.• Monitor the risks of non-compliance through a database containing all the laws and instructions issued by the regulatory and official domestic and international authorities to the Bank and adjusted according to the latest
regulatory and legislative developments to be complied with.• Reporting on the extent and level of compliance of the Bank and its branches directly to the Audit and Compliance Committees arising from the Board of Directors.• Review and evaluate all products polices, internal procedures, and their compliance with the laws and regulations mentioned above.
With regard to combating money laundering were also the development and restructuring of the Department of combating money laundering independently within the management of Compliance and Anti-money Laundering and supplying them with human cadres of qualified and trained and automated systems operating according to policies and operating procedures approved by the Board of Directors and the Money Laundering Act No. 46 of 2007, as amended, and Best Practices International in this regard to reduce the risk of these operations carrying out their tasks through four operational units:
• KYC unit of customer identification and verification for the duration of banking relations with the client.• Unit control and audit functions and review the financial transactions of the executing agents and non-bank customers• Investigation unit and notification functions which receive reports of suspected departments and branches of the clients, and then reviewed and analyzed to make the right decision about it.• Western Union unit and control functions of the financial operations carried out by agents and sub-branches of the Bank.
Consolidated Financial Statement

111
(48) Segment Information
For management purposes the Bank is organized into three major business segments in accordance with the reports sent to the chief operating decision maker:
Retail Banking: Principally handling individual customers’ deposits, and providing consumer type loans, overdrafts, credit cards facilities and funds transfer facilities
Corporate Banking: Principally handling loans and other credit facilities and deposit and current accounts for corporate and institutional customers
Treasury: Principally providing money market, trading and treasury services, as well as the management of the Bank’s funding operations by use of treasury bills, government securities and placements and acceptances with other banks, through treasury and wholesale banking
Following is the Bank’s segment information:
2011Retail Banking Corporate Banking Treasury Other
Total
2011 2010
JD JD JD JD JD JD
Total revenues 79,175,364 26,223,478 39,655,482 833,065 145,887,389 135,413,089
Impairment loss on credit facilities (5,253,044) 6,960,117 - - 1,707,073 2,179,439
Impairment loss on financial assets at amortized cost - - 141,800 - 141,800 -
Impairment loss available for sale investment - - - - - 1,035,437
Segmental results 64,761,921 15,763,329 32,010,264 833,065 113,368,579 101,613,605
Unallocated expenses 62,443,984 54,492,494
Profit before tax 50,924,595 47,121,111
Income tax 14,328,181 12,372,275
Net profit 36,596,414 34,748,836
Other information
Segmental assets 605,952,108 341,637,884 913,407,064 79,366,205 1,940,363,261 1,843,445,180
Segmental liabilities 685,872,284 354,952,316 618,087,765 57,880,543 1,716,792,908 1,637,518,919
Capital expenditure 8,525,119 10,707,021
Depreciation and amortization 7,519,801 6,972,890
Consolidated Financial Statement
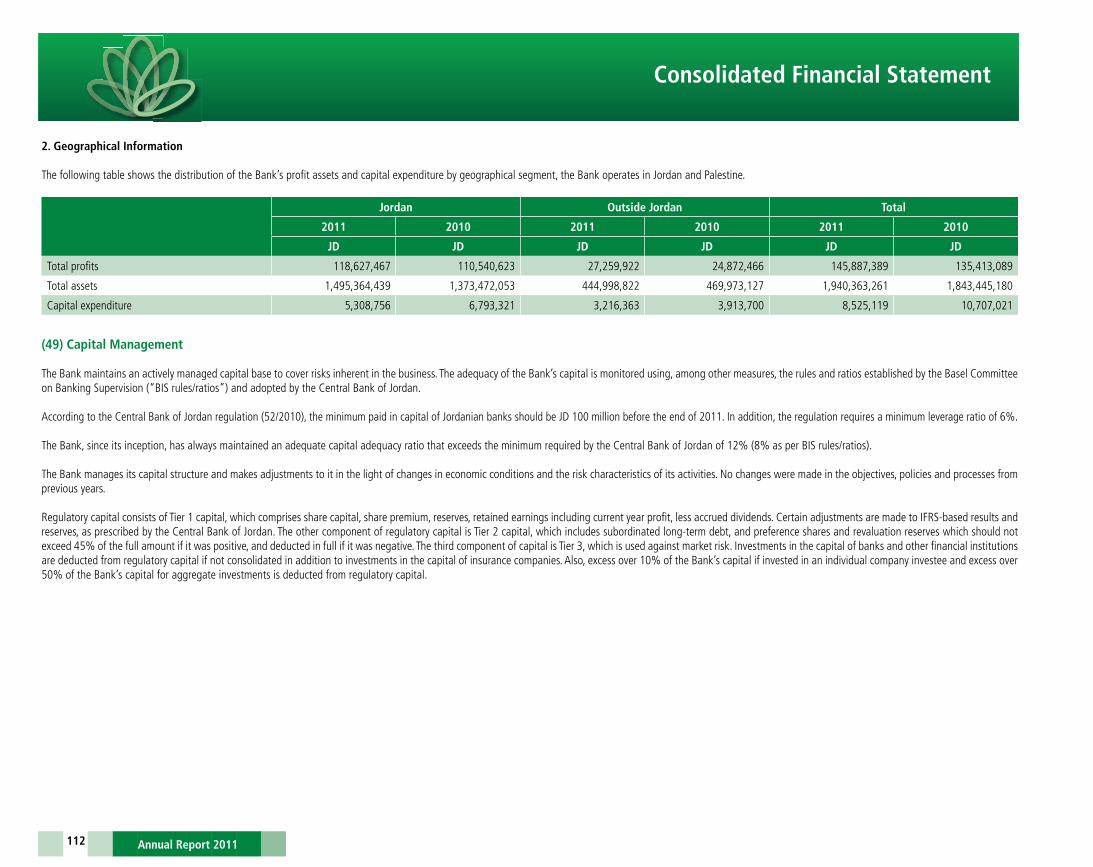
112
2. Geographical Information
The following table shows the distribution of the Bank’s profit assets and capital expenditure by geographical segment, the Bank operates in Jordan and Palestine.
Jordan Outside Jordan Total
2011 2010 2011 2010 2011 2010
JD JD JD JD JD JD
Total profits 118,627,467 110,540,623 27,259,922 24,872,466 145,887,389 135,413,089
Total assets 1,495,364,439 1,373,472,053 444,998,822 469,973,127 1,940,363,261 1,843,445,180
Capital expenditure 5,308,756 6,793,321 3,216,363 3,913,700 8,525,119 10,707,021
(49) Capital Management
The Bank maintains an actively managed capital base to cover risks inherent in the business. The adequacy of the Bank’s capital is monitored using, among other measures, the rules and ratios established by the Basel Committee on Banking Supervision (“BIS rules/ratios”) and adopted by the Central Bank of Jordan.
According to the Central Bank of Jordan regulation (52/2010), the minimum paid in capital of Jordanian banks should be JD 100 million before the end of 2011. In addition, the regulation requires a minimum leverage ratio of 6%.
The Bank, since its inception, has always maintained an adequate capital adequacy ratio that exceeds the minimum required by the Central Bank of Jordan of 12% (8% as per BIS rules/ratios).
The Bank manages its capital structure and makes adjustments to it in the light of changes in economic conditions and the risk characteristics of its activities. No changes were made in the objectives, policies and processes from previous years.
Regulatory capital consists of Tier 1 capital, which comprises share capital, share premium, reserves, retained earnings including current year profit, less accrued dividends. Certain adjustments are made to IFRS-based results and reserves, as prescribed by the Central Bank of Jordan. The other component of regulatory capital is Tier 2 capital, which includes subordinated long-term debt, and preference shares and revaluation reserves which should not exceed 45% of the full amount if it was positive, and deducted in full if it was negative. The third component of capital is Tier 3, which is used against market risk. Investments in the capital of banks and other financial institutions are deducted from regulatory capital if not consolidated in addition to investments in the capital of insurance companies. Also, excess over 10% of the Bank’s capital if invested in an individual company investee and excess over 50% of the Bank’s capital for aggregate investments is deducted from regulatory capital.
Consolidated Financial Statement
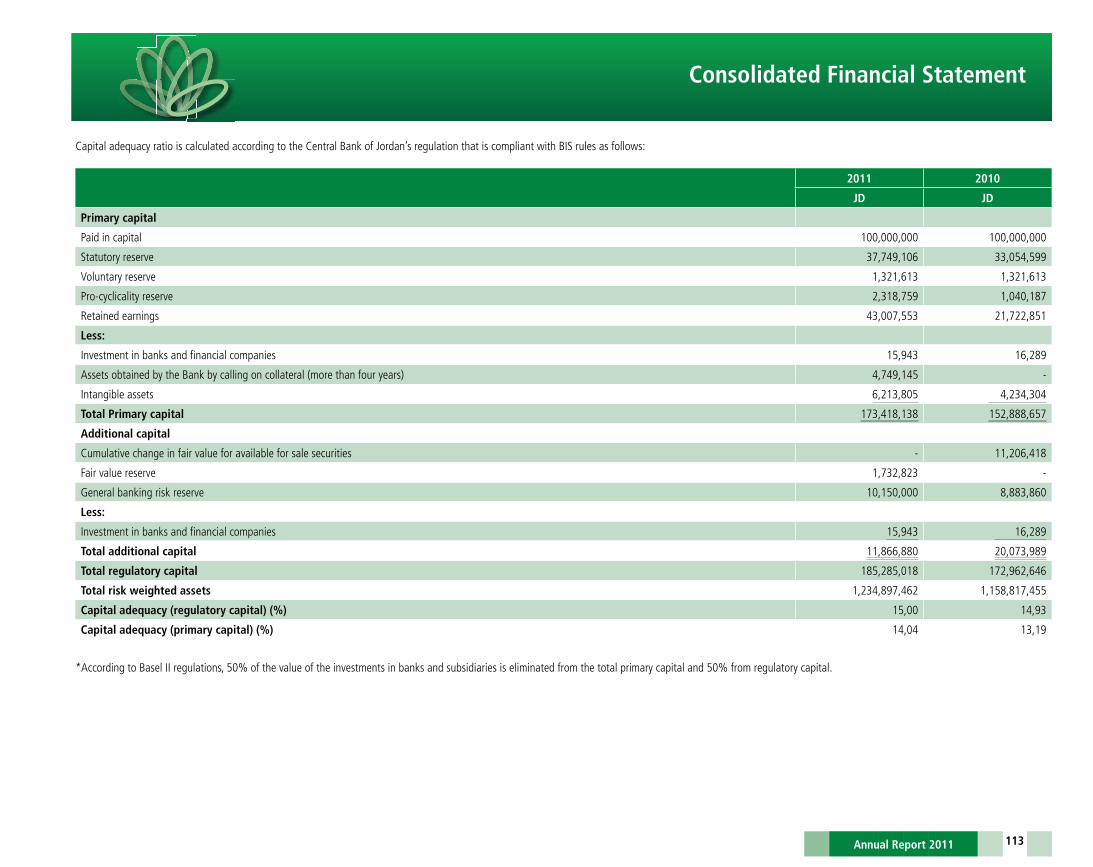
113
Capital adequacy ratio is calculated according to the Central Bank of Jordan’s regulation that is compliant with BIS rules as follows:
2011 2010
JD JD
Primary capital
Paid in capital 100,000,000 100,000,000
Statutory reserve 37,749,106 33,054,599
Voluntary reserve 1,321,613 1,321,613
Pro-cyclicality reserve 2,318,759 1,040,187
Retained earnings 43,007,553 21,722,851
Less:
Investment in banks and financial companies 15,943 16,289
Assets obtained by the Bank by calling on collateral (more than four years) 4,749,145 -
Intangible assets 6,213,805 4,234,304
Total Primary capital 173,418,138 152,888,657
Additional capital
Cumulative change in fair value for available for sale securities - 11,206,418
Fair value reserve 1,732,823 -
General banking risk reserve 10,150,000 8,883,860
Less:
Investment in banks and financial companies 15,943 16,289
Total additional capital 11,866,880 20,073,989
Total regulatory capital 185,285,018 172,962,646
Total risk weighted assets 1,234,897,462 1,158,817,455
Capital adequacy (regulatory capital) (%) 15,00 14,93
Capital adequacy (primary capital) (%) 14,04 13,19
*According to Basel II regulations, 50% of the value of the investments in banks and subsidiaries is eliminated from the total primary capital and 50% from regulatory capital.
Consolidated Financial Statement
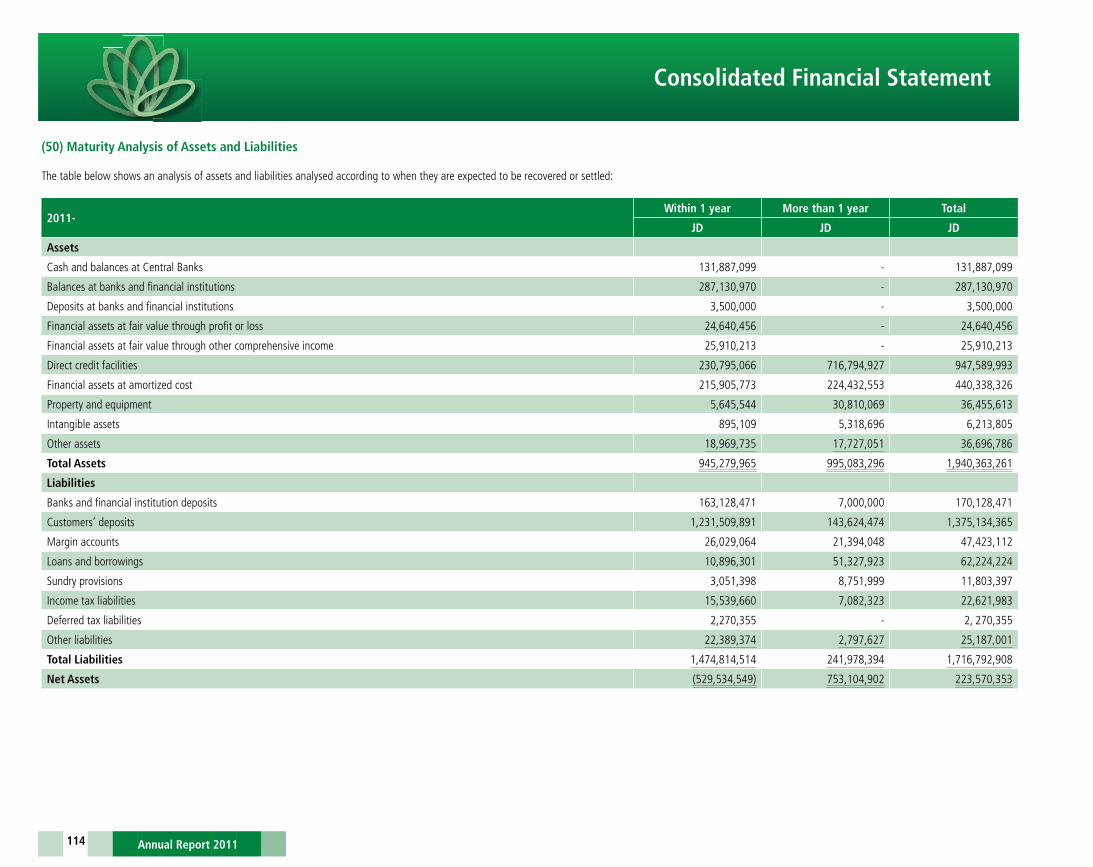
114
(50) Maturity Analysis of Assets and Liabilities
The table below shows an analysis of assets and liabilities analysed according to when they are expected to be recovered or settled:
2011-Within 1 year More than 1 year Total
JD JD JD
Assets
Cash and balances at Central Banks 131,887,099 - 131,887,099
Balances at banks and financial institutions 287,130,970 - 287,130,970
Deposits at banks and financial institutions 3,500,000 - 3,500,000
Financial assets at fair value through profit or loss 24,640,456 - 24,640,456
Financial assets at fair value through other comprehensive income 25,910,213 - 25,910,213
Direct credit facilities 230,795,066 716,794,927 947,589,993
Financial assets at amortized cost 215,905,773 224,432,553 440,338,326
Property and equipment 5,645,544 30,810,069 36,455,613
Intangible assets 895,109 5,318,696 6,213,805
Other assets 18,969,735 17,727,051 36,696,786
Total Assets 945,279,965 995,083,296 1,940,363,261
Liabilities
Banks and financial institution deposits 163,128,471 7,000,000 170,128,471
Customers’ deposits 1,231,509,891 143,624,474 1,375,134,365
Margin accounts 26,029,064 21,394,048 47,423,112
Loans and borrowings 10,896,301 51,327,923 62,224,224
Sundry provisions 3,051,398 8,751,999 11,803,397
Income tax liabilities 15,539,660 7,082,323 22,621,983
Deferred tax liabilities 2,270,355 - 2, 270,355
Other liabilities 22,389,374 2,797,627 25,187,001
Total Liabilities 1,474,814,514 241,978,394 1,716,792,908
Net Assets (529,534,549) 753,104,902 223,570,353
Consolidated Financial Statement

115
2010-Within 1 year More than 1 year Total
JD JD JD
Assets
Cash and balances at Central Banks 202,432,941 - 202,432,941
Balances at banks and financial institutions 187,368,937 - 187,368,937
Deposits at banks and financial institutions 124,174,750 - 124,174,750
Financial assets held for trading 1,329,095 - 1,329,095
Direct credit facilities 222,726,640 600,377,965 823,104,605
Financial assets available for sale 51,599,477 39,449,440 91,048,917
Financial assets held to maturity 29,297,869 298,893,956 328,191,825
Property and equipment 5,808,784 31,726,872 37,535,656
Intangible assets 1,209,084 3,025,220 4,234,304
Other assets 25,055,151 18,968,999 44,024,150
Total Assets 851,002,728 992,442,452 1,843,445,180
Liabilities
Banks and financial institution deposits 131,939,779 - 131,939,779
Customers’ deposits 1,235,558,808 100,290,564 1,335,849,372
Margin accounts 25,680,923 18,860,713 44,541,636
Loans and borrowings 196,301 59,327,923 59,524,224
Sundry provisions 2,551,363 6,822,025 9,373,388
Income tax liabilities 15,138,894 6,774,148 21,913,042
Deferred tax liabilities 3,818,965 - 3,818,965
Other liabilities 25,732,008 4,826,505 30,558,513
Total Liabilities 1,440,617,041 196,901,878 1,637,518,919
Net Assets (589,614,313) 795,540,574 205,926,261
(51) Fiduciary Accounts
Fiduciary accounts amounted to JD 2,547,196 as of 31 December 2011 (2010: JD 3,333,893). Such assets or liabilities are not included in the Bank’s statement of financial position.
Consolidated Financial Statement

116
(52) Contingent Liabilities and Commitments
a) The total outstanding commitments and contingent liabilities are as follows:
2011 2010
JD JD
Letters of credit:
Issued 55,382,633 30,994,924
Received 114,135,834 143,389,788
Acceptances 4,282,350 1,870,499
Letters of guarantee:
Payments 16,682,141 10,561,611
Performance 11,502,952 15,021,671
Other 23,222,081 14,646,250
Irrevocable commitments to extend credit 79,575,208 75,047,592
304,783,199 291,532,335
b) The contractual commitments of the Bank are as follows:
2011 2010
JD JD
Contracts to purchase property and equipment 1,951,911 2,770,981
1,951,911 2,770,981
Annual rent of the Bank’s main building and the branches amounted to JD 2,856,369 as of 31 December 2011 (2010: JD 2,458,492).
(53) Lawsuits
In the normal course of business, the Bank appears as a defendant in a number of lawsuits amounting to approximately JD 38,330,746 as of 31 December 2011 (2010: JD 23,957,920).
Provision for possible legal obligations amounted to JD 5,394,378 as of 31 December 2011 (2010: JD 2,713,562).
In the opinion of the Bank’s management and legal counsel, the Bank maintains adequate provisions against the lawsuits.
Consolidated Financial Statement

117
(54) Effect of Implementation of IFRS 9
The Bank and its subsidiaries have early adopted IFRS starting 1 January 2011 and the result as follows:
A. Reclassification of financial assets to equity and liability instruments:
Measurement Book value
DifferenceIAS 39 IFRS9 IAS 39 IFRS9
JD JD JD JD
Financial assets
Governmental treasury bills Held to maturity Amortized cost 256,838,152 256,838,152 -
Government bonds Held to maturity Amortized cost 52,674,179 52,674,179 -
Government bonds Available for sale Amortized cost 1,698,551 1,738,443 39,892
Corporate bonds Held to maturity Amortized cost 18,679,494 18,679,494 -
Corporate bonds Available for sale Amortized cost 35,382,828 34,031,374 (1,351,454)
Other bonds Available for sale Amortized cost 2,459,221 1,906,443 (552,778)
Investment funds Available for sale Financial assets at fair value through profit or loss 1,954,763 1,954,763 -
Companies stocks Trading securities Financial assets at fair value through profit or loss 1,329,095 1,329,095 -
Companies stocks Available for sale Financial assets at fair value through profit or loss 21,711,018 21,771,018 -
Companies stocks Available for sale Financial assets at fair value through other comprehensive income 27,782,536 27,782,536 -
B. According to management’s plan of action, investment in companies’ shares previously classified as available for sale which have been valued at fair value, are now classified as strategic investments and not for trading purposes, within financial assets at fair value through other comprehensive income. Consequently, a total of JD 464,766 have been classified from the accumulated change in fair value account to retained earnings within consolidated shareholder’s equity as of 1 January 2011.
C. According to management’s plan of action, investment in companies’ shares previously classified as available for sale which have been valued at fair value, are now classified as investments purchased for intent of resale in the near future and to profit from changes in the short-term market prices or trading profit margins within financial assets at fair value through profit or loss. Consequently, a total of JD 16,205,419 has been reclassified from the accumulated change in fair value account to retained earnings.
D. The adoption of IFRS 9 had the following effect on the profit for the year ended 31 December 2011:- Decrease in profit by an amount of JD 207,359, which represents unrealized loss from revaluation of financial assets at fair value through profit or loss, which were previously classified as available for sale financial assets.- Decrease in profit by an amount of JD 429,926, which represents gain from sale of financial assets at fair value through other comprehensive income. The gain was recorded directly in retained earnings rather than in the
income statement.
E. The adoption of IFRS 9 resulted in the reduction of book values for financial assets compared to IAS 39. The decrease in book values amounted to JD 1,864,340 at 1 January 2011.
Consolidated Financial Statement

118
(55) New and Amended International Financial Reporting Standards
The following new and revised IFRS have been issued up to December 31, 2011. However, these IFRS were not affective and were not applied by the Bank:
IFRS (10) Consolidated Financial StatementsIFRS 10 replaces the portion of IAS 27 Consolidated and Separate Financial Statements that addresses the accounting for consolidated financial statements. It also includes the issues raised in SIC-12 Consolidation — Special Purpose Entities.IFRS 10 establishes a single control model that applies to all entities including special purpose entities. The changes introduced by IFRS 10 will require management to exercise significant judgement to determine which entities are controlled, and therefore, are required to be consolidated by a parent, compared with the requirements that were in IAS 27.
This standard becomes effective for annual periods beginning on or after 1 January 2013.
IFRS (11) Joint ArrangementsIFRS 11 replaces IAS 31 Interests in Joint Ventures and SIC-13 Jointly-controlled Entities — Non-monetary Contributions by Venturers.IFRS 11 removes the option to account for jointly controlled entities (JCEs) using proportionate consolidation. Instead, JCEs that meet the definition of a joint venture must be accounted for using the equity method. The application of this new standard will impact the financial position of the Bank. This is due to the cessation of proportionate consolidating the joint venture in to equity accounting for this investment - or - the new standard will have no impact on the Bank’s financial position of performance. This standard becomes effective for annual periods beginning on or after 1 January 2013.
IFRS (12) Disclosure of Involvement with Other EntitiesIFRS 12 includes all of the disclosures that were previously in IAS 27 related to consolidated financial statements, as well as all of the disclosures that were previously included in IAS 31 and IAS 28. These disclosures relate to an entity’s interests in subsidiaries, joint arrangements, associates and structured entities. A number of new disclosures are also required. This standard becomes effective for annual periods beginning on or after 1 January 2013.
IFRS (13) Fair Value MeasurementIFRS 13 establishes a single source of guidance under IFRS for all fair value measurements. IFRS 13 does not change when an entity is required to use fair value, but rather provides guidance on how to measure fair value under IFRS when fair value is required or permitted. The Bank is currently assessing the impact that this standard will have on the financial position and performance. This standard becomes effective for annual periods beginning on or after 1 January 2013.
Amended Standards
IAS (1) Financial Statement Presentation – Presentation of Items of Other Comprehensive IncomeThe amendments to IAS 1 change the grouping of items presented in OCI. Items that could be reclassified (or ‘recycled’) to profit or loss at a future point in time (for example, upon derecognition or settlement) would be presented separately from items that will never be reclassified. The amendment affects presentation only and has no impact on the Bank’s financial position or performance. The amendment becomes effective for annual periods beginning on or after 1 July 2012.
IAS (12) Income Taxes – Recovery of Underlying AssetsThe amendment clarified the determination of deferred tax on investment property measured at fair value. The amendment introduces a rebuttable presumption that deferred tax on investment property measured using the fair value model in IAS 40 should be determined on the basis that its carrying amount will be recovered through sale. Furthermore, it introduces the requirement that deferred tax on non-depreciable assets that are measured using the revaluation model in IAS 16 always be measured on a sale basis of the asset. The amendment becomes effective for annual periods beginning on or after 1 January 2012.
IAS (19) Employee Benefits (Amendment)The IASB has issued numerous amendments to IAS 19. These range from fundamental changes such as removing the corridor mechanism and the concept of expected returns on plan assets to simple clarifications and re-wording. The Bank does not expect any impact and the financial position of financial statements – or – the Bank is currently assessing the full impact of the remaining amendments. The amendment becomes effective for annual periods beginning on or after 1 January 2013.
Consolidated Financial Statement

119
(27) Separate Financial Statements (as revised in 2011)As a consequence of the new IFRS 10 and IFRS 12, what remains of IAS 27 is limited to accounting for subsidiaries, jointly controlled entities, and associates in separate financial statements. The Bank does not present separate financial statements. The amendment becomes effective for annual periods beginning on or after 1 January 2013.
IAS (28) Investments in Associates and Joint Ventures (as revised in 2011)As a consequence of the new IFRS 11 and IFRS 12. IAS 28 has been renamed IAS 28 Investments in Associates and Joint Ventures, and describes the application of the equity method to investments in joint ventures in addition to associates. The amendment becomes effective for annual periods beginning on or after 1 January 2013.
IFRS (7) Financial Instruments: Disclosures — Enhanced De-recognition Disclosure RequirementsThe amendment requires additional disclosure about financial assets that have been transferred but not derecognized to enable the user of the Bank’s financial statements to understand the relationship with those assets that have not been derecognized and their associated liabilities. In addition, the amendment requires disclosures about continuing involvement in derecognized assets to enable the user to evaluate the nature of, and risks associated with, the entity’s continuing involvement in those derecognized assets. The amendment becomes effective for annual periods beginning on or after 1 July 2011. The amendment affects disclosure only and has no impact on the Bank’s financial position or performance.
(56) Comparative Figures
Some of 2010 balances were reclassified to correspond with those of 2011 presentation. The reclassifications had no effect on the profit for the year and equity.
Consolidated Financial Statement


Save the Children Foundation SOS Program
Iftar Banquet - Save the Children Foundation SOS Program

124
The Bank’s Branches and Offices
Head OfficeNumber of Employees: 758Arar Street, Wadi SarqraTelephone: 06 5006000, Fax: 06 5007124P.O. Box 950661, Amman 11195, Jordan
Jordan’s Branches and OfficesAbu Alanda Branch Number of Employees: 9Tel.: 06 4162857 Fax: 06 4164801 P.O. Box 153, Amman 11592, Jordan
Abu Nseir Branch Number of Employees: 9 Tel.: 06 5105719/20 Fax: 06 5105716 P.O. Box 2459, Amman 11941, Jordan
Al - Al Beit University Number of Employees: 8 Tel.: 02 6231856 Fax: 02 6234655 P.O. Box 130066, Mafraq 25113, Jordan
Al Abdali Branch Number of Employees: 12 Tel.: 06 5650853 Fax: 06 5602420 P.O. Box 928507, Amman 11190, Jordan
Al Baqa’a BranchNumber of Employees: 9 Tel.: 06 4728190 Fax: 06 4726810 P.O. Box 1215, Amman 19381, Jordan
Al Bayader Branch Number of Employees: 15 Tel.: 06 5859504 Fax: 06 5814933 P.O. Box 140285, Amman 11814, Jordan
Al Fuheis Branch Number of Employees: 8 Tel.: 06 5373061 Fax: 06 5373064 P.O. Box 180, Al Fuheis 19152, Jordan
Al Hurrieh Street Branch Number of Employees: 8 Tel.: 06 4205923 Fax: 06 4206962 P.O. Box 515, Amman 11623, Jordan
Al Hussein Bin Talal University BranchNumber of Employees: 6Tel: 03 2135071 Fax: 03 2134985P.O. Box 13, Ma’an 71111, Jordan
Al Hussein Bin Talal University – Gate Office BranchNumber of Employees: 3Tel.: 03 2136420 Fax: 03 2136419P.O. Box 13, Ma’an 71111, Jordan
Al Karak Branch Number of Employees: 11 Tel.: 03 2355721 Fax: 03 2355724 P.O. Box 110, Al Karak, Jordan
Al Karak Al Thunaya BranchNumber of Employees: 10Tel.: 03 2387630 Fax: 03 2387626P.O. Box 6, Al Karak 61151, Jordan
Al Madinah Al Monwra Street Branch Number of Employees: 14Tel: 06 5560285 Fax: 06 5537957 P.O. Box 1301, Amman 11953, Jordan
Al Mafraq Branch Number of Employees: 15Tel.: 02 6235516 Fax: 02 6235518 P.O. Box 1308, Al Mafraq 25110, Jordan
Al Mahata BranchNumber of Employees: 9 Tel.: 06 4651326 Fax: 06 4651991 P.O. Box 6180, Amman 11118, Jordan
Al Qweismeh BranchNumber of Employees: 13Tel.: 06 4766061 Fax: 06 4770524P.O. Box 38971, Amman 11593, Jordan
Al Qweismeh – Madaba Street BranchNumber of Employees: 9Tel.: 06 4771333 Fax: 06 4751737P.O. Box 110190, Amman 11110, Jordan
Al Rusaifeh Branch Number of Employees: 10 Tel.: 05 3741106 Fax: 05 3742275 P.O. Box 41, Al Rusaifeh 13710, Jordan
Al Salt Branch Number of Employees: 16 Tel.: 05 3550636 Fax: 05 3556715 P.O. Box 1101, Al Salt 19110, Jordan
Al Salt – King Abdullah II Street BranchNumber of Employees: 11Tel.: 05 3500173 Fax: 05 3500178P.O. Box 214, Al Balqa’ 19328, Jordan
Al Sweifieh Branch Number of Employees: 10 Tel.: 06 5865805 Fax: 06 5863140 P.O. Box 715, Amman 11118, Jordan
Al Wahdat BranchNumber of Employees: 8Tel.: 06 4771171 Fax: 06 4753388P.O. Box 715, Amman 11118, Jordan
Al Weibdeh BranchNumber of Employees: 10Tel.: 06 4637404 Fax: 06 4637438P.O. Box 715, Amman 11118, Jordan
Al Yasmeen Branch Number of Employees: 10 Tel.: 06 4201748 Fax: 06 4201459 P.O. Box 38971, Amman 11593, Jordan
Al Zarqa BranchNumber of Employees: 17Tel.: 05 3982729 Fax: 05 3931424P.O. Box 39, Al Zarqa 13110, Jordan
Al Zarqa Branch – Army StreetNumber of Employees: 10Tel: 05 3968031 Fax: 05 3968033P.O. Box 151180, Zarqa 13115, Jordan
Al Zarqa – Baghdad Street Branch Number of Employees: 8Tel.: 05 3931984 Fax: 05 3931988 P.O. Box 150746, Al Zarqa 13115, Jordan
Al Zarqa – New BranchNumber of Employees: 8Tel.: 05 3864118 Fax: 05 3864120P.O. Box 12291, Al Zarqa 13112, Jordan
Bank’s Branches & Offices

125
Amman Branch Number of Employees: 19 Tel.: 06 5006001 Fax: 06 4639328 P.O. Box 715, Amman 11118, Jordan
Aqaba Branch Number of Employees: 14 Tel.: 03 2019787 Fax: 03 2015550 P.O. Box 1166, Aqaba 77110, Jordan
Aqaba – Tunisian Baths Street Branch Number of Employees: 7 Tel.: 03 2018452 Fax: 03 2018456 P.O. Box 1177, Aqaba 77110, Jordan
Aswaq Al Salam Branch Number of Employees: 10Tel.: 06 5859045 Fax: 06 5857631 P.O. Box 140285, Amman 11814, Jordan
Bani Kenana BranchNumber of Employees: 8Tel.: 02 7585191 Fax: 02 7585211 P.O. Box 109, Irbid 21129, Jordan
City Mall Branch Number of Employees: 12 Tel.: 06 5820028 Fax: 06 5864726 P.O. Box 2688, Amman11821, Jordan
Cozmo OfficeNumber of Employees: 4Tel.: 06 5821634 Fax: 06 5814933P.O. Box 140285, Amman 11814, Jordan
C-Town Branch – 7th CircleNumber of Employees: 8Tel.: 06 5861724 Fax: 06 5816145P.O. Box 715, Amman 11118, Jordan
Hakma BranchNumber of Employees: 10Tel: 02 7408377 Fax: 02 7412545P.O. Box 336, Irbid 21110, Jordan
Hashmi Al Shamali BranchNumber of Employees: 7Tel.: 06 5055390 Fax: 06 5055401P.O. Box 231106, Amman 11123, Jordan
Irbid – Al Hashmi Street BranchNumber of Employees: 14Tel.: 02 7257531 Fax: 02 7279207P.O. Box 336, Irbid 21110, Jordan
Irbid Branch – King Abdullah SqaureNumber of Employees: 9Tel.: 02 7240071 Fax: 02 7240069P.O. Box 2066, Irbid 21110, Jordan
Irbid Branch – Omar Al Mokhtar StreetNumber of Employees: 10Tel.: 02 7250950 Fax: 02 7250954P.O. Box 150002, Irbid 21141, Jordan
Jabal Al Hussein BranchNumber of Employees: 10Tel: 06 4656601 Fax: 06 4617160P.O. Box 8272, Amman 11121, Jordan
Jabal Al Hussein (Western) BranchNumber of Employees: 8Tel.: 06 5604974 Fax: 06 5605632P.O. Box 8636 Amman 11121, Jordan
Jabal Amman Branch Number of Employees: 14Tel.: 06 4625228 Fax: 06 4618504 P.O. Box 2018, Amman 11181, Jordan
Jerash BranchNumber of Employees: 12Tel.: 02 6354011 Fax: 02 6354012P.O. Box 96, Jerash, Jordan
Jordan University BranchNumber of Employees: 17Tel.: 06 5342225 Fax: 06 5333278P.O. Box 13146, Amman 11942, Jordan
Jordan University Hospital BranchNumber of Employees: 10Tel.: 06 5514072 Fax: 06 5333248P.O. Box 13046, Amman 11942, Jordan
Jordan University – Student Office Aqaba BranchNumber of Employees: 4Tel.: 03 2058027 Fax: 03 2058029P.O. Box 1177, Aqaba 77110, Jordan
Jordan University – Student Office BranchNumber of Employees: 4Tel.: 06 5330138 Fax: 06 5333278P.O. Box 13146, Amman 11942, Jordan
King Abdullah Hospital BranchNumber of Employees: 7Tel.: 02 7095723 Fax: 02 7095725P.O. Box 336, Irbid 21110, Jordan
Leaders Center – Al Madina Al Tibbiyeh Street BranchNumber of Employees: 5Tel.: 06 5331206 Fax: 06 5331209P.O. Box 140350, Amman 11814, Jordan
Ma’adi BranchNumber of Employees: 11Tel.: 05 3570030 Fax: 05 3571904P.O. Box 27, Ma’adi 18261, Jordan
Madaba BranchNumber of Employees: 11Tel.: 05 3253471 Fax: 05 3253465P.O. Box 585, Madaba 17110, Jordan
Marj Al Hamam BranchNumber of Employees: 9Tel.: 06 5712383 Fax: 06 5711895P.O. Box 30, Marj Al Hamam 11732, Jordan
Marka Branch Number of Employees: 9Tel.: 06 4896044 Fax: 06 4896042P.O. Box 715, Amman 11118, Jordan
Marriott Hotel Branch Number of Employees: 4Tel.: 06 5658764 Fax: 06 5623161P.O. Box 715, Amman 11118, Jordan
Mecca Street BranchNumber of Employees: 10Tel.: 06 5522850 Fax: 06 5522852P.O. Box 1172, Amman 11821, Jordan
Mu’tah University BranchNumber of Employees: 14Tel.: 03 2370182 Fax: 03 2370181P.O. Box 88, Mu’tah 61710, Jordan
Bank’s Branches & Offices

126
Philadelphia University BranchNumber of Employees: 5Tel.: 02 6374604 Fax: 02 6374605P.O. Box 1, Jerash 19392, Jordan
Ports Corporations OfficeNumber of Employees: 2Tel.: 03 2019117 Fax: 03 2015550P.O. Box 1166, Aqaba 77110, Jordan
Prince Hamza Hospital Branch Number of Employees: 6Tel.: 06 5055226 Fax: 06 5055204P.O. Box 1047, Amman 11947, Jordan
Qasr Al Adel BranchNumber of Employees: 5Tel.: 06 5677286 Fax: 06 5677287P.O. Box 950661, Amman 11195, Jordan
Ramtha BranchNumber of Employees: 8Tel.: 02 7384126 Fax: 02 7384128P.O. Box 526, Ramtha 21410, Jordan
Science & Technology University BranchNumber of Employees: 12Tel.: 02 7095713 Fax: 02 7095168P.O. Box 3030, Irbid 22110, Jordan
Shmeisani BranchNumber of Employees: 14Tel.: 06 5685074 Fax: 06 5687721P.O. Box 962297, Amman 11196, Jordan
Sweileh BranchNumber of Employees: 16Tel.: 06 5335210 Fax: 06 5335159P.O. Box 1400, Amman 11910, Jordan
Sweileh – Queen Rania Al Abdullah Street BranchNumber of Employees: 9Tel.: 06 5332585 Fax: 06 5332485P.O. Box 316, Amman 11910, Jordan
Tabarbour BranchNumber of Employees: 8Tel.: 06 5054170 Fax: 06 5053916P.O. Box 273, Amman 11947, Jordan
Wadi Saqra BranchNumber of Employees: 15Tel.: 06 5006000 Fax: 06 5007124P.O. Box 950661, Amman 11195, Jordan
Yarmouk University BranchNumber of Employees: 13Tel.: 02 7246053 Fax: 02 7241983P.O. Box 336, Irbid 21110, Jordan
Yarmouk University – Student Office BranchNumber of Employees: 4Tel.: 02 7270181 Fax: 02 6354012P.O. Box 336, Irbid 21110, Jordan
Zara Mall BranchNumber of Employees: 15Tel.: 06 5006220 Fax: 06 4618354P.O. Box 17868, Amman 11195, Jordan
Consulting CentersConsulting Center - AmmanTel.: 06 5006000 Fax: 06 5007128P.O. Box 950661, Amman 11195, Jordan
Consulting Center – IrbidTel.: 02 7257529 Fax: 02 7257530P.O. Box 950661, Amman 11195, Jordan
Consulting Center – JerashTel.: 02 6354010 Fax: 02 6354012P.O. Box 96, Jerash, Jordan
Consulting Center – ZarqaTel.: 05 3975202 Fax: 05 3975203P.O. Box 950661, Amman 11195, Jordan
Palestine Branches and OfficesRegional ManagementNumber of Employees: 263Tel.: 02 2977230 Fax: 02 2952763P.O. Box 1870, Ramallah, Palestine
Abu Baker Street Office – JeninNumber of Employees: 12Tel.: 04 2505270 Fax: 04 2503110P.O. Box 67, Jenin, Palestine
Ain Sara Al Khalil BranchNumber of Employees: 13Tel.: 02 2216801 Fax: 02 2221140P.O. Box 663, Al Khalil, Palestine
Al Ahliya College – Ramallah BranchNumber of Employees: 22Tel.: 02 2983500 Fax: 02 2955437P.O. Box 2359, Ramallah, Palestine
Al Irsal – Ramallah BranchNumber of Employees: 16Tel.: 02 2948100 Fax: 02 2951433P.O. Box 4343, Bireh, Palestine
Al Mahd Square Branch – BethlehemNumber of Employees: 9Tel.: 02 2757770 Fax: 02 2757722P.O. Box 601, Bethlehem, Palestine
Al Masyoun – Ramallah BranchNumber of Employees: 17Tel.: 02 2977090 Fax: 02 2979755P.O. Box 2419, Ramallah, Palestine
Al Rimal – Gaza BranchNumber of Employees: 19Tel.: 08 2821077 Fax: 08 2821088P.O. Box 5350, Gaza, Palestine
Al Saraya – Gaza BranchNumber of Employees: 11Tel.: 08 2824950 Fax: 08 2824830P.O. Box 167, Gaza, Palestine
Al Shallaleh – Al Khalil BranchNumber of Employees: 7Tel.: 02 2229803 Fax: 02 2229327P.O. Box 662, Al Khalil, Palestine
An-Najah University Office BranchNumber of Employees: 5Tel.: 09 2343550 Fax: 09 2977167P.O. Box 499, Nablus, Palestine
Bethlehem BranchNumber of Employees: 14Tel.: 02 2756900 Fax: 02 2744974P.O. Box 709, Bethlehem, Palestine
Bank’s Branches & Offices

127
Deir Al Balah BranchNumber of Employees: 9Tel.: 08 2531220 Fax: 08 2539947P.O. Box 6007, Gaza, Palestine
Faisal Street – Nablus BranchNumber of Employees: 15Tel.: 09 2383250 Fax: 09 2383256P.O. Box 1559, Nablus, Palestine
Haifa Street – Jenin BranchNumber of Employees: 18Tel.: 04 2418000 Fax: 04 2439470P.O. Box 66, Jenin, Palestine
Jericho BranchNumber of Employees: 10Tel.: 02 2323627 Fax: 02 2321982P.O. Box 55, Jericho, Palestine
Khan Younes BranchNumber of Employees: 12Tel.: 08 2054074 Fax: 08 2054084P.O. Box 158, Khan Younes, Palestine
Nablus BranchNumber of Employees: 31Tel.: 09 2393001 Fax: 09 2381590P.O. Box 50, Nablus, Palestine
Qalqilya BranchNumber of Employees: 17Tel.: 09 2941115 Fax: 09 2941119P.O. Box 43, Qalqiliah, Palestine
Rafah BranchNumber of Employees: 12Tel.: 08 2136251 Fax: 08 2136250P.O. Box 8205, Rafah, Palestine
Tulkarem BranchNumber of Employees: 26Tel.: 09 2688140 Fax: 09 2672773P.O. Box 110, Tulkarem, Palestine
Wad Al Tuffah BranchNumber of Employees: 14Tel.: 02 2225353 Fax: 02 2225358P.O. Box 655, Hebron, Palestine
Subsidiary CompaniesAl Watanieh for Financial Services Company –Awraq InvestmentsNumber of Employees: 31Tel.: 02 2757770 Fax: 02 2757722P.O. Box 601, Bethlehem, Palestine
Al Watanieh Securities CompanyNumber of Employees: 18Tel.: 009702 298 0420 Fax: 009702 298 7277P.O. Box 1983, Ramallah, Palestine
Bank’s Branches & Offices
Recommended