CMR INSTITUTE OF TECHNOLOGY
USN
Internal Test –November 2017
Sub: High Voltage Engineering Code: 10EE73
Date: 08/11/2017 Duration: 90 mins Max Marks: 50 Sem: VII Branch: EEE
Note: Answer Question 1 and 2. Answer any TWO questions from the rest.
Marks OBE
CO RBT
1. Explain with neat sketches Cockroft-Walton voltage multiplier circuit. Derive the
expression for a) high voltage regulation, b) ripple, c) optimum no of stages when
the circuit is (i) unloaded (ii) loaded.
[5+5
+5]
CO4 L2
OR
Draw the circuit and derive the necessary formula for an impulse generator which
has eight stages with each condenser rated for 0.16 F and 125 kV. The load
capacitor available is 1000 pF. Find the series resistance and the damping
resistance needed to produce 1.2/50µs impulse wave. What is the maximum
output voltage of the generator, if the charging voltage is 120kV?
[8+7] CO4 L3
P.T.O
CMR
INSTITUTE OF
TECHNOLOGY
USN
Internal Test –November 2017
Sub: High Voltage Engineering Code: 10EE73
Date: 8/11 /2017 Duration: 90
mins
Max
Marks: 50 Sem: VII Branch EEE
Note: Answer Question 1 and 2. Answer any TWO questions from the rest.
Marks OBE
CO RBT 1.
Explain with neat sketches Cockroft-Walton voltage multiplier circuit. Derive the
expression for a) high voltage regulation, b) ripple, c) optimum no of stages
when the circuit is (i) unloaded (ii) loaded.
OR
[5+5
+5]
CO4 L2
Draw the circuit and derive the necessary formula for an impulse generator which
has eight stages with each condenser rated for 0.16 F and 125 kV. The load
capacitor available is 1000 pF. Find the series resistance and the damping
resistance needed to produce 1.2/50µs impulse wave. What is the maximum
output voltage of the generator, if the charging voltage is 120kV?
[8+7] CO4 L3
P.T.O

2. Write a short notes on any THREE of the following:
(a) Chubb-Fortesque Method (b) Trigatron Gap (c) series resistance
with micro-ammeter for measuring high DC voltages, (d) Rogowsky coil.
[5+5
+5]
CO5 L1
3. Explain with a neat diagram how a high voltage can be measured by using an
Electrostatic voltmeter OR a Generating voltmeter.
[5+5]
CO5 L2
4. Explain with a neat diagram sphere gap method for measuring high voltage.
Explain the factors affecting the measurement
[5+5] CO5 L3
5. Describe the working principle of Tesla coil and state its application. [10] CO4 L1
6. Describe potential divider method for measuring impulse voltage. [10] CO5 L2
2. Write a short notes on any THREE of the following:
(a) Chubb-Fortesque Method (b) Trigatron Gap (c) series resistance with
micro-ammeter for measuring high DC voltages, (d) Rogowsky coil.
[5+5
+5]
CO5 L1
3. Explain with a neat diagram how a high voltage can be measured by using an
Electrostatic voltmeter OR a Generating voltmeter.
[5+5 ] CO5 L2
4. Explain with a neat diagram sphere gap method for measuring high voltage.
Explain the factors affecting the measurement
[5+5] CO5 L3
5. Describe the working principle of Tesla coil and state its application.. [10] CO4 L1
6. Describe potential divider method for measuring impulse voltage. [10] CO5 L2
1.


1or


2a)
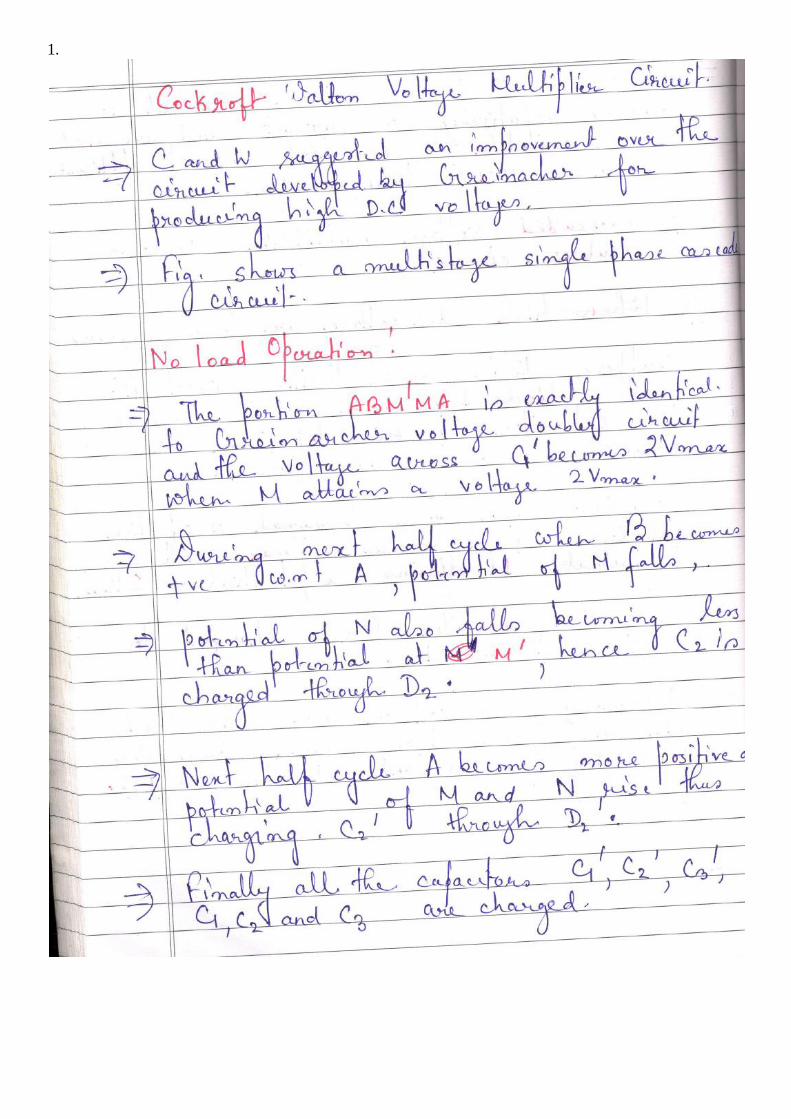
THE CHUBB-FORTESCUE METHOD
• Chubb and Fortescue suggested a simple and accurate method of measuring peak value of a.c.
voltages.
• The basic circuit consists of a standard capacitor, two diodes and a current integrating ammeter (MC
ammeter) as shown in Fig. 4.11 (a).
• The displacement current ic(t), Fig. 4.12 is given by the rate of change of the charge and hence the
voltage V(t) to be measured flows through the high voltage capacitor C and is subdivided into
positive and negative components by the back to back connected diodes.
• The voltage drop across these diodes can be neglected (1 V for Si Diodes) as compared with the
voltage to be measured.
• The measuring instrument (M.C. ammeter) is included in one of the branches.
• The ammeter reads the mean value of the current.
• The relation is similar to the one obtained in case of generating voltmeters.

• An increased current would be obtained if the current reaches zero more than once during one half
cycle.
• This means the wave shapes of the voltage would contain more than one maxima per half cycle.
• The standard a.c. voltages for testing should not contain any harmonics and, therefore, there could
be very short and rapid voltages caused by the heavy predischarges, within the test circuit which
could introduce errors in measurements.
• To eliminate this problem filtering of a.c. voltage is carried out by introducing a damping resistor in
between the capacitor and the diode circuit, Fig.
• Also, if full wave rectifier is used instead of the half wave as shown in Fig. 4.11, the factor 2 in the
denominator of the above equation should be replaced by 4.
• Since the frequency f, the capacitance C and current I can be measured accurately, the measurement
of symmetrical a.c. voltages using Chubb and Fortescue method is quite accurate and it can be used
for calibration of other peak voltage measuring devices.
• • Fig. 4.13 shows a digital peak voltage measuring circuit.
• the rectified current is not measured directly, instead a proportional analog voltage signal is derived
which is then converted into a Proportional medium frequency for using a voltage to frequency
convertor (Block A in Fig. 4.13).
• The frequency ratio fm/f is measured with a gate circuit controlled by the a.c. power frequency
(supply frequency f) and a counter that opens for an adjustable number of period Δt = p/f.
• The number of cycles n counted during this interval is
• Thus the indicator can be calibrated to read Vm directly by selecting suitable values of A, p and R.
• The voltmeter is found to given an accuracy of 0.35%.
2b)

• The three electrode gap requires larger space and an elaborate construction.
• Now-a-days a trigatron gap shown in Fig. 6,24 is used, and this requires much smaller voltage for
operation compared to the three electrode gap.
• A trigatron gap consists of a high voltage spherical electrode of suitable size, an earthed main
electrode of spherical shape, and a trigger electrode through the main electrode.
• The trigger electrode is a metal rod with an annular clearance of about 1 mm fitted into the main
electrode through a bushing.
• The trigatron is connected to a pulse circuit as shown in Fig. 6.24b.
• Tripping of the impulse generator is affected by a trip pulse which produces a spark between the
trigger electrode and the earthed sphere.
• Due to space charge effects and distortion of the field in the main gap, sparkover of the main gap
occurs.
• The trigatron gap is polarity sensitive and a proper polarity pulse should be
applied for correct operation

2c)
High Ohmlc Series Resistance with Microammeter
• High d.c. voltages are usually measured by connecting a very high resistance (few hundreds of
megaohms) in series with a microammeter as shown in Fig. 7. 1 .

• Only the current I flowing through the large calibrated resistance R is measured by the moving coil
microammeter.
• The voltage of the source is given by
• The voltage drop in the meter is negligible, as the impedance of the meter is only few ohms
compared to few hundred mega-ohms of the series resistance R.
• A protective device like a paper gap, a neon glow tube, or a zener diode with a suitable series
resistance is connected across the meter as a protection against high voltages in case the series
resistance R fails or flashes over.
• High d.c. voltages are usually measured by connecting a very high resistance (few hundreds of
megaohms) in series with a microammeter as shown in Fig. 7. 1 .
• Only the current I flowing through the large calibrated resistance R is measured by the moving coil
microammeter.
• The voltage of the source is given by
• The voltage drop in the meter is negligible, as the impedance of the meter is only few ohms
compared to few hundred mega-ohms of the series resistance R.
• A protective device like a paper gap, a neon glow tube, or a zener diode with a suitable series
resistance is connected across the meter as a protection against high voltages in case the series
resistance R fails or flashes over.
• The limitations in the series resistance design are:
(i) power dissipation and source loading,
(ii) temperature effects and long time stability,
(iii) voltage dependence of resistive elements, and
(iv) sensitivity to mechanical stresses.
Series resistance meters are built for 500 kV d.c. with an accuracy better than 0.2%.
2d) Rogowskl Colls:
• If a coil is placed surrounding a current carrying conductor, the voltage signal induced in the coil is
• Where M is the mutual inductance between the conductor and the coil, and I is the current flowing
in the conductor.
• Usually, the coil is wound on a nonmagnetic former of toroidal shape and is coaxially placed
surrounding the current carrying conductor.
• The number of turns on the coil is chosen to be large, to get enough signal induced.
• The coil is wound cross-wise to reduce the leakage inductance.
• Usually an integrating circuit (see Fig. 7.52) is employed to get the output signal voltage
proportional to the current to be measured.
• The output voltage is given by
•

• Rogowski coils with electronic or active integrator circuits have large and widths (about 100 MHz).
• At frequencies greater than 100 MHz the response is affected by the skin effect, the capacitance
distributed per unit length along the coil, and due to the electromagnetic interferences.
However, miniature probes having nanosecond response time are made using very few turns of copper strips
for UHF measurements.
3.
D/E –Metal Dome
M/A-mounting Plate
G/C –guard plate
P/B –Fixed Plate
H- Guard loop or ring
B/D-Balance
C/G-Capacitance Divider
W Balancing Weight

• Fig. shows a schematic diagram of an absolute electrostatic voltmeter.
• The hemispherical metal dome D encloses a sensitive balance B which measures the force of
attraction between the movable disc which hangs from one of its arms and the lower plate P.
• The movable electrode M hangs with a clearance of above 0.01 cm, in a central opening in the upper
plate which serves as a guard ring.
• The diameter of each of the plates is 1 metre.
• Light reflected from a mirror carried by the balance beam serves to magnify its motion and to
indicate to the operator at a safe distance when a condition of equilibrium is reached.
• As the spacing between the two electrodes is large (about 100 cms for a voltage of about 300 kV),
the uniformity of the electric field is maintained by the guard rings G which surround the space
between the discs M and P.
• The guard rings G are maintained at a constant potential in space by a capacitance divider ensuring
a uniform spatial potential distribution.
• When voltages in the range 10 to 100 kV are measured, the accuracy is of the order of 0.01 per cent.
• Principle: The electric field according to Coulomb is the field of forces. The electric field is
produced by voltage and, therefore, if the field force could be measured, the voltage can also be
measured.
• The voltmeters are used for the measurement of high a.c. and d.c. voltages. The measurement of
voltages lower than about 50 volt is, however, not possible, as the forces become too small.
• When a voltage is applied to a parallel plate electrode arrangement, an electric field is set up between
the plates.
• It is possible to have uniform electric field between the plates with suitable arrangement of the plates.
• The field is uniform, normal to the two plates and directed towards the negative plate.

• If A is the area of the plate and E is the electric field intensity between the plates ε the permittivity of
the medium between the plates, we know that the energy density of the electric field between the
plates is given as,
Consider a differential volume between the plates and parallel to the plates with area A and thickness dx, the
energy content in this differential volume Adx is
Now force F between the plates is defined as the derivative of stored electric energy along the field direction
i.e.,
Now E = V/d where V is the voltage to be measured and d the distance of separation between the plates.
Therefore, the expression for force
Since the two plates are oppositely charged, there is always force of attraction between the plates.
If the voltage is time dependant, the force developed is also time dependant. In such a case the mean value of
force is used to measure the voltage. Thus
• Electrostatic voltmeters measure the force based on the above equations and are arranged such that
one of the plates is rigidly fixed whereas the other is allowed to move.
• With this the electric field gets disturbed.
• For this reason, the movable electrode is allowed to move by not more than a fraction of a millimetre
to a few millimetres even for high voltages so that the change in electric field is negligibly small.
• As the force is proportional to square of Vrms, the meter can be used both for a.c. and d.c. voltage
measurement
• The force developed between the plates is sufficient to be used to measure the voltage.

• Various designs of the voltmeter have been developed which differ in the construction of electrode
arrangement and in the use of different methods of restoring forces required to balance the
electrostatic force of attraction.
• Some of the methods are
• (i) Suspension of moving electrode on one arm of a balance.
• (ii) Suspension of the moving electrode on a spring.
• (iii) Pendulous suspension of the moving electrode.
• (iv) Torsional suspension of moving electrode.
• The small movement is generally transmitted and amplified by electrical or optical methods.
• If the electrode movement is minimised and the field distribution can exactly be calculated, the
meter can be used for absolute voltage measurement as the calibration can be made in terms of the
fundamental quantities of length and force
• for a given voltage to be measured, the higher the force, the greater is the precision that can be
obtained with the meter.
• to achieve higher force for a given voltage, the area of the plates should be large, the spacing
between the plates (d) should be small and some dielectric medium other than air should be used in
between the plates.
• If uniformity of electric field is to be maintained an increase in area A must be accompanied by an
increase in the area of the surrounding guard ring and of the opposing plate and the electrode may,
therefore, become unduly large specially for higher voltages.
• Similarly the gap length cannot be made very small as this is limited by the breakdown strength of
the dielectric medium between the plates.
• If air is used as the medium, gradients upto 5 kV/cm have been found satisfactory.
•
For higher gradients vacuum or SF6 gas has been used
• advantage of the electrostatic voltmeter is its extremely low loading effect as only electric fields are
required to be set up.
• Because of high resistance of the medium between the plates, the active power loss is negligibly
small.
• The voltage source loading is, therefore, limited only to the reactive power required to charge the
instrument capacitance which can be as low as a few picofarads for low voltage voltmeters.
• The measuring system as such does not put any upper limit on the frequency of supply to be
measured.
• However, as the load inductance and the measuring system capacitance form a series resonance
circuit, a limit is imposed on the frequency range.
• For low range voltmeters, the upper frequency is generally limited to a few MHz
3or
GENERATING VOLTMETER
• When the source loading is not permitted or when direct connection to the high voltage source is to
be avoided, the generating principle is employed for the measurement of high voltages
• Principle: A generating voltmeter is a variable capacitor electrostatic voltage generator which
generates current proportional to the voltage to be measured.
• Similar to electrostatic voltmeter the generating voltmeter provides loss free measurement of d.c. and
a.c. voltages.

• The device is driven by an external constant speed motor and does not absorb power or energy from
the voltage measuring source.
• The principle of operation explained with the help of Fig.
• Construction:
• H is a high voltage electrode
• the earthed electrode is subdivided into a sensing or pick up electrode P, a guard electrode G and a
movable electrode M, all of which are at the same potential.
• The high voltage electrode H develops an electric field between itself and the electrodes P, G and M.
• The field lines are shown in Fig. 4.8.
• The electric field density σ is also shown.
• If electrode M is fixed and the voltage V is changed, the field density σ would change and thus a
current i (t) would flow between P and the ground.
• • Where σ (a) is the electric field density or charge density along some path and is assumed constant
over the differential area da of the pick up electrode.
• In this case σ (a) is a function of time also and ∫ da the area of the pick up electrode P exposed to the
electric field.
• If the voltage V to be measured is constant (d.c voltage), a current i(t) will flow only if it is moved
i.e. now σ (a) will not be function of time but the charge q is changing because the area of the pick up
electrode exposed to the electric field is changing.
• The current i(t) is given by
where σ (a) = εE(a) and ε is the permittivity of the medium between the high voltage electrode and the
grounded electrode.
The integral boundary denotes the time varying exposed area.
The high voltage electrode and the grounded electrode in fact constitute a capacitance system.
The capacitance is, however, a function of time as the area A varies with time and, therefore, the charge q(t)
is given as


• ω is the angular frequency of variation of the capacitance.
• If ω is constant the current measured is proportional to the voltage being measured.
• Generally the current is rectified and measured by a moving coil meter.
• Generating voltmeters can be used for a.c. voltage measurement also provided the angular frequency
ω is the same or equal to half that of the voltage being measured.
• Fig 4.9 shows the variations of C as a function of time together with a.c. voltage, the frequency of
which is twice the frequency of C (t).
• whatever be the phase relation between voltage and the capacitance, over one cycle variation of the
voltage is same (e.g. V(t1) – V(t2))
• the rate of change of capacitance over the period Tv is equal to Cm/Tv. Therefore, the instantaneous
value of current i(t) = Cm fvV(t)
• where fv = 1/Tv the frequency of voltage.
Since fv = 2fc and fc = 60/n we obtain
I(t) = n/30 CmV(t)

• Fig. shows a schematic diagram of a generating voltmeter which employs rotating vanes for variation
of capacitance.
• The high voltage electrode is connected to a disc electrode D3 which is kept at a fixed distance on the
axis of the other low voltage electrodes D2, D1, and D0.
• The rotor D0 is driven at a constant speed by a synchronous motor at a suitable speed.
• The rotor vanes of D0 cause periodic change in capacitance between the insulated disc D2 and the
high voltage electrode D3.
• The number and shape of vanes are so designed that a suitable variation of capacitance (sinusodial or
linear) is achieved.
• The a.c. current is rectified and is measured using moving coil meters.
If the current is small an amplifier may be used before the current is measured
• Generating voltmeters are linear scale instruments and applicable over a wide range of voltages.
• The sensitivity can be increased by increasing the area of the pick up electrode and by using
amplifier circuits.
• Advantages • (i) scale is linear and can be extrapolated
• (ii) source loading is practically zero
• (iii) no direct connection to the high voltage electrode.
Limitations of Generating Voltmeters (i) They require calibration,
(ii) careful construction is needed and is a cumbersome instrument requiring an auxiliary drive, and
(iii) disturbance in position and mounting of the electrodes make the calibration invalid.
(iv) The breakdown of insulating materials depends upon the magnitude of voltage applied and the time of
application of voltage.
if the peak value of voltage is large as compared to breakdown strength of the insulating material, the
disruptive discharge phenomenon is in general caused by the instantaneous maximum field gradient stressing
the material.
Various methods discussed so far can measure peak voltaA more convenient though less accurate method:
the use of a testing transformer wherein the output voltage is measured and recorded and the input voltage is
obtained by multiplying the output voltage by the transformation ratio.

output voltage depends upon the loading of the secondary winding and wave shape variation is caused by the
transformer impedances and hence this method is unacceptable for peak voltage measurements.
4. MEASUREMENT OF HVAC AND HVDC AND IMPULSE VOLTAGE USING SPHERE GAP
• Sphere gap is by now considered as one of the standard methods for the measurement of peak value
of d.c., a.c. and impulse voltages and is used for checking the voltmeters and other voltage measuring
devices used in high voltage test circuits.
• Two identical metallic spheres separated by certain distance form a sphere gap.
• The sphere gap can be used for measurement of impulse voltage of either polarity provided that the
impulse is of a standard wave form and has wave front time at least 1 micro sec. and wave tail time
of 5 micro sec.
• the gap length between the sphere should not exceed a sphere radius.
• If these conditions are satisfied and the specifications regarding the shape, mounting, clearances of
the spheres are met, the results obtained by the use of sphere gaps are reliable to within ±3%.
in standard specification that in places where the availability of ultraviolet radiation is low, irradiation of the
gap by radioactive or other ionizing media should be used when voltages of magnitude less than 50 kV are
being measured or where higher voltages with accurate results are to be obtained
Specifications on Spheres and Associated Accessories
• The spheres should be so made that their surfaces are smooth and their curvatures as uniform as
possible.
• For smaller size, the spheres are placed in horizontal configuration whereas large sizes (diameters),
the spheres are mounted with the axis of the sphere gaps vertical and the lower sphere is grounded.
• In either case, it is important that the spheres should be so placed that the space between spheres is
free from external electric fields and from bodies which may affect the field between the spheres

• For the measurement of a.c. or d.c. voltage, a reduced voltage is applied to begin with so that the
switching transient does not flash over the sphere gap and then the voltage is increased gradually till
the gap breaks down.
• Alternatively the voltage is applied across a relatively large gap and the spacing is then gradually
decreased till the gap breaks down. Corresponding to this gap the value of peak voltage can be read
out from the calibration tables.
• The calibration tables values correspond to 760 mm Hg pressure and 20°C temperature.
• Any deviation from the value, a correction factor will have to be used to get the correct value of the
voltage being measured.
• For the measurement of 50% impulse disruptive discharge voltages, the spacing of the sphere gap or
the charging voltage of the impulse generator is adjusted in steps of 3% of the expected disruptive
voltage.
• Six applications of the impulse should be made at each step and the interval between two
applications is 5 seconds.
• The value giving 50% probability to disruptive discharge is preferably obtained
by interpolation between at least two gap or voltage settings, one resulting in two disruptive discharges or
less out of six applications and the other in four disruptive discharges or more out of again six applications
• The breakdown voltage of a sphere gap increases with increase in pressure and decreases with
increase in temperature.
• The value of disruptive voltages as given in Tables 4.2 and 4.3 correspond to 760 mm Hg pressure
and 20°C.
• For small variation in temperatures and pressures, the disruptive voltage
• is closely proportional to the relative air density. The relative air density δ is given by
• where b and t are the atmospheric conditions (pressure in mm of Hg and temperature in °C
respectively) during measurement.
• The disruptive voltage V is given V = KdV0

• Where V0 is the disruptive voltage as given in the Tables 4.2 and 4.3 and Kd is a correction factor
Kd is a slightly non-linear function of δ a result explained by Paschen's law.
Various factors that affect the sparkover voltage of a sphere gap are:
(i) nearby earthed objects,
(ii) atmospheric conditions and humidity,
(iii) irradiation, and
(i v) polarity and rise time of voltage waveforms.
• Effect of nearby earthed objects
• The effect of nearby earthed objects was investigated by Kuffel(14) by enclosing the earthed sphere
inside an earthed cylinder.
• It was observed that the sparkover voltage is reduced.
• The reduction was observed to be
(ii) Effect of atmospheric conditions
• The sparkover voltage of a spark gap depends on the air density which varies with the changes in
both temperature and pressure.
• Let sparkover voltage = V under test conditions of temperature T and pressure p torr
• sparkover voltage =V0 under standard conditions of temperature T = 2O°C and pressure p = 760
torr, then V=kV0
• where k is a function of the air density factor d, given by
• Influence of Humidity
• Kuffel has studied the effect of the humidity on the breakdown voltage by using spheres of 2 cms to
25 cms diameters and uniform field electrodes.
• The effect was found to be maximum in the region 0.4 mm Hg. and thereafter the change was
decreased.
• Between 4–17 mm Hg. the relation between breakdown voltage and humidity was practically linear
for spacing less than that which gave the maximum humidity effect.
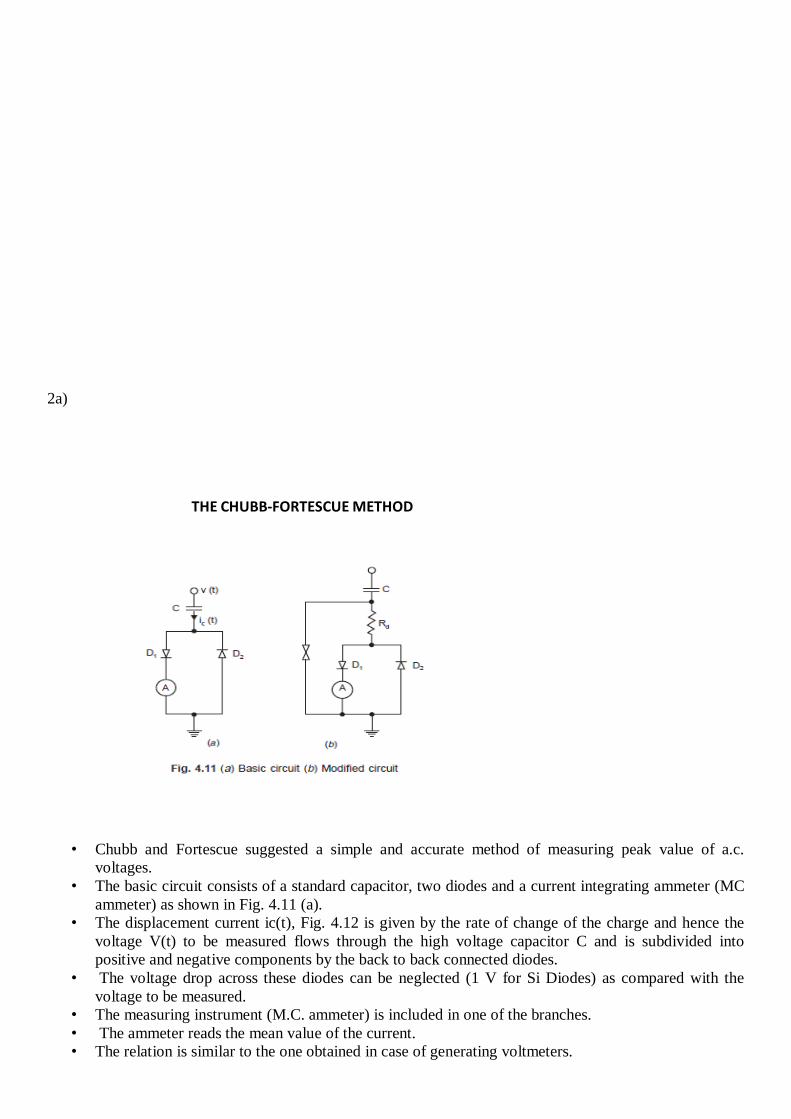
• Fig. 4.4 shows the effect of humidity on the breakdown voltage of a 25 cm diameter sphere with
spacing of 1 cm when a.c. and d.c voltages are applied.
• It can be seen that
• (i) The a.c. breakdown voltage is slightly less than d.c. voltage.
• (ii) The breakdown voltage increases with the partial pressure of water vapour.
• It has also been observed that
• (i) The humidity effect increases with the size of spheres and is largest for uniform field electrodes.
• (ii) The voltage change for a given humidity change increase with gap length.

• The increase in breakdown voltage with increase in partial pressure of water vapour and this increase
in voltage with increase in gap length is due to the relative values of ionisation and attachment
coefficients in air.
• The water particles readily attach free electrons, forming negative ions.
• These ions therefore slow down and are unable to ionise neutral molecules under field conditions in
which electrons will readily ionise.
• It has been observed that within the humidity range of 4 to 17 g/m3 (relative humidity of 25 to 95%
for 20°C temperature) the relative increase of breakdown voltage is found to be between 0.2 to
0.35% per gm/m3 for the largest sphere of diameter 100 cms and gap length upto 50 cms.
• Influence of Dust Particles • When a dust particle is floating between the gap this results into erratic breakdown in homogeneous
or slightly in homogenous electrode configurations.
• When the dust particle comes in contact with one electrode under the application of d.c. voltage, it
gets charged to the polarity of the electrode and gets attracted by the opposite electrode due to the
field forces and the breakdown is triggered shortly before arrival.
• Gaps subjected to a.c. voltages are also sensitive to dust particles but the probability of erratic
breakdown is less.
• Under d.c. voltages erratic breakdowns occur within a few minutes even for voltages as low as 80%
of the nominal breakdown voltages.
• This is a major problem, with high d.c. voltage measurements with sphere gaps.
• Effect of Irradiation
• Illumination of sphere gaps with ultra-violet or x-rays aids easy ionization in gaps.
• The effect of irradiation is pronounced for small gap spacings.
• A reduction of about 20% in sparkover voltage was observed for spacings of 0.1 D to 0.3 D for a 1.3
cm sphere gap with d.c. voltages.
• The reduction in sparkover voltage is less than 5% for gap spacings more than 1 cm, and for gap
spacings of 2 cm or more it is about 1.5%.
• Hence, irradiation is necessary for smaller sphere gaps of gap spacing less than 1 cm for obtaining
consistent values.
• (Iv) Effect of polarity and waveform
• It has been observed that the sparkover voltages for positive and negative polarity impulses are
different.
• Experimental investigation showed that for sphere gaps of 6.25 to 25 cm diameter, the difference
between positive and negative d.c. voltages is not
• more than 1%.
• For smaller sphere gaps (2 cm diameter and less) the difference was about 8% between negative
and positive impulses of 1/50 µs waveform.
• the wave front and wave tail durations also influence the breakdown voltage.
• For wave fronts of less than 0.5 µs and wave tails less than 5 µs the breakdown voltages are not
consistent and hence the use of sphere gap is not recommended for voltage measurement in such
cases.
5. Generation of High Frequency a.c. High Voltages:
• High frequency high voltages are required for
• rectifier d.c. power supplies
• testing electrical apparatus for switching surges, high frequency high voltage damped oscillations are
needed which need high voltage high frequency transformers.
The advantages of these high frequency transformers are:
• the absence of iron core in transformers and hence saving in cost and size,
• pure sine wave output,
• slow build-up of voltage over a few cycles and hence no damage due to switching surges, and
• uniform distribution of voltage across the winding coils due to subdivision of coil stack into a
number of units.

• The commonly used high frequency resonant transformer is the Tesla coil
• Doubly tuned resonant circuit
• The primary voltage rating is 10 kV
• The secondary may be rated to as high as 500 to 1000 kV.
• The primary is fed from a d.c. or a.c. supply through the condenser Ci.
• A spark gap G connected across the primary is triggered at the desired voltage V1 which induces a
high self-excitation in the secondary.
• The primary and the secondary windings (L1)and (L2) are wound on an insulated former with no
core (air-cored) and are immersed in oil.
• The windings are tuned to a frequency of 10 to 100 kHz by means of the condensers C1 and C2
• • output voltage V2 is a function of L1, L2, C1, C2, M.
• winding resistances will be small , contribute only for damping of the oscillations.
• neglecting the winding resistances.
• Let the condenser C1 be charged to a voltage V1 when the spark gap is triggered.
• Let a current i1 flow through the primary winding L1 and produce a current i2 through L2 and C2
•
Laplace transformed equation
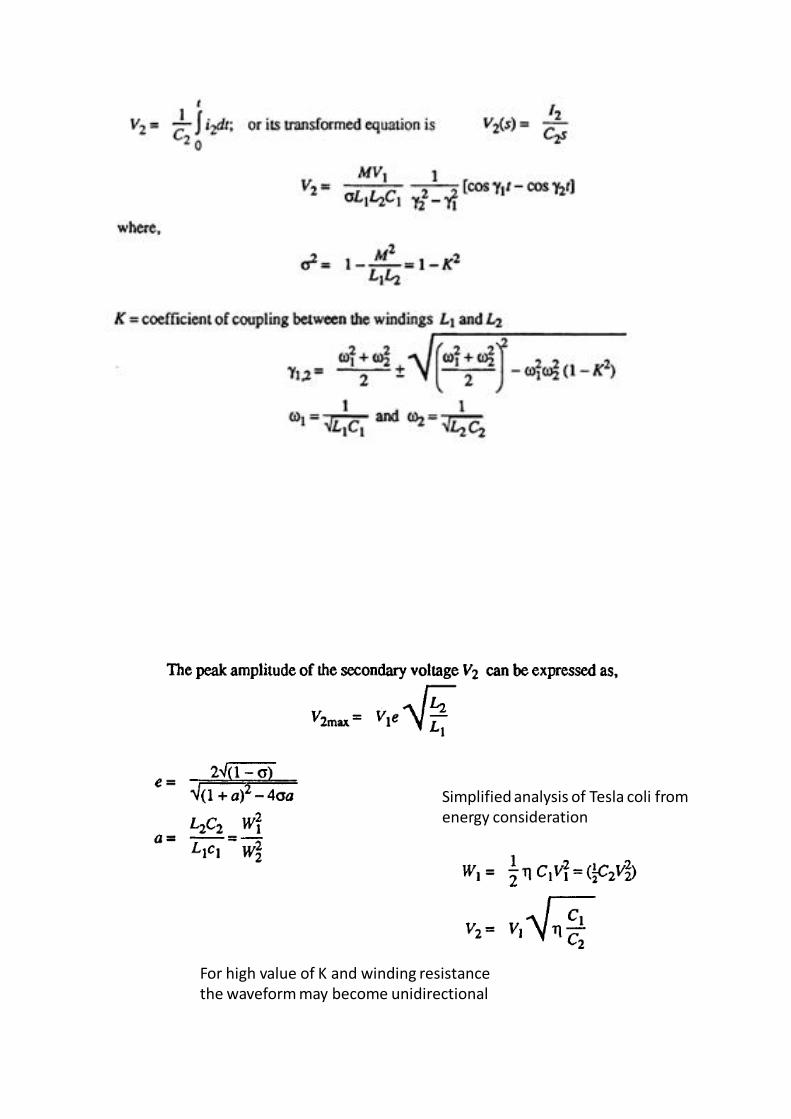
Simplified analysis of Tesla coli from energy consideration
For high value of K and winding resistance the waveform may become unidirectional

6. Potential Dividers for Impulse Voltage Measurements
• Potential or voltage dividers for high voltage impulse measurements, high frequency a.c.
measurements, or for fast rising transient voltage measurements are usually either resistive or
capacftive or mixed element type.
• The low voltage arm of the divider is usually connected to a fast recording oscillograph or a peak
reading instrument through a delay cable.
• A schematic diagram of a potential divider with its terminating equipment is given in Fig. is usually
a resistor or a series of resistors in case of a resistance potential divider, or a single or a number
of capacitors in case of a capacitance divider.
• It can also be a combination of both resistors and capacitors.
• Z2 will be a resistor or a capacitor or an R-C impedance depending upon the type of the divider.
•
•Each element in the divider, in case of high voltage dividers, has a selfresistanceor capacitance. In addition, the resistive elements have residual inductances, a terminal stray capacitance to ground, and terminal to terminal capacitances.
• The following elements mainly constitute the different
• errors in the measurement:
• (i) residual inductance in the elements;
• (ii) stray capacitance occurring
• (a) between the elements,
• (b) from sections and terminals of the elements to ground, and
• (c) from the high voltage lead to the elements or sections;
• (iii) the impedance errors due to
(a) connecting leads between the divider and the test objects, and
(b) ground return leads and extraneous current in ground leads; and
(iv) parasitic oscillations due to lead and cable inductances and capacitance of high voltage terminal to
ground.

• The effect to residual and lead inductances becomes pronounced when fast rising impulses of less
than one microsecond are to be measured.
• The residual inductances damp and slow down the fast rising pulses.
• Secondly, the layout of the test objects, the impulse generator, and the ground leads also require
special attention to minimize recording errors
• Resistance Potential Divider for Very Low Impulse Voltages and Fast Rising Pulses
• A simple resistance potential divider consists of two resistances R1 and R2 in series (R1» R2) .
• The attenuation factor of the divider or the voltage ratio is given by
•
• The divider element R2, in practice, is connected through the coaxial cable to the oscilloscope.
• The cable will generally have a surge impedance Z0 and this will come in parallel with the
oscilloscope input impedance (Rm, Cm).
• Rm will generally be greater than one megaohm and Cm may be 10 to 50 picofarads.
• For high frequency and impulse voltages (since they also contain high frequency fundamental and
harmonics), the ratio in the frequency domain will be given by
• the ratio is a function of the frequency.
• To avoid the frequency dependance of the voltage ratio a, the divider is compensated by adding an
additional capacitance C1 across R1.
• The value of C1, to make the divider independent of the frequency, may be obtained from the relation,
meaning that the time constant of both the arms should be the same. This compensation is used for the
construction of high voltage dividers and probes used with oscilloscopes

Potential Dividers Used for High Voltage Impulse Measurements
In a resistance potential divider, R1 and R2 are considered as resistors of small dimensions
. For voltages above 100 kV, R1 is no longer small in dimension and is usually made of a number of
sections.
Hence the divider is no longer a small resistor of lumped parameters, but has to be considered as an
equivalent distributed network with its terminal to ground capacitances and inter-sectional series
capacitances as shown in Fig. 7.26.
The total series resistance R 1 is made of n resistors
of value R1’ and R = nR1’. Cg is the terminal to ground capacitance of each of the

Capacitance Voltage Dividers
• Capacitance voltage dividers are ideal for measurement of fast rising voltages and pulses.
• The capacitance ratio is independent of the frequency, if their leakage resistance is high enough to be
neglected.
• But usually the dividers are connected to the source voltage through long leads which introduce lead
inductances and residual resistances.
• The capacitance used for very high voltage work is not small in dimension and hence cannot be
considered as a lumped element.
• The output of the divider for high frequencies and impulses is distorted as in the case of resistance
dividers
• Pure Capacitance Dividers • A pure capacitance divider for high voltage measurements and its electrical equivalent network
without stray elements is shown in Fig. 7.29.
• The ratio of the divider

• Capacitance C1 is formed between the h.v. terminal of the source (impulse generator) and that of the
test object or any other point of measurement
• The CRO is located within the shielded screen surrounding capacitance C2.
• C2 includes the capacitance used, the lead capacitance, input capacitance of the CRO, and other
ground capacitances. The advantage of this connection is that the loading on the source is negligible;
but a small disturbance in the location of C1 or h.v. electrode or the presence of any stray object
nearby changes the capacitance C1, and hence the divider ratio is affected.
• capacitors C1 in series for the given voltage V1. In such cases the equivalent circuit is similar to that
of a string insulator unit used in transmission lines (Fig. 7.30).
• The voltage distribution along the capacitor chain is non-linear and hence causes distribution of the
output wave. But the ratio error is constant and is independent on frequency as compared to
resistance dividers. A simplified equivalent circuit is shown in Fig.
• 7.30 b, which can be used if C1« C2 and Cg « C1. The voltage ratio is
• This ratio is constant and gives an error of less than 5% when C1 = 3Cg. This equivalent circuit is
quite satisfactory up to 1 MHz.

Mixed R-C Potential Dividers
Recommended