doi.org/10.26434/chemrxiv.12821387.v1
High Resolution Infrared Spectroscopy of Naphthalene and CenaphtheneDimersA.K. Lemmens, Pragya Chopra, Diksha Garg, Amanda Steber, Melanie Schnell, W.J. Buma, Anouk Rijs
Submitted date: 18/08/2020 • Posted date: 19/08/2020Licence: CC BY-NC-ND 4.0Citation information: Lemmens, A.K.; Chopra, Pragya; Garg, Diksha; Steber, Amanda; Schnell, Melanie;Buma, W.J.; et al. (2020): High Resolution Infrared Spectroscopy of Naphthalene and Cenaphthene Dimers.ChemRxiv. Preprint. https://doi.org/10.26434/chemrxiv.12821387.v1
Non-covalent interactions are rapidly gaining interest as they are often crucial in determining the properties ofmaterials, and key to supramolecular chemistry and to biochemistry. Non-covalent Polycyclic AromaticHydrocarbon (PAH) complexes are in particular relevant to astrochemistry and combustion chemistry wherethey are involved in the initial steps of condensation and soot formation, respectively. Here, we investigatednon-covalent π-π stacking and CH-π interactions in naphthalene and acenaphthene clusters using highresolution IR-UV spectroscopy in combination with quantum chemical calculations. We identified spectralshifts that occur upon complexation and thereby evaluated predicted potential energy surfaces. The resultsprovide strong indications for a prevalent parallel naphthalene dimer, showing that π-π stacking interactionsbecome significant for bicyclic and larger PAHs.
File list (2)
download fileview on ChemRxivIR study on ACE_NAPH_LemmensRijs.pdf (479.29 KiB)
download fileview on ChemRxivsupplementary information_ACE_Naph_LemmensRijs.pdf (913.80 KiB)
High resolution infrared spectroscopy of naphthalene and
acenaphthene dimers
Alexander Lemmensa,b, Pragya Choprac, Diksha Gargc, Amanda Steberc,
Melanie Schnellc,d, Wybren Jan Bumaa,b*, Anouk M. Rijsa*
aFELIX Laboratory, Institute of Molecules and Materials, Radboud University,
Nijmegen, The Netherlands; bVan ‘t Hoff Institute for Molecular Sciences, University
of Amsterdam, Amsterdam, The Netherlands; cDeutsches Elektronen-Synchrotron
DESY, Hamburg, Germany; dChristian-Albrechts-Universität zu Kiel, Institut für
Physikalische Chemie, Kiel, Germany
Radboud University, Institute of Molecules and Materials, FELIX Laboratory, Toernooiveld 7, 6525 ED Nijmegen, The Netherlands, *E-mail: [email protected] University of Amsterdam, Science Park 904, 1098 XH Amsterdam, The Netherlands, *E-mail: [email protected] Deutsches Elektronen-Synchrotron DESY, Notkestraße 85, 22607 Hamburg, Germany Christian-Albrechts-Universität zu Kiel, Institut für Physikalische Chemie, Max-Eyth-Straße 1, 24118 Kiel, Germany
High resolution infrared spectroscopy of naphthalene and
acenaphthene dimers
Non-covalent interactions are rapidly gaining interest as they are often crucial in
determining the properties of materials, and key to supramolecular chemistry and
to biochemistry. Non-covalent Polycyclic Aromatic Hydrocarbon (PAH)
complexes are in particular relevant to astrochemistry and combustion chemistry
where they are involved in the initial steps of condensation and soot formation,
respectively. Here, we investigated non-covalent π-π stacking and CH-π
interactions in naphthalene and acenaphthene clusters using high resolution IR-UV
spectroscopy in combination with quantum chemical calculations. We identified
spectral shifts that occur upon complexation and thereby evaluated predicted
potential energy surfaces. The results provide strong indications for a prevalent
parallel naphthalene dimer, showing that π-π stacking interactions become
significant for bicyclic and larger PAHs.
Keywords: PAH clusters, infrared spectroscopy, π-π interactions, geometry, non-
covalent
1. Introduction
The interactions governing cluster formation of small PAH molecules are receiving
significant interest from both theoreticians and experimentalists[1–7]. The π-π stacking
and/or CH-π interactions that may be present in these archetypal complexes can have
important contributions to the structure of molecules or molecular complexes of interest
in astrochemistry[8–13], biochemistry[14–16] as well as in material sciences[17,18].
Understanding and modelling these interactions is therefore crucial to get a grip on the
structure of such molecular complexes, and thereby understand their function in biology
and how they determine the characteristics of materials. Moreover, the PAH clusters
studied here are of considerable interest to the combustion community[19,20] since they
are key players in the initial steps of soot formation, and to the astrochemistry
community because they form a link between isolated molecules and carbonaceous
grains[8–13].
The geometry of PAH dimers shows two different structural preferences
depending on their size. Large PAHs and even graphene favour a parallel geometry[3].
Alternatively, the significant body of experimental and theoretical work on the benzene
dimer and its derivatives indicate a T-shaped geometry as the global minimum[21–23]
with the parallel-displaced isomer being slightly higher in energy. Grimme[24], and
later Martinez and Iverson[14], concluded that π-π stacking interactions are strongly
size-dependent and becomes significant only for parallel complexes containing more
than 10-15 carbon atoms, i.e. from naphthalene or anthracene onwards. At a certain
PAH size, a turning point from a T-shaped geometry, as observed in the benzene dimer,
to a parallel geometry is expected, which is accompanied by a smooth change in
character of the noncovalent interactions[25]. Insight into the geometry of naphthalene(-
like) dimers would contribute to finding this turning point and validate the existing
theory of interactions between aromatic moieties.
A number of studies have been performed on the structure of the naphthalene
dimer. In most theoretical studies the (C2 crossed) parallel geometry was found to be
more stable than the T-shaped geometry[26–33] (see Figure 1). Interestingly, in larger
clusters such as the trimer[34] or the crystal structure of smaller PAHs[25,35] a non-
parallel structure, clearly differing from the parallel geometry of PAH dimers, is found.
Experimental studies using electronic spectroscopy or IR matrix isolation spectroscopy
have so far not provided a conclusive picture. Fluorescence spectroscopy suggests a
parallel geometry as it is favoured by the singlet excimers[36]. The excimer formation
appears to be a barrierless process, from which it has been concluded that the change in
geometry from the ground to the excited state is minimal. Further support for a parallel
geometry is provided by the Resonance Enhanced MultiPhoton Ionization (REMPI)
excitation spectrum of the non-parallel trimer -for which excimer formation is less
expected- which is much sharper than that of the dimer[37]. In contrast, Gilliéron et al.
concluded using REMPI spectroscopy that the naphthalene dimer-argonn complex
contained a T-shaped configuration[38]. A similar geometry was deduced from matrix
isolation IR spectroscopy[39]. However, in a later theoretical evaluation by
Bauschlicher and Ricca it was shown that argon stabilizes the T-shaped geometry
relative to the parallel geometries[40]. A definitive conclusion on the geometry of the
pure naphthalene dimer can therefore still not be drawn.
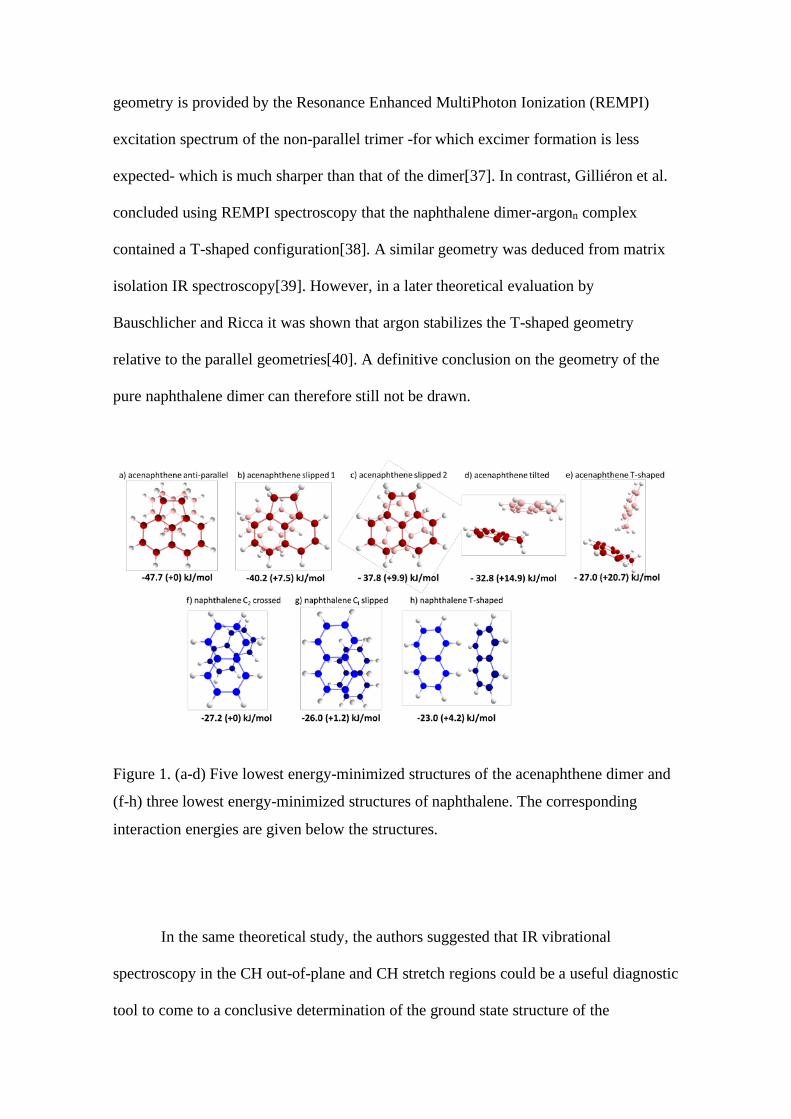
Figure 1. (a-d) Five lowest energy-minimized structures of the acenaphthene dimer and
(f-h) three lowest energy-minimized structures of naphthalene. The corresponding
interaction energies are given below the structures.
In the same theoretical study, the authors suggested that IR vibrational
spectroscopy in the CH out-of-plane and CH stretch regions could be a useful diagnostic
tool to come to a conclusive determination of the ground state structure of the

naphthalene dimer. In this work we therefore present IR absorption spectra of mass-
selected naphthalene clusters obtained by ion-dip spectroscopy and discuss the
implications of these spectra for the geometry of the naphthalene dimer. Besides the
naphthalene dimer, IR ion-dip spectra of acenaphthene monomer and dimer in the 3 µm
region are presented. In contrast to the naphthalene dimer, the structural preference of
the acenaphthene dimer appears to be more straightforward due to the influence of the
aliphatic groups as is supported by the theoretical calculations (see Figure 1). It can
therefore serve as a reference system in this study. At the same time it should be
remarked that experimentally it has not been possible to come to a definite conclusion.
Nevertheless, it is noteworthy that in microwave studies by Steber et al. the dimer was
not observed, which suggests that this dimer adopts preferably a parallel structure
[41,42]. An additional interesting aspect of this dimer is that it not only displays π-π
interactions but also CH-π interactions, which are evaluated here as well.
2. Methods
2.1 Experimental
Experiments on acenaphthene and naphthalene were performed on samples that were
heated to 80 °C in a glass sample compartment located just upstream of a Series 9
pulsed valve from General Valve. The valve was operated at 20 Hz using a backing
pressure of 2.5 bar of argon. The mixed gas was expanded into a vacuum chamber, after
which it passed through a skimmer. The molecular beam was excited by an IR beam in
the 3 μm region, provided by a Nd:YAG laser pumped OPO laser (Laser Vision) with a
bandwidth of about 0.1 cm-1 and operating at 10 Hz. Mid-IR experiments were
performed using radiation provided by the Free Electron Laser FELIX operating at 10
Hz[43]. After a delay of 200 ns the molecular beam was probed via REMPI with a
counterpropagating UV laser beam produced by a Nd:YAG laser pumped dye laser
(LiopTec) running at 20 Hz to acquire alternating IR-on and IR-off shots. The UV
photon energy was set to 31175 cm-1 for acenaphthene and 32299 cm-1 for the
naphthalene dimer corresponding to the maximized infrared ion gain signal and the 8�01
transition, respectively. The ionized molecules were detected in a reflectron time-of-
flight mass spectrometer (R. M. Jordan Co.). The idler frequency of the OPO laser was
calibrated continuously during measurements using a High Finesse WS-7 wavelength
meter.
2.2 Theoretical
DFT calculations were performed with the Gaussian16 suite of programs [44] using a
superfine grid and very tight optimization criteria. The energy minima of the
naphthalene and acenaphthene dimer structures depicted in Figure 1 were calculated at
the B3LYP-D3/Jun-cc-pVDZ level of theory, interaction energies being calculated by
subtracting two times the ZPE-corrected monomer energy from the ZPE-corrected
energy of the dimer. A small survey using the lowest-energy, antiparallel structure was
carried out to validate predicted spectra with the experimental spectra of the
acenaphthene dimer employing the B3LYP-D3BJ, B97-D3BJ, APFD, wB97XD,
M062X-D3, LC-wPBE-D3BJ functional in combination with the Jun-cc-pVDZ basis
set. The B3LYP functional was used with and without dispersion (and damping)
corrections to evaluate the effects of these corrections. To check the effect of a larger or
slightly different basis set, the B3LYP-D3 functional was also tested with the 6-
311++G** basis set. Since the survey did not produce qualitatively different results (see
Supplementary Figures 1 and 2), the calculations used for analysis of both the
acenaphthene and naphthalene spectra were performed at the B3LYP/Jun-cc-pVDZ
level of theory. To account for the dispersion interactions the D3 empirical dispersion
correction was applied[45]. Frequency calculations have been performed in the
harmonic approximation as well as anharmonically using GVPT2[46]. For a better
comparison with the experiment predicted spectra have been convoluted with a 1 cm-1
FWHM Gaussian unless stated otherwise.
3. Results and discussion
In the following, we will first evaluate the experimental and theoretical IR spectra of
acenaphthene as the structure of the dimer is more straightforward and microwave
studies suggest a parallel geometry[42]. Spectral characteristics in the aromatic CH
stretch region that reflect the geometry of the complex can subsequently be used in the
second part of the results section where the infrared spectrum of the naphthalene dimer
is discussed.
3.1 Acenaphthene
The acenaphthene monomer contains four out-of-plane hydrogens and two aromatic
rings. Intuitively, one expects complexes that enable both CH-π and π-π stacking
interactions to show the largest stabilization energies. This is indeed reflected by the
DFT energy-minimized structures in Figure 1a-e. In structures a-c both of these
interactions can be present, whereas in the higher-energy structures d and c only CH-π
interactions are present. Microwave spectroscopic studies have as yet not been able to
observe signals from the acenaphthene dimer, which would be in line with the
computational prediction that the non-polar anti-parallel structure is the lowest-energy
structure.[42] In this anti-parallel configuration, the out-of-plane hydrogen atoms are
oriented towards the aromatic rings of the opposite but equivalent monomer unit (see
Figure 1a). Additionally, all candidate complexes of the dimer-water complex that were
investigated with microwave spectroscopy involve a parallel dimer configuration[42].
Compared to the naphthalene dimer structures, the acenaphthene dimer shows a
significantly higher interaction energy for acenaphthene (47.7 kJ/mol) compared to a
maximum of 27.2 kcal/mol for naphthalene (Figure 1f). We ascribe the higher binding
energy of the acenaphthene dimer to the presence of CH-π interactions that are lacking
in the parallel structure of the naphthalene dimer. The T-shaped naphthalene dimer
could potentially have CH-π interactions, but in such geometries the π-π stacking
interactions would be absent and they would thus be at much higher energies.
The experimental 3 µm IR spectra of the acenaphthene monomer and dimer are
shown in Figure 2 together with the calculated IR spectra of the anti-parallel geometry.
The trimer spectrum is presented in Supplementary Figure 3 and calculated IR spectra
of slipped and T-shaped dimers are displayed in Supplementary Figure 4. At first sight,
the experimental spectra of the monomer, dimer and trimer are quite similar. The effect
of complexation is very subtle and manifests itself mostly in the aliphatic region (2800-
3000 cm-1) as a redshift of typically 5-6 cm-1 upon going from the monomer to the
dimer. Compared to the dimer, the trimer peak positions, on the other hand, do not
change significantly (see Supplementary Figure 3). The aromatic region (3000-3150 cm-
1) also shows a redshift, although the difference here is smaller (about <2 cm-1) than in
the aliphatic region. A more detailed analysis is provided in Supplementary Figures 5
and 6. Considering the lowest-energy structure of the dimer in Figure 1a, the larger red-
shift in the aliphatic region compared to shift in the aromatic region is in line with a
priori expectations since the aliphatic region is more susceptible to the CH-π
interactions. The observed redshift thus shows that such interactions are non-negligible
and important for assessing the driving forces of complex formation. A similar
conclusion is drawn from the observation that the strong band at 2944 cm-1 of the
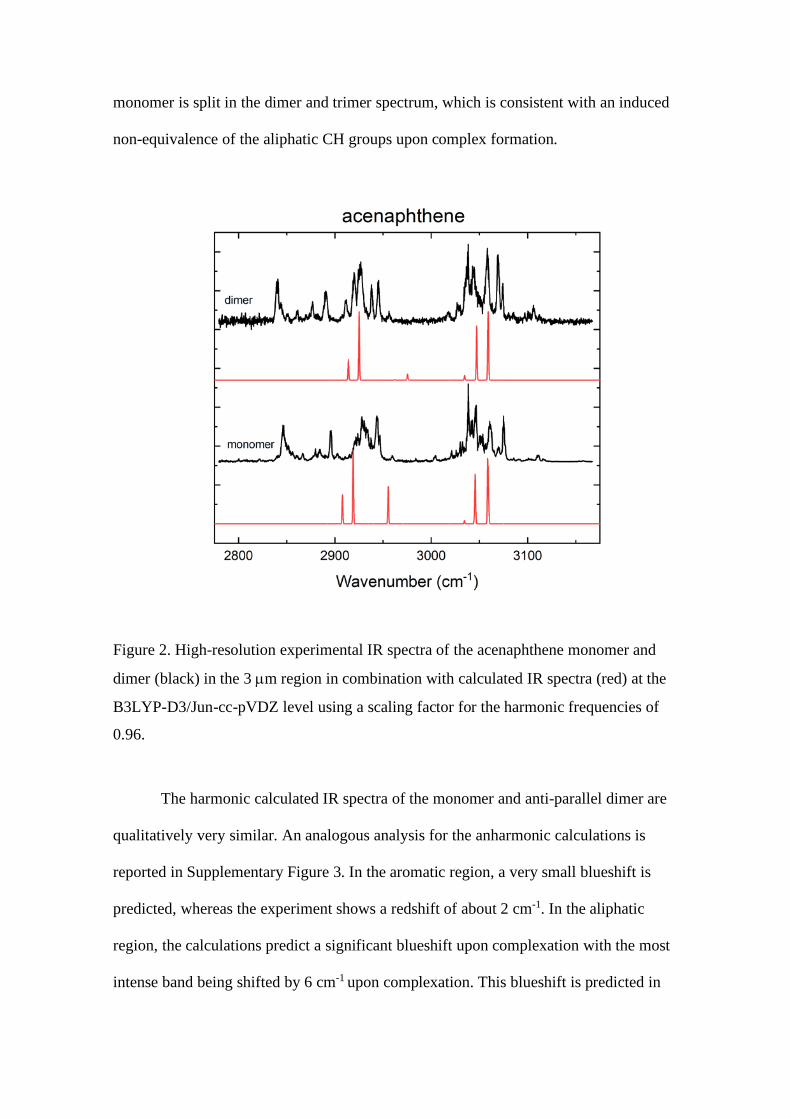
monomer is split in the dimer and trimer spectrum, which is consistent with an induced
non-equivalence of the aliphatic CH groups upon complex formation.
Figure 2. High-resolution experimental IR spectra of the acenaphthene monomer and
dimer (black) in the 3 µm region in combination with calculated IR spectra (red) at the
B3LYP-D3/Jun-cc-pVDZ level using a scaling factor for the harmonic frequencies of
0.96.
The harmonic calculated IR spectra of the monomer and anti-parallel dimer are
qualitatively very similar. An analogous analysis for the anharmonic calculations is
reported in Supplementary Figure 3. In the aromatic region, a very small blueshift is
predicted, whereas the experiment shows a redshift of about 2 cm-1. In the aliphatic
region, the calculations predict a significant blueshift upon complexation with the most
intense band being shifted by 6 cm-1 upon complexation. This blueshift is predicted in
almost all the calculations that we performed in a survey with a broad range of
functionals (see theoretical section and Supplementary Figure 1), the M062X-D3
functional being the only one that shows a small redshift. Such a blueshift is at odds
with the experimentally observed redshift, but might be related to the so-called
improper hydrogen bonds[47,48] that are not properly described at the employed levels
of theory. Although not of direct importance for the present study, the predicted
blueshift nevertheless requires further attention from theoretical studies, not only
because of the present observations but also because similar observations were made in
studies by Erlekam et al. on the benzene dimer.[22] In the aromatic region, the
intermolecular interactions in the (displaced) parallel configuration cause a small
decrease in the bond strength of the aromatic CHs resulting in the observed red-shift of
about 2 cm-1.
3.2 Naphthalene
Since the different configurations of the naphthalene dimer are close in energy, its
geometry is still under heavy debate. IR spectroscopy can contribute to the elucidation
of its structure[40] since both the CH stretch and CH out-of-plane modes are expected
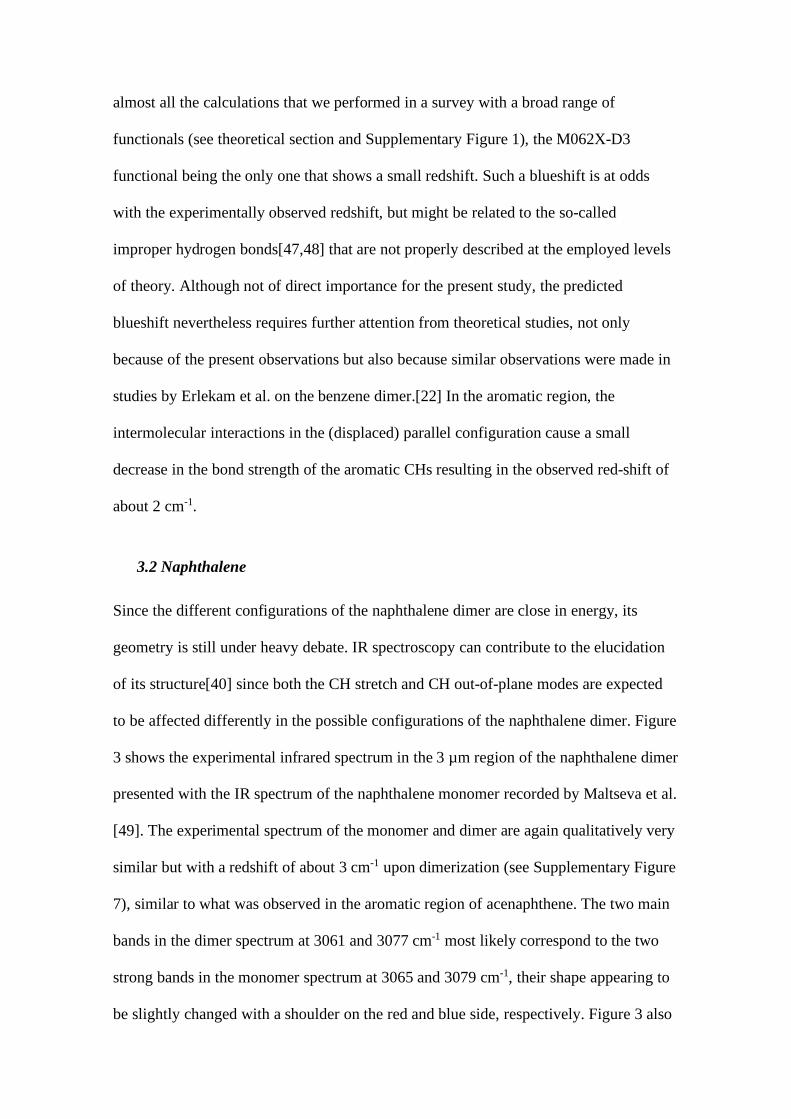
to be affected differently in the possible configurations of the naphthalene dimer. Figure
3 shows the experimental infrared spectrum in the 3 µm region of the naphthalene dimer
presented with the IR spectrum of the naphthalene monomer recorded by Maltseva et al.
[49]. The experimental spectrum of the monomer and dimer are again qualitatively very
similar but with a redshift of about 3 cm-1 upon dimerization (see Supplementary Figure
7), similar to what was observed in the aromatic region of acenaphthene. The two main
bands in the dimer spectrum at 3061 and 3077 cm-1 most likely correspond to the two
strong bands in the monomer spectrum at 3065 and 3079 cm-1, their shape appearing to
be slightly changed with a shoulder on the red and blue side, respectively. Figure 3 also

displays calculated IR spectra in the 3 µm region for the monomer, the T-shaped dimer,
the C2 crossed parallel dimer and the Ci slipped parallel dimer at the B3LYP-D3/Jun-cc-
pVDZlevel of theory (see Figure 1f-h for geometries and relative energies). The IR
spectrum of the monomer calculated at the harmonic level of theory matches
qualitatively with the experimental spectrum, i.e., two strong bands that are predicted
separated by approximately the experimentally observed energy. Even though
anharmonic calculations are necessary to make a full prediction of the spectrum (see
Supplementary Figure 8), we will use in the further discussion these harmonic spectra
as a main guide to interpret the effects of complexation in order to avoid unnecessary
complications of such a discussion.
The calculated harmonic IR spectra of the dimer can be divided into two groups.
The two parallel geometries, C2 crossed and Ci slipped, contain equivalent monomer
units and lead to infrared spectra that are similar to the monomer spectrum with the
main peaks being split as a result of the dimer formation. In contrast, the T-shaped
geometry exhibits two non-equivalent monomer units of which one is significantly
affected by dimer formation. This results in the activation of previously IR-inactive
modes and leads to an IR spectrum that is quite different from the spectra of the parallel
geometries and that shows a larger number of bands. The similarity between the
experimentally observed IR spectra of the monomer and dimer thus strongly suggests
that the dimer adopts a parallel structure and not a T-shaped geometry. Further support
for this conclusion is found in the shoulders on the main bands in the experimental
spectrum which nicely can be explained by the splitting of the two main peaks as
predicted by theory for the parallel geometries.
Figure 3. High-resolution IR spectra of the naphthalene monomer (obtained by
Maltseva et al.[49]) and the dimer (black) in combination with predicted spectra of the
configurations presented in Figure 1 (T-shaped (purple), C2 crossed parallel and Ci
slipped parallel (blue)) at the B3LYP-D3/Jun-cc-pVDZ level of theory using the
harmonic approximation and a frequency scaling factor of 0.96.
The main features in the harmonic calculations of the naphthalene monomer
coincide with the features that are predicted in the aromatic region of the acenaphthene
monomer. This is not surprising since the aromatic parts of the two molecules are
similar. From our studies on acenaphthene we concluded that the dimer predominantly
adopts a parallel conformation, while we concluded above for naphthalene that the 3 µm
region also suggests a parallel dimer. One might therefore expect both molecules to
show similar spectral shifts upon dimerization. Since such shifts are small, the effect of
dimerization is better visualized in difference spectra constructed by subtracting the IR
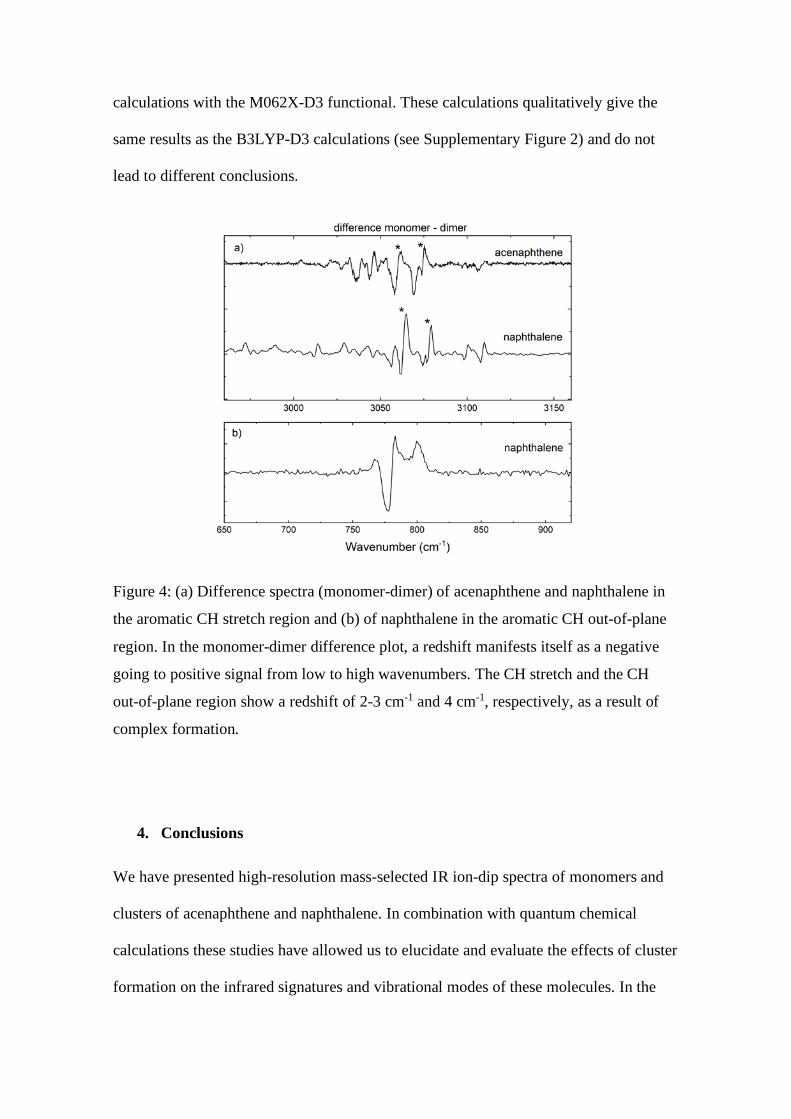
spectrum of the dimer from that of the monomer, which are depicted in Figure 4. Figure
4a shows that for both molecules overall a similar red-shift is observed in the main
features, which manifests itself in the difference spectrum as a negative going to
positive signal from low to high wavenumbers. The features observed for acenaphthene
between 3020-3040 cm-1, which are not present in the difference spectrum of
naphthalene, result from the coupling between aliphatic and aromatic groups[50,51].
Our calculations indicate that the two main bands indicated by an asterisk in both the
spectrum of acenaphthene (3060 and 3072 cm-1 at highest slope) and naphthalene (3063
and 3078 cm-1 at highest slope) are associated with normal modes that are very similar
in the two molecules. Our experiments show that both modes undergo a similar shift
upon complex formation. This is in line with what would be expected if both molecules
would have a similar (parallel) geometric arrangement of the monomer units.
Stronger support for the conclusion that the naphthalene dimer adopts a parallel
geometry comes from the difference spectrum in the mid-IR region (Figure 4b) where
an overall redshift is observed upon complexation. The major advantage of this region
is that it is much less affected by Fermi-resonances and that calculations are therefore
more reliable[52]. Theoretical studies of Bauschlicher and coworkers have shown that a
parallel configuration of the monomer units would lead to a redshift[40]. Our
calculations (Supplementary Figure 2) predict indeed a redshift of 5 cm-1 for a parallel
orientation, which compares well with the experimentally observed redshift of 4 cm-1.
For the T-shaped orientation, in contrast, a nonsignificant blueshift is predicted. We
recall that for the aliphatic region of the acenaphthene dimer only M062X-D3
functional correctly predicted the experimentally observed red shift. In order to ensure
that the signs and magnitudes of the shifts calculated here at the B3LYP level for the
mid-IR region are not dependent on the level of theory, we have performed similar
calculations with the M062X-D3 functional. These calculations qualitatively give the
same results as the B3LYP-D3 calculations (see Supplementary Figure 2) and do not
lead to different conclusions.
Figure 4: (a) Difference spectra (monomer-dimer) of acenaphthene and naphthalene in
the aromatic CH stretch region and (b) of naphthalene in the aromatic CH out-of-plane
region. In the monomer-dimer difference plot, a redshift manifests itself as a negative
going to positive signal from low to high wavenumbers. The CH stretch and the CH
out-of-plane region show a redshift of 2-3 cm-1 and 4 cm-1, respectively, as a result of
complex formation.
4. Conclusions
We have presented high-resolution mass-selected IR ion-dip spectra of monomers and
clusters of acenaphthene and naphthalene. In combination with quantum chemical
calculations these studies have allowed us to elucidate and evaluate the effects of cluster
formation on the infrared signatures and vibrational modes of these molecules. In the
case of acenaphthene we have found that the aliphatic CH-π interactions result in a
redshift and possible splitting of the corresponding vibrational bands upon dimerization.
Such a redshift in general indicates a weaker bond, and we can thus conclude that the
CH-π interaction affects the aliphatic bonds as expected. Interestingly, DFT calculations
predict a blueshift and this is certainly an aspect that deserves further theoretical
attention. In the aromatic region of both naphthalene and acenaphthene dimers a small
redshift is observed.
Using the diagnostic features for a particular geometry and interactions that the
studies on acenaphthene provided, the experimental and theoretical results obtained for
the naphthalene dimer provide strong indications that this dimer predominantly adopts a
parallel configuration. Firstly, the naphthalene dimer high-resolution IR spectrum shows
a large resemblance with the parallel acenaphthene dimer IR spectrum in the aromatic
CH stretch region. Secondly, the CH out-of-plane band is redshifted which is a strong
diagnostic feature of a parallel configuration. Our experiments thus support the
theoretical prediction of a prevalent parallel configuration of the naphthalene dimer in
which π-π stacking interactions are enabled. This is in line with the general idea that π-π
stacking interactions become significant for more than 10-15 carbon atoms.
Acknowledgements
We thank the FELIX laboratory team for their experimental assistance and scientific
support and we acknowledge the Nederlandse Organisatie voor Wetenschappelijk
Onderzoek (NWO) for the support of the FELIX Laboratory and SURFsara for their
computational resources. This work was also supported by the ERC Starting grant
“ASTROROT”, grant number 638027, and the Deutsche Forschungsgemeinschaft
(SCHN1280/4-2, grant number 271359857) in the context of the priority program SPP
1807 “Control of London dispersion interactions in molecular chemistry”.
Declaration of interest
The authors declare that there is no conflict of interest regarding the publication of this article
5. References
[1] P.M. Felker, P.M. Maxton, and M.W. Schaeffer, Chem. Rev. 94, 1787 (1994).
[2] S. Speiser, Chem. Rev. 96, 1953 (1996).
[3] S. Grimme, J. Antony, S. Ehrlich, and H. Krieg, J. Chem. Phys. 132, 154104 (2010).
[4] J. Moellmann and S. Grimme, J. Phys. Chem. C 118, 7615 (2014).
[5] S. Grimme, C. Mück-Lichtenfeld, and J. Antony, J. Phys. Chem. C 111, 11199
(2007).
[6] A. Potapov, Mol. Astrophys. 6, 16 (2017).
[7] M. Fatima, A.L. Steber, A. Poblotzki, C. Pérez, S. Zinn, and M. Schnell, Angew.
Chemie - Int. Ed. 58, 3108 (2019).
[8] M. Rapacioli, F. Calvo, F. Spiegelman, C. Joblin, and D.J. Wales, J. Phys. Chem. A
109, 2487 (2005).
[9] F. Salama, Proc. Int. Astron. Union 4, 357 (2008).
[10] C. Jäger, F. Huisken, H. Mutschke, I.L. Jansa, and T. Henning, Astrophys. J. 696,

706 (2009).
[11] A.G.G.M. Tielens, Annu. Rev. Astron. Astrophys 46, 289 (2008).
[12] A.K. Lemmens, D.B. Rap, J.M.M. Thunnissen, B. Willemsen, and A.M. Rijs, Nat.
Commun. 11, 1 (2020).
[13] A.K. Lemmens, S. Gruet, A.L. Steber, J. Antony, S. Grimme, M. Schnell, and
A.M. Rijs, Phys. Chem. Chem. Phys. (2018).
[14] C.R. Martinez and B.L. Iverson, Chem. Sci. 3, 2191 (2012).
[15] K. Schwing and M. Gerhards, Int. Rev. Phys. Chem. 35, 569 (2016).
[16] S. Bakels, E.M. Meijer, M. Greuell, S.B.A. Porskamp, G. Rouwhorst, J. Mahé,
M.P. Gaigeot, and A.M. Rijs, Faraday Discuss. 217, 322 (2019).
[17] X. Feng, M. Liu, W. Pisula, M. Takase, J. Li, and K. Müllen, Adv. Mater. 20, 2684
(2008).
[18] R. Fitzner, C. Elschner, M. Weil, C. Uhrich, C. Körner, M. Riede, K. Leo, M.
Pfeiffer, E. Reinold, E. Mena-Osteritz, and P. Bäuerle, Adv. Mater. 24, 675 (2012).
[19] K.O. Johansson, M.P. Head-Gordon, P.E. Schrader, K.R. Wilson, and H.A.
Michelsen, Science 361, 997 (2018).
[20] M. Thomson and T. Mitra, Science 361, 978 (2018).
[21] R.H. Page, Y.R. Shen, and Y.T. Lee, J. Chem. Phys. 88, 4621 (1988).
[22] U. Erlekam, M. Frankowski, G. Meijer, and G. Von Helden, J. Chem. Phys. 124,
(2006).

[23] M. Schnell, U. Erlekam, P.R. Bunker, G. Vonhelden, J.U. Grabow, G. Meijer, and
A. Vanderavoird, Angew. Chemie - Int. Ed. 52, 5180 (2013).
[24] S. Grimme, Angew. Chemie - Int. Ed. 47, 3430 (2008).
[25] S.M. Ryno, C. Risko, and J.L. Brédas, Chem. Mater. 28, 3990 (2016).
[26] C. Gonzalez and E.C. Lim, J. Phys. Chem. A 104, 2953 (2000).
[27] S. Tsuzuki, K. Honda, T. Uchimaru, and M. Mikami, J. Chem. Phys. 120, 647
(2004).
[28] T.R. Walsh, Chem. Phys. Lett. 363, 45 (2002).
[29] N.K. Lee, S. Park, and S.K. Kim, J. Chem. Phys. 116, 7910 (2002).
[30] M. Saeki, H. Akagi, and M. Fujii, J. Chem. Theory Comput. 2, 1176 (2006).
[31] C. Gonzalez and E.C. Lim, J. Phys. Chem. A 107, 10105 (2003).
[32] T. Sato, T. Tsuneda, and K. Hirao, J. Chem. Phys. 123, (2005).
[33] R. Podeszwa and K. Szalewicz, Phys. Chem. Chem. Phys. 10, 2581 (2008).
[34] P. Benharash, M.J. Gleason, and P.M. Felker, J. Phys. Chem. A 103, 1442 (1999).
[35] M. Rapacioli, F. Calvo, F. Spiegelman, C. Joblin, and D.J. Wales, J. Phys. Chem.
A 109, 2487 (2005).
[36] H. Saigusa and E.C. Lim, Acc. Chem. Res. 29, 171 (1996).
[37] T. Fujiwara and E.C. Lim, (2003).
[38] C. Gilliéron, N. Sharma, K. Nauta, and T.W. Schmidt, J. Phys. Chem. A 111, 4211
(2007).
[39] J.E. Roser and L.J. Allamandola, Astrophys. J. 722, 1932 (2010).
[40] C.W. Bauschlicher and A. Ricca, Theor. Chem. Acc. 132, 1 (2013).
[41] A.L. Steber, C. Pérez, B. Temelso, G.C. Shields, A.M. Rijs, B.H. Pate, Z. Kisiel,
and M. Schnell, J. Phys. Chem. Lett. 8, 5744 (2017).
[42] A.L. Steber, Personal Communication April 14 (2020).
[43] D. Oepts, A.F.G. Van, D. Meer, and P.W. Van Amersfoort, Infrared Phys. Technol.
36, 297 (1995).
[44] M.J.G. Frisch, W. Trucks, H.B. Schlegel, G.E. Scuseria, M.A. Robb, J.R.
Cheeseman, G. Scalmani, V. Barone, B. Mennucci, G.A. Petersson, H. Nakatsuji, M.
Caricato, X. Li, H.P. Hratchian, A.F. Izmaylov, J. Bloino, G. Zheng, and J.L.
Sonnenberg, Gaussian 16, Rev. A.03 (2016).
[45] S. Grimme, J. Antony, S. Ehrlich, and H. Krieg, J. Chem. Phys. 132, 154104
(2010).
[46] J. Bloino, J. Phys. Chem. A 119, 5269 (2015).
[47] J. Joseph and E.D. Jemmis, J. Am. Chem. Soc. 129, 4620 (2007).
[48] P. Hobza and Z. Havlas, Theor. Chem. Acc. 325 (2002).
[49] E. Maltseva, A. Petrignani, A. Candian, C.J. Mackie, X. Huang, T.J. Lee,
A.G.G.M. Tielens, J. Oomens, and W.J. Buma, Astrophys. J. 814, (2016).
[50] E. Maltseva, C.J. Mackie, A. Candian, A. Petrignani, X. Huang, T.J. Lee,

A.G.G.M. Tielens, J. Oomens, and W.J. Buma, Astron. Astrophys. 610, (2018).
[51] P.R. Franke, D.P. Tabor, C.P. Moradi, G.E. Douberly, J. Agarwal, H.F. Schaefer,
and E.L. Sibert, J. Chem. Phys. 145, 224304 (2016).
[52] A.K. Lemmens, D.B. Rap, J.M.M. Thunnissen, C.J. Mackie, A. Candian,
A.G.G.M. Tielens, A.M. Rijs, and W.J. Buma, Astron. Astrophys. 628, A130 (2019).

download fileview on ChemRxivIR study on ACE_NAPH_LemmensRijs.pdf (479.29 KiB)
SUPPLEMENTARY INFORMATION
High resolution infrared spectroscopy of naphthalene and
acenaphthene dimers
Alexander Lemmensa,b, Pragya Choprac, Diksha Gargc, Amanda Steberc,
Melanie Schnellc,d, Wybren Jan Bumaa,b*, Anouk M. Rijsb*
aFELIX Laboratory, Institute of Molecules and Materials, Radboud University,
Nijmegen, The Netherlands; bVan ‘t Hoff Institute for Molecular Sciences, University
of Amsterdam, Amsterdam, The Netherlands; cDeutsches Elektronen-Synchrotron
DESY, Hamburg, Germany; dChristian-Albrechts-Universität zu Kiel, Institut für
Physikalische Chemie, Kiel, Germany
Radboud University, Institute of Molecules and Materials, FELIX Laboratory, Toernooiveld 7, 6525 ED Nijmegen, The Netherlands, *E-mail: [email protected] University of Amsterdam, Science Park 904, 1098 XH Amsterdam, The Netherlands, *E-mail: [email protected] Deutsches Elektronen-Synchrotron DESY, Notkestraße 85, 22607 Hamburg, Germany Christian-Albrechts-Universität zu Kiel, Institut für Physikalische Chemie, Max-Eyth-Straße 1, 24118 Kiel, Germany CONTENT
1. Theory survey investigating the effect of dispersion corrections D3 and BJ as well as different basis sets and functionals on the spectral shifts upon complexation of acenaphthene
2. The effect of different functionals on the IR band of the CH out-of-plane mode of naphthalene and of the naphthalene dimer as follow-up on the survey on acenaphthene
3. High-resolution IR spectra of acenaphthene monomer, dimer and trimer compared to both harmonic and anharmonic theoretical spectra
4. Detailed comparison of experimental monomer and dimer spectra of acenaphthene in the aromatic CH stretch region
5. Detailed comparison of experimental monomer and dimer spectra of acenaphthene in the aliphatic CH stretch region
6. Detailed comparison of experimental monomer and dimer spectra of naphthalene in the CH stretch region
7. High-resolution IR spectra of naphthalene monomer and dimer compared to both harmonic and anharmonic theoretical spectra
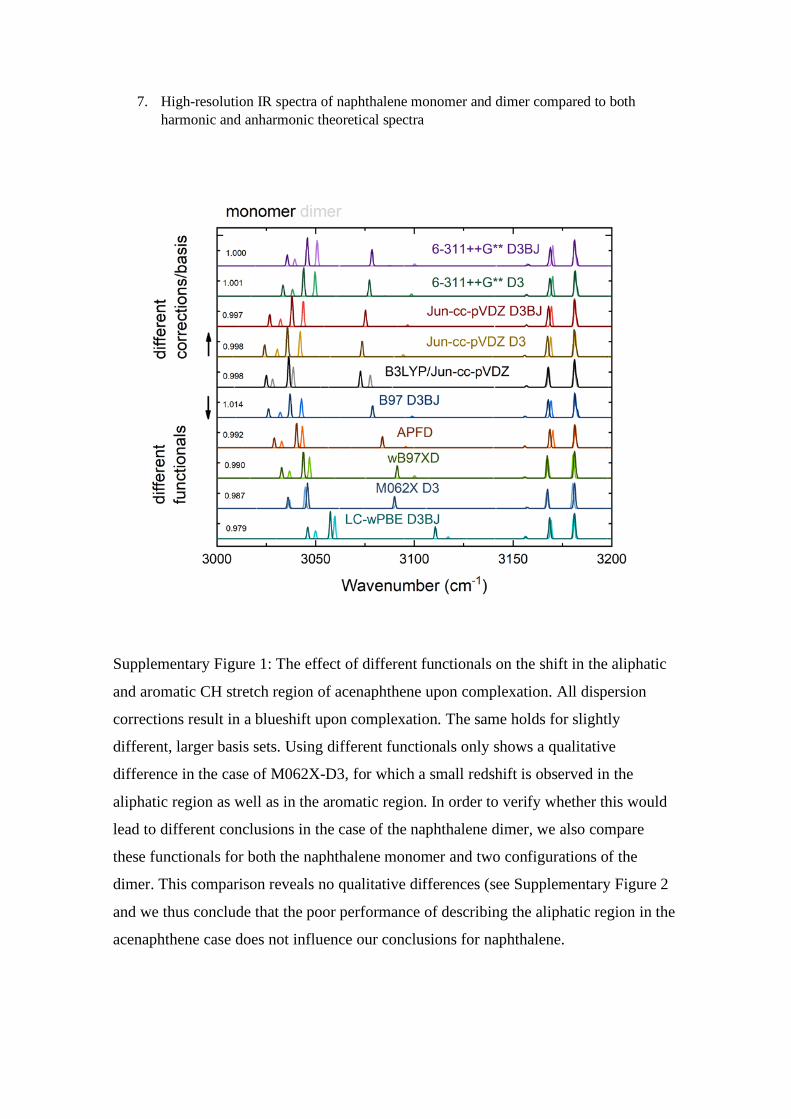
Supplementary Figure 1: The effect of different functionals on the shift in the aliphatic
and aromatic CH stretch region of acenaphthene upon complexation. All dispersion
corrections result in a blueshift upon complexation. The same holds for slightly
different, larger basis sets. Using different functionals only shows a qualitative
difference in the case of M062X-D3, for which a small redshift is observed in the
aliphatic region as well as in the aromatic region. In order to verify whether this would
lead to different conclusions in the case of the naphthalene dimer, we also compare
these functionals for both the naphthalene monomer and two configurations of the
dimer. This comparison reveals no qualitative differences (see Supplementary Figure 2
and we thus conclude that the poor performance of describing the aliphatic region in the
acenaphthene case does not influence our conclusions for naphthalene.
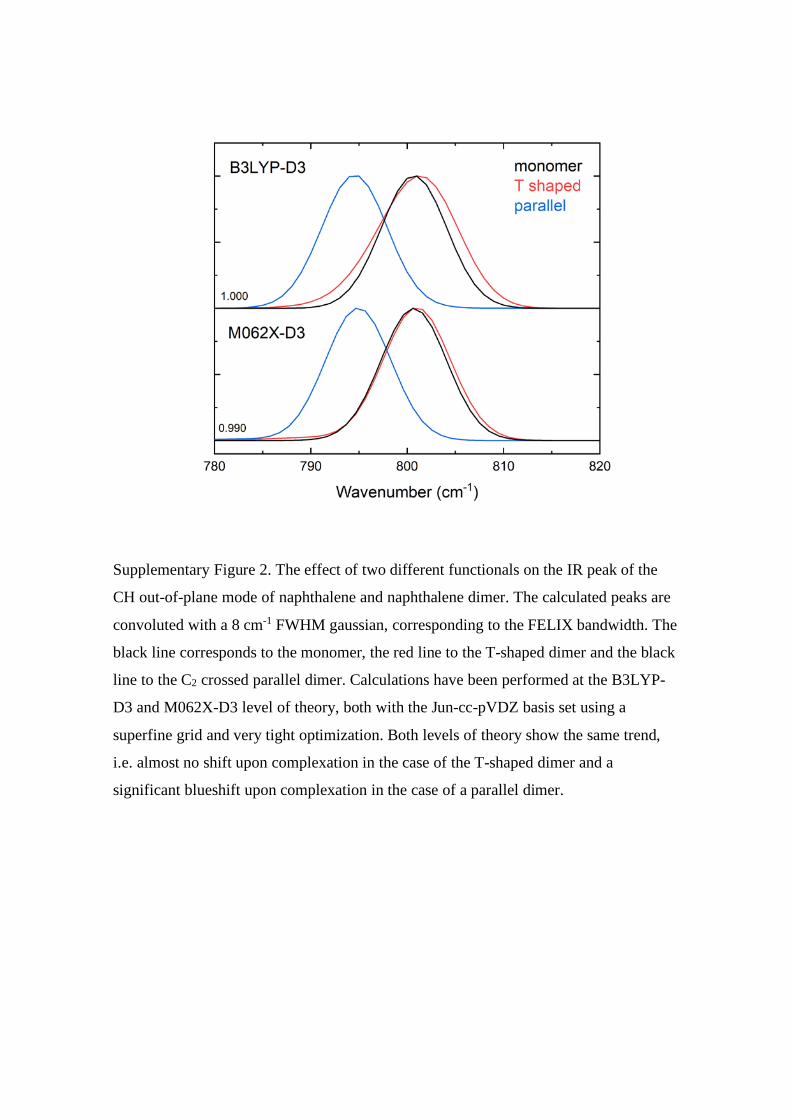
Supplementary Figure 2. The effect of two different functionals on the IR peak of the
CH out-of-plane mode of naphthalene and naphthalene dimer. The calculated peaks are
convoluted with a 8 cm-1 FWHM gaussian, corresponding to the FELIX bandwidth. The
black line corresponds to the monomer, the red line to the T-shaped dimer and the black
line to the C2 crossed parallel dimer. Calculations have been performed at the B3LYP-
D3 and M062X-D3 level of theory, both with the Jun-cc-pVDZ basis set using a
superfine grid and very tight optimization. Both levels of theory show the same trend,
i.e. almost no shift upon complexation in the case of the T-shaped dimer and a
significant blueshift upon complexation in the case of a parallel dimer.
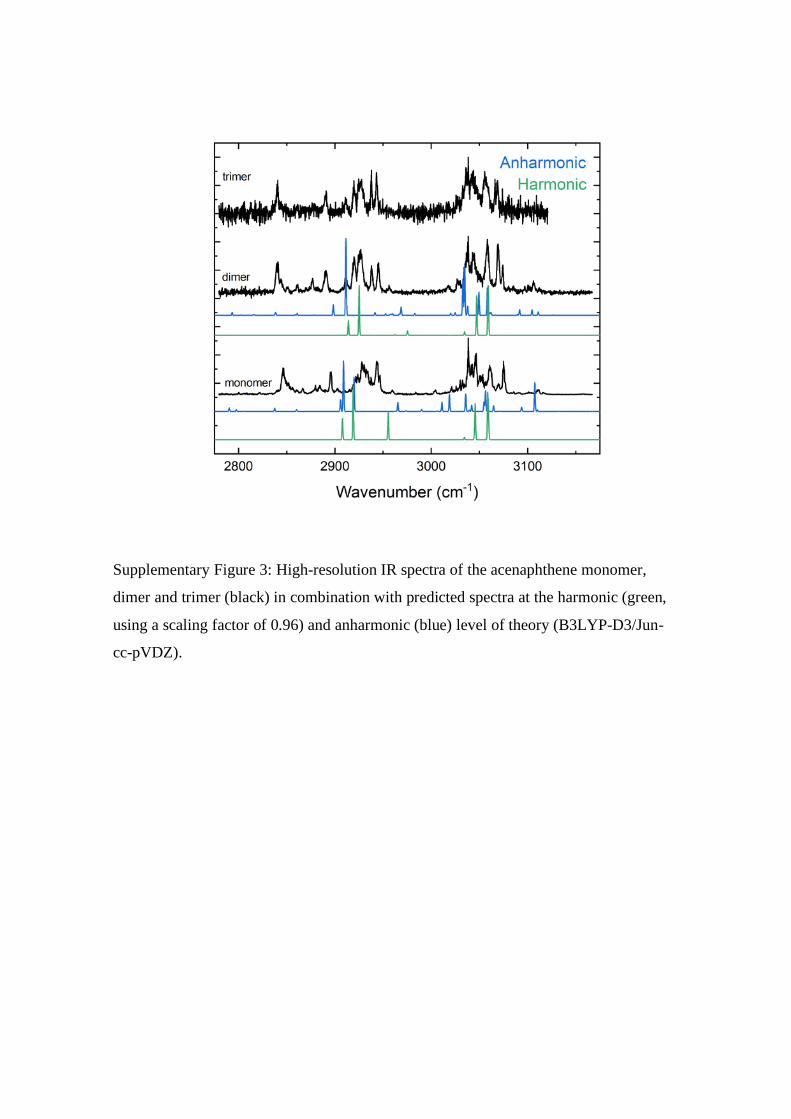
Supplementary Figure 3: High-resolution IR spectra of the acenaphthene monomer,
dimer and trimer (black) in combination with predicted spectra at the harmonic (green,
using a scaling factor of 0.96) and anharmonic (blue) level of theory (B3LYP-D3/Jun-
cc-pVDZ).
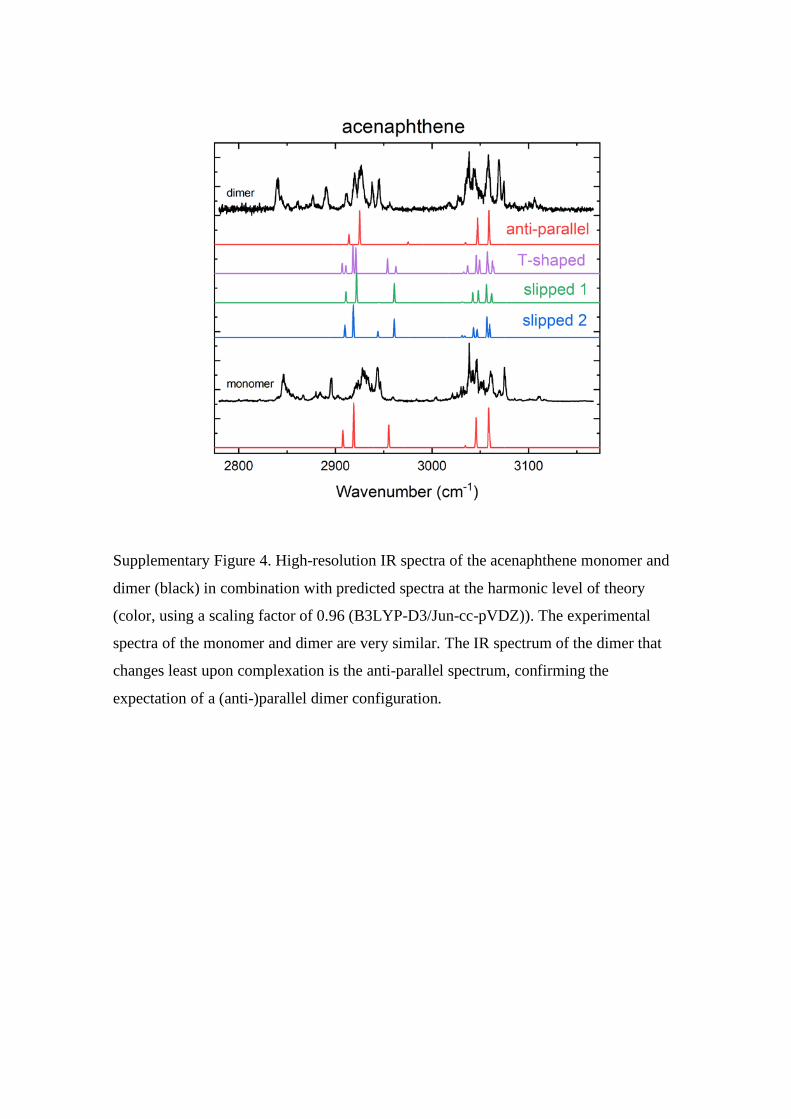
Supplementary Figure 4. High-resolution IR spectra of the acenaphthene monomer and
dimer (black) in combination with predicted spectra at the harmonic level of theory
(color, using a scaling factor of 0.96 (B3LYP-D3/Jun-cc-pVDZ)). The experimental
spectra of the monomer and dimer are very similar. The IR spectrum of the dimer that
changes least upon complexation is the anti-parallel spectrum, confirming the
expectation of a (anti-)parallel dimer configuration.
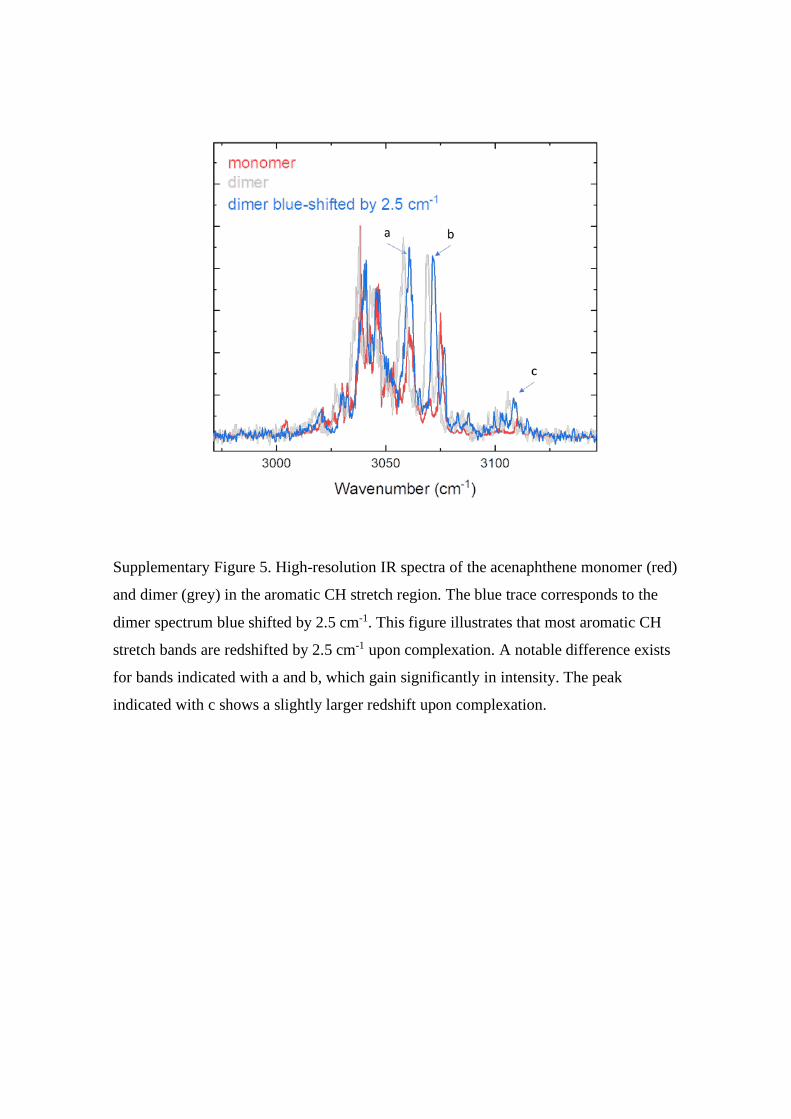
Supplementary Figure 5. High-resolution IR spectra of the acenaphthene monomer (red)
and dimer (grey) in the aromatic CH stretch region. The blue trace corresponds to the
dimer spectrum blue shifted by 2.5 cm-1. This figure illustrates that most aromatic CH
stretch bands are redshifted by 2.5 cm-1 upon complexation. A notable difference exists
for bands indicated with a and b, which gain significantly in intensity. The peak
indicated with c shows a slightly larger redshift upon complexation.
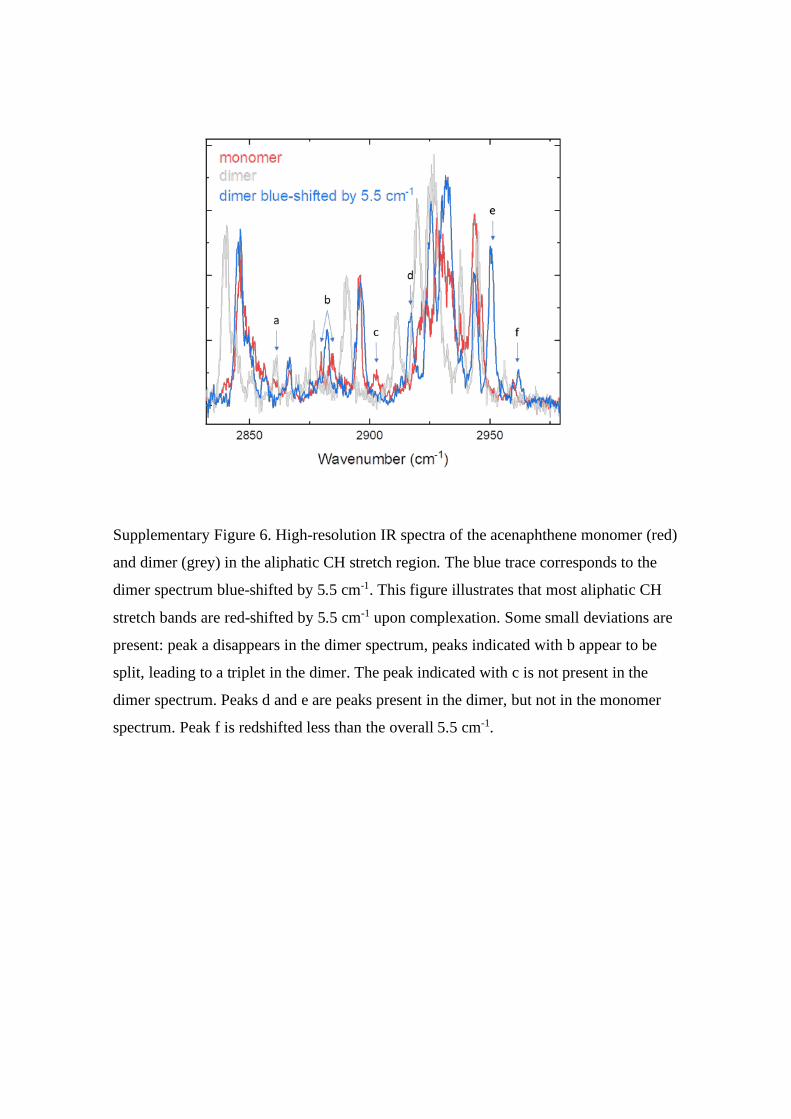
Supplementary Figure 6. High-resolution IR spectra of the acenaphthene monomer (red)
and dimer (grey) in the aliphatic CH stretch region. The blue trace corresponds to the
dimer spectrum blue-shifted by 5.5 cm-1. This figure illustrates that most aliphatic CH
stretch bands are red-shifted by 5.5 cm-1 upon complexation. Some small deviations are
present: peak a disappears in the dimer spectrum, peaks indicated with b appear to be
split, leading to a triplet in the dimer. The peak indicated with c is not present in the
dimer spectrum. Peaks d and e are peaks present in the dimer, but not in the monomer
spectrum. Peak f is redshifted less than the overall 5.5 cm-1.
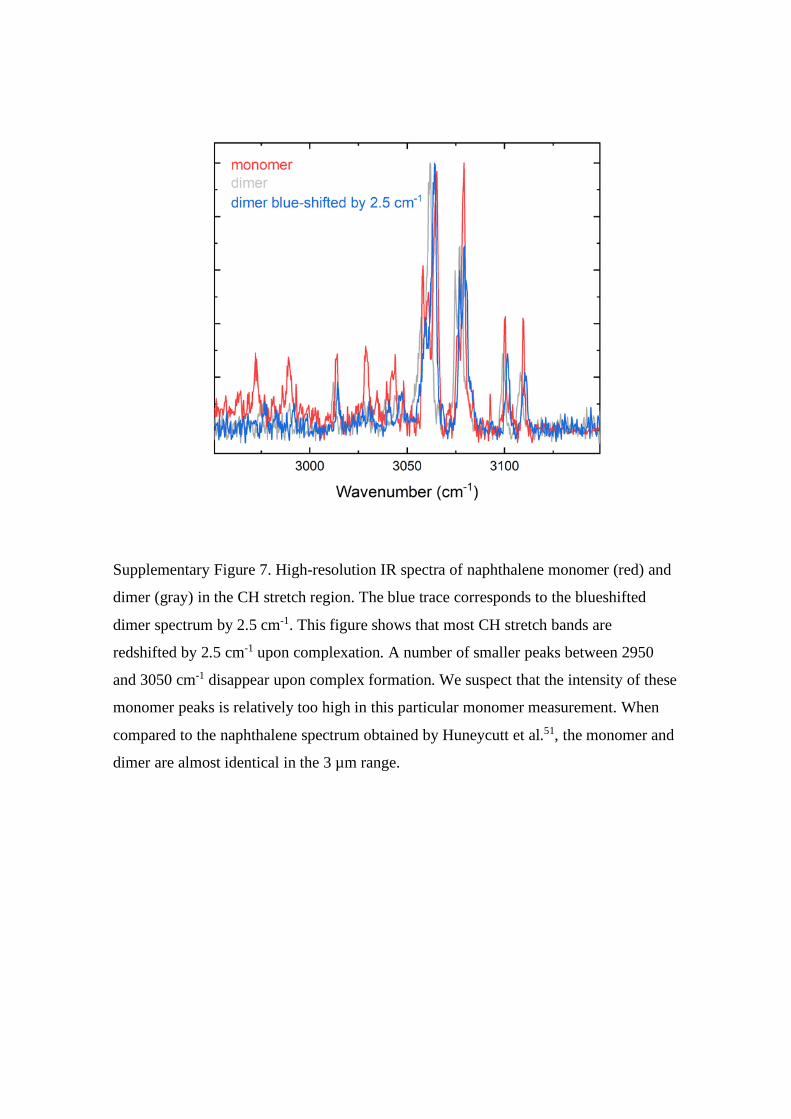
Supplementary Figure 7. High-resolution IR spectra of naphthalene monomer (red) and
dimer (gray) in the CH stretch region. The blue trace corresponds to the blueshifted
dimer spectrum by 2.5 cm-1. This figure shows that most CH stretch bands are
redshifted by 2.5 cm-1 upon complexation. A number of smaller peaks between 2950
and 3050 cm-1 disappear upon complex formation. We suspect that the intensity of these
monomer peaks is relatively too high in this particular monomer measurement. When
compared to the naphthalene spectrum obtained by Huneycutt et al.51, the monomer and
dimer are almost identical in the 3 µm range.
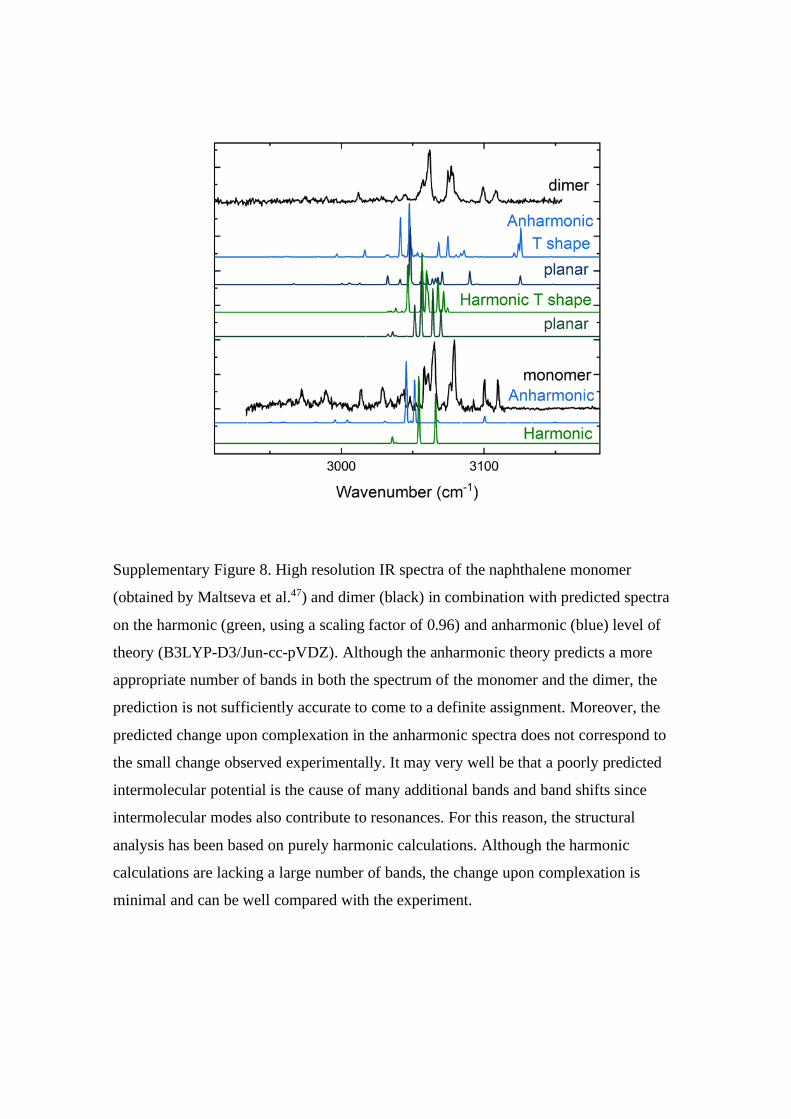
Supplementary Figure 8. High resolution IR spectra of the naphthalene monomer
(obtained by Maltseva et al.47) and dimer (black) in combination with predicted spectra
on the harmonic (green, using a scaling factor of 0.96) and anharmonic (blue) level of
theory (B3LYP-D3/Jun-cc-pVDZ). Although the anharmonic theory predicts a more
appropriate number of bands in both the spectrum of the monomer and the dimer, the
prediction is not sufficiently accurate to come to a definite assignment. Moreover, the
predicted change upon complexation in the anharmonic spectra does not correspond to
the small change observed experimentally. It may very well be that a poorly predicted
intermolecular potential is the cause of many additional bands and band shifts since
intermolecular modes also contribute to resonances. For this reason, the structural
analysis has been based on purely harmonic calculations. Although the harmonic
calculations are lacking a large number of bands, the change upon complexation is
minimal and can be well compared with the experiment.

download fileview on ChemRxivsupplementary information_ACE_Naph_LemmensRijs.pdf (913.80 KiB)
Recommended


![Infrared Spectroscopy[1]](https://img.dokumen.tips/doc/110x75/5415f1617bef0a7f3f8b49ff/infrared-spectroscopy1.jpg)

