DELL POWER SOLUTIONS | February 20081
feature section:GreeninG the data center
Reprinted from Dell Power Solutions, February 2008. Copyright © 2008 Dell Inc. All rights reserved.
While high-density, high-performance
servers can offer significant advan-
tages, they can also create significant
challenges—particularly for those responsible for
cooling and maintaining the data center environ-
ment. To help keep systems functioning reliably, IT
staff must keep the temperature of the cooling air
entering the equipment within a certain range. The
traditional approach to designing a cooling system
involves matching the total cooling capacity with
the total heat load, but does not take into account
how the cooling air moves through the data center.
This approach is often highly ineffective, leading
to overdesign despite its inability to eliminate
cooling problems.
A 2007 U.S. Environmental Protection Agency
report estimates that U.S. data centers consumed
61 billion kWh in 2006 (1.5 percent of total U.S. elec-
tricity consumption), for a total electricity cost of
approximately US$4.5 billion—and that 50 percent of
these costs were associated with power and cooling
systems.1 Even a modest increase in cooling efficiency
could lead to a significant reduction in overall power
consumption and associated costs.
The typical life of a data center can reach 10–15
years, and active IT equipment refreshes commonly
occur every 3–5 years, so organizations must plan
their infrastructure to support up to three generations
of IT equipment. The power; heating, ventilation, and
air-conditioning (HVAC); and networking systems are
key elements in the facilities infrastructure, and are
expected to supply power, cooling, and networking
now and to meet growing demands over time. As
data center heat loads continue to increase along
with processing power and density, each generation
of hardware will likely place additional demands on
existing infrastructures.
Combined with best practices for data center
design, airflow modeling through computational fluid
dynamics (CFD) can help organizations analyze the
characteristics of their current environment, recon-
figure their layout for optimal cooling, and plan for
future IT requirements, with the goal of increasing
efficiency, reducing costs, and extending the lifespan
of their data center. For simplicity, the examples in
this article are based on a raised-floor configuration
with under-floor cooling, but the concepts can apply
to other cooling configurations as well.
As server power and density continue to increase, efficient cooling has become key to controlling costs. Predictive modeling based on computational fluid dynamics enables enterprises to configure their data centers for optimal cooling, helping maximize efficiency, reduce costs, and meet both current and future IT requirements.
By Paul Rad
Kailash Karki, Ph.D.
Tim Webb
HigH-EfficiEncy cooling THrougH compuTaTional fluid dynamics
Related Categories:
Computational fluiddynamics (CFD)
Data center cooling
Data center technology
Power and cooling
Visit DELL.COM/PowerSolutions
for the complete category index.
1 “Report to Congress on Server and Data Center Energy Efficiency: Public Law 109-431,” by the U.S. Environmental Protection Agency, August 2, 2007, www.energystar.gov/ia/partners/prod_development/downloads/EPA_Datacenter_Report_Congress_Final1.pdf.
2DELL.COM/PowerSolutionsReprinted from Dell Power Solutions, February 2008. Copyright © 2008 Dell Inc. All rights reserved.
computational fluid dynamics and airflow distributionThe airflow distribution in a raised-floor
data center is nonuniform, and varies
based on factors such as the height of the
under-floor plenum, the locations and
characteristics of air-conditioning units,
the layout and open area of perforated
tiles, and the location and size of under-
floor obstructions. These factors can affect
airflow distribution in a complex and often
nonintuitive way. As a result, traditional
approaches—which rely on empirical
guidelines or simple trial and error—are
typically inadequate. CFD-based airflow
modeling can overcome the limitations of
traditional approaches to help create opti-
mal cooling configurations.
CFD helps predict airflow and related
processes by numerically solving the equa-
tions governing these processes. It involves
constructing a computer model of the
system (such as a raised-floor data center),
applying the equations governing the rel-
evant physical processes, and solving
these equations. The result is the values of
the relevant variables—velocities, pressure,
temperature, and so on—throughout
the system.
For a raised-floor data center, a CFD
model can provide detailed information on
the air velocities, pressures, temperatures,
flow rates through perforated tiles and
extraneous openings (such as unsealed
cable cutouts), rack inlet temperatures, and
return-air temperatures for air-conditioning
units. This information can help identify
overheated racks, hot spots, and short
cycling of cold air as well as the underlying
causes of these problems, which organiza-
tions can then work to correct.
calculating server heat load and airflow demandThe accuracy of temperatures calculated by
a CFD model depends greatly on the speci-
fied server heat loads. The model must use
the actual heat load (dissipation) of the
server, not the nameplate value, which is the
rated maximum power of the computer
equipment and is typically much higher than
the actual power consumption. The actual
heat load depends on the workload running
on the server. Server manufacturers often
provide online calculators, such as the Dell
Datacenter Capacity Planner tool available
at DELL.COM/Calc, to estimate this heat
load under different operating conditions.
The server airflow demand depends
on both the heat load and the air tempera-
ture rise across the server, and can be
calculated as follows:
3,412QV =
1.085nT
In this equation, V is the volumetric
flow rate (in cubic feet per minute), Q is
the heat load (in kilowatts), and nT is the
temperature rise (in degrees Fahrenheit).
For example, the airflow demand of a 15 kW
server with a 20°F temperature rise is
2,359 cfm. Organizations can typically
obtain information on temperature rise
from the server manufacturer or through
an online calculator.
increasing cooling efficiency with computational fluid dynamicsOrganizations can use CFD modeling
in multiple ways to increase cooling
efficiency in their data centers, including
the following:
Controlling air distribution:■■ The heat
load, and therefore the airflow demand,
in a data center varies from rack to
rack. A CFD model can help organiza-
tions create a design that can produce
an efficient distribution of cooling air.
Predicting bypass airflow: ■■ Bypass
air escaping through unsealed cable cut-
outs, which appears at the back of racks
instead of in the front, does not contrib-
ute directly to cooling. This bypass air
can constitute more than half of the total
airflow supplied to the under-floor
plenum. A CFD model in which these
cutouts are properly represented can
help predict the amount of bypass air.
Preparing for system failure: ■■ Creating
airflow models can help organizations
study possible failure scenarios for key
dEll EnErgy smarT daTa cEnTEr assEssmEnTsDell Energy Smart Data Center Assessments from Dell Infrastructure Consulting Services (ICS) can
help enterprises make informed decisions about data center design. By first assessing the existing
data center and then providing a set of recommendations, Dell ICS consultants can help enterprises
make efficient use of resources such as power and cooling systems, reduce ongoing energy costs,
and consolidate systems to enable growth without building new facilities.
Assessment. The assessment phase includes a review of existing power and cooling capacities,
practices, and infrastructure. In addition to other tools, Dell ICS consultants use computational fluid
dynamics (CFD) to model the airflow and thermal characteristics of the data center, yielding 2D and
3D models to highlight problem areas as well as areas with sufficient space and/or capacity for
additional equipment. This approach helps identify the optimal configuration to meet specific require-
ments and determine appropriate placement of racks, hot and cold aisles, and vents.
Recommendations. After analyzing the current environment, Dell ICS provides a set of recom-
mendations to help increase efficiency and scale to meet future requirements. Based on industry best
practices, these recommendations can help enterprises expand capacity without exceeding existing
limits on space, power, and cooling; identify power and cooling systems required to support existing
systems or future expansion; and reconfigure the infrastructure to help avoid heat-induced outages.
For more information on Dell Energy Smart Data Center Assessments, visit DELL.COM/ICS.

DELL POWER SOLUTIONS | February 20083
feature section:GreeninG the data center
Reprinted from Dell Power Solutions, February 2008. Copyright © 2008 Dell Inc. All rights reserved.
infrastructure components such as
HVAC systems, to help ensure that the
data center design provides adequate
cooling in these situations.
Designing for redundancy:■■ When a
computer room air-conditioning unit
fails, a backup unit may replace it. But
because the redundant unit is in a dif-
ferent location than the unit it replaced,
the new airflow distribution is different
as well. Organizations can use CFD
modeling to help ensure that the
airflow distribution when using these
backup units is satisfactory.
Reducing the adverse effect of ■■
under-floor obstructions: Under-floor
obstructions can lead to large nonuni-
formities in airflow distribution. CFD
modeling can help organizations
choose appropriate locations for these
obstructions to help minimize their
effects on cooling efficiency.
For details on how Dell incorporates
CFD into a comprehensive assessment of
energy use and cooling in enterprise data
centers, see the “Dell Energy Smart Data
Center Assessments” sidebar in this article.
For more information on best practices IT
staff can follow to help optimize their data
center design for energy efficiency, see the
“Following cooling best practices for data
center design” sidebar in this article.
a best-practices exampleFigure 1 shows an example data center
layout that might be used by an organiza-
tion that has not regularly followed best
practices for hardware deployment plan-
ning and change management, and is now
struggling with cooling problems. It uses
a traditional front-to-back configuration
of 38 racks (where different colors repre-
sent different heat loads) in which the
exhaust from the first row of racks mixes
with the conditioned air from the perfo-
rated tiles (shown in beige) to supply the
second row, and so on—meaning that
each successive row receives progres-
sively warmer inlet air. By following best
practices and using CFD modeling to
reconfigure this data center, however, this
organization could increase energy effi-
ciency and rack density, reduce costs,
extend the life expectancy of its systems,
and plan for future IT requirements. The
results described in this section were
obtained using TileFlow, a software
package from Innovative Research, Inc.,
for modeling airflow in data centers.
Analyzing data center characteristics
The first step is to analyze the character-
istics of the current layout. The total rack
Figure 1. Example data center layout
Figure 2. Airflow rates through the perforated tiles in the example data center
“Organizations can increase density, reduce costs, and extend data center life expectancy by designing efficient data centers that can meet both present and future IT requirements.”
4DELL.COM/PowerSolutionsReprinted from Dell Power Solutions, February 2008. Copyright © 2008 Dell Inc. All rights reserved.
heat load for this example data center is
129 kW. The total rack airflow demand is
20,000 cfm, and the computer room air-
conditioning units supply 22,600 cfm of
cooling air at a temperature of 55°F. The
maximum acceptable inlet air temperature
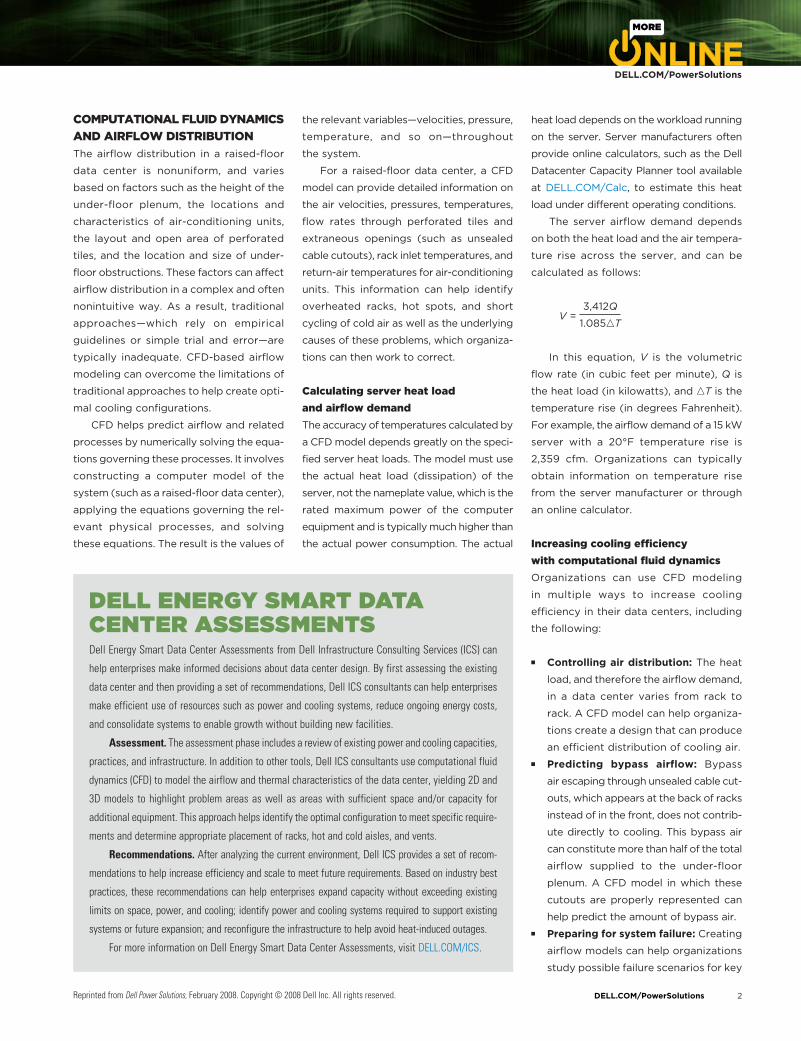
is 75°F. Figure 2 shows the calculated air-
flow distribution through the perforated
tiles, which have flow rates ranging from
325 cfm to 640 cfm. Because all the per-
forated tiles have the same open area, this
variation indicates a nonuniform pressure
distribution under the raised floor, as
shown in Figure 3.
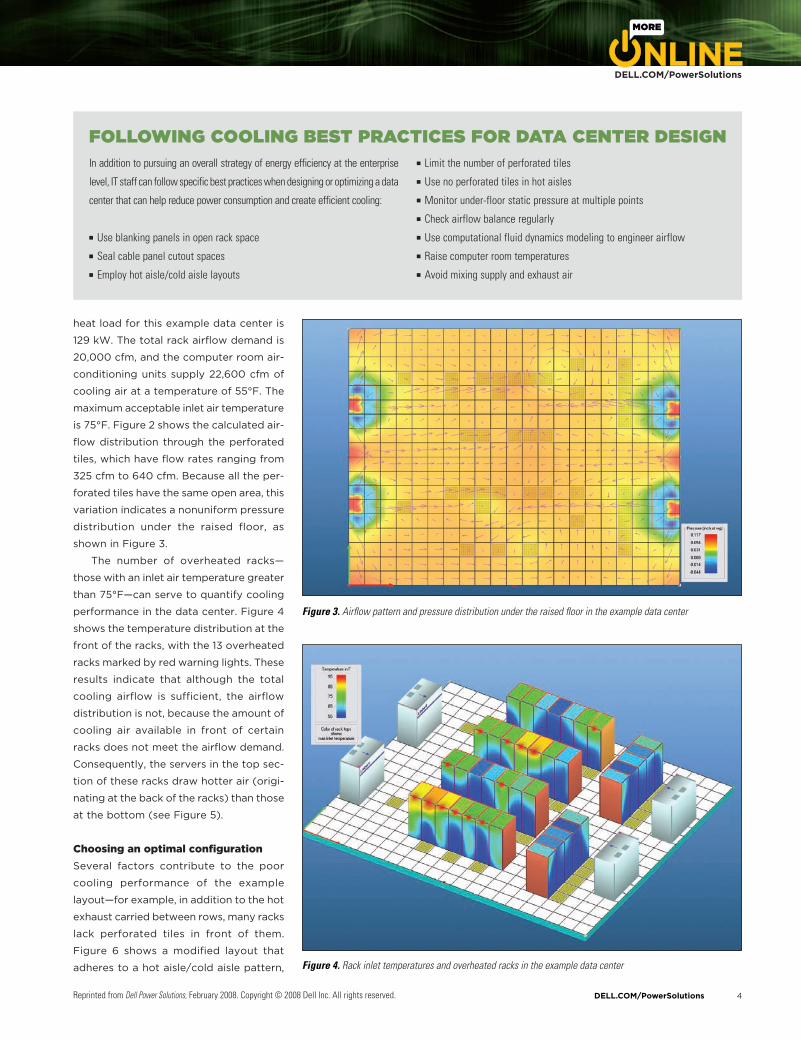
The number of overheated racks—
those with an inlet air temperature greater
than 75°F—can serve to quantify cooling
performance in the data center. Figure 4
shows the temperature distribution at the
front of the racks, with the 13 overheated
racks marked by red warning lights. These
results indicate that although the total
cooling airflow is sufficient, the airflow
distribution is not, because the amount of
cooling air available in front of certain
racks does not meet the airflow demand.
Consequently, the servers in the top sec-
tion of these racks draw hotter air (origi-
nating at the back of the racks) than those
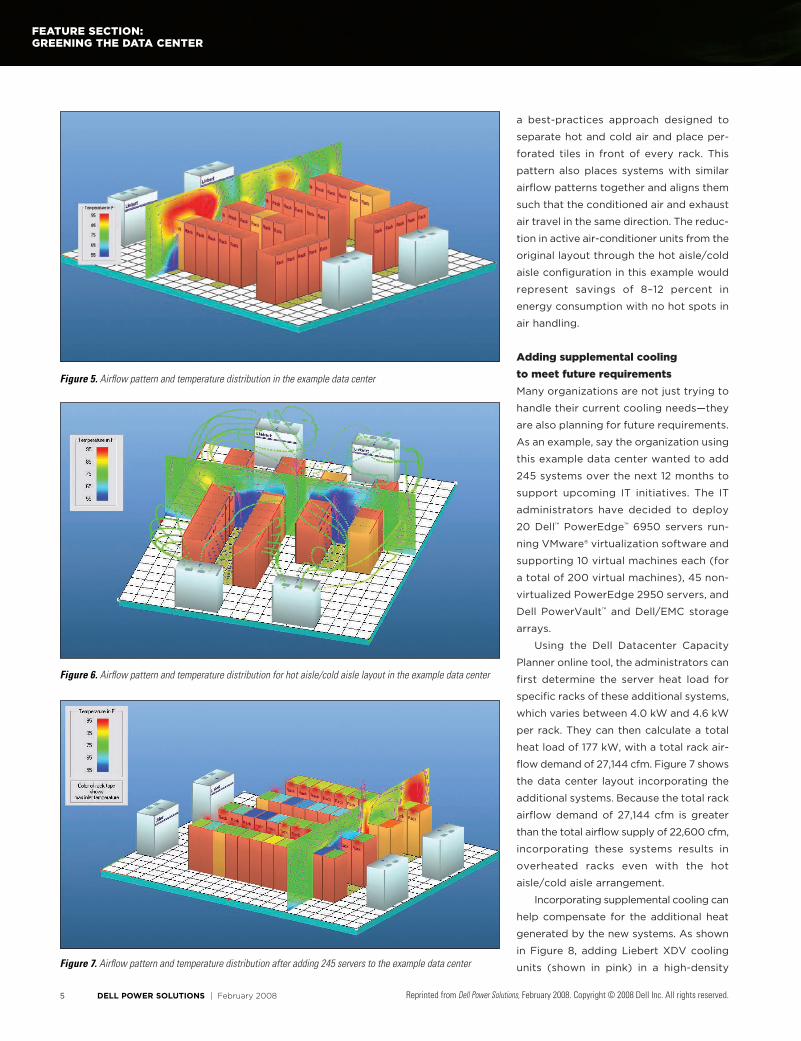
at the bottom (see Figure 5).
choosing an optimal configurationSeveral factors contribute to the poor
cooling performance of the example
layout—for example, in addition to the hot
exhaust carried between rows, many racks
lack perforated tiles in front of them.
Figure 6 shows a modified layout that
adheres to a hot aisle/cold aisle pattern,
Figure 3. Airflow pattern and pressure distribution under the raised floor in the example data center
Figure 4. Rack inlet temperatures and overheated racks in the example data center
In addition to pursuing an overall strategy of energy efficiency at the enterprise
level, IT staff can follow specific best practices when designing or optimizing a data
center that can help reduce power consumption and create efficient cooling:
Use blanking panels in open rack space■■
Seal cable panel cutout spaces■■
Employ hot aisle/cold aisle layouts■■
Limit the number of perforated tiles■■
Use no perforated tiles in hot aisles■■
Monitor under-floor static pressure at multiple points ■■
Check airflow balance regularly■■
Use computational fluid dynamics modeling to engineer airflow■■
Raise computer room temperatures■■
Avoid mixing supply and exhaust air ■■
following cooling bEsT pracTicEs for daTa cEnTEr dEsign
DELL POWER SOLUTIONS | February 20085
feature section:GreeninG the data center
Reprinted from Dell Power Solutions, February 2008. Copyright © 2008 Dell Inc. All rights reserved.
a best-practices approach designed to
separate hot and cold air and place per-
forated tiles in front of every rack. This
pattern also places systems with similar
airflow patterns together and aligns them
such that the conditioned air and exhaust
air travel in the same direction. The reduc-
tion in active air-conditioner units from the
original layout through the hot aisle/cold
aisle configuration in this example would
represent savings of 8–12 percent in
energy consumption with no hot spots in
air handling.
adding supplemental cooling to meet future requirementsMany organizations are not just trying to
handle their current cooling needs—they
are also planning for future requirements.
As an example, say the organization using
this example data center wanted to add
245 systems over the next 12 months to
support upcoming IT initiatives. The IT
administrators have decided to deploy
20 Dell™ PowerEdge™ 6950 servers run-
ning VMware® virtualization software and
supporting 10 virtual machines each (for
a total of 200 virtual machines), 45 non-
virtualized PowerEdge 2950 servers, and
Dell PowerVault™ and Dell/EMC storage
arrays.
Using the Dell Datacenter Capacity
Planner online tool, the administrators can
first determine the server heat load for
specific racks of these additional systems,
which varies between 4.0 kW and 4.6 kW
per rack. They can then calculate a total
heat load of 177 kW, with a total rack air-
flow demand of 27,144 cfm. Figure 7 shows
the data center layout incorporating the
additional systems. Because the total rack
airflow demand of 27,144 cfm is greater
than the total airflow supply of 22,600 cfm,
incorporating these systems results in
overheated racks even with the hot
aisle/cold aisle arrangement.
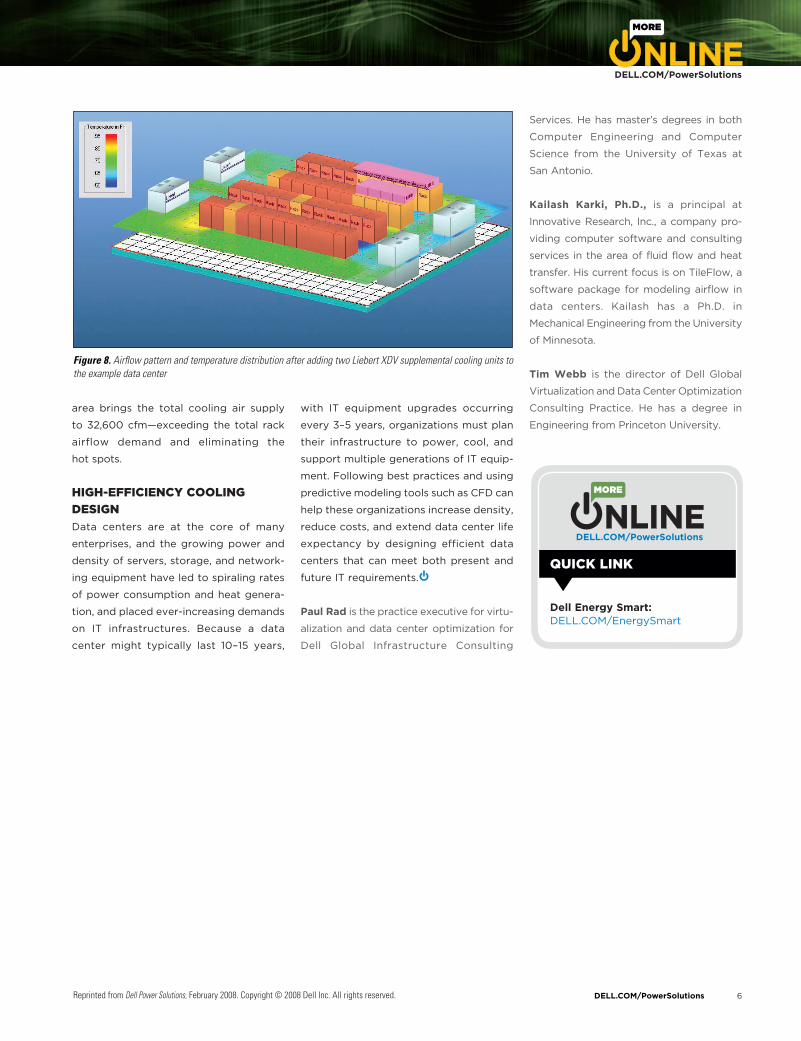
Incorporating supplemental cooling can
help compensate for the additional heat
generated by the new systems. As shown
in Figure 8, adding Liebert XDV cooling
units (shown in pink) in a high-density Figure 7. Airflow pattern and temperature distribution after adding 245 servers to the example data center
Figure 5. Airflow pattern and temperature distribution in the example data center
Figure 6. Airflow pattern and temperature distribution for hot aisle/cold aisle layout in the example data center
6DELL.COM/PowerSolutionsReprinted from Dell Power Solutions, February 2008. Copyright © 2008 Dell Inc. All rights reserved.
area brings the total cooling air supply
to 32,600 cfm—exceeding the total rack
airflow demand and eliminating the
hot spots.
hiGh-efficiency coolinG desiGnData centers are at the core of many
enterprises, and the growing power and
density of servers, storage, and network-
ing equipment have led to spiraling rates
of power consumption and heat genera-
tion, and placed ever-increasing demands
on IT infrastructures. Because a data
center might typically last 10–15 years,
with IT equipment upgrades occurring
every 3–5 years, organizations must plan
their infrastructure to power, cool, and
support multiple generations of IT equip-
ment. Following best practices and using
predictive modeling tools such as CFD can
help these organizations increase density,
reduce costs, and extend data center life
expectancy by designing efficient data
centers that can meet both present and
future IT requirements.
Paul Rad is the practice executive for virtu-
alization and data center optimization for
Dell Global Infrastructure Consulting
Services. He has master’s degrees in both
Computer Engineering and Computer
Science from the University of Texas at
San Antonio.
Kailash Karki, Ph.D., is a principal at
Innovative Research, Inc., a company pro-
viding computer software and consulting
services in the area of fluid flow and heat
transfer. His current focus is on TileFlow, a
software package for modeling airflow in
data centers. Kailash has a Ph.D. in
Mechanical Engineering from the University
of Minnesota.
Tim Webb is the director of Dell Global
Virtualization and Data Center Optimization
Consulting Practice. He has a degree in
Engineering from Princeton University.
QuicK linK
Dell Energy Smart:DELL.COM/EnergySmart
Figure 8. Airflow pattern and temperature distribution after adding two Liebert XDV supplemental cooling units to the example data center
Recommended