High Definition Mineralogy by QEMSCAN: From Exploration to Processing
Focus on Automated/Process [email protected]+ 1 750-927-62781

2
What is High Definition Mineralogy?
It is the combination of Experience, Expertise and State of the Art Instrumentation used as a Quantitative tool used for; Defining Geometallurgical Domains Predictive and problem solving tool for metallurgical processing Process Mineralogy; Base metals, PGE, Au, REE, Li etc. Ore Characterization Environmental Mineralogy Forensics Indicator Minerals Upstream Oil and Gas Applications Slags

3
QEMSCAN Background
QEMSCAN: an acronym for Quantitative Evaluation of Minerals
Developed as an analytical mineralogical instrument used to obtain high volume, rapid and reproducible analysis for mineral processing industry
More traditional applications to the mining sector include Base Metal Deposits, PGM’s (Au, Pt & Pd) & Heavy Mineral Sands
Newer Applications include the Industrial Mineral Sector, Environmental Mineralogy, Coal, Oil and Gas Industries and Geometallurgical mapping & modeling

4
QEMSCAN - Applications
Exploration (ExploMinTM)
Resource Geometallurgy
Production forecasting
Process design and development
Plant metallurgical quality control
Plant optimization
Exploration & Development
Mining
Processing
Grade & volume
Grade & tonnes
Grade & recovery

5
Where’s the Value for Metallurgists?
Metallurgist - GeoMet Linking Mineralogical Data with Metallurgical
performance based on 1. Mineral Abundances2. Grain Size3. Liberation Characteristics of target minerals
Ultimately the Deposit type/Minerals within the Deposit will dictate the extraction process
The characteristics of the minerals will help determine the optimum parameters for mineral concentration.

6
Where’s the Value for Metallurgists? Predictive Tool for Grinding
The overall mineral assemblage and textural association will be a key factor for predicting how much energy will necessary to grind a sample within a block.
Predict Grind Targets based on mineral liberation vs. particle size can be used to determine potential primary and secondary grind targets.

7
Predictive Tool For Flotation
Determine the distribution of Recoverable vs. Non-Recoverable elements
1. Ni-Sulphides (Pentlandite, Millerite) vs. Ni in Silicates (Serpentine, Talc)
2. This will help determine the Grade vs. Recovery
For HydrometDetermine the Elemental Deportment of desired
Element(s)1. Ni-Laterites -- Leaching parameter can be determined by
different Ni mineral hosts (serpentine, talc, chlorite)

8
Common Sample Type - Mineral Processing
Feeds/Comps – to determine the bulk mineral assemblage which will aid in flowsheet development
Tailing Products – what is the loss to tailing and should a particular element been recovered? E.g. Cu loss to tailing during flotation – was it a Cu-sulphide that is finely disseminated or was different copper mineral that would not float
Concentrates – why did this sample not achieve a concentrate grade? Liberation problem of the target mineral? Entrainment of other minerals diluting the con?
Ore Variability Samples – Based on previous work (in conjunction with the metallurgy), predictions on metallurgical performance can be made based on the mineral distributions and exposure.

9
QEMSCAN Data Outputs
Data is processed using the iExplorer SoftwareData Outputs include:
Modal: mineral abundance Grain size: liberation size Mineral occurrence – how? (texture / habit) Mineral liberation – free, liberated, middling or locked Mineral associations – what with? Mineral distribution by size fraction Distribution based on bulk chemistry or physical properties Elemental deportment: In which minerals do the elements of
interest occur? Grain Size Distribution Mineral Simulation based on: specific gravity Grade Recovery Mineral Release Curves

10
What do we use at SGS? High Definition Mineralogical Instrumentation
QEMSCANQuantitative Evaluation of Minerals (Flagship Tool) using Scanning
Electron Microscopy (SEM) – an automated SEM. X-Ray Diffraction
Characterizes a sample based on crystallographic structure of minerals
Scanning Electron Microscope Used for mineral characterization, high magnification imaging, semi-quant
analysis by energy dispersive x-ray analysis Provides micro textural information, back scattered images, semi-
quantitative analyses; etc. Useful for sulphides and carbonates
Optical Image AnalysisCharacterizes minerals on reflective properties (good for simple
ores) Petrographic and Stereoscopic Microscopes
Traditional Mineralogical Analysis using Optical Microscopy

11
Other Techniques Electron Microprobe
Precision Quantitative Analysis of individual minerals (e.g. low levels of Co in pyrite) Defines the chemistry of sulphides or carbonates, e.g., Ni in pyrrhotite, Co in
pentlandite, As in pyrite, Cd in sphalerite etc. Detection limit depends on the matrix (0.01 to 0.1 wt%)
Laser Ablation ICP-MS Defines well the concentration of trace amounts of elements that cannot be determined
with the EMPA due to the detection limit restrictions. For example, Hg, Se in sulphides. Detection limit is ppm level.
Time of Flight – SIMS and X-ray Photoelectron Spectroscopy Surface analysis; e..g., Fe speciation on sulphides or Ag on Au-Ag alloys.
Dynamic Secondary Ion Mass Spectroscopy (D-SIMS) Elemental analysis of elements (e.g. Au) within minerals at depth, if colloidal or solid
solution.
Raman Spectroscopy Distinction between oxides and oxyhydroxides

12
QEMSCAN Background
QEMSCAN: an acronym for Quantitative Evaluation of Minerals
Developed as an analytical mineralogical instrument used to obtain high volume, rapid and reproducible analysis for mineral processing industry
More traditional applications to the mining sector include Base Metal Deposits, PGM’s (Au, Pt & Pd) & Heavy Mineral Sands
Newer Applications include the Industrial Mineral Sector, Environmental Mineralogy, Coal, Oil and Gas Industries and Geometallurgical mapping & modeling

13
The QEMSCAN System

14
Sample Preparation for QEMSCAN Analysis
Micro-riffled in order to a representative sample of 1-2 g Graphite added (size dependant upon particle size) at a
user dependant ratio To provide a supporting matrix for the particles. To ensure dispersion and random orientation of particles. To minimize segregation of particles resulting from density
separation.
Sample “potted” in resin Placed in a pressure vessel to cure to minimize the formation
of bubbles during curing.
Sample block is then ground and polished To ensure a flat well polished surface. Minimal particle relief Limited particle plucking No scratches
Block then carbon coated ready for QEMSCAN analysis
15
QEMSCAN Hardware
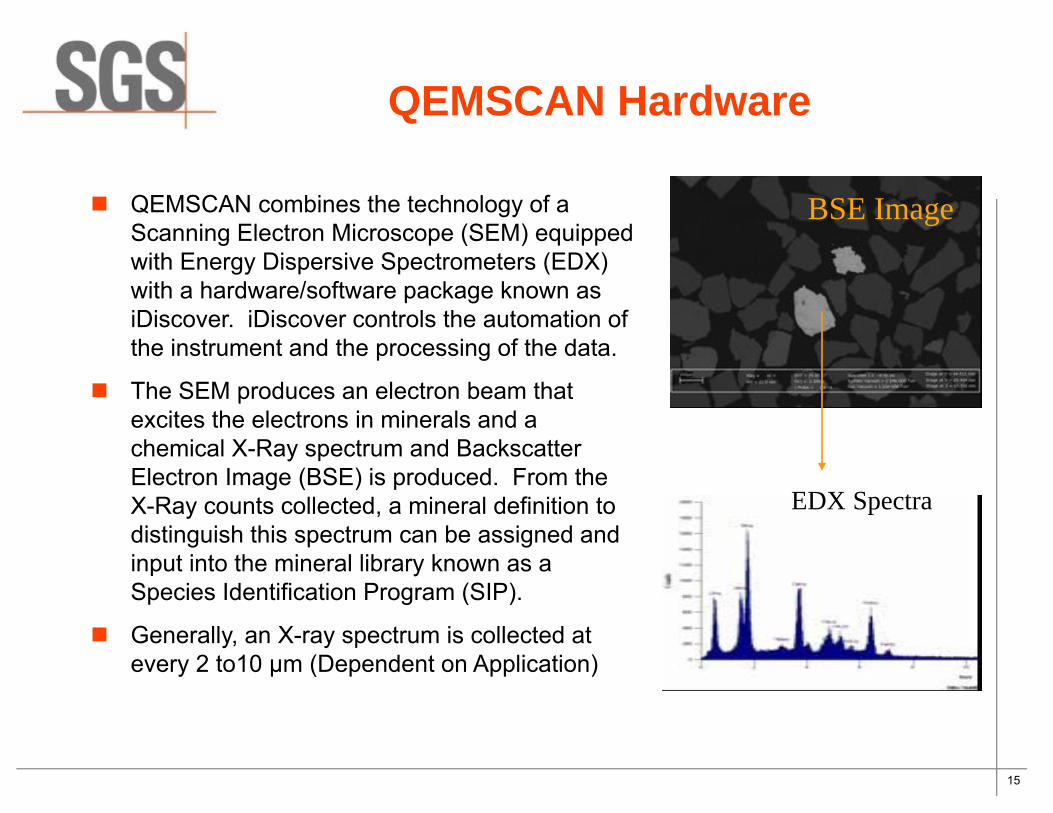
QEMSCAN combines the technology of a Scanning Electron Microscope (SEM) equipped with Energy Dispersive Spectrometers (EDX) with a hardware/software package known as iDiscover. iDiscover controls the automation of the instrument and the processing of the data.
The SEM produces an electron beam that excites the electrons in minerals and a chemical X-Ray spectrum and Backscatter Electron Image (BSE) is produced. From the X-Ray counts collected, a mineral definition to distinguish this spectrum can be assigned and input into the mineral library known as a Species Identification Program (SIP).
Generally, an X-ray spectrum is collected at every 2 to10 µm (Dependent on Application)
EDX Spectra
BSE Image

16
MODAL ANALYSIS
Fields of view
30 mm
10 um
2 mm
75 microns
QuartzMicaChloritePyriteFeldspar
Numerical Data
High intercept statistics
Deliverables
Modal and grain size data

17
PARTICULATE ANALYSIS
75 microns
QuartzMicaChloritePyriteFeldspar
Accepted
TargetToo BigBoundary
Fully maps the particles at set resolution
BSE: grey scale image analysis of field (particle vs. resin)
BSE image of particle
X-ray analyses (each particle is subdivided into pixels, with every pixel being analyzed separately)
Deliverables
Modal mineralogy
Exposure
Grain size

18
So what does the QEMSCAN do?
Maps particles
using X-ray spectra and BSE IntensityMeasures particles at
a given resolution (2–15 µm)
Creates pseudo images From these images,
the locking-liberation and exposure characteristics can be extrapolated
Pyrite (yellow), Silicate (pink), Pentlandite (purple), Chalcopyrite (orange)

19
TEXTURAL ANALYSIS
BackgroundChalcopyriteChalcociteCovelliteBorniteTetrahedrite/EnargiteOther Cu-MineralsPyriteOther_SulphidesQuartzPlagioclaseK-FeldsparEpidoteWollastoniteMicas/ClaysMg-ChloriteDiopside/SaliteAmphiboleTitanite/spheneApatiteCalciteZirconOther SilicatesOther OxidesOther
Maps particles
A mode of measurement that maps a section of rock (or rock chips) which has been mounted into a polished section or polished thin section.
It collects a chemical spectrum at a set interval within the field of view. Each field of view is then processed offline and a pseudo image of the core sample is produced.
Can be used for waste rock samples Deliverables:
Modal mineral abundance for the whole area analyzed Shows the in-situ location of the sulphides/carbonates as a QEMSCAN pseudo
coloured image Comparable to the typical optical outputs, but quantitative numbers
BackgroundSulphidesQuartzPlagioclaseK-FeldsparSericite/MuscoviteBiotiteChloriteKaoliniteRutile/QuartzOther SilicatesFe-OxidesOther OxidesSulphatesCarbonatesApatiteOther
Mineral Name

20
QEMSCAN QA/QC

21
Explomin Modals - Pb-Zn Ore
A B C-600/+3um -600/+3um -600/+3um
100.0 100.0 100.013282 19473 22204
Sample Sample SamplePyrite 38.9 15.1 32.1Cu Sulphides 0.6 0.0 0.0Sphalerite 4.1 12.4 61.2Galena 44.8 5.1 6.1Arsenopyrite 0.1 53.7 0.6Enargite 0.4 0.0 0.0Other_Sulphides 0.1 0.0 0.0Quartz 0.2 0.0 0.0Feldspar 0.0 0.0 0.0Micas 9.8 0.0 0.0Clays 0.1 0.0 0.0Other Silicates 0.1 0.0 0.0Oxides 0.0 0.0 0.0Calcite 0.3 13.2 0.0Dolomite 0.2 0.1 0.0Other 0.1 0.1 0.0Total 100.0 100.0 100.0
Mineral Mass (%)
SampleFractionMass Size Distribution (%)Particle Size

22
EXPLOMIN Imaging
Technical deliverables of EXPLOMIN Imaging: Addition of particle orCore false-colour images to
theEXPLOMINTM report
Standard output format: Modal mineralogy for
area imaged Tabulated data for area imaged
SGS PROPRIETARY, Copyright SGS 2009, All Rights Reserved

23
Explomin One Image – 1000 words

24
Explomin Original List & Short List

25
Correlations of Textures
PSSA: phase specific surface area the surface area per unit volume of a mineral
CEI=(C-F)*R/(100-F) C: mineral % in a concentrate F: mineral % in the feed R: recovery

26
100 200 300 400
100
80
60
40
20
PSSA
50 µm

27
Cu Deposits Copper is mined from a variety of different mineral deposit types.
Nevertheless, deposits with the greatest amounts of contained copper, and thus the most significant exploration targets, are:
porphyry, iron oxide-copper-gold (IOCG) sedimentary rock-hosted copper deposits. Cu-Ni magmatic deposits
Porphyry Cu deposits account for approximately 70% of world copper resources, are the principal source, and as a consequence, are a major exploration objective worldwide.
Although relatively few IOCG deposits are currently in production, they form an intriguing, but difficult exploration target. The largest examples of this deposit type, Olympic Dam and Salobo, copper systems.
Sedimentary rock-hosted stratiform copper deposits currently account for approximately 23% percent of the world’s copper production and known reserves, in addition to being significant sources of cobalt and silver. These deposits are extremely common, although economically significant deposits are rare.

28
Cu Minerals
bornite Cu5FeS4
chalcopyrite CuFeS2
chalcocite Cu2Scovellite CuS
cubanite CuFe2S3
digenite Cu1.95-xSstannite Cu2FeSnS4
tennantite (Cu,Fe)12As4S13
tetrahedrite (Cu,Fe)12Sb4S13
stannite Cu2FeSnS4
chrysocolla CuSiO3.H2Oneoticite (Cu,Fe,Mn)SiO3.H2Otenorite CuOpitch limonite (Fe,Cu)O2
delafossite FeCuO2
native copper Cucuprite Cu2Oatacamite Cu2(OH)3Clchalcanthite CuSO4
.5H2Oantlerite Cu3SO4
.(OH) 4brochantite Cu4SO4
.(OH)6malachite Cu2CO3
.(OH)2azurite Cu3 (CO3)2
.(OH)2djurleite Cu1.95-xS
Economically Important Copper Minerals

29
Cu-Porphyry – Composite Samples

30
Cu-Porphyry - Modal Mineralogy

31
QEMSCAN Outputs: Liberation
Liberation classes were defined as the following; Free: A mineral with ≥95% surface area
Liberated: A mineral with ≥80% but <95% surface areaMidds: A mineral with ≥50% but <80% surface area
Sub-Midds: A mineral with ≥20% but <50% surface areaLocked: A mineral with <20% surface area
32
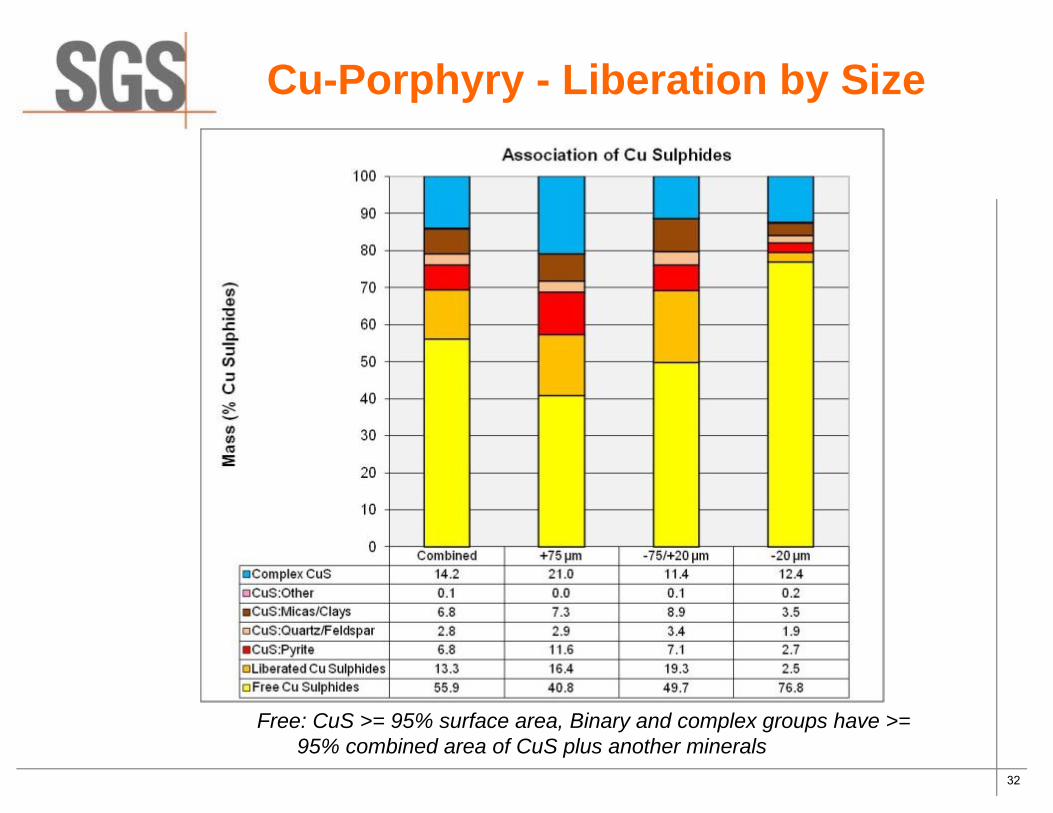
Cu-Porphyry - Liberation by Size
Free: CuS >= 95% surface area, Binary and complex groups have >= 95% combined area of CuS plus another minerals

33
QEMSCAN Outputs: Liberation by Size

34
QEMSCAN Outputs: Exposure

35
Cu-Porphyry - QEMSCAN Particle Maps

36
Cu-Porphyry- Recoverable CuS Potential Recovery

37
Cu-Porphyry - Grain Size Distribution
1. Reports the cumulative grain size of groups of minerals within the sample
2. D50 or D80 etc. can be calculated from the data

38
Cu-Porphyry - Mineral Release Curves

39
Cu-Porphyry - Grade Recovery

40
Cu-Porphyry - Grade Recovery

41
Ni-Cu Project
Determine the Cu, Fe and Ni Sulphides
Cross-sections
Drill holes
Composite samples from assay coarse reject based on: Geologic unit
Logged rock type
Sulfide mineralogy and estimated amounts
Copper, Nickel, and/or PGM grade

42
Mineralogy
The current geologic model is based primarily upon the lithogeochemistry from the assay database.
Sulfide mineralogy Visual estimation Proportions normalized to 100%
Silicate mineralogy Homogeneity in the
heterogeneity within the ore zone
Sulfide Zonation Study
42
CubaniteChalcopyriteTalnakhitePyrrohtite +
Pentlandite

43
QEMSCAN – Cu-Ni

44
Cu-Sulphides-Liberation

45
Pentlandite-Liberation

4646
Contour plots -sulfides
Cross sections looking NEProjected on a line trending 145°

47
Ni Deportment

48
FLOWSHEET PREDICTIVE KINETICS

49
TOF-SIMS, Sputtering and Spectra
Cu
C5H3
ZnC5H4
65Cu
C5H5
66Zn
C5H6
mass / u63.0 63.5 64.0 64.5 65.0 65.5 66.0
3x10
0.5
1.0
1.5
2.0
Inte
nsity
Primary ion beam (Bi3+) produces secondary monatomic and polyatomic negative, positive ions and neutral species; function of energy distribution
Mass spectra from mixed mineral feed sample in the region of 62 to 66.5 amu; masses relevant to the study (Cu, Zn).
Inte
nsity
Courtesy of Surface Science Western and B. Hart

50
Cu
Zn
Fe
Cu
C 5 H 3
ZnC 5 H 4
65 Cu
C 5 H 5
66 Zn
C 5 H 6
mass / u63.0 63.5 64.0 64.5 65.0 65.5 66.0
3x10
0.5
1.0
1.5
2.0
Inte
nsity
Sph Surface
mass / u162.6 163.0 163.4
110
1.0
110
1.0
Con 1 Tail Con 1 Tail
Nor
mal
ized
Inte
nsity
0.0000
0.0005
0.0010
0.0015
0.0020
0.0025
0.0030
Legend for box plots
10th Percentile25th Percentile
75th Percentile
90th Percentile
MedianMean
OutlierCu (/10) KAX 163
TOF-SIMS Zn Map
Tail
Con 1
Data Collection/Presentation
Box plots showing relative difference in measured species between samples
Sph Surface
Sph Surface
Sph SurfaceCon 1 Tail Con 1 Tail
200x200 umIn
tens
ity
Courtesy of Surface Science Western and B. Hart

51
51
Scatter plots showing the distribution for Pb and Cu versus Zn on sphalerite surfaces in the feed, concentrate and tail.
CONCLUSIONS: MAJOR FINDINGS• Activation of sphalerite by Pb occurs during grinding. • Activation by Cu likely occurs during conditioning and flotation.• No significant role of common depressants observed.
Met tests on Cu\Pb\Zn ore show significant sphalerite in Cu/Pb con
Case Study #1: Batch Flotation Study
Courtesy of Surface Science Western and B. Hart

52
Rare Earth Deposits REE deposits form two main groups.
The first is a commonly occurring “light rare earth element” (LREE) rich group of deposits (La, Ce, Pr, Nd, Sm).
The second is a less commonly occurring “heavy rare earth element” (HREE) rich group (Eu, Gd, Tb, Dy, Ho, Er, Tm, Yb, Lu and Y).
The LREE are hosted primarily by carbonatites and the HREE by highly alkaline to peralkaline (Na + K > Al) silicate igneous rocks.
The LREE are produced mainly from bastnaesite, monazite, while HREE are produced almost exclusively from low-grade secondary ion adsorption clay deposits in which the REE are adsorbed onto surfaces of kaolinite and halloysite, the products of weathering of granites and sediments.
Most of REE deposits display a high degree of geological and mineralogical complexity that can have serious consequences for metallurgical processing if not well understood.

53
Selected Rare Earth Minerals
Mineral FormulaY-allanite (Ca,Y)2(Al,Fe,REE)3Si3O12(OH)Monazite (LREE,Y,Th)PO4
Bastnaesite REE(CO3)FSynchysite Ca(Ce,REE)(CO3)2FFergusonite (REE,Y)NbO4
Eudialyte Na4Ca1.5Ce0.5Fe2+0.6Mn2+
0.3Y0.1ZrSi8O22(OH)1.5Cl0.5
Xenotime (Y,Yb,HREE)(PO4)Mosandrite Na2Ca3Ce1.5Y0.5Ti0.6Nb0.3Zr0.1(Si2O7)2O1.5F3.5
Chevkinite Ce1.7La1.4Ca0.8Th0.1Fe2+1.8Mg0.2Ti2.5Fe3+
0.5Si4O22
Zircon Zr0.9Hf0.05REE0.05SiO4
Columbite (Fe,Mn,Mg)(Nb,Ta)2O6
Apatite (Ca, REE,Sr)5(PO4)3(OH,F,Cl)Titanite Ca0.95REE0.05Ti0.75Al0.2Fe3+
0.05SiO4.9F0.1

54
Geochemistry

55
Mineral Variability

56
Mineral Variability

57
LREM Distribution

58
QEMSCAN– Liberation Association

59
QEMSCAN – Image Grid (f) Association

60
QEMSCAN – Recoverability

61
QEMSCAN – REE G-R

62
LREE & HREE Distribution Distribution of LREE and HREE (& Y)
Fergusonite and zircon account for most of the HREE
Monazite, allanite, synchysite and bastnaesite (in decreasing order) for the LREE
0
10
20
30
40
50
60
70
80
90
100
La Ce Nd Pr Sm Gd Tb Dy Er Y
REE
Ele
men
tal M
ass%
ColumbiteFergusoniteBastnaesiteSynchysiteMonaziteAllaniteOther REMZircon

63
Mineral and Oxide Mass Balance
0.0
10.0
20.0
30.0
40.0
50.0
60.0
70.0
80.0
90.0
100.0
Mas
s %
PP-07 Grav Conc
PP-07 1st Clnr Scav Tls
PP-07 Ro Scav Tls
PP-07 Mags
PP-07 Slimes

64
Allanite/Zircon Distribution

65
Conclusions QEMSCAN is an extremely important tool in assessing the mineralogy of an ore
body, supporting metallurgical test work, solving problem, and forecasting the recoveries and grade, and finally assist in the calculation of reserves of the deposit.
Quantitative and statistically robust data
Provides textural information for the mineralization
Variability data of the ore
Define mineralized and barren domains
Detailed Modal Data
Liberation & Association
Size Distribution
Elemental Distribution
Geometallurgy
QEMSCANTM is not biased compared to other methods
Mineralogy essentially dictates the metallurgical process(es)
Recommended