Abstract—This article describes techniques of the heatmaps
generation, and their implementation. The specific issues of the
implementation in the web-based environment are discussed, and the
special features of the using in the GeoWeb application are described.
There are discussed the differences depending on the limited features
of the web-application architecture, the possible solution using the
web-browser scripting capabilities, and the impact on the GeoWeb
application user-interface evaluation. In the conclusion, the future
ways of the research are described and briefly explained.
Keywords—data processing, GeoWeb, GIS, heatmap, user-
interface, visualization, web-application.
I. INTRODUCTION
HE Geographical Information Systems (GIS) are equipped
with many types of user-interface (UI). The most popular
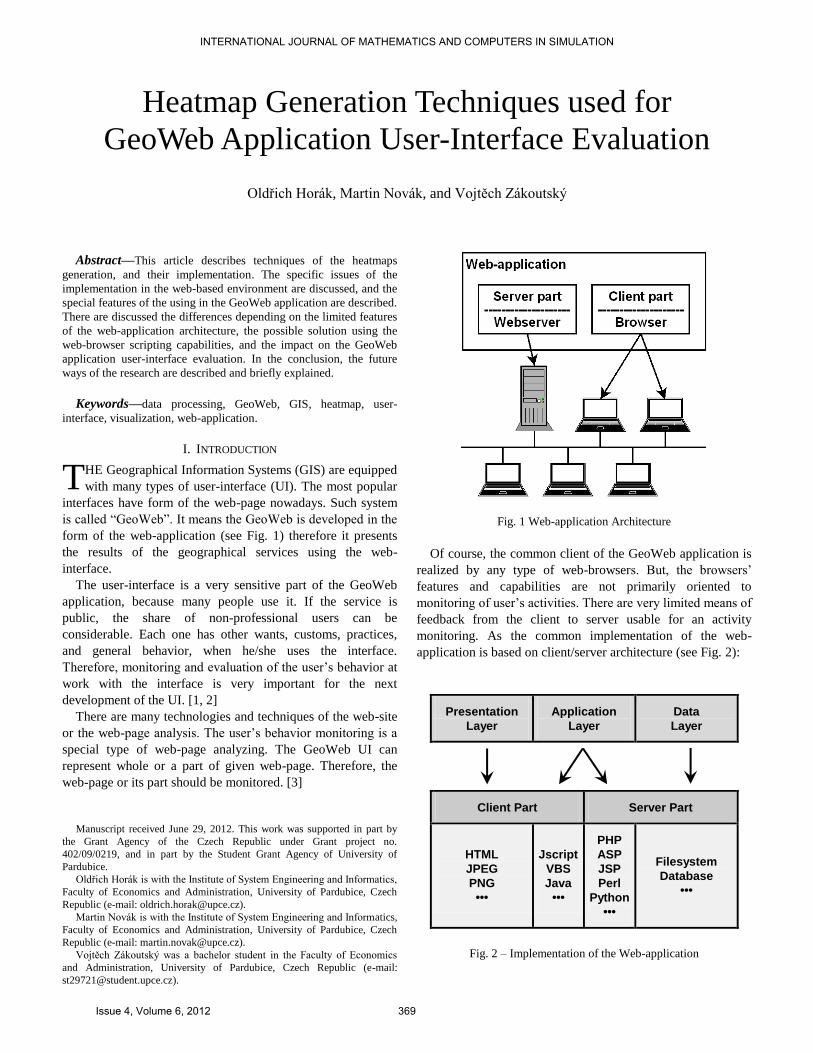
interfaces have form of the web-page nowadays. Such system
is called “GeoWeb”. It means the GeoWeb is developed in the
form of the web-application (see Fig. 1) therefore it presents
the results of the geographical services using the web-
interface.
The user-interface is a very sensitive part of the GeoWeb
application, because many people use it. If the service is
public, the share of non-professional users can be
considerable. Each one has other wants, customs, practices,
and general behavior, when he/she uses the interface.
Therefore, monitoring and evaluation of the user’s behavior at
work with the interface is very important for the next
development of the UI. [1, 2]
There are many technologies and techniques of the web-site
or the web-page analysis. The user’s behavior monitoring is a
special type of web-page analyzing. The GeoWeb UI can
represent whole or a part of given web-page. Therefore, the
web-page or its part should be monitored. [3]
Manuscript received June 29, 2012. This work was supported in part by
the Grant Agency of the Czech Republic under Grant project no.
402/09/0219, and in part by the Student Grant Agency of University of
Pardubice.
Oldřich Horák is with the Institute of System Engineering and Informatics,
Faculty of Economics and Administration, University of Pardubice, Czech
Republic (e-mail: [email protected]).
Martin Novák is with the Institute of System Engineering and Informatics,
Faculty of Economics and Administration, University of Pardubice, Czech
Republic (e-mail: [email protected]).
Vojtěch Zákoutský was a bachelor student in the Faculty of Economics
and Administration, University of Pardubice, Czech Republic (e-mail:
Fig. 1 Web-application Architecture
Of course, the common client of the GeoWeb application is
realized by any type of web-browsers. But, the browsers’
features and capabilities are not primarily oriented to
monitoring of user’s activities. There are very limited means of
feedback from the client to server usable for an activity
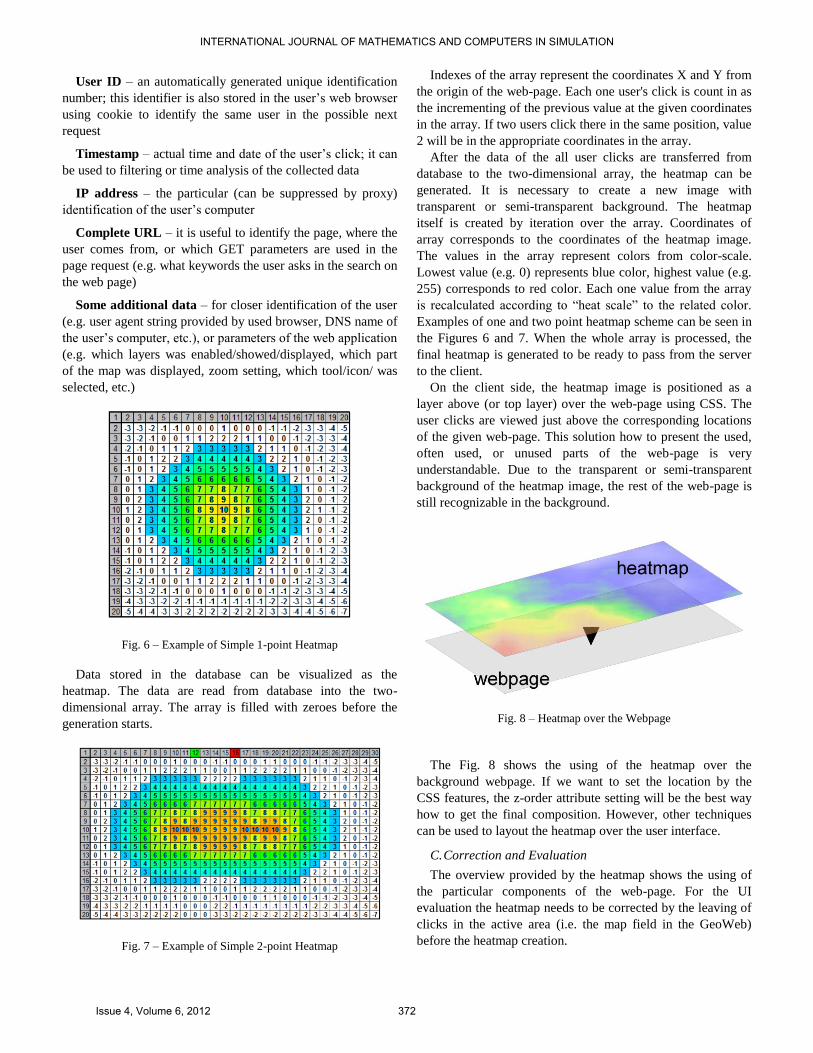
monitoring. As the common implementation of the web-
application is based on client/server architecture (see Fig. 2):
Presentation
Layer
Application
Layer
Data
Layer
Client Part Server Part
HTML
JPEG
PNG
•••
Jscript
VBS
Java
•••
PHP
ASP
JSP
Perl
Python
•••
Filesystem
Database
•••
Fig. 2 – Implementation of the Web-application
Heatmap Generation Techniques used for
GeoWeb Application User-Interface Evaluation
Oldřich Horák, Martin Novák, and Vojtěch Zákoutský
T
INTERNATIONAL JOURNAL OF MATHEMATICS AND COMPUTERS IN SIMULATION
Issue 4, Volume 6, 2012 369

There are three basic layers:
Data layer can be provided by the given server, but some
data can be dynamically loaded or linked from another server
or public services across the local network or Internet.
Application layer has to process the user requests and
provide appropriate responses. This task is typically divided to
be processed partly by server and by client side of the system.
Presentation layer is the user interface used to collect the
request and to visualize the response. [4]
The only way how to monitor the user’s activity is provided
by the scripting tools of the application layer. It is possible to
do it with the tools of the client part, server part, or both. The
monitoring service can be implemented as the embedded part
of given web-application or as the separate application. The
obtained data can be stored within the web-application data
layer or in the dedicated storage.
The next step of the evaluation is any form of users’ activity
visualization. A synoptic view can be the best way to provide
the well-arranged survey of the activities. This form of data
processing output is provided by the “Heatmaps” (see Fig. 3).
Fig. 3 – Heatmap over a Google Page [5]
Heatmap is a graphical representation of user interaction
with graphical interface. In the case of click-monitoring it is
the visualization of the click density. It means two-dimensional
expression of the click rate on the given position in the web-
page. There is easy to identify the parts or locations of the
page that are most clicked or where the users click minimally
(unused locations). The information is well represented by
color-scale to be easy to understand (see Fig. 4). Locations
with a few clicks are represented by blue color that means
“cold”. Red color represents “warm” locations with a higher
click amount. This “thermal” representation is the background
of the term “heatmap”. The heatmaps are often realized as
semi-transparent layer over the webpage. The web-page parts
are visible through the heatmap layer.
Fig. 4 – Typical Color-scale Used for Heatmaps
II. PROBLEM FORMULATION
There are some particular problems in using of the
heatmaps. First, the recording of the user activity is limited by
the features of the web-application scheme, and by the
capabilities of the browsers. Second problem is the calculation
of the heatmap server-side or client-side. The usability
evaluation is the final scope of the exact using of the heatmaps
technique.
A. Data Collection
The activity of the user consists of more parts. For the
simplification, we can say there are two groups of user activity
– input and output. The user receives the information from the
web-page (i.e. reads the text), and pass some information using
the input elements (writes text or clicks the links, etc). The
monitoring of some activities can be difficult and needs some
additional equipment to be connected with the PC. It means
i.e. the eye-tracking technique of the monitoring of the user
reading.
The monitoring of the user clicks using heatmaps doesn’t
need any additional expensive equipment or software. But, the
capabilities of the browser provide limited space to realize the
technique.
B. Heatmap Generation
If the data are collected, the calculation of the heatmap can
be done server-side or client-side. The server-side generation
can be less difficult, because the capabilities of the server part
of the network application don’t depend on the limited features
of the browser. The client-side solution can be required as the
more operative. Most of the clients provide scripting
languages that can be used to heatmap generation, but the
implementation using JavaScript or similar language would be
very difficult.
C. Evaluation using Heatmaps
The heatmap provides the possibility to get the overview
about the using of the particular components of the web-page.
If the heatmap is used for the UI evaluation, the clicks in the
active area (i.e. the map in the GeoWeb) must be removed
from the heatmap generation, except of the clicks on the
control elements (zoom, panning buttons, etc.).
INTERNATIONAL JOURNAL OF MATHEMATICS AND COMPUTERS IN SIMULATION
Issue 4, Volume 6, 2012 370

This correction has to be completed before the heatmap
generation and overall evaluation. The completed heatmap is
then analyzed by human.
III. PROBLEM SOLUTION
The particular problems can be solved separately, but the
generation can depend on the data collection. Some general
techniques can be used for the solution, other has to be
developed.
A. User Clicks Data Collection
The user clicks are detected by JavaScript on the client side.
The coordinates relative to the origin of the web-page are
passed to the server, and saved into the database.
There are some options how to send the data from client to
the server. Table I. gives the brief overview of the important
features of methods usable for the data collection.
Using of the AJAX (Asynchronous JavaScript and XML)
technique gives a solution of the data transmission [6]. But,
some problems appeared by the testing of this technique. The
collection of the user clicks on the web-page must be fast. The
AJAX technology implementation speed depends on the type
of browser, and some browsers manage the AJAX requests
with random delay. It leads to data-lost, if the delay is too
long. It depends on the reloading of the page by the client,
when the server answer isn’t received in the given time-limit,
or the AJAX request queue is not transmitted completely
before the reloading.
Fig. 5 – AJAX Request Restriction
In addition, some web-browsers have security restrictions to
disallow the AJAX requests to the different domain (Fig. 5).
Therefore, monitored web-page, or web-application, must be
located on the same web-server as the heatmaps application.
The AJAX technique was leaved after some testing, because of
its unacceptable behavior and features.
The next possible solution for sending the data to the server
is to use the IFRAME tag of the HTML. The content of this
tag can be on the client side changed dynamically. For sending
data to the server the GET parameters can be used. The
IFRAME solution doesn’t have any security restrictions of
disallowing requests to the different domains in most of the
actual web-browser types. But, in the latest versions of web-
browsers this security restriction can be switch on. We cannot
be sure with the IFRAME tag solution, that the all browsers
collect all the wanted user clicks.
There is one another problem in the IFRAME tag solution.
The content of the IFRAME tag managed as completely
independent web-page by the browser. Therefore, the
IFRAME content consumes some system resources, as
memory and CPU time. If the web-page reload is needed
frequently, it can take some additional time. We realized after
some tests, the IFRAME tag solution is too slow and
unreliable for our purposes.
Third possible solution is using the IMG tag from HTML
language. This tag is used for inserting an image into the web-
page. Web-browser gets the image from the server using the
GET request. We can insert any parameters in this type of
request and send data to the server this way. Example of GET
request with parameters:
<img src=”script.php?X=230&Y=503”
width=”1” height=”1”
style=”display: none;”>
The image source address can be changed via JavaScript
and DOM (Document Object Model). The script.php
processes the GET parameters on the server side, inserts the
coordinates into the database, and returns a transparent image
with size 1x1 pixel. This solution doesn’t have problems with
frequent reload and all data was transferred to the server
quickly and completely in very most cases.
B. Heatmap Generation Solutions
User clicks data are stored in the database. Data in the
database have the X and Y coordinates at least. It is useful to
store some additional information, i.e. an ID of the user, date
and time of the given user click, etc. User ID is generated on
the server to distinguish between more users. A customized
heatmaps can be generated with this additional data – for
example the heatmap of given user clicks in specified day, and
so on. The minimal structure of the database table has to have
these elementary fields:
Position – the X and Y coordinate of the user’s click on the
web page stored in pixels as the distance from left and top
edge of the browser’s viewport
www.domain1.com webpage
www.domain2.com
TABLE I
USER CLICKS DATA COLLECTION METHOD COMPARISON
Feature Method
AJAX Technique <IFRAME> Tag <IMG> Tag
Resources consumption
per request bigger normal less
Speed of request
processing
slowest
(browser dependent) normal fastest
Reliability often data lost sometime data lost no data lost
Cross-domain request mostly impossible
(browser dependent)
possible warning
(browser dependent) possible
possible request
forbidden request
INTERNATIONAL JOURNAL OF MATHEMATICS AND COMPUTERS IN SIMULATION
Issue 4, Volume 6, 2012 371
User ID – an automatically generated unique identification
number; this identifier is also stored in the user’s web browser
using cookie to identify the same user in the possible next
request
Timestamp – actual time and date of the user’s click; it can
be used to filtering or time analysis of the collected data
IP address – the particular (can be suppressed by proxy)
identification of the user’s computer
Complete URL – it is useful to identify the page, where the
user comes from, or which GET parameters are used in the
page request (e.g. what keywords the user asks in the search on
the web page)
Some additional data – for closer identification of the user
(e.g. user agent string provided by used browser, DNS name of
the user’s computer, etc.), or parameters of the web application
(e.g. which layers was enabled/showed/displayed, which part
of the map was displayed, zoom setting, which tool/icon/ was
selected, etc.)
Fig. 6 – Example of Simple 1-point Heatmap
Data stored in the database can be visualized as the
heatmap. The data are read from database into the two-
dimensional array. The array is filled with zeroes before the
generation starts.
Fig. 7 – Example of Simple 2-point Heatmap
Indexes of the array represent the coordinates X and Y from
the origin of the web-page. Each one user's click is count in as
the incrementing of the previous value at the given coordinates
in the array. If two users click there in the same position, value
2 will be in the appropriate coordinates in the array.
After the data of the all user clicks are transferred from
database to the two-dimensional array, the heatmap can be
generated. It is necessary to create a new image with
transparent or semi-transparent background. The heatmap
itself is created by iteration over the array. Coordinates of
array corresponds to the coordinates of the heatmap image.
The values in the array represent colors from color-scale.
Lowest value (e.g. 0) represents blue color, highest value (e.g.
255) corresponds to red color. Each one value from the array
is recalculated according to “heat scale” to the related color.
Examples of one and two point heatmap scheme can be seen in
the Figures 6 and 7. When the whole array is processed, the
final heatmap is generated to be ready to pass from the server
to the client.
On the client side, the heatmap image is positioned as a
layer above (or top layer) over the web-page using CSS. The
user clicks are viewed just above the corresponding locations
of the given web-page. This solution how to present the used,
often used, or unused parts of the web-page is very
understandable. Due to the transparent or semi-transparent
background of the heatmap image, the rest of the web-page is
still recognizable in the background.
Fig. 8 – Heatmap over the Webpage
The Fig. 8 shows the using of the heatmap over the
background webpage. If we want to set the location by the
CSS features, the z-order attribute setting will be the best way
how to get the final composition. However, other techniques
can be used to layout the heatmap over the user interface.
C. Correction and Evaluation
The overview provided by the heatmap shows the using of
the particular components of the web-page. For the UI
evaluation the heatmap needs to be corrected by the leaving of
clicks in the active area (i.e. the map field in the GeoWeb)
before the heatmap creation.
INTERNATIONAL JOURNAL OF MATHEMATICS AND COMPUTERS IN SIMULATION
Issue 4, Volume 6, 2012 372
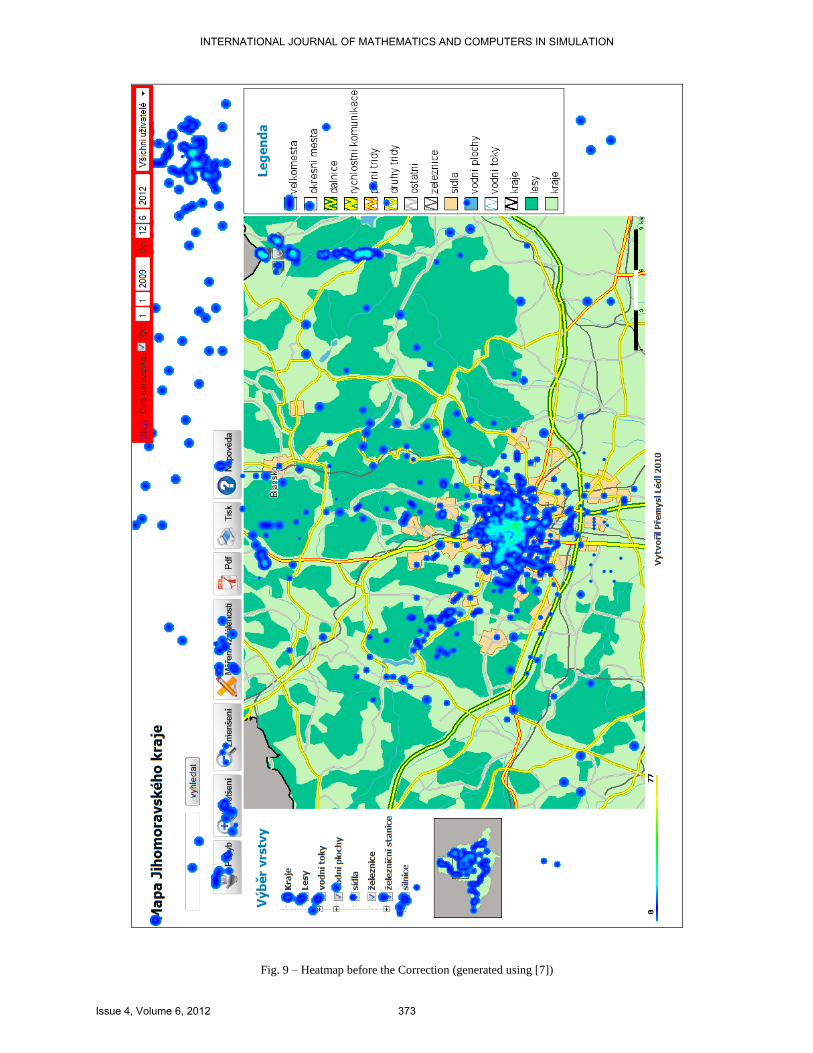
Fig. 9 – Heatmap before the Correction (generated using [7])
INTERNATIONAL JOURNAL OF MATHEMATICS AND COMPUTERS IN SIMULATION
Issue 4, Volume 6, 2012 373
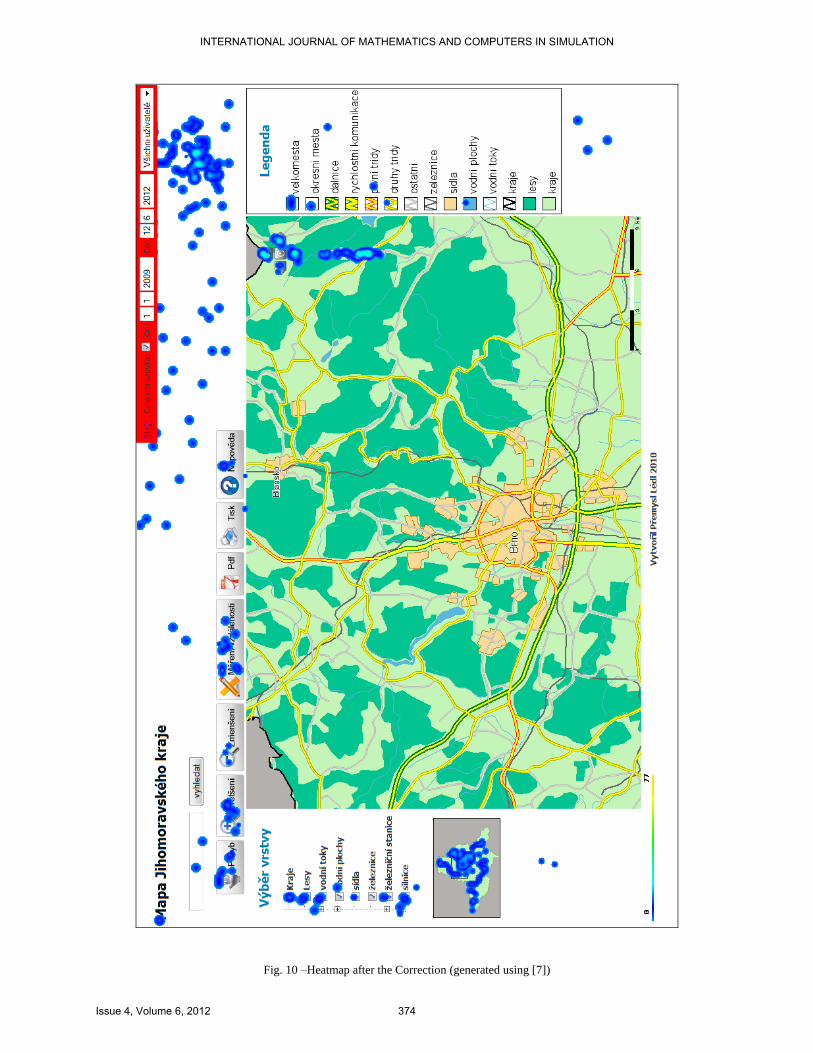
Fig. 10 –Heatmap after the Correction (generated using [7])
INTERNATIONAL JOURNAL OF MATHEMATICS AND COMPUTERS IN SIMULATION
Issue 4, Volume 6, 2012 374
The correction is demonstrated on Fig. 9 (without the
correction), and Fig. 10, where the clicks in the map area are
removed before the heatmap is generated. The human analyze
is not affected by the clicks in the map, and only the UI can be
evaluated.
It means we have to prepare the definitions of control areas
to be able to distinguish the proper clicks for selection. Any
clicks in the active area have to be separated before the
heatmap generation. It can be combined with the given
GeoWeb application if possible [8].
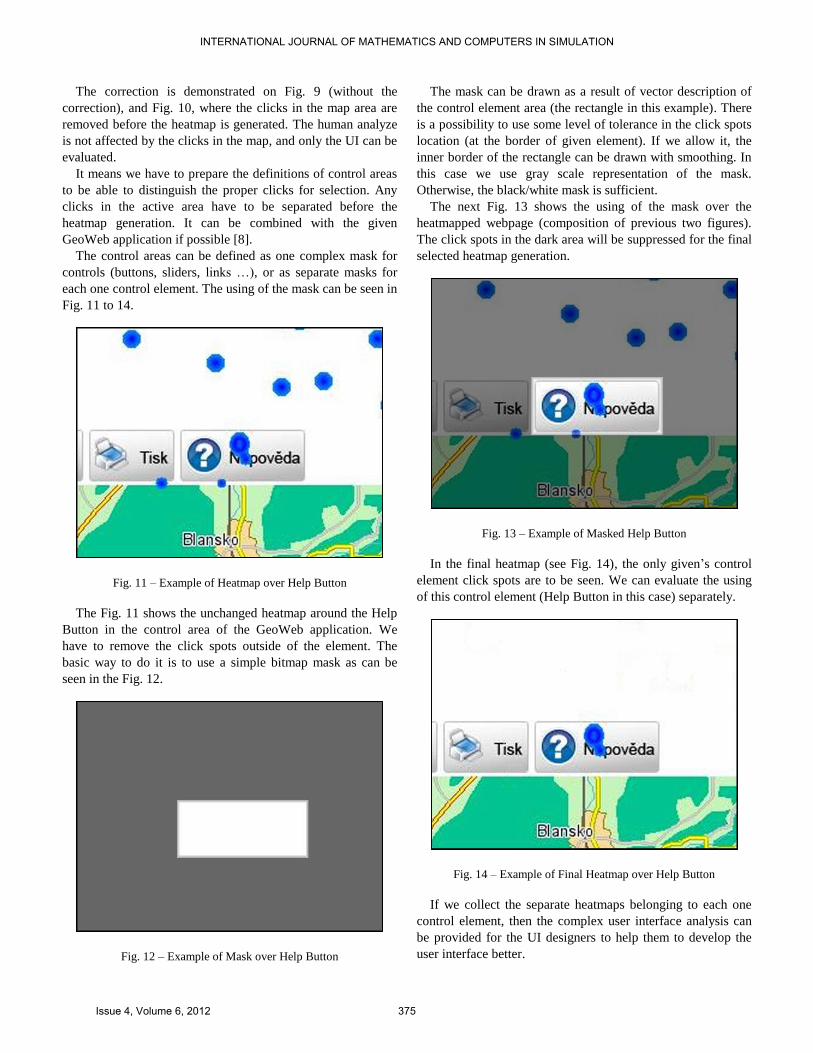
The control areas can be defined as one complex mask for
controls (buttons, sliders, links …), or as separate masks for
each one control element. The using of the mask can be seen in
Fig. 11 to 14.
Fig. 11 – Example of Heatmap over Help Button
The Fig. 11 shows the unchanged heatmap around the Help
Button in the control area of the GeoWeb application. We
have to remove the click spots outside of the element. The
basic way to do it is to use a simple bitmap mask as can be
seen in the Fig. 12.
Fig. 12 – Example of Mask over Help Button
The mask can be drawn as a result of vector description of
the control element area (the rectangle in this example). There
is a possibility to use some level of tolerance in the click spots
location (at the border of given element). If we allow it, the
inner border of the rectangle can be drawn with smoothing. In
this case we use gray scale representation of the mask.
Otherwise, the black/white mask is sufficient.
The next Fig. 13 shows the using of the mask over the
heatmapped webpage (composition of previous two figures).
The click spots in the dark area will be suppressed for the final
selected heatmap generation.
Fig. 13 – Example of Masked Help Button
In the final heatmap (see Fig. 14), the only given’s control
element click spots are to be seen. We can evaluate the using
of this control element (Help Button in this case) separately.
Fig. 14 – Example of Final Heatmap over Help Button
If we collect the separate heatmaps belonging to each one
control element, then the complex user interface analysis can
be provided for the UI designers to help them to develop the
user interface better.
INTERNATIONAL JOURNAL OF MATHEMATICS AND COMPUTERS IN SIMULATION
Issue 4, Volume 6, 2012 375

IV. CONCLUSION AND THE FUTURE WORK
The main task of the heatmaps using is get the overview
about the user behavior and activity related to given UI (web-
page) without special hardware or expensive software. The
described solution uses the user clicks recording to the
sufficiently predicative visualization method.
The solution uses the client/server architecture. The data
collecting is solved on the client side by the JavaScript as the
universal solution independent on the browser type. The server
side provides database and PHP scripting capability for the
data storing and the final heatmap generation. The heatmap is
then send to the client and positioned over the original web-
page using CSS attributes. The final view is simply understood
and can provide good overview for the GeoWeb UI usability
evaluation.
There are some recommendations and ways of support
solution to distinguish the focused areas of the user interface
of the GeoWeb application [9], and the web-application in
general [10].
In the future it will be important to keep maximal platform
independent solution. This heatmap application must still work
in the different types of operating system and on the different
browsers. The user discrimination with “different” web-
browser is unacceptable.
More tasks are in the definition and evaluation of the parts
of the user interface. The one of the ways is to enhance the set
of elements of web information architecture (Tab. II) to be
useful for the GeoWeb application. The similar description to
[10] can be useful for the proper evaluation of given user
interface in general.
The next area of extension is the using devices with touch-
screen control and multi-touch interface. There are more evens
than clicks leading to difficulties in the heatmap data
collection. These new modes of application input require a
new point of view on the user interface usability evaluation.
We have to define new standards for the user interaction with
the application, and redefine the static heatmap evaluation
methods to be usable for the dynamic interface environment.
GeoWeb applications used i.e. in the information kiosks use
the touch-screen control as a standard input. The UI usability
evaluation provides the way to develop these applications
better.
ACKNOWLEDGMENT
This work was supported in part by the Grant Agency of the
Czech Republic under Grant project no. 402/09/0219, and in
part by the Student Grant Agency of University of Pardubice.
REFERENCES
[1] H. M. El-Bakry, et al., “Adaptive User Interface for Web Applications,”
in RECENT ADVANCES in BUSINESS ADMINISTRATION:
Proceedings of the 4th WSEAS International Conference on BUSINESS
ADMINISTRATION (ICBA '10), University of Cambridge, UK,
February 20-22, 2010, pp. 190-211.
[2] H. M. El-Bakry, N. Mastorakis, “User Interface for Internet
Applications,” in Proceedings of the 9th WSEAS International
Conference on APPLIED INFORMATICS AND COMMUNICATIONS
(AIC '09), Moscow, Russia, August 20-22, 2009, pp. 383-398.
[3] J. Komarkova, et al., “Problems in Usability of Web-Based GIS,” in
Proceedings of the International Conference on Applied Computer
Science (ACS), Malta, September 15-17, 2010, pp. 419-425.
[4] J. Komarkova, O. Visek, and M. Novak, “Heuristic Evaluation of
Usability of GeoWeb Sites,” in Lecture Notes in Computer Science, vol.
4857, 2007, pp. 264-278.
[5] J. Nielsen, F-Shaped Pattern For Reading Web Content, useit.com
2006. Online at:
<{http://www.useit.com/alertbox/reading_pattern.html>.
[6] J. J. Garrett, Ajax: A New Approach to Web Applications.
Www.adaptivepath.com 2005. Online at:
<http://www.adaptivepath.com/ideas/essays/archives/000385.php>.
[7] P. Lédl, AJAX a jeho využití v GIS aplikacích, Bachelor thesis, Institute
of System Engineering and Informatics, Faculty of Economics and
Administration, University of Pardubice, 2010. Supervisor: M. Novák,
(AJAX and its usage in GIS applications. Available in Czech only).
[8] R. García et al., “A Descriptive Model for Predicting Popular Areas in a
Web Map,” in Proceedings of the 10th WSEAS international
conference on Artificial intelligence, knowledge engineering and data
bases (AIKED'11), pp. 397-402, ISBN: 978-960-474-273-8.
[9] A. Ciuffreda and D. Rigas, “A usability study of multimodal interfaces
for the presentation of internet search results,” in INTERNATIONAL
JOURNAL OF COMPUTERS, Issue 2, Volume 2, 2008, pp. 120-125,
ISSN: 1998-4308
[10] Y. Kishimoto, “Web page Information Architecture Formalization
Method and It’s an Example,” in INTERNATIONAL JOURNAL OF
COMPUTERS, Issue 1, Volume 3, 2009, pp. 53-62, ISSN: 1998-4308
Oldřich Horák was born in Vrchlabí, Czech Republic in 1973. His
educational background: the bachelor degree (Bc.) in Applied Informatics
(2004), the master degree (Ing.) in Information Management (2006), both at
Faculty of Informatics and Management, Univerzity of Hradec Králové,
Czech Republic; he is a student of doctoral study programme in Systems
Engineering and Informatics, Informatics in Public Administration at Faculty
of Economics and Public Administration, University of Pardubice, Czech
Republic.
He worked in informatics and accounting department of house of
correction “Husův domov” in Dvůr Králové nad Labem, Czech Republic
(1993-1997), and as a secondary school teacher of computer networks,
programming, and accounting at SPS in Dvůr Králové nad Labem, Czech
Republic (1997-2004). Now he is a lecturer at Institute of System Engineering
and Informatics, Faculty of Economics and Public Administration, University
of Pardubice, Czech Republic.
TABLE II
ELEMENTS OF WEB INFORMATION ARCHITECTURE [10]
Category Attribute
Browsing support
Global Navigation
Local navigation
Context navigation
Site map
Site index
Site guide
Other navigation
Support of search Search interface
Search zone
Contents task
Headline
Embedded link
Embedded meta data
Chunk
List
Continuous step
Identifier
INTERNATIONAL JOURNAL OF MATHEMATICS AND COMPUTERS IN SIMULATION
Issue 4, Volume 6, 2012 376
Martin Novák was born in Pardubice, Czech Republic in 1979. His
educational background: the bachelor degree (Bc.) in Faculty of Electrical
Engineering and Computer Science, branch electronical parts and systems
(2000), the master degree (Ing.) in Faculty of Mechanical Engineering, branch
informatics and automatization for engineers (2004), both in the Brno
University of Technology, Czech Republic. Now he is a student of doctoral
study programme in Electrical Engineering and Informatics, Study field
Information, Communication and Control Technologies, in Faculty of
Electrical Engineering and Informatics, University of Pardubice, Czech
Republic.
He worked in VCES a.s. as programmer and analyst (2002-2003), in
Šmidberský Transport a.s. as network administrator (2004) and in Profimedia
CZ s.r.o. as IT specialist (2005). Now he is a lecturer at Institute of System
Engineering and Informatics, Faculty of Economics and Public
Administration, University of Pardubice, Czech Republic.
Vojtěch Zákoutský was a student and succesfully finished a bachelor study
programme Informatics in Public Administration, in the Faculty of
Economics and Administration, University of Pardubice, Czech Republic
(2011).
INTERNATIONAL JOURNAL OF MATHEMATICS AND COMPUTERS IN SIMULATION
Issue 4, Volume 6, 2012 377
Recommended