Healthy People. Healthy Community. Healthy Future.
Cecil County Local Health Improvement Plan (LHIP) Update
Presentation to the Community Health Advisory Committee
Daniel Coulter, MPH, Health [email protected] | 443-245-3767
January 15, 2014
Healthy People. Healthy Community. Healthy Future.
Overview
• LHIP Background• LHIP Priorities• Summary of Activities• Data Summary• Future Directions
Healthy People. Healthy Community. Healthy Future.
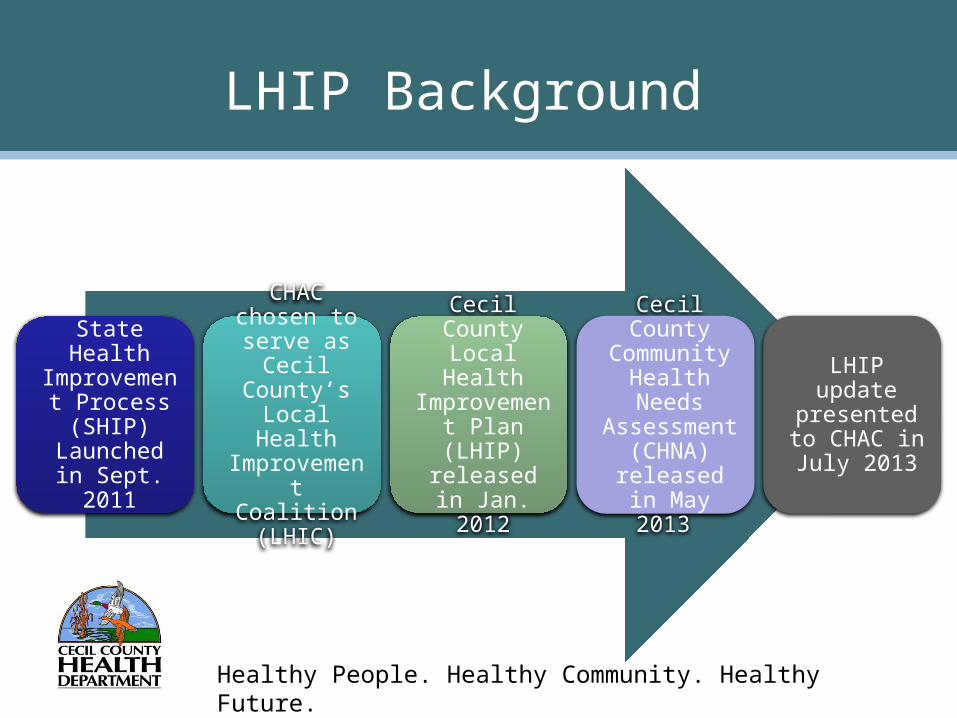
LHIP Background
State Health Improvement
Process (SHIP)
Launched in Sept. 2011
CHAC chosen to serve as
Cecil County’s Local Health Improvement
Coalition (LHIC)
Cecil County Local Health Improvement Plan (LHIP) released in Jan. 2012
Cecil County Community
Health Needs Assessment
(CHNA) released in May 2013
LHIP update presented to CHAC in July
2013
Healthy People. Healthy Community. Healthy Future.
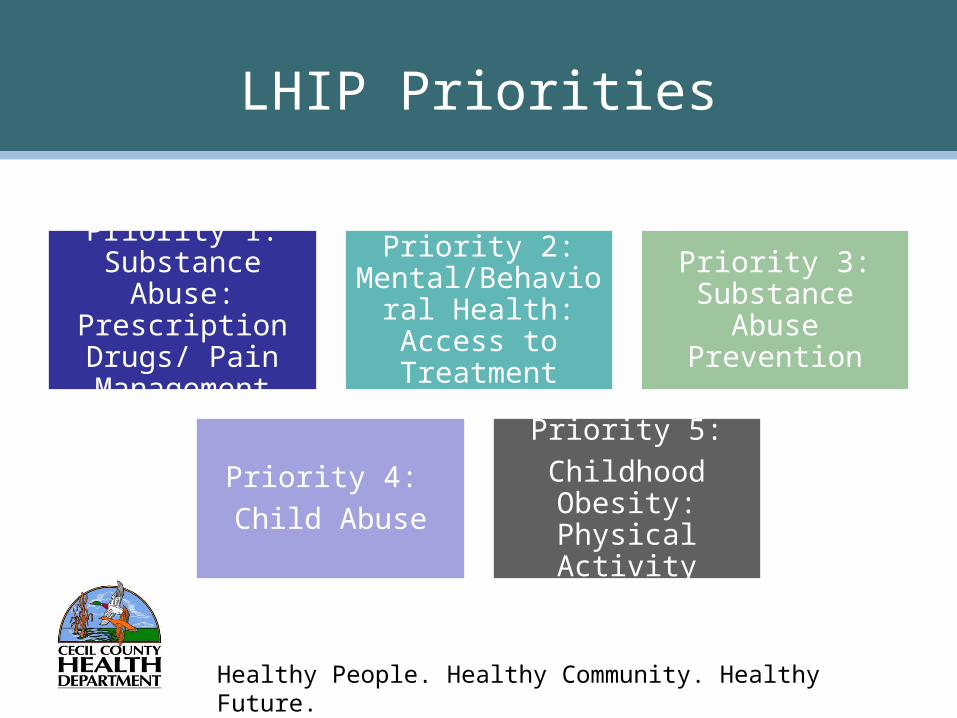
LHIP Priorities
Priority 1: Substance Abuse: Prescription Drugs/ Pain Management
Priority 2: Mental/Behavioral Health: Access to
Treatment
Priority 3: Substance Abuse
Prevention
Priority 4:
Child Abuse
Priority 5:
Childhood Obesity: Physical Activity

Healthy People. Healthy Community. Healthy Future.
Priority 1 Update: Substance Abuse: Prescription Drugs/ Pain Management
• 2013 Substance Abuse Assessment• Local Overdose Fatality Review Team
(LOFRT)• Overdose Response Program• Drug Take Back Events• MD Prescription Drug Monitoring Program• Provider Education

Healthy People. Healthy Community. Healthy Future.
Priority 3 Update: Substance Abuse Prevention
• Substance Abuse Assessment• DAAC Plan• Anonymous People Screenings• Engagement of Governance• Newspaper Series• Educational Materials • Substance Abuse Prevention Forums

Priority 1 & 3 SHIP Data
SHIP 2011 (2007-2009)
SHIP 2012 (2008-2010)
SHIP 2013 (2009-2011)
SHIP 2014 (2010-2012)
0
5
10
15
20
25
30
35
13.5 12.6 12.4 12.7
23 21.8
26.729.2
Drug- Induced Death Rate per 100,000 Popula-tion
MarylandCecil
• HP 2020 Goal: 11.3 • MD 2014 Goal: 12.4Source: Maryland DHMH Vital Statistics Administration (VSA)

Priority 1 & 3 SHIP Data
MontgomeryPrince George's
HowardSaint Mary's
FrederickCharlesCarroll
MarylandWashington
Anne ArundelWicomico
CalvertBaltimore County
HarfordAlleganyCaroline
Baltimore CityCecil
0.0 5.0 10.0 15.0 20.0 25.0 30.0 35.0
29.2Drug- Induced Death Rate County Comparison
SHIP 2014 (2010-2012) data
MD 2014 Goal: 12.4

Priority 1 & 3 SHIP Data
SHIP 2011 (2010) SHIP 2012 (2011) SHIP 2013 (2012) SHIP 2014 (2013)0
500
1000
1500
2000
2500
1149.81275.6
1445.2 1521.81515.2
2088.62179
2018.4
ED Visits for Addictions- Related Conditions per 100,000 Population
MarylandCecil
• MD 2014 Goal: 1092.3Source: Maryland Health Services Cost Review Commission (HSCRC)
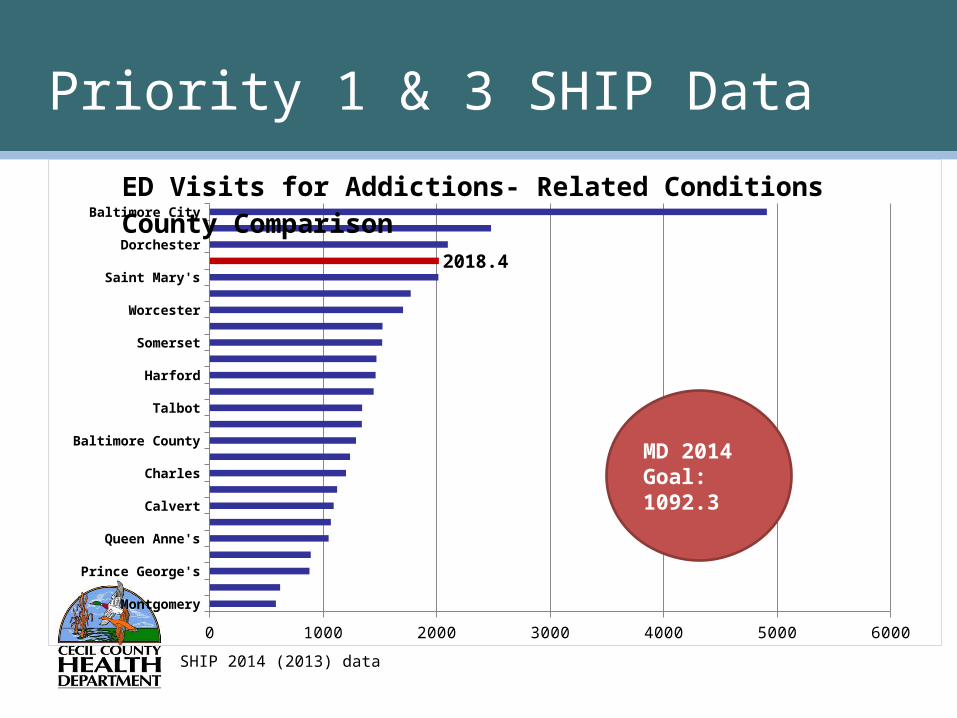
Priority 1 & 3 SHIP Data
MontgomeryHoward
Prince George'sGarrett
Queen Anne'sCarrollCalvert
FrederickCharles
CarolineBaltimore County
AlleganyTalbot
KentHarford
Anne ArundelSomersetMaryland
WorcesterWashingtonSaint Mary's
CecilDorchester
WicomicoBaltimore City
0 1000 2000 3000 4000 5000 6000
2018.4
ED Visits for Addictions- Related Conditions County Comparison
MD 2014 Goal: 1092.3
SHIP 2014 (2013) data
Additional Substance Abuse Data
Prince George'sSomersetWicomico
CharlesMontgomery
DorchesterHoward
KentWashington
MarylandAllegany
BaltimoreHarford
TalbotBaltimore City
CarolineFrederick
GarrettCalvert
CecilWorcester
Anne ArundelSt. Mary's
CarrollQueen Anne's
0% 5% 10% 15% 20% 25%
18%
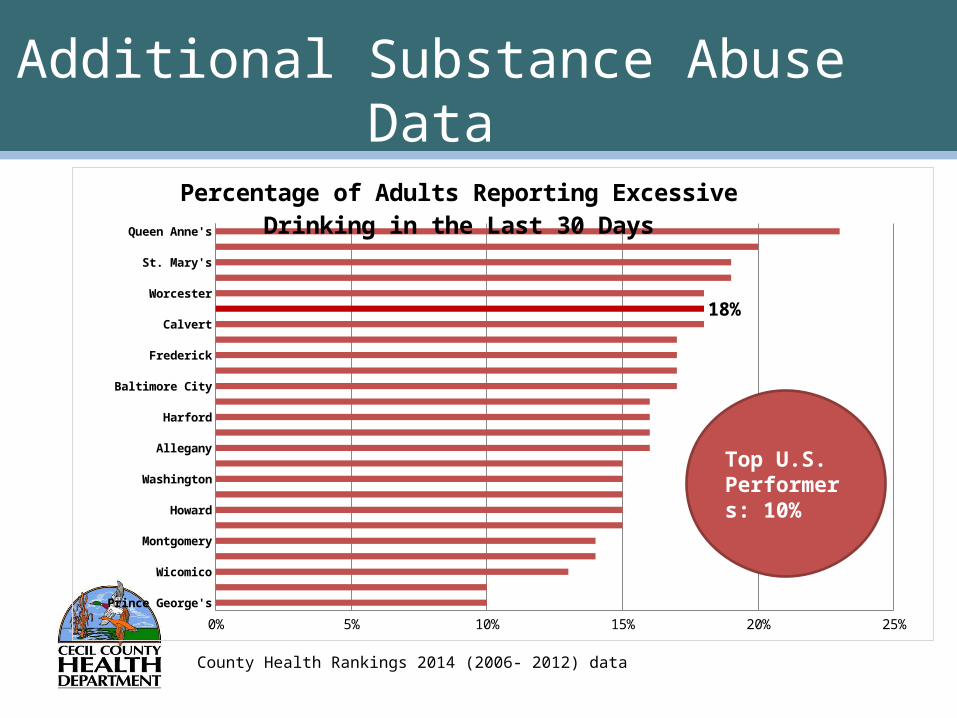
Percentage of Adults Reporting Excessive Drinking in the Last 30 Days
Top U.S. Performers: 10%
County Health Rankings 2014 (2006- 2012) data
Additional Substance Abuse Data
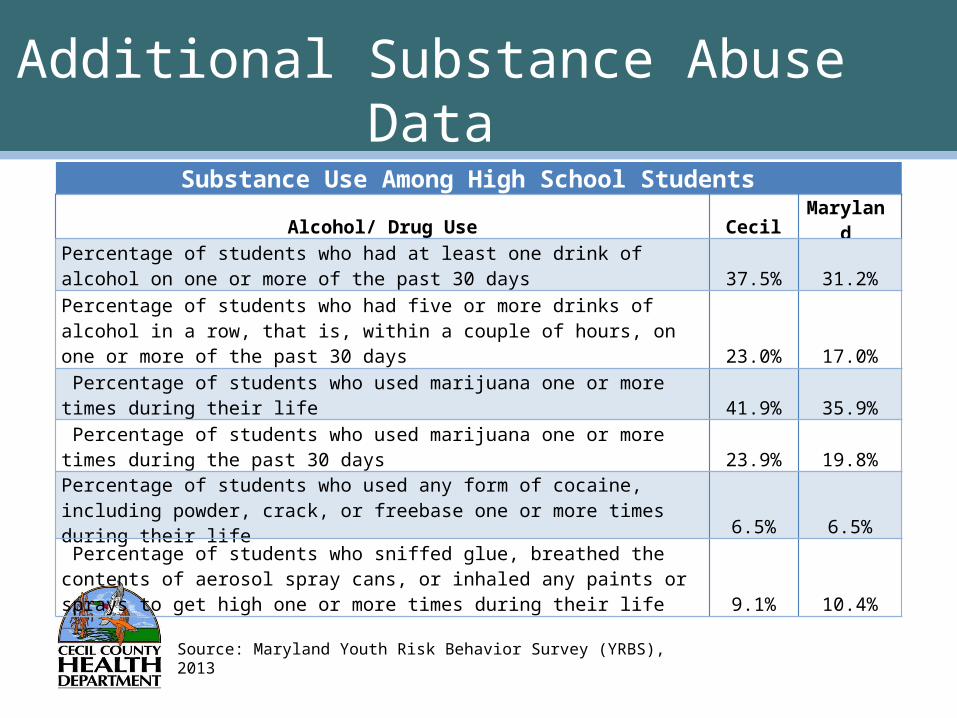
Source: Maryland Youth Risk Behavior Survey (YRBS), 2013
Substance Use Among High School StudentsAlcohol/ Drug Use Cecil Maryland
Percentage of students who had at least one drink of alcohol on one or more of the past 30 days 37.5% 31.2%
Percentage of students who had five or more drinks of alcohol in a row, that is, within a couple of hours, on one or more of the past 30 days 23.0% 17.0%
Percentage of students who used marijuana one or more times during their life 41.9% 35.9%
Percentage of students who used marijuana one or more times during the past 30 days 23.9% 19.8%
Percentage of students who used any form of cocaine, including powder, crack, or freebase one or more times during their life 6.5% 6.5%
Percentage of students who sniffed glue, breathed the contents of aerosol spray cans, or inhaled any paints or sprays to get high one or more times during their life 9.1% 10.4%

Additional Substance Abuse Data
Source: Maryland Youth Risk Behavior Survey (YRBS), 2013
Substance Use Among High School StudentsAlcohol/ Drug Use Cecil Maryland
Percentage of students who used heroin one or more times during their life 4.5% 4.9% Percentage of students who used methamphetamines one or more times during their life 4.1% 5.0%
Percentage of students who used ecstasy one or more times during their life 7.4% 8.3%
Percentage of students who took steroid pills or shots without a doctor's prescription one or more times during their life 3.9% 5.1%
Percentage of students who have taken a prescription drug (such as OxyContin, Percocet, Vicodin, codeine, Adderall, Ritalin, or Xanax) without a doctor's prescription one or more times during their life 15.7% 15.2%Percentage of students who used a needle to inject any illegal drug into their body one or more times during their life 3.6% 3.9%
Percentage of students who were offered, sold, or given an illegal drug by someone on school property during the past 12 months 25.6% 29.1%
Healthy People. Healthy Community. Healthy Future.
Priority 2 Update: Mental/Behavioral Health: Access to Treatment
• Mental Health Needs Assessment and Annual Plan• Eastern Shore Mobile Crisis (ESMC)• Emergency Room & Hospital Intervention Project• Crisis Intervention Team• Telepsychiatry Program• Behavioral Health Integration in Pediatric Primary
Care (B-HIPP)• Resource Directory

Priority 2 SHIP Data
SHIP 2011 (2010) SHIP 2012 (2011) SHIP 2013 (2012) SHIP 2014 (2013)0
2000
4000
6000
8000
10000
12000
2792.2 3256.33564.8 3375.1
6864.9
9715.410272.8
8695.7
ED Visits Related to Mental Health Disorders per 100,000 Population
MarylandCecil
• MD 2014 Goal: 2652.6Source: Maryland Health Services Cost Review Commission (HSCRC)

Priority 2 SHIP Data
Prince George'sMontgomery
HowardCalvert
Queen Anne'sBaltimore County
CharlesHarford
KentCarroll
MarylandFrederick
TalbotAnne Arundel
AlleganyCaroline
SomersetWicomico
Baltimore CityWorcester
GarrettSaint Mary'sWashingtonDorchester
Cecil
0 1000 2000 3000 4000 5000 6000 7000 8000 9000 10000
8695.7ED Visits Related to Mental Health Disorders County Compar-
ison
MD 2014 Goal: 2652.6
SHIP 2014 (2013) data

Priority 2 SHIP Data
SHIP 2011 (2009) SHIP 2012 (2010) SHIP 2013 (2011) SHIP 2014 (2012)0
2
4
6
8
10
12
14
16
18
9.68.7
9.4 9.5
13.712.6
17.1
14.4
Suicide Rate per 100,000 Population
MarylandCecil
• HP 2020 Goal: 10.2 • MD 2014 Goal: 9.1Source: Maryland DHMH Vital Statistics Administration (VSA)
Priority 2 SHIP Data
SHIP 2011 (2010) SHIP 2012 (2011) SHIP 2013 (2012) SHIP 2014 (2013)0
50
100
150
200
250
300
350
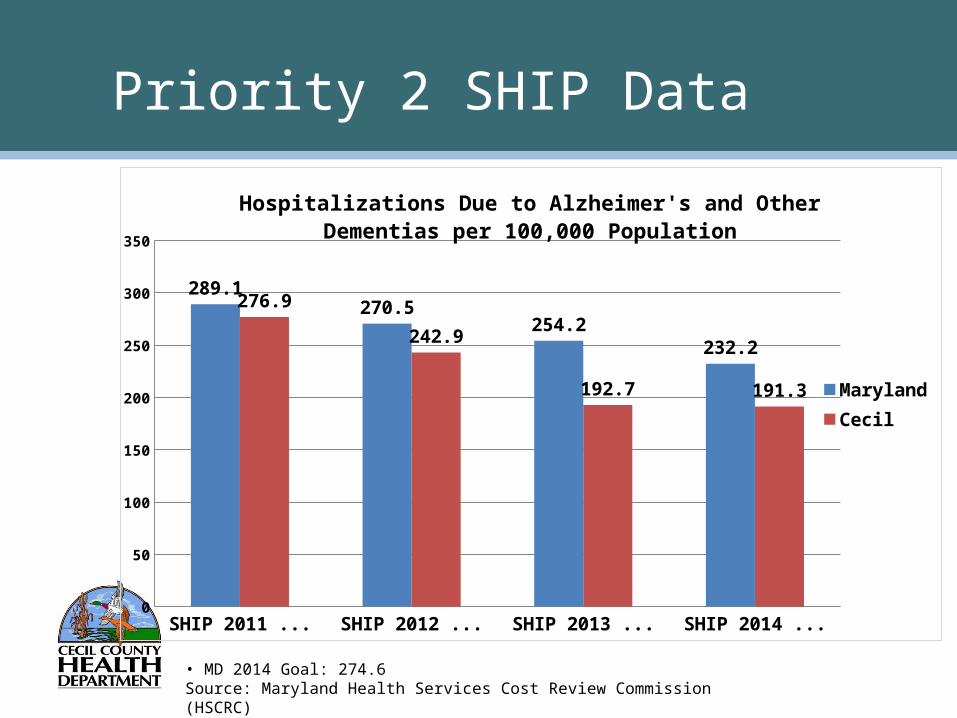
289.1270.5
254.2232.2
276.9
242.9
192.7 191.3
Hospitalizations Due to Alzheimer's and Other Dementias per 100,000 Population
MarylandCecil
• MD 2014 Goal: 274.6Source: Maryland Health Services Cost Review Commission (HSCRC)
Additional Mental/ Behavioral Health Data
0.00%
5.00%
10.00%
15.00%
20.00%
25.00%
30.00%
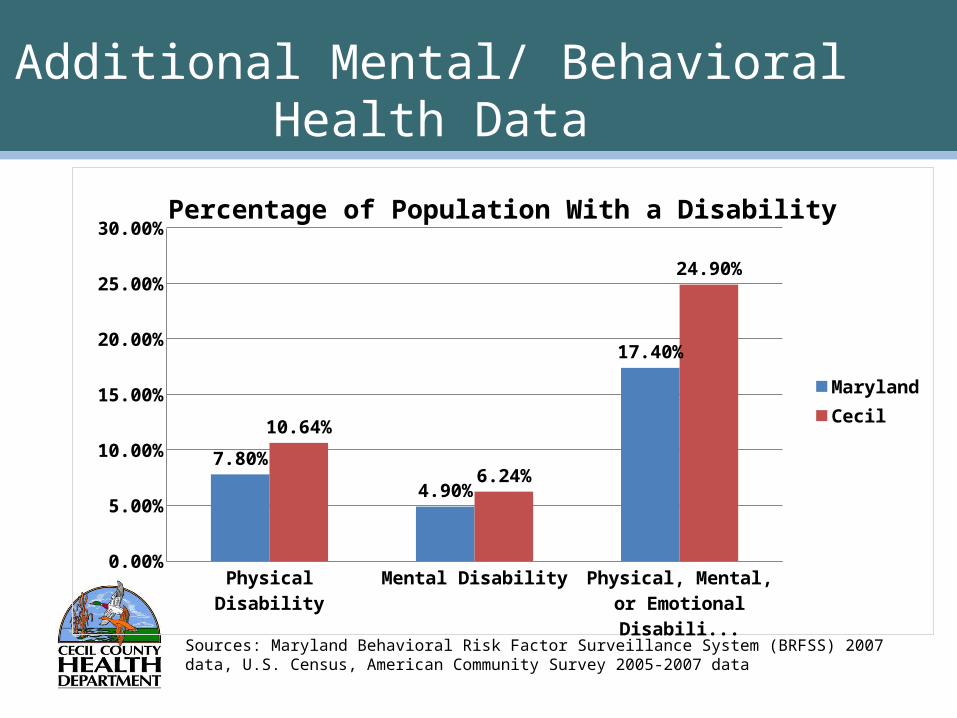
7.80%
4.90%
17.40%
10.64%
6.24%
24.90%
Percentage of Population With a Disability
MarylandCecil
Sources: Maryland Behavioral Risk Factor Surveillance System (BRFSS) 2007 data, U.S. Census, American Community Survey 2005-2007 data

HowardMontgomery
CharlesSt. Mary's
DorchesterPrince George's
TalbotAnne Arundel
FrederickQueen Anne's
MarylandCarroll
KentWicomicoWorcesterBaltimore
CalvertGarrett
WashingtonAllegany
HarfordBaltimore City
CecilCaroline
Somerset
0 0.5 1 1.5 2 2.5 3 3.5 4 4.5
3.9
Average Number of Mentally Unhealthy Days per 30 Day Period
Additional Mental/ Behavioral Health Data
County Health Rankings 2014 (2006-2012) dataSource: CDC, Behavioral Risk Factor Surveillance System (BRFSS)
Top U.S. Performers: 2.4 days

Additional Mental/ Behavioral Health Data
Maryland Cecil78.5%
79.0%
79.5%
80.0%
80.5%
81.0%
81.5%
82.0%
82.5%
83.0%
83.5%
80.1%
82.8%
Percentage of Adults Receiving Sufficient Social- Emotional Support
Source: Maryland Behavioral Risk Factor Surveillance System (BRFSS) 2005-2010 data
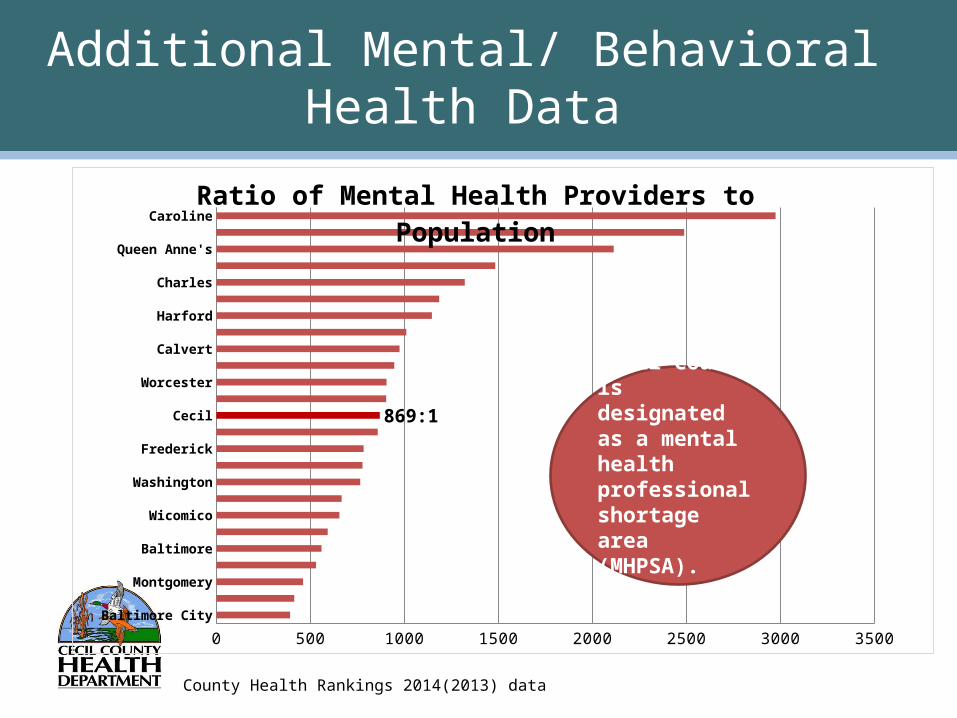
Additional Mental/ Behavioral Health Data
Baltimore CityTalbot
MontgomeryHoward
BaltimoreDorchesterWicomicoMaryland
WashingtonKent
FrederickCarroll
CecilAllegany
WorcesterAnne Arundel
CalvertSomerset
HarfordSt. Mary's
CharlesPrince George's
Queen Anne'sGarrett
Caroline
0 500 1000 1500 2000 2500 3000 3500
869:1
Ratio of Mental Health Providers to Population
County Health Rankings 2014(2013) data
Cecil County is designated as a mental health professional shortage area (MHPSA).

Healthy People. Healthy Community. Healthy Future.
Priority 4 Update: Child Abuse
• Strengthening Families Program• Darkness to Light: Stewards of Children
Training• Identification of Crisis Lines• Anti- Bullying Educational Materials• Pinwheels for Prevention Campaign
(planned for April, 2015)

Priority 4 SHIP Data
SHIP 2012 (2011) SHIP 2013 (2012) SHIP 2014 (2013)0
5
10
15
20
25
9.310.2
9.2
18.420.1
16.5
Child Maltreatment Rate per 1,000 Children Under the Age of 18
MarylandCecil
• HP 2020 Goal: 8.5 • MD 2014 Goal: 4.8Source: Maryland Department of Human Resources (DHR)
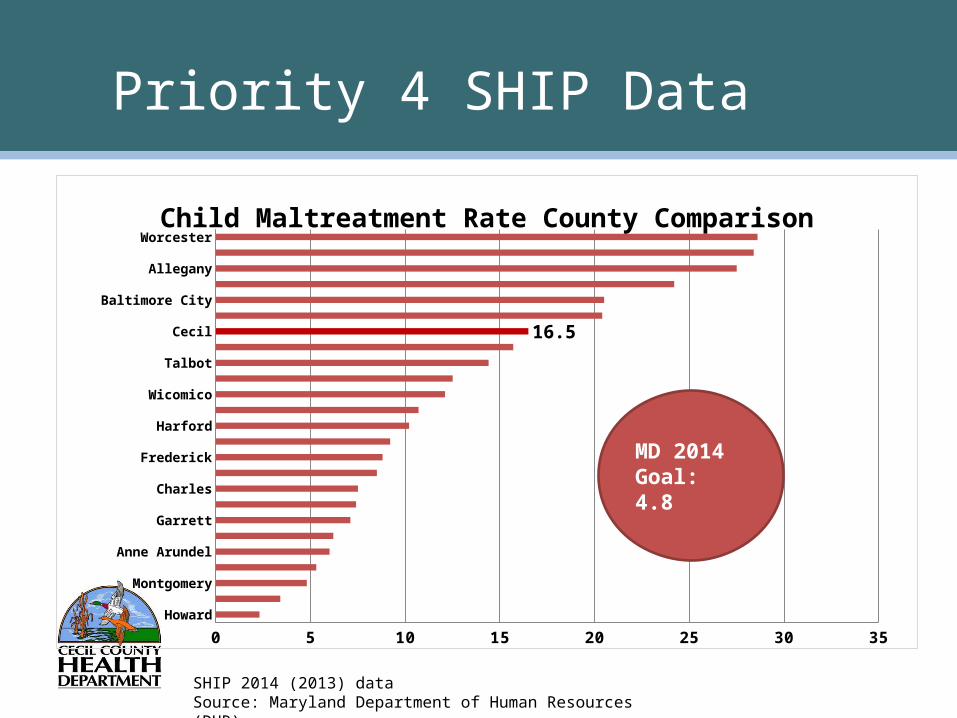
HowardCarroll
MontgomeryQueen Anne'sAnne Arundel
Saint Mary'sGarrett
Prince George'sCharles
Baltimore CountyFrederickMaryland
HarfordCalvert
WicomicoKent
TalbotCaroline
CecilWashington
Baltimore CitySomersetAllegany
DorchesterWorcester
0 5 10 15 20 25 30 35
16.5
Child Maltreatment Rate County Comparison
Priority 4 SHIP Data
SHIP 2014 (2013) dataSource: Maryland Department of Human Resources (DHR)
MD 2014 Goal: 4.8
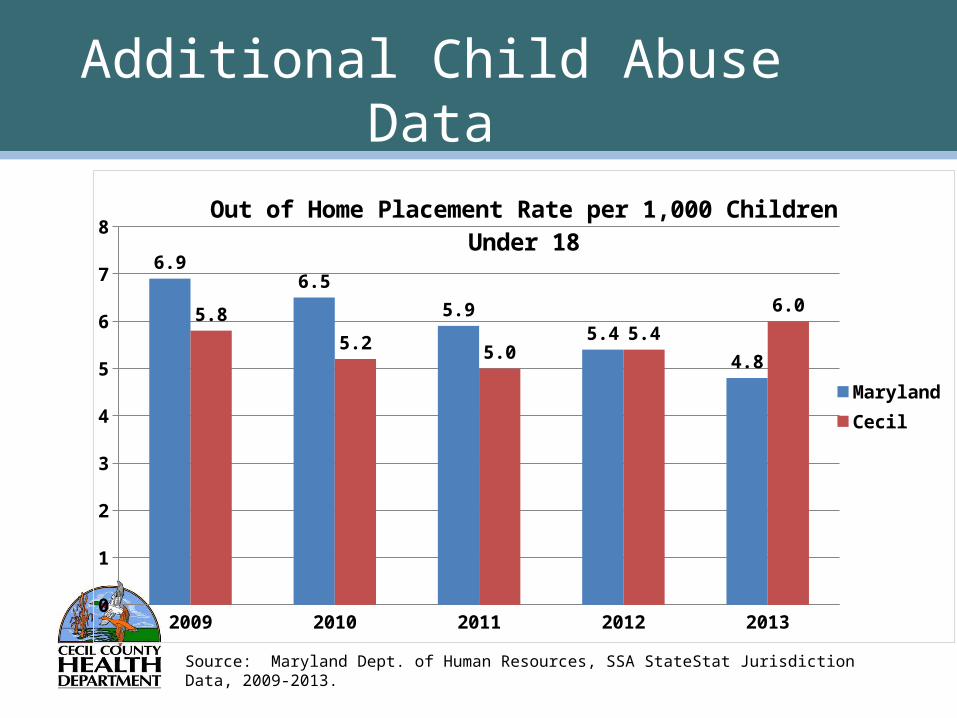
Additional Child Abuse Data
2009 2010 2011 2012 20130
1
2
3
4
5
6
7
8
6.96.5
5.95.4
4.8
5.8
5.2 5.05.4
6.0
Out of Home Placement Rate per 1,000 Children Under 18
MarylandCecil
Source: Maryland Dept. of Human Resources, SSA StateStat Jurisdiction Data, 2009-2013.

Healthy People. Healthy Community. Healthy Future.
Priority 5 Update: Childhood Obesity: Physical Activity
• Community Transformation Grant
• Just a Minute School Program• Other School Based Physical Fitness
Activities• Expansion of CCPS Breakfast Program• Updated Nutrition Standards for CCPS
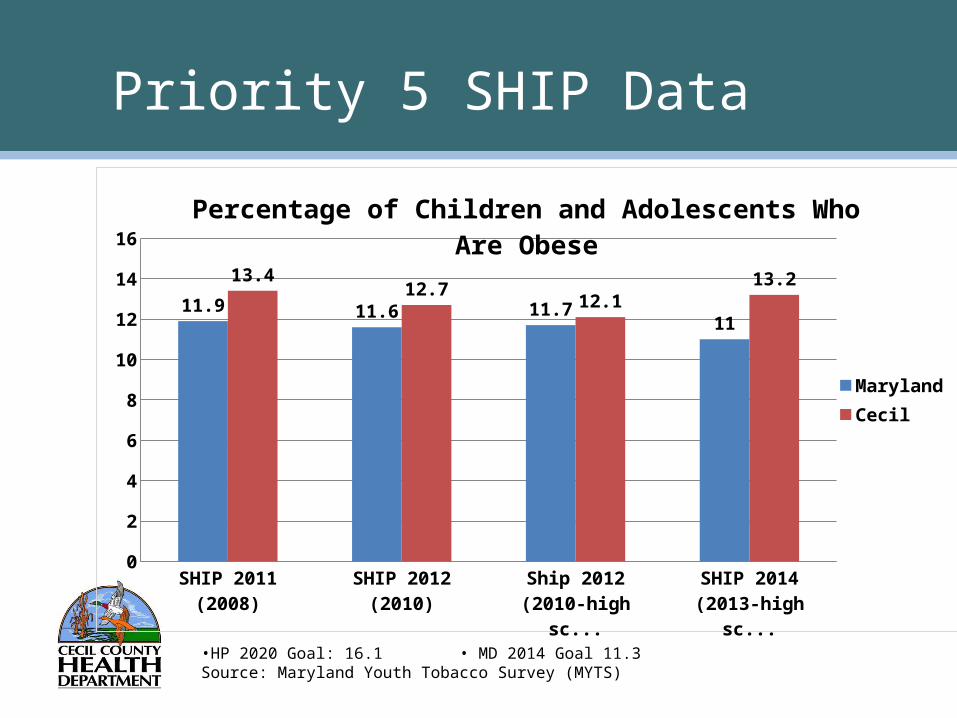
Priority 5 SHIP Data
SHIP 2011 (2008) SHIP 2012 (2010) Ship 2012 (2010-high school)
SHIP 2014 (2013-high school)
0
2
4
6
8
10
12
14
16
11.9 11.6 11.711
13.412.7
12.113.2
Percentage of Children and Adolescents Who Are Obese
MarylandCecil
•HP 2020 Goal: 16.1 • MD 2014 Goal 11.3Source: Maryland Youth Tobacco Survey (MYTS)

Priority 5 SHIP Data
HowardMontgomery
Queen Anne'sTalbot
Saint Mary'sCarroll
FrederickCalvertHarford
WorcesterMaryland
WashingtonBaltimore County
WicomicoAnne Arundel
CharlesCecil
AlleganyPrince George's
Baltimore CityCaroline
GarrettKent
DorchesterSomerset
0 2 4 6 8 10 12 14 16 18 20
13.2%
Children and Adolescents Who Are Obese County Comparison
SHIP 2014 (2013 high school) dataSource: Maryland Youth Tobacco Survey (MYTS)
MD 2014 Goal: 11.3

Priority 5 SHIP Data
SHIP 2012 (2011) SHIP 2013 (2012) SHIP 2014 (2013) 2011-201346
47
48
49
50
51
52
53
48.7%
51.8%
48.0%48.3%
Percentage of Population That is Physically Active
MarylandCecil
• HP 2020 Goal: 47.9 • MD 2014 Goal 49.8Source: Maryland DHMH Behavioral Risk Factor Surveillance System (BRFSS)

Priority 5 SHIP Data
CarolineSomerset
DorchesterBaltimore CityQueen Anne's
WashingtonCalvert
Baltimore CountyGarrett
KentAlleganyHarford
CecilWicomico
CarrollPrince George's
Anne ArundelCharles
HowardWorcester
FrederickMontgomerySaint Mary's
Talbot
0 10 20 30 40 50 60
48.3%
Percentage of Population That is Physically Active County Comparison
MD 2014 Goal: 49.8%
SHIP County 2011-2013 dataSource: Maryland DHMH Behavioral Risk Factor Surveillance System (BRFSS)

Additional Childhood Obesity Data
Nutrition Among High School StudentsNutrition Cecil MD
Percentage of students who ate fruits and vegetables five or more times per day during the past seven days 14.5% 20.1%
Percentage of students who ate fruits or drank 100% fruit juices less than two times per day during the past seven days 25.7% 31.9%
Percentage of students who ate vegetables less than three times per day during the past seven days 9.8% 13.8%
Percentage of students who drank soda one or more times per day during the past seven days 21.1% 18.0%
Percentage of students who ate breakfast on all of the past seven days 33.4% 33.0%
Percentage of students who ate breakfast on none of the past seven days 13.8% 15.7%
Source: Maryland Youth Risk Behavioral Survey (YRBS), 2013

Additional Childhood Obesity Data
Physical Activity Among High School Students
Physical Activity Cecil MD
Percentage of students who were physically active for a total of at least 60 minutes per day on five or more of the past seven days 42.5% 40.1%
Percentage of students who were physically active for a total of at least 60 minutes per day on 0 of the past seven days 16.2% 18.0%
Percentage of students who attended physical education (PE) classes on one or more days in an average week when they were in school 35.2% 39.1%
Percentage of students who attended physical education (PE) classes daily in an average week when they were in school 27.6% 18.2%
Source: Maryland Youth Risk Behavioral Survey (YRBS), 2013

Additional Childhood Obesity Data
Queen Anne'sSomersetCaroline
KentSt. Mary's
GarrettTalbot
DorchesterCalvert
WicomicoAlleganyCharles
WashingtonCecil
WorcesterCarroll
FrederickMaryland
Anne ArundelHarford
BaltimoreHoward
Prince George'sBaltimore City
Montgomery
0% 20% 40% 60% 80% 100% 120%
79%
Percentage of Population With Adequate Access to Locations for Physical Activity
County Health Rankings 2014 (2010 & 2012) dataSources: OneSource Global Business Browser, Delorme map data, ESRI, & US Census Tigerline Files
Top U.S. Performers: 85%

Additional Childhood Obesity Data
Baltimore CitySomersetAllegany
DorchesterPrince George's
WashingtonWicomicoWorcesterMaryland
Anne ArundelBaltimore
CalvertCaroline
CecilCharlesGarrettHarford
KentMontgomery
St. Mary'sTalbotCarroll
FrederickHoward
Queen Anne's
0 1 2 3 4 5 6 7 8 9 10
9/10
Food Environment Index
Cecil County is a top U.S. Performer. Access to Healthy Food: 95%Food Security: 90%
County Health Rankings 2014 (2011 (MtMG) & 2010 (USDA)) dataSource: USDA Food Environment Atlas, Map the Meal Gap from Feeding America

Healthy People. Healthy Community. Healthy Future.
Future Directions
• Short Term:• FY 14 LHIP Annual Report• Revision of LHIP
• Setting New Objectives through FY16• Collecting more data• Formally adding Chronic Disease to the Plan
• Access to Care Workgroup

Healthy People. Healthy Community. Healthy Future.
Future Directions
• Long Term:• The next Community Health Needs Assessment is
planned to begin during Q4 of FY15.• Union Hospital must complete the CHNA and Community
Benefit Implementation Plan by June 30, 2016
• The CHNA will inform the creation of new health priorities and LHIP for Cecil County.
• The priorities and objectives in the LHIP and the Implementation Plan should align.

Healthy People. Healthy Community. Healthy Future.
Important Links
• Cecil County Community Health Needs Assessment: https://uhcc.thehcn.net/content/sites/uhcc/UHCC_CHNA_Report_FY12-FY13.pdf
• Cecil County Local Health Improvement Plan: http://www.cecilcountyhealth.org/ccdhxx/pdf/LHIC%20Memo%20Attachment%20Cecil%20County%20Final_2.pdf
• Cecil County Substance Abuse Assessment: http://wrangler.websitewelcome.com/~hdadmin/1221/wp-content/uploads/2013/08/Cecil-County-Substance-Abuse-Assessment-Report-FINAL.pdf
• State Health Improvement Process: http://cecil.md.networkofcare.org/ph/• Community Benefit Implementation Plan, UHCC: https://
www.uhcc.com/getattachment/About/Community-Benefit/UHCC-CBIP_FY13-FY14.pdf.aspx
Recommended