GREEN MARKETING PRACTISES
BY KENYA PETROLEUM REFINERIES: A STUDY OF
THE PERCEPTION OF THE MANAGEMENT OF OIL
MARKETING COMPANIES IN KENYA
BY
KALAMA, ERIC
QgSfiSS
A Management Research Project submitted in partial fulfillment of the
requirements for the award of a degree in Masters of Business Administration
(MBA), University Of Nairobi, School of Business
July 2007
University of NAIROBI Library
0306986 1
DECLARATION
This management project is my original work and has not been presented for
a degree in any other University
-f (J ( l — ~)Signed:_________________________________ Date:________________ '
ERIC KALAMA
D61/P/7983/2004
This Management Project has been submitted for examination with my
approval as University Supervisor.
Signed: __________________ Date: [DU/ - S-VQ?
MS. MARGARET OMBOK
SCHOOL OF BUSINESS
DEPARTMENT OF BUSINESS ADMINISTRATION
UNIVERSITY OF NAIROBI
1

DEDICATION
Dedicated to the protection of the environment for the present and future generation
11

AKNOWLEDGMENT
I owe my gratitude to all those people who contributed tremendous inputs
towards my completion of this Research Project.
Special thanks go to my supervisor, Ms Margaret Ombok, for her material
and moral support. She guided me through my work from the beginning up
to the end of the project.
My wife, Grace Ngala, for her patience, understanding and support during
the whole period of my studies. She encouraged and supported me
throughout the whole project.
I am also very grateful to my MBA colleagues whose assistance on this
project cannot be overlooked
Lastly to God for his love that endures forever.
iii
TABLE OF CONTENTS
Declaration............................................................................................................................i
Dedication............................................................................................................................ ii
Acknowledgement.............................................................................................................. iii
List of Tables...................................................................................................................... vi
Abbreviations.................................................................................................................... vii
Abstract.............................................................................................................................viii
CHAPTER ONE: INTRODUCTION...............................................................................1
1.1 Background......................................................................................................................1
1.1.1 The Concept of Perception...............................................................................2
1.1.2 The Concept of Green Marketing....................................................................2
1.1.3 The Oil Marketing Companies....................................................................... 4
1.1.4 The Kenya Petroleum Refineries Limited...................................................... 4
1.2 Statement of the Problem................................................................................................6
1.3 Objectives of the Study...................................................................................................7
1.4 Importance of the Study..................................................................................................7
CHAPTER TWO: LITERATURE REVIEW................................................................. 9
2.1 Introduction..................................................................................................................... 9
2.2 Green Marketing............................................................................................................. 9
2.3 Green Marketing Mix................................................................................................... 13
2.3.1 Product........................................................................................................... 13
2.3.2 Price................................................................................................................15
2.3.3 Place................................................................................................................15
2.3.4 Promotion....................................................................................................... 16
2.3.5 Physical Evidence..........................................................................................17
2.3.6 Process Management.....................................................................................18
2.3.7 People............................................................................................................. 19
2.4 Challenges in the practice of Green Marketing...........................................................19
2.5 Summary of Literature Review...........r ....................................................................... 21
CHAPTER THREE: RESEARCH METHODOLOGY.............................................. 22
3.1 Research Design.......................................................................................................... 22IV
3.2 The Study Population............................. .............. ......................................................22
3.3 Data Collection............................................................................................................ 22
3.4 Operational Definitions of the Variables................ ....................................................23
3.5 Data Analysis................................................................................................................ 23
CHAPTER FOUR: DATA ANALYSIS......... ........ 24
4.1 Introduction....................................................... 24
4.2 Demographic Characteristics of the Respondents....................................................... 24
4.2.1 Number of years in existence........................................................................24
4.2.2 Ownership......................................................................................................25
4.3 The extent to which the Management of Oil Marketing Companies perceive the
Kenya Petroleum Refineries Limited as practising Green Marketing.........25
4.3.1 Product........................................................................................................... 26
4.3.2 Price............................................................................................................... 30
4.3.3 Promotion...................................................................................................... 32
4.3.4 Distribution....................................................................................................33
4.3.5 Process Management.......................... 34
4.3.6 Sales Force..................................................................................................... 38
4.4 Summary of the Dimensions used............. ................................................................ 44
CHAPTER FIVE: DISCUSSION, CONCLUSION AND RECOMMENDATIONS 46
5.1 Introduction.............................................................. ,,46
5.2 Discussion..................................................................................................................... 46
5.3 Conclusion.................................................................................................................... 48
5.4 Recommendations.........................................................................................................48
LIMITATIONS OF THE STUDY................................................. 49
SUGGESTIONS FOR FURTHER RESEARCH.......................................................... 49
REFERENCES.................................................................................................................. 50
APPENDICES................................................................................................................... 55
Appendix 1: Operationalizing the Green Marketing Mix Variables............................... 55
Appendix 2: List of Oil Marketing Companies................................................................ 60
Appendix 3: Letter of Introduction........................................... 62
Appendix 4: Questionnaire................................................................................... .63v
LIST OF TABLES
Table 1: Age of Firms.......................... 24
Table 2: Ownership of the Firms................. 25
Table 3: Quality.......................................... 26
Table 4: Safety.................................................................................................................... 27
Table 5: Conformance........................................................................................................28
Table 6: Reliability..................................................................... 29
Table 7: Recyclability......................................................................................................... 30
Table 8: Price Settings............................................................ 31
Table 9: Invoicing............................................................................................................... 31
Table 10: Corporate Activities............................................................................................32
Table 11: Location.............................................................................................................. 33
Table 12: Timeliness........................... 34
Table 13: Commitment.............. 34
Table 14: Service Delivery.................................................................................................35
Table 15: Quality Audits......................................................................... 36
Table 16: Health, Safety and Environmental Audits..........................................................37
Table 17: Expertise..................... 37
Table 18: Competence........................ 38
Table 19: Credibility........................................................................................................... 39
Table 20: Courtesy............................................................................................................ 40
Table 21: Reliability........................................................................................................... 41
Table 22: Responsiveness.................................................................................................41
Table 23: Communication..................................................................................................42
Table 24: Training................................... 43
Table 25: Motivation..........................................................................................................43
Table 26: Summary of the variables used............................. 45
vi

ABBREVIATIONS
AGO....................................................... ............... Automotive Gas Oil
AMA................................................... .................American Marketing Association
AWEA.............................................................. . .American Wind Energy Association
BP...........................................................................British Petroleum
CoV................................................................... ....Coefficient of Variation
DPK........................................................................Dual Purpose Kerosene
El............................................................................ Earth watch Institute
ENN........................................................................Environmental News Network
EMC A................................................... ................. Environmental Management and
Coordination Act
EPA........................................................................ Environmental Protection Agency
ESA........................................................................ Environmental Society of America
ETK........................................................................Environmental Trust of Kenya
GOK....................................................................... Government of Kenya
IDO.........................................................................Industrial Diesel Oil
IUCN...................................................................... International Union for Conservation
of Nature and Natural Resources
KPRL......... ............................................................ Kenya Petroleum Refineries Limited
LPG........................................................................ Liquefied Petroleum Gas
MOGAS..................................................................Motor Gasoline
NEMA.................................................................... National Environmental
Management Authority
OMC.......................................................................Oil Marketing Companies
OECD.....................................................................Organization for Economic Co
operation and Development
RON....................................................................... Research Octane Number
SOM....................................................................... Supply Coordination Meeting
WflCSD..................................................................World Business Council for
Sustainable Development
WEED....................................................................World Committee for Economic
Development
vii
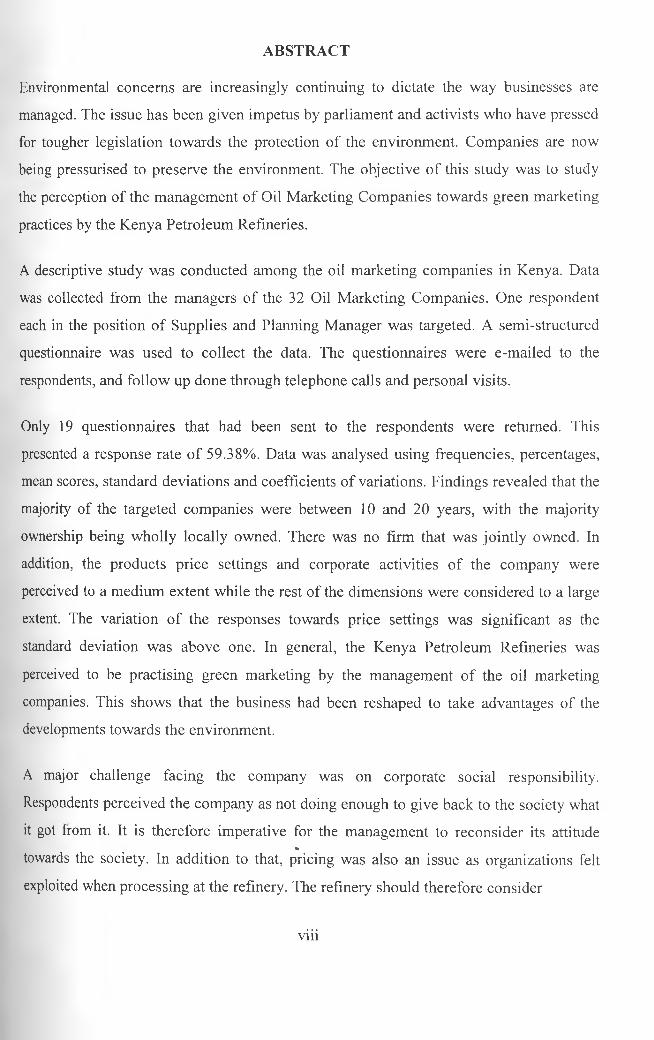
ABSTRACT
Environmental concerns are increasingly continuing to dictate the way businesses are
managed. The issue has been given impetus by parliament and activists who have pressed
for tougher legislation towards the protection of the environment. Companies are now
being pressurised to preserve the environment. The objective of this study was to study
the perception of the management of Oil Marketing Companies towards green marketing
practices by the Kenya Petroleum Refineries.
A descriptive study was conducted among the oil marketing companies in Kenya. Data
was collected from the managers of the 32 Oil Marketing Companies. One respondent
each in the position of Supplies and Planning Manager was targeted. A semi-structured
questionnaire was used to collect the data. The questionnaires were e-mailed to the
respondents, and follow up done through telephone calls and personal visits.
Only 19 questionnaires that had been sent to the respondents were returned. This
presented a response rate of 59.38%. Data was analysed using frequencies, percentages,
mean scores, standard deviations and coefficients of variations. Findings revealed that the
majority of the targeted companies were between 10 and 20 years, with the majority
ownership being wholly locally owned. There was no firm that was jointly owned. In
addition, the products price settings and corporate activities of the company were
perceived to a medium extent while the rest of the dimensions were considered to a large
extent. The variation of the responses towards price settings was significant as the
standard deviation was above one. In general, the Kenya Petroleum Refineries was
perceived to be practising green marketing by the management of the oil marketing
companies. This shows that the business had been reshaped to take advantages of the
developments towards the environment.
A major challenge facing the company was on corporate social responsibility.
Respondents perceived the company as not doing enough to give back to the society what
it got from it. It is therefore imperative for the management to reconsider its attitude%
towards the society. In addition to that, pricing was also an issue as organizations felt
exploited when processing at the refinery. The refinery should therefore consider
viii

lowering the processing fee so that the Oil Marketing Companies can process more crude
oil at the firm.
The study was limited to the marketing companies that had signed a processing
agreement with the refinery. However, there are other companies in the industry that do
have a refining contract with the company. A similar study should be done to determine
whether all the Oil Marketing Companies in Kenya practice green marketing.
IX
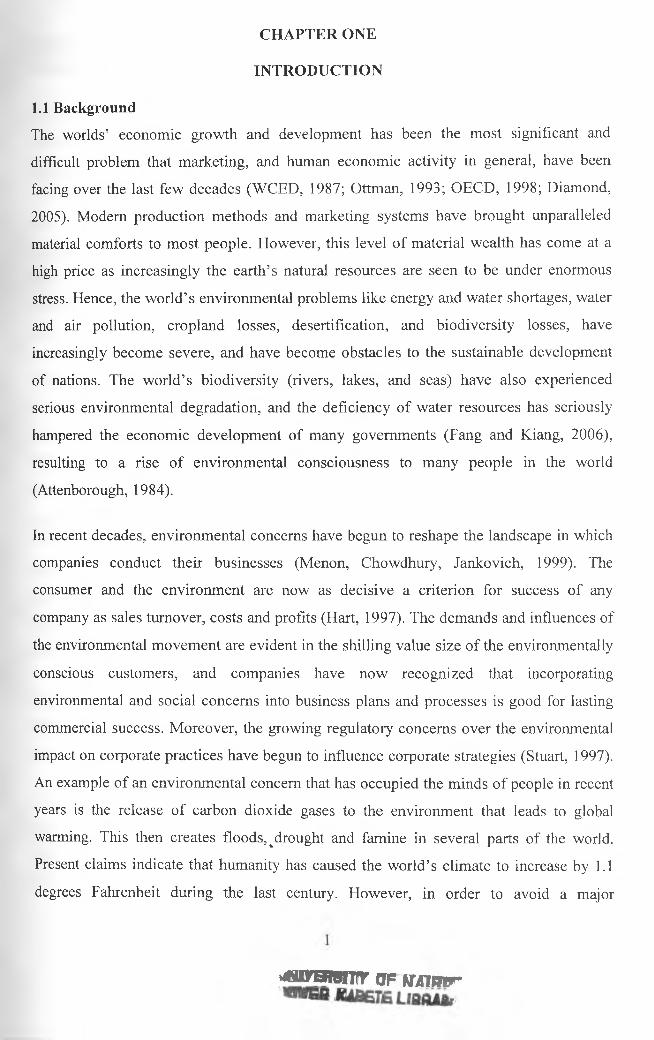
CHAPTER ONE
INTRODUCTION
1.1 BackgroundThe worlds’ economic growth and development has been the most significant and
difficult problem that marketing, and human economic activity in general, have been
facing over the last few decades (WCED, 1987; Ottman, 1993; OECD, 1998; Diamond,
2005). Modem production methods and marketing systems have brought unparalleled
material comforts to most people. However, this level of material wealth has come at a
high price as increasingly the earth’s natural resources are seen to be under enormous
stress. Hence, the world’s environmental problems like energy and water shortages, water
and air pollution, cropland losses, desertification, and biodiversity losses, have
increasingly become severe, and have become obstacles to the sustainable development
of nations. The world’s biodiversity (rivers, lakes, and seas) have also experienced
serious environmental degradation, and the deficiency of water resources has seriously
hampered the economic development of many governments (Fang and Kiang, 2006),
resulting to a rise of environmental consciousness to many people in the world
(Attenborough, 1984).
In recent decades, environmental concerns have begun to reshape the landscape in which
companies conduct their businesses (Menon, Chowdhury, Jankovich, 1999). The
consumer and the environment are now as decisive a criterion for success of any
company as sales turnover, costs and profits (Hart, 1997). The demands and influences of
the environmental movement are evident in the shilling value size of the environmentally
conscious customers, and companies have now recognized that incorporating
environmental and social concerns into business plans and processes is good for lasting
commercial success. Moreover, the growing regulatory concerns over the environmental
impact on corporate practices have begun to influence corporate strategies (Stuart, 1997).
An example of an environmental concern that has occupied the minds of people in recent
years is the release of carbon dioxide gases to the environment that leads to global
warming. This then creates floods, ̂ drought and famine in several parts of the world.
Present claims indicate that humanity has caused the world’s climate to increase by 1.1
degrees Fahrenheit during the last century. However, in order to avoid a major
>*tprgrarcT OF wr/TPEr

catastrophe, we must cut our emissions by 2030 at a possible cost of $1 trillion, (Burges,
2007).
1.1.1 The Concept of PerceptionSteuart (1978) defines perception as a process of information extraction by which people
select, organize and interpret sensory stimulation into meaningful and coherent picture of
the world. However, Schiffman and Kanuk (2004) summarize it as that which helps
people makes sense out of the world around them. Forgus and Melamedon (1976) have
based their perceptions description on cognitive structures, which are the processes that
determine how humans interpret their surroundings on a ‘higher’ level through
information processing than those of animals, which perceive the world in terms of
stimulus-response actions.
Perception is made up of learning, memory and thinking. Severin and Tankard (1997),
Scott and Brydon (1997) and Rice (1993) identified internal and external factors like
background and repetition that could intensify one’s perception and are what draws
attention to a subject. Different individuals exposed to the same stimuli under the same
apparent conditions recognize, select, organize and interprets them depending on each
persons own needs, values, and expectations (Schiffman and Kanuk, 2004),
As people move about in the world, they create a model of how the world works. They
sense the objective world, but their sensations map to percepts. As people acquire new
information, their percepts shift, thus solidifying the idea that perception is a matter of
belief (Forgus and Melamedon, 1976).
As all the Oil Marketing Companies are exposed to similar conditions at the Kenya
Petroleum Refineries, the perception of the management the oil companies towards
‘green marketing’ practices at the refinery would be very much appreciated.
1.1.2 The Concept of Green Marketing
Pride and Ferrel (1991) define green marketing in simpler terms as the specific*
development, pricing, promotion and distribution of products that do not harm the
environment. However, green marketing is a relatively new concept in the world.
2
Marketing that has an environmental concern started in the 1960’s with the publication of
Rachel Carson’s book, ‘Silent Spring’ in 1962. The book drew attention to the impact of
which environmental pollution was having upon plant and animal life. During this period,
there was no subject called environmental marketing yet. In 1969, Dawson proposed the
‘Human Concept’ as an alternative to the Marketing Concept to take care of the
increasing human progress and future businesses. On the other hand, Rothe and Benson
(1974) suggested the ‘The intelligent consumption concept,’ as an attractive alternative to
the marketing concept.
During the first workshop on ecological marketing in the United States of America,
Henion and Kinner (1976) proposed the Ecological Marketing Concept. They said that it
consists of all marketing activities that have influences to create environmental problems
and which can be part of solving the complexities of the environmental problems. In
1988, Kotler proposed the Societal Marketing concept that encourages collective needs of
society as well as individual’s desires and which in the long run meet organizations
interest (Bragd, 1998). In the 1980’s, the ‘Green Marketing’ concept later emerged for
the promotion of environmentally safe or beneficial products.
Divergent aspects of green marketing include ecologically safer products, recyclable and
biodegradable packaging, energy-efficient operations, and better pollution controls. The
increased environmental awareness demands practical and theoretical implications for
several other disciplines as well. Apart from marketing, several disciplines have tried to
conceptualize environmental awareness such as psychology, politics, sociology and
business administration.
There are self initiated projects as well as Non Governmental Organizations that were
formed for environmental purpose. For example, there is The Environmental Trust of
Kenya that was formed in 1997, with the purpose of empowering local communities on
environmental issues. The organization also organizes clean up activities along the
Kenyan Coast. Many companies have realized the importance of the environment and
have clearly been captured in their strategic plans. Chandaria Industries has a Strategic
Business Unit that converts waste paper into a reusable product. In 1996, a World Bank
3

Study called for a five-year global phase out of leaded gasoline, and in 2001, Shell Kenya
Limited was the first company to sell unleaded gasoline (Omoding, 2006).
1.1.3 The Oil Marketing Companies
The liberation of the petroleum sector started in 1994 and it lead to the registration of
many oil companies, in addition to the existing multinationals. However, only the supply
of petroleum products remained under the control of the government. Through the
publication of a legal notice number 31 of 18th April 2006, which states that ‘any person
engaged in the importation of refined petroleum products for use in Kenya, other than
LPG, Bitumen and Low Sulphur Fuel Oil, shall refine such minimum quantity of crude
oil as the minister may from time to time, prescribe, at the KPRL’ (GoK, 2006), it
became mandatory for oil companies to refine crude oil at the KPRL. However, once the
condition is met, the balance can be obtained through imports, which are mainly LPG,
DPK, AGO, and Mogas.
Increased legislature and pressure from lobbyists have created awareness towards the
environment. In Kenya, the parliament passed a legislation to form a body that would be
a watchdog of the government towards the environment (Petroleum Insight, 2006). This
is now forcing many firms to change their strategies so as to accommodate these new
developments, and the Oil Marketing Companies are no exception
Currently, there are 42 Oil Marketing Companies in Kenya that refine their crude oil at
KPRL and at the same time import finished petroleum products to meet the balance for
their local market (KPRL Hydrocarbon Entitlement Statement For April 2007). These
companies would therefore be naturally concerned with the products from the refinery if
they were produced under green marketing practices.
1.1.4 Kenya Petroleum Refineries Limited
Before 1954, there were no refineries in Africa. All the petroleum products were brought
to the continent as imports. In Kenya, the importation of finished petroleum products was
through the Port of Mombasa. Ho wever, it was through Shell and BP Companies that saw
the potential of building a refinery at Mombasa. With a consolidated 50% shares each,
the two companies started to build the refinery in 1959 after approval from the then
4
colonial government. In 1963 and 1974, two complexes, Complex one and two were
commissioned respectively. ESSO and Caltex (now Chevron), become shareholders in
1964 and it was not until 1971 when the government acquired 50% of the shares of the
company. In 1998 however, ESSO Petroleum Company wound up its operations in
Africa and the company sold its shareholding at the refinery to the remaining three
companies namely Shell/BP and Caltex (Petroleum Insight, 2006).
The KPRL receives crude oil on behalf of OMC’s. The oil is then refined to get a wide
range of finished products that include LPG, Tops, Mogas, DPK, AGO, IDO, Fuel Oil,
and Bitumen. Mogas from the refinery has an octane rating of 91 RON minimum while
AGO has a Sulphur specifications of 1% weight as maximum (KPRL Processing Data
Book). Even though the global trend is to have AGO with sulphur of 0.005% weight as
maximum, a number of European Countries have achieved this feat (SCM, April 2007).
Juts like the OMC’s, KPRL is facing pressure to meet these new European-type
specifications that need large investments (Simbeck, 2004: Daily Nation, 24th March
2006). Since Kenya is a signatory to the Dakar Declaration that recommended the
phasing out of leaded Gasoline, by 2005, the company started producing unleaded
gasoline from 1st December of the same year.
As a company, KPRL has implemented a number of activities that have enabled it to be a
green company. After the commissioning of the second complex in 1974, there was an
outcry from the local community that complained of being affected by gases emanating
from the refinery. As a result, the management of that time decided to experiment by
planting coconut trees on an unutilized peace of the refinery land. The trees are now
mature and healthy. The company also converts waste heat from furnaces that distil the
oil to generate steam that is used for various processes in the plant, thus saving on energy.
At the same time, when a product does not meet the required specifications, it cannot be
released to the customer until it is reprocessed to get on grade material. The refinery also
treats its effluent water before it is release to the municipal sewer system, and closely
monitors oil in effluent water going into sea.
5
1.2 Statement of the problem
According to Petroleum Insight (2006), Kenya Petroleum Refineries plays a very
important role in the country. It refines crude oil on behalf of 42 Oil Marketing
Companies in the country, thus satisfying 70% of the local fuel market, with the rest
being imports. Of these oil marketing companies, only 32 have been active for the last six
months.
The Kenya Petroleum Refinery is 48 years old and uses old technology in its refining
activities. For example, its attempt to curb air pollution consists of higher smokestacks
that allow the air pollutants to be diluted by the atmosphere, thus spreading the pollution
down wind instead of using new technology that filters out particles from the smokestack
emissions. For the control of sulphur oxides emissions that may lead to acidic rains to be
formed, low sulphur crude oils may be used, but are very expensive. Moreover, the
source of these low sulphur crudes is in West Africa and some parts of Europe, thus
making freight charges to be very high. The crude oil that is refined at the company,
mainly sourced from the Arabian Gulf, has high sulphur levels. However, the refinery
lacks scrubbers that can be used to remove these sulphur oxides after combustion. In
addition, the refinery lacks a de-sulphuriser unit that reduces sulphur levels in the
petroleum products. This then makes the refinery to produce Automotive Gas Oil with
Sulphur content of 1% weight maximum, which is against international requirements and
Kenyan regulation.
Recent developments in the oil industry in the world have affected the way to manage the
environment and its natural resources. For example, civil unrest in Nigeria has seen
expatriates in the Niger Delta being kidnapped as a result of unfair treaties its former
rulers had signed with the multinationals that had the aim of enriching some few
individuals instead of the whole country; the sectarian violence in Iraq that came about as
a result of the so called war on terror waged by the United States of America and its
allies; pressure from civil societies in many countries that has seen parliaments enacting
very tough legislation on the environment; and a new entrant to the scene, a speculator,
whose role is to speculate for profit has made crude prices to fluctuate very often. This
has brought new challenges that include historic high crude oil and natural gas prices that
has been seen in recent months, crude oil supplies continuing to get lower in quantity,
6

increased demand for more and cleaner transportation fuels, emergence of markets that
are forcing the move towards green refineries, and the increased ultra clean transportation
fuel yields (Simbeck, 2004; Petroleum Insight, 2006; NEMA).
In Kenya, several studies on green marketing have been carried out in recent years.
Kiongera (2003) carried out one on green marketing practices in the cement industry,
Obuya (2003) on determining the extent to which manufacturing firms in Nairobi practice
green marketing, Kenyatta (2004) on eco-marketing in the service industry, while Ayeke
(2003) researched on social responsibility among polythene manufacturing firms. While
the findings of these studies cannot be ignored, the researchers were either too broad in
nature, for example, Ayeke focused on social responsibility, while those on green and eco
marketing focused on the selected manufacturing and service industries with no
emphasize to the oil industry. Their results may not apply to the oil industry.
This research sought to answer the question: ‘How is the Kenya Petroleum Refineries
being perceived by the management of the Oil Marketing Companies in Kenya towards
green marketing practices?’
1.3 Objectives of the study
The objective of this study was to determine the perception of the management of Oil
Marketing Companies towards green marketing practices by Kenya Petroleum Refineries
Limited
1.4 Importance of the study
The results of the study may be of use to the following: -
i. The results would enable the present and future management teams of Kenya Petroleum
refineries formulate and entrench good environmental policies in the company. This
would go a long way in making the company to be viewed as a good corporate citizen.
ii. The Government, its agencies and policy makers may use the results for formulating
good national policies for the country that are relevant and sensitive to the petroleum
industry. As the clamor of searching for oil in Kenya intensifies, there are high hopes
that the country has oil reserves that would eventually necessitate the building up of
7
more refineries. Therefore, it would be a good idea for the government to enact proper
laws for the regulation of the petroleum industry when such a time comes.
iii. As more and more consumers’ are getting more informed, companies are increasingly
becoming green enterprises. It would be prudent for the firms to know what best green
marketing practices their fellow competitors adopt so that they too can emulate and
increase their turnover.
iv. Researchers and Academicians may use the results as a source of reference in their
academic pursuits. The future of green marketing studies will add to managerial and
public policy fields of inquiry.
8
CHAPTER TWO
LITERATURE REVIEW
2.1 IntroductionEnvironmental issues have influenced all human activities the world over. As the society
is now becoming more conscious of its environment, the manner in which ecological
problems are attacked has a vital effect on the institutions of marketing, and businesses
are now being modified with the aim of addressing the society’s new concerns (Walley,
Custance, and Parsons, 2000). In 2003, Banerjee et al. showed that corporate
environmentalism is related to public concern, regulatory forces, competitive advantage
and top management commitment, with the type of the industry moderating some of these
relationships.
In recent times, worldwide evidence indicates that people are increasingly becoming
concerned about the environment and are gradually changing their behaviour accordingly
(Walley, Custance, and Parsons, 2000). The world is seeing a growing market for
sustainable and socially responsible products and services. The types of businesses that
exist, the products they produce and their approaches to marketing are changing (Ottman,
1993). People generally want to do the right thing, so the challenge and opportunity for
the green marketer is to make it easy for people to do so, so as to reap the rewards of
healthy profits and improved shareholder value, as well as help make the world a better
place in the future (Ginsberg and Bloom, 2004; Klassen and McLaughlin, 1996; Leonida,
2006; Russo and Foutt, 1997).
2.2 Green Marketing
The American Wind Energy Association argues that green is difficult to define. This is
because people have become more concerned with the quality of life (Frain, 1986). The
vehicle-sharing concept that helps reduce carbon dioxide gas emission and hence global
warming, show how ‘complex’ green marketing has become. Ottman (1993) argued that
though environmental appeals were growing in number, the concept was now confusing,
thus becoming harder to create effective environmental marketing efforts.
9
rWhen AMA had its first workshop in ‘Ecological Marketing’ in 1975, where by it was an
attempt to bring together academicians, practitioners and public policy makers to
examine marketing’s impact on the natural environment, the marketing association
defined ecological or green marketing as the study of the positive and negative aspects of
marketing activities on pollution, energy depletion and non energy resource depletion
(Henion, and Kinner, 1976b). The definition shows that Green Marketing is a subset of
Marketing and it looks at both positive and negative sides of marketing in the entire
marketing field but with a narrow view of the environment. Charter (1992) expands the
definition of green marketing and describes it more philosophically as a holistic and
responsible strategic management process, which identifies and fulfils stakeholders’
needs, for a reasonable reward, that does not adversely affect human or environmental
well-being.
It was Polonsky (1994a) who gave a more comprehensive definition to this complex
matter by defining it as consisting of all marketing activities designed to generate and
facilitate any exchanges intended to satisfy human needs or wants, such that the
satisfaction of these needs and wants occur with minimum detrimental impact on the
natural environment. Polonskys’ definition is more encompassing, and incorporates much
of the traditional components of the marketing definition with much emphasize on the
natural environment. Attenborough (1984) adds that an organization ‘should be
continuously mindful in all its activities of environment damage, physical and cultural
pollution and of the demands it makes upon finite natural recourses’. He argues that
ecological considerations should be extended to its products ingredients, design and
packaging as well as to its plants and processes. The organization should seek to
minimize waste in all aspects of its operations.
In 1958, Galbraith proposed the Stakeholders theory which states ‘the objectives of the
organization should not stem from the organization exclusively, but from the claims upon
it of its various stakeholders-employees, suppliers, shareholders, distributors, consumers,
the general public, central and local government-all parties who have a stake in its well
being and are affected by its operations.’ He proposed a reasonable balance that was
constituted of all their claims upon the organization. In addition, Stanton (1981) argues
10

that executives should realize that they can not exist in isolation in the society and that a
healthy business system can not exist within a sick society.
Ottman (2002), while contributing to the Green Marketing Comer said that investment in
environmentally preferable products and technologies could lead to a potential source of
innovation and competitive advantage. This has been seen in the fact that green products
and technologies have improved over the years such that they are now more superior to
their conventional counterparts. While focusing on managerial interpretations of
environmental issues, Sharma (2000) examined the link between managerial
interpretations of environmental issues and corporate choice of environmental strategy
among ninety nine firms in the Canadian oil and gas industry. He found out that there
were different managerial interpretations of environmental issues which influence the
choice of environmental strategy.
Research by Global Market Insight in 2006 in USA indicate that people categorize
polluting companies as socially irresponsible and this helps them make purchasing
decisions accordingly. From the research, it emerged out that 48% of Americans
purchased products because it was labelled environmentally safe or biodegradable,
whereas 42% of the American population said that they were willing to spend more on
products branded as organic or environmental friendly. From Gordon’s research in 2004,
it was found out that 30% of people claim to be concerned about the environment and
ethical integrity of products and services they purchase and yet only 3% translate this
attitude to behaviour. On the other hand, Dibbs and Simeken (1990) in their study
reported that 23% of American shoppers made purchases based on environmental
attributes of the products concerned.
Powerful Environmentalist Movements that have international outlook have emerged
over the years. Some of them have been transformed into political groupings in their
countries of origin and have successfully lobbied for legislations for laws to be passed in
parliament for the protection of the environment. These political groupings include The
Green Party of Germany, and the Ecological Party of Britain. Other organizations are
Animal Rights Campaigners, Friend of the Earth and Green Peace Movement (Frain,
1986). This has resulted to organizations to change their attitude towards the
11
M s mnw or NTAimr- ftABGTE i,ms3jm

environment. A study by Langerak et al in 1998 on one hundred and thirty eight Dutch
manufacturing firms in Europe indicate that environmental regulation is still the most
important reason for marketers to adapt to an environmentally friendly approach in their
marketing strategy. Firms that voluntary practice green marketing are given the ability to
exploit green opportunities and improve performance.
In recent years, companies have come to realize that if they operate within the context of
the environment, they enjoy reduction in waste disposal and handling costs. However,
because of problems in environmental sustainability, Stuart (1997) developed a four-grid
model that could help marketers gauge their progress on the task (See figure 1).
Tomorrow
Today
Figure 1. The environmental Sustainability GridNew environmental technology Is the environmental performance of our product limited by our existing technology base?
Sustainability vision Does our corporate vision direct us towards the solution of social and environmental problems?
Is there a potential to realize major improvements through new technology?
Does our vision guide the development of new technologies, markets, products and processes?
Pollution prevention Where are the most significant waste and emission streams from our current operations?
Product stewardship What are the applications for product design and development if we assume responsibility for a products entire life cycle?
Can we lower costs and risks by eliminating waste at the source or by using it as a useful input?
Can we add value or lower costs while simultaneously reducing the impact of our products?
Internal External
Source: Stuart, H. ‘Beyond Greening: Strategies for a sustainable world’. Harvard Business Review, Jan-Feb 1997, pp 66-76.
The most basic level is pollution prevention. That means eliminating or minimizing waste
before it is created, by developing ecological safer products, recyclable, biodegradable
packages, better pollution controls and more energy efficient operations. The next level is
12
for the companies to practice product stewardship. This is by thinking ahead in the design
stage to create products that are easier to recycle, recover and reuse. The third level is to
involve the companies to look into the future and plan for new environmental
technologies, whereas for the fourth level is for the companies to develop sustainability
vision which serves as a guide to the future. For companies to succeed in environmental
sustainability, they must work in all the four areas (Stuart, 1997).
2.3 Green Marketing Mix
This is the decision making process for defining the actual tactics a company utilizes.
Optimizing the marketing mix is the primary responsibility of marketing. By offering the
product with the right combination of the marketing mix variables, marketers can
improve their results and marketing effectiveness. Making small changes in the
marketing mix is typically considered a tactical change, while large changes can be
considered strategic. The function of the marketing mix is to help develop a package that
will not only satisfy the needs of the customers within the target markets, but
simultaneously to maximize the performance of the organization.
In 1948, Culliton said that a marketing decision should be a result of something similar to
a recipe. Borden (1964) later coined the term 'Marketing-Mix,’ although he started to use
the word in his teaching in the late 1940’s. His ingredients included product planning,
pricing, branding, distribution channels, personal selling, advertising, promotions,
packaging, display, servicing, physical handling, and fact finding and analysis. McCarthy
(1960) proposed a four variable classification to the mix from the original 12 that are
today. The leap forward in thinking at the time was that it put the customer at the
forefront of the company thinking. It was not until 1989 when Bradley become the first
one to coin the term Green Marketing Mix (Bradley, 1989). Everyone has their own
favourite marketing mix. Whereas some people have four, others have eight divisions
depending on whether services are taken into consideration or not (Kotler and Keller,
2005).
2.3.1 Product
The product defines the characteristics of a company’s product or service that meets the
needs of its customers. Although this typically refers to a physical product, the concept
13

chas been expanded to include services offered by a service organization (Barlon, 2006).
The specification of the product is one of the variables that a marketer has at his or her
control. Entrepreneurs wanting to exploit emerging green markets will either identify
customers’ environmental needs or develop products with the aim of addressing these
needs or develop environmentally responsible products that have less impact to the
environment than competitors (EPA, 2007). For example, the product can include certain
colors, certain scents, or certain features. Lastly, in the broadest sense when a consumer
purchases a product, it also includes the post-sales relationship with the particular
company that can include customer service and or any warranty (Bradley, 1989).
Focusing on green products can provide more leverage in corporate green
communications’ efforts than the traditional emphasis on filtering the smoke stacks
because products and their marketing are highly visible to the general public. By focusing
on the production of green products, this signals corporate social responsibility,
innovation, and competitiveness. These in turn ignite the enthusiasm and commitment of
the public, media, employees, investors, and other stakeholders (Ottman, 1993).
Products and their usage are central to how people express their concern for the
environment. This can lead to buying products from companies perceived as having good
environmental track record. A tremendous opportunity exists for businesses to use green
products and their marketing messages to educate consumers, and thus establish
themselves as environmental leaders rather than defensive polluters. By focusing on the
product, a company has to make decisions on the brand name, functionality, styling,
quality, safety, packaging, repairs and support, warranty, accessories and services. This
then leads to having products that are of the highest standard, environmentally safe, easy
to use, produced with environmentally friendly processes with little or no damage to the
environment. In order to encourage a green market, information should be readily
available for comparison purposes between different stakeholders on the basis of the
environment and costs. Proper labelling, branding and packaging should be used
(Ottman, 1993).
The increasingly wide variety of products on the market that support green marketing and
are good for the company in making profits include products made from recycled goods,
14
C"
products that can be recycled or reused, efficient products which save water, energy or
gasoline, save money and reduce environmental impact, products with environmentally
responsible packaging, products with green labels, as long as they offer substantiation,
organic products, and certified products, which meet or exceed environmentally
responsible criteria. Whatever the product or service, it is vital to ensure that products
meet or exceed the quality expectations of customers and is thoroughly tested (EPA,
2007).
2.3.2 Price
The price is the amount paid for a product. It is a critical element of the marketing mix.
Most customers will only be prepared to pay a premium if there is a perception of
additional product value. This value may be improved performance, function, design,
visual appeal or taste. Environmental benefits are usually an added bonus to both the
companies and customers but will often be the deciding factor between products of equal
value and quality. Environmentally responsible products, however, are often less
expensive when product life cycle costs are taken into consideration, for example, fuel-
efficient vehicles, water-efficient printing and non-hazardous products (EPA, 2007).
The price that businesses charge should reflect the most reasonable one (AWEA, 1996).
There is also a need for a company to decide on a pricing strategy. Examples of pricing
decisions to be made include pricing strategy (either skim or penetration strategy),
suggested retail price, volume discounts and wholesale pricing, cash and early payment
discounts, seasonal pricing, bundling, price flexibility, and price discrimination.
Companies practicing Green Marketing have to charge a fair price for their products and
consumers should not be made to pay a premium for environmental practices that are
already required by the law (EPA, 2007).
2.3.3 Place
Place represents the location where a product can be purchased. It can include physical as
well as virtual stores. Some of the revolutions in marketing have come about by changing%
this marketing variable. Product distribution should be of the acceptable channels, and
clearly and properly placed at environmentally safe place where there is no contamination
whatsoever. For green businesses to be established and become competitively priced,
15
r "
companies have to ensure that their distributors are concerned of the environment and
ascertain that they establish a green distribution strategy (EPA, 2007).
The choice of where and when to make a product available will have significant impact
on the customers a company attracts. Very few customers will go out of their way to buy
green products merely for the sake of it. Marketers looking to successfully introduce new
green products should, in most cases, position them broadly in the market place so that
they are not just appealing to a small green niche market, but the location must also be
consistent with the image the company wants to project rather than being dominated or
compromised by the image of the venue. The location must differentiate the company
from its competitors. This can be achieved by in-store promotions and visually appealing
displays or by use of recycled materials that emphasize the environmental and other
benefits (EPA, 2007).
Some examples of distribution decisions include distribution channels, market coverage
(inclusive, selective, or exclusive distribution), specific channel members, inventory
management, warehousing, distribution centers, order processing, transportation, and
reverse logistics.
2.3.4 Promotion
Promotion represents all of the communications that a marketer may insert into the
marketplace. This can include television, radio, and print advertising as well as coupons,
direct mail, billboards, and online advertising. One of the less well-defined areas in
promotion is the role of a human sales force. For example, are the messages the sales
person provides to a consumer a component of the promotional mix, or is it part of the
product? This is because consumers may rather purchase the product only when sold
through the support of a known salesperson. In this case, therefore, the service, perceived
or real can be defined as a feature of the product (Simintiras, Schlegelmilch, and
Diamantopoulos, 1993).
In the context of the green marketing mix, promotion represents the various aspects of
marketing communication. That is, the communication of information about the product
with the goal of generating a positive customer response. Marketing communication
16

n
decisions include promotional strategy (push, or pull), advertising, sales promotions,
public relations & publicity, personal selling and sales force. This includes all the
weapons in the marketing armory (EPA, 2007).
Smart green marketers will be able to reinforce environmental credibility by using
sustainable marketing and communications tools and practices. For example, many
companies in the financial industry are providing electronic statements by email, e-
marketing is rapidly replacing more traditional marketing methods, and printed materials
can be produced using recycled materials and efficient processes, such as waterless
printing. Retailers, for example, are recognizing the value of alliances with other
companies, environmental groups and research organizations when promoting their
environmental commitment. To reduce the use of plastic bags and promote their green
commitment, some retailers sell environmentally shopping bags to customers, for
example Nakumatt.
The key to successful green marketing is credibility. Companies should never overstate
environmental claims or establish unrealistic expectations. Instead, they should
communicate simply and through sources that people trust and promote their green
credentials and achievements through publicizing stories of their firms and employees of
their success stories on green initiatives and entering environmental awards programs
with the aim of profiling environmental credentials to customers and stakeholders (EPA,
2007). Companies should focus on the green aspect of the promotion. For example, there
should be no misleading, or deceptive means of attracting consumers and the sales force
should be environmentally conscious. The correct information regarding the companies
and products should also be readily provided so that customers may avoid making wrong
choices (Bradley, 1989).
2.3.5 Physical Evidence
The American Wind Energy Association warns companies not to think that making the
world a better place is enough to sell a product (AWEA, 1996). What customers want to
see is care, actions matched by claims, assurance, feeling, and above all, the physical
evidence of a product. The physical evidence is the material part of a service. Strictly
speaking, there are no physical attributes to a service, so a consumer tends to rely on
17
material cues. There are many examples of physical evidence, including some of the
following: packaging, internet /web pages, brochures, furnishings, uniforms, business
cards, the building itself (such as prestigious offices or scenic headquarters), and even
mailboxes. Green marketers should give evidence to environmental attributes of
products’ on them being biodegradable, recyclable, safer to use, disposable (Ottman,
1993).
Some organizations depend heavily upon physical evidence as a means of marketing
communication. Examples of these include tourist attractions and resorts (like the world
famous Maasai Mara Game reserve), parcel and mail services (like Group 4 Securicor
company), and large banks and insurance companies (like the Kenya Commercial Bank
headquarters and Kenindia buildings in Nairobi).
2.3.6 Process Management
Process is another element of the extended green marketing mix (Stanton, 1981). It is the
continuous effort to re-examine the processes on a company’s product manufacturing
lines to reduce the environmental burden imposed in such areas as materials input and
chemical and energy use thus cutting down on costs and improving on quality (Nagata
and Okuda, 2005). Companies should develop environmental management concepts such
as green management, green products, green factories, green solutions, and green earth.
This is to enable them have an established environmental policy that would help them
follow the trends in environmental activities of the world on a global scale and set
guidelines for the achievement of sustainable development through the promotion of
environmental management systems, environmental technologies, eco-friendly products
and solutions, the green process, and volunteer activities. From the above, the firms can
set goals for environmental load reduction at manufacturing bases and implemented zero-
emission of waste, reductions in chemical releases, and energy-saving measures (Nagata
and Okuda, 2005).
Process management should be in direct connection with the manufacturing processes
and conform to government regulations on controlling the volumes of chemical inputs
and building a society oriented toward resource recycling (Nagata and Okuda, 2005).
Green process activities are implemented by establishing target and planned values and
c~
18
thereafter, evaluation items determined according to the manufacturing process structure.
Companies should be able to track the processes used in the production of goods and
services until the consumer is satisfied. There must be feed back processes to determine
customer satisfaction
2.3.7 People
People of the right skills, attitude, and knowledge should be employed by companies for
them to have competitive edge over other companies. In addition, firms should never use
sick personnel or personnel without product or service know how. This is because the
people are the most important element of companies and any success or failures of firms
depend on them. As services tend to be produced and consumed at the same time, aspects
of the customer experience are altered to meet the 'individual needs' of the person
consuming it. Most of us can think of a situation where the personal services offered by
individuals has made or tainted a tour, vacation or restaurant meal. Companies should
know that, people buy from people what they like, so the attitude, skills and appearance
of all staff need to be first class. Some ways in which people add value to an experience,
as part of the marketing mix include training, personal selling and customer service
(EPA, 2007).
2.4 Challenges in the practice of Green Marketing
In the early days of the modem environmental movement, ecological issues were easy to
understand. A company spilled waste into a river and one could see it and smell it. On the
process the impact was local, immediate, and often acute. Today's biggest environmental
problems (climate, species extinction, depleting fisheries), are quite the opposite. They
are hidden, global, long-term, and chronic. Many environmental challenges involve
multiple steps: droughts cause species to migrate, causing a food-chain reaction resulting
in the death of a forest (Jacoby, 1973). Such cause-and-effect relationships are tough to
understand, even for the knowledgeable. With the growing concerns of these
environmental problems, businesses have now focused on them and have implemented a
series of initiatives to ameliorate them (Fang and Kiang, September 2006). Minimizing
these adverse environmental impacts is a great challenge to many and requires the
19

(
concerted efforts of decision makers, academics, non-governmental organizations, and
the public worldwide.
In adopting green marketing policies, firms may encounter many challenges such as
disconnect between consumers’ attitudes and actual behaviors, and their unwillingness to
pay premiums for green products. This may be partially rooted in consumers’ skepticism
of environmental claims (Prakash, 2002). Ottman and Terry (1998) have argued that
innovative environmental managers and product designers have faced the challenge of
making considerable progress toward reducing the environmental impacts of products. As
businesses are now driven by regulations, new technologies and consumer pressure,
product designers have focused on particular eco-aspects of products such as increasing
the amounts of recycled or recyclable materials, reducing in-use consumption of energy,
reducing material intensity of products, and the impact of product take-back schemes.
However, there are only a few strategic tools for marketers of green products, and even
these have evolved in an ad hoc manner.
As the demand for greener products exists, the opportunities to capitalize on that demand
are many. Much of the demand will continue to be driven by regulations as producer
responsibility, product take-back and recycling schemes evolve. As recent history has
shown, the more innovative companies will reap benefits, and those with radical re
thinking products and processes will be the leaders of the future. More importantly,
businesses face the credibility challenge by having a good environmental track record and
by paying attention to details such as the use of recycled materials. Leaders therefore
should take risks by advancing breakthrough environmental technology or by
encouraging their companies to be the first in the industry to sign voluntary
environmental codes to enhance the corporate image and thus gain the consumer trust.
Another challenge facing the green marketing firm is being proactive (Ottman and Terry,
1998).
Kotler (2004) identifies other factors as regulations and policies varying from one
country to another thus making it difficult for regional and global monitoring. Of recent
years, these laws are now in the increase giving a very big challenge to green marketers
to keep pace with their enactment. Related to this are those environmental factors that
20

vary from region to region that motivate consumers in different ways (Kotler and Gay,
2004).
2.5 Summary of Literature ReviewGreen marketing covers more than a firm's marketing claims. While firms must bear
much of the responsibility for environmental degradation, ultimately it is consumers who
demand goods and thus create environmental problems. It is the uncaring consumers who
choose to disposes off their waste in an inappropriate fashion. While firms can have a
great impact on the natural environment, the responsibility should not be theirs alone.
A 1994 study in Australia found out that consumers laid too much responsibility on
industry and government for taking care of the environment thus leading to their
damaging of the environment (EPA-NSW, 1994). However, what consumers want and
are willing to pay for is a cleaner environment, possibly through higher priced goods,
modified individual lifestyles, or even governmental intervention. Until this occurs it will
be difficult for firms alone to lead the green marketing revolution. The industrial buyer
also has the ability to pressure suppliers to modify their activities. Thus an environmental
committed organization may not only produce goods that have reduced their detrimental
impact on the environment, they may also be able to pressure their suppliers to behave in
a more environmentally "responsible" fashion. Finally, consumers and industrial buyers
have also the ability to pressurize organizations to integrate the environment into their
corporate culture and thus ensure all firms minimize the detrimental environmental
impact of their activities (Polonsky, 2001).
c~
21

c
CHAPTER THREE
RESEARCH METHODOLOGY
3.1 Research DesignThis was a descriptive study intended to establish the perception of Oil Marketing
Companies in Kenya towards the adoption of green marketing by the Kenya Petroleum
Refineries. According to Boyd, Westfall and Stasch (2004), descriptive studies are
supposed to describe the who, what, where, when, and how of a phenomenon. This was
the concern of the proposed study.
3.2 The PopulationThe population of interest in this study consisted of all the OMC’s that had signed
processing agreement with KPRL. The choice of the companies was because they refine
at KPRL and sell their products directly to the final consumer. Therefore, their
management was in a better position to understand the green marketing practices of the
refinery. According to the KPRL Hydrocarbon Entitlement Statement for April 2007,
there were 42 oil companies that process crude oil at KPRL (Appendix 2). Of these, only
32 companies had been active for the last six months. Due to the small size, a census
study was conducted.
3.3 Data Collection
Primary data was collected using a questionnaire subdivided into two parts. Part 1
consisted of open-ended questions aimed at obtaining general information on the firm.
Part 2 consisted of Likert type of questions for obtaining data on the perception of the
management of oil marketing companies towards green marketing practices by Kenya
Petroleum Refineries in product, pricing, distribution, promotion, process management,
and sales force.
The respondents were persons working in the trading, supplies and planning departments
of the oil marketing companies. Only one person per organization, preferably the Trading
Managers, Supplies and Planning Managers or Supplies Analysts were required to
complete the questionnaire. The questionnaires were sent via e-mails and personal visits.
For those OMC’s in Nairobi, the questionnaires were e-mailed to them and follow up
done by phone. For companies in Mombasa, the questionnaires were delivered in person
22
and picked up later. Follow up by personal visits was conducted. Only nineteen (19) out
of the thirty two (32) questionnaires that were sent out were completed. This represented
a response rate of 59.38% and it was considered suitable for the purpose of the study.
3.4 Operational Definitions of the variablesThe green marketing practises tested included product, price, promotion, distribution,
process management and sales force. These were operationalised in Appendix I. A Likert
scale was used to determine the perception of the management of the oil marketing
companies towards green marketing practises by the Kenya Petroleum Refineries.
3.5 Data AnalysisDescriptive statistics were used to analyse data that was indicative of the green marketing
practises by the Kenya Petroleum Refineries from the perception of the management of
the Oil Marketing Companies. Part one of the questionnaires was analysed using
frequency tables and percentages. Part two of the questionnaires was analysed using
mean scores, standard deviations and coefficients of variation.
23

CHAPTER FOUR
DATA ANALYSIS
4.1 IntroductionIn this chapter, data on the extent to which the Kenya Petroleum Refineries is perceived
by the management of Oil Marketing Companies as to be practicing green marketing is
analysed. Data on the demographic profiles of the companies has been analysed using
frequencies and percentages. Data on the extent to which the Kenya Petroleum Refineries
practices green marketing has been analysed using mean scores, standard deviations and
coefficients of variation. From the 32 questionnaires that were sent out to the
respondents, only 19 were returned. This gave a response rate of 59.38%. This compares
well with studies done previously such as the one by Obuya (2003) which had 60%.
4.2 Demographic Characteristics of the Respondents
The demographic characteristics of the respondents that were tested include age and
ownership of the firms. The findings are presented in this section.
4.2.1 Number of years in existence
Table 1: Age of Firms
Years of operation Frequency Percentage
Under 10 years 9 31.58%
10-20 years 6 47.37%
Above 20 years 4 21.05%
Total 19 100%
Source: Response Data
The findings on Table 1 show that 21.05% of the companies have been in existence in the
country for more than 20 years, 31.58% have been in existence for less than 10 years
while 47.37% have been in existence for between 10-20 years. This implies that majority
of the Oil Marketing Companies have been in existence for between lOand 20 years.
24
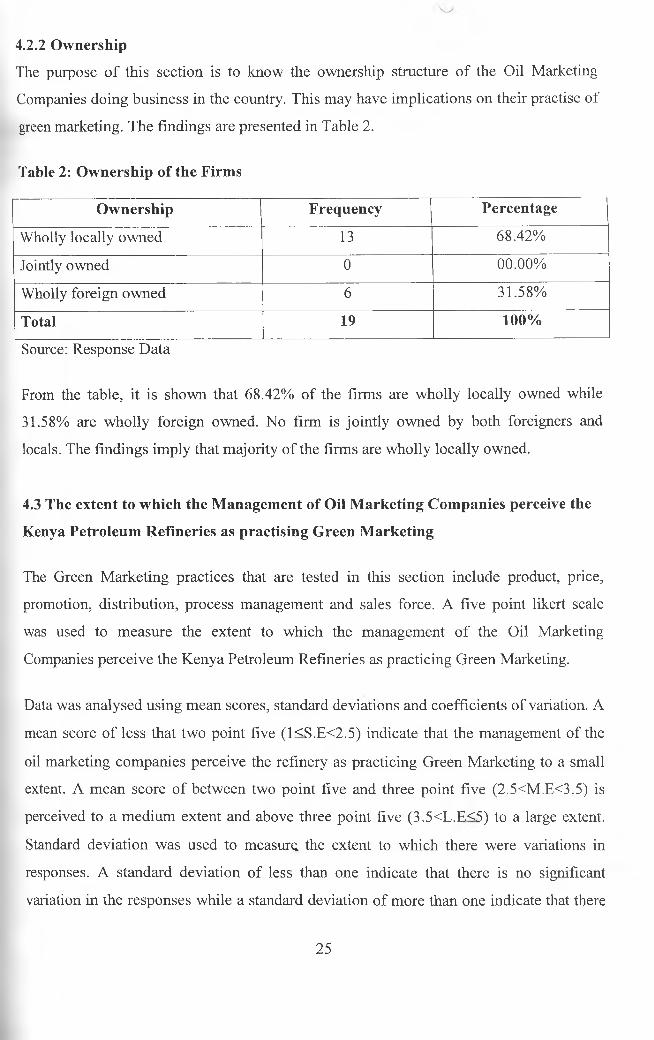
4.2.2 Ownership
The purpose of this section is to know the ownership structure of the Oil Marketing
Companies doing business in the country. This may have implications on their practise of
green marketing. The findings are presented in Table 2.
Table 2: Ownership of the Firms
Ownership Frequency Percentage
Wholly locally owned 13 68,42%
Jointly owned 0 00.00%
Wholly foreign owned 6 31.58%
Total 19 100%
Source: Response Data
From the table, it is shown that 68.42% of the firms are wholly locally owned while
31.58% are wholly foreign owned. No firm is jointly owned by both foreigners and
locals. The findings imply that majority of the firms are wholly locally owned.
4.3 The extent to which the Management of Oil Marketing Companies perceive the
Kenya Petroleum Refineries as practising Green Marketing
The Green Marketing practices that are tested in this section include product, price,
promotion, distribution, process management and sales force. A five point likert scale
was used to measure the extent to which the management of the Oil Marketing
Companies perceive the Kenya Petroleum Refineries as practicing Green Marketing.
Data was analysed using mean scores, standard deviations and coefficients of variation. A
mean score of less that two point five (1<S.E<2.5) indicate that the management of the
oil marketing companies perceive the refinery as practicing Green Marketing to a small
extent. A mean score of between two point five and three point five (2.5<M.E<3.5) is
perceived to a medium extent and above three point five (3,5<L.E<5) to a large extent.
Standard deviation was used to measure the extent to which there were variations in
responses. A standard deviation of less than one indicate that there is no significant
variation in the responses while a standard deviation of more than one indicate that there
25
is a significant variation in the responses. Coefficients of variation were used to measure
the variability of the responses. A value of less than 50% indicate that the variations in
responses are not significant while a value of greater than 50% indicate that there are
significant variations.
4.3.1 ProductThe product characteristics that are tested include quality, safety, conformance, reliability
and Recycling.
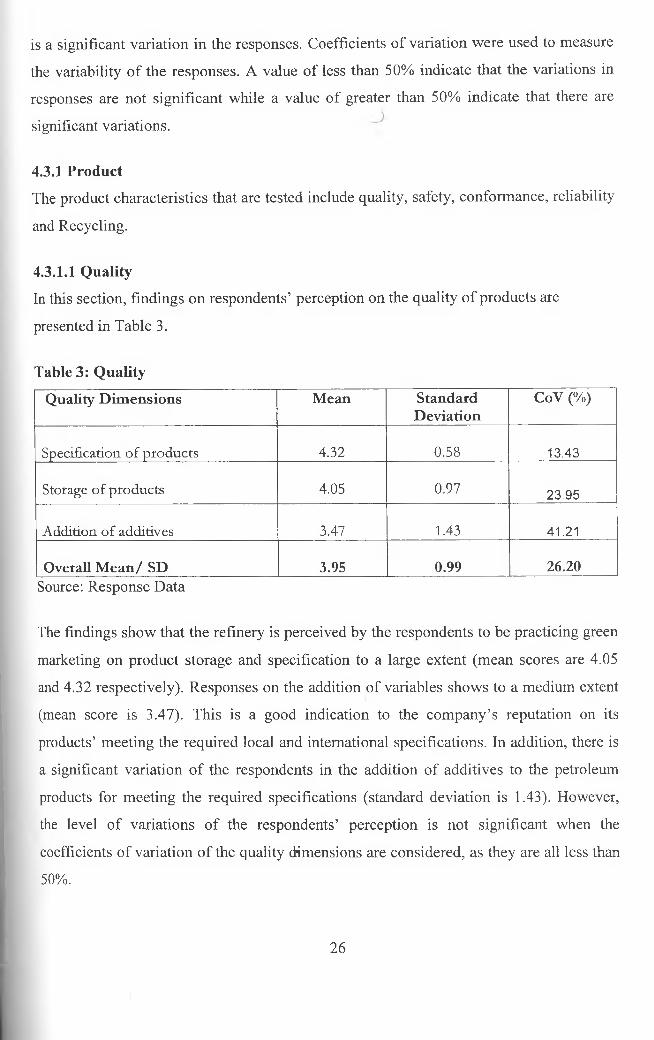
4.3.1.1 QualityIn this section, findings on respondents’ perception on the quality of products are
presented in Table 3.
Table 3: Quality
Quality Dimensions Mean StandardDeviation
CoV (%)
Specification o f products 4.32 0.58 13.43
Storage o f products 4.05 0.97 23.95
Addition o f additives 3.47 1.43 41.21
Overall Mean/ SD 3.95 0.99 26.20Source: Response Data
The findings show that the refinery is perceived by the respondents to be practicing green
marketing on product storage and specification to a large extent (mean scores are 4.05
and 4.32 respectively). Responses on the addition of variables shows to a medium extent
(mean score is 3.47). This is a good indication to the company’s reputation on its
products’ meeting the required local and international specifications. In addition, there is
a significant variation of the respondents in the addition of additives to the petroleum
products for meeting the required specifications (standard deviation is 1.43). However,
the level of variations of the respondents’ perception is not significant when the
coefficients of variation of the quality dimensions are considered, as they are all less than
50%.
26
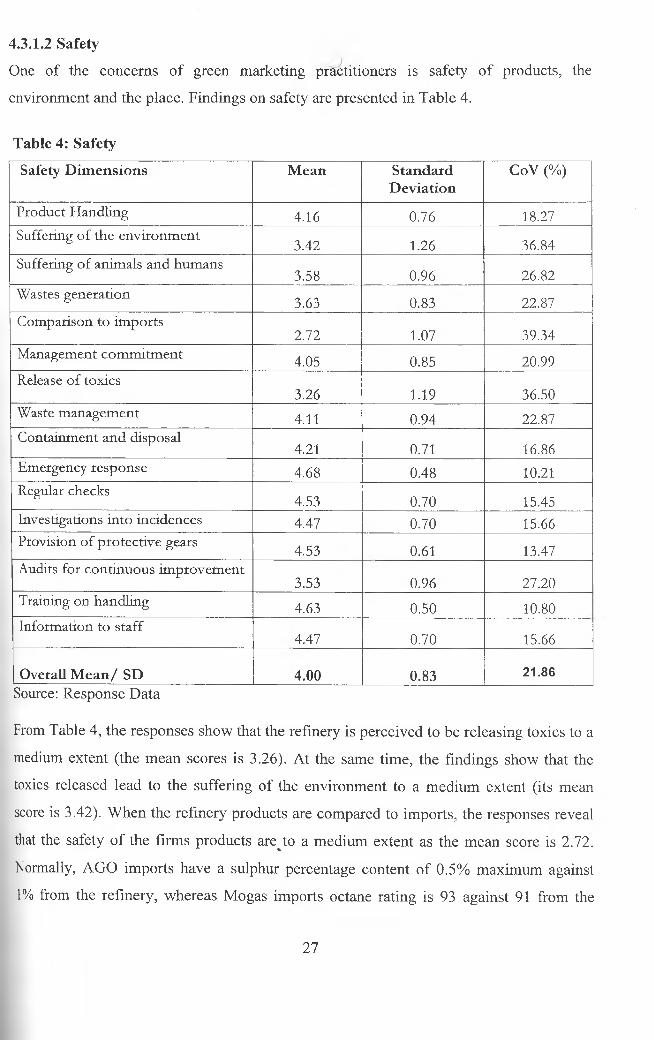
4.3.1.2 Safety
One of the concerns of green marketing practitioners is safety of products, the
environment and the place. Findings on safety are presented in Table 4.
Table 4: Safety
Safety Dimensions Mean StandardDeviation
CoV (%)
Product H andling 4.16 0.76 18.27Suffering o f the environm ent
3.42 1.26 36.84Suffering o f animals and hum ans
3.58 0.96 26.82Wastes generation
3.63 0.83 22.87Com parison to im ports
2.72 1.07 39.34M anagement com m itm ent 4.05 0.85 20.99Release o f toxics
3.26 1.19 36.50Waste m anagem ent 4.11 0.94 22.87Containm ent and disposal
4.21 0.71 16.86Emergency response 4.68 0.48 10.21Regular checks
4.53 0.70 15.45Investigations into incidences 4.47 0.70 15.66Provision o f protective gears
4.53 0.61 13.47Audits for continuous im provem ent
3.53 0.96 27.20Training on handling 4.63 0.50 10.80Information to staff
4.47 0.70 15.66
1 Overall Mean/ SD 4.00 0.83 21.86Source: Response Data
From Table 4, the responses show that the refinery is perceived to be releasing toxics to a
medium extent (the mean scores is 3.26). At the same time, the findings show that the
toxics released lead to the suffering of the environment to a medium extent (its mean
score is 3.42). When the refinery products are compared to imports, the responses reveal
that the safety of the firms products are^to a medium extent as the mean score is 2.72.
Normally, AGO imports have a sulphur percentage content of 0.5% maximum against
1% from the refinery, whereas Mogas imports octane rating is 93 against 91 from the
27
refinery (Petroleum Insight, 2006). The other dimensions show that the respondents
perceive the refinery to a large extent as their mean scores are above 3.5. The level of
variations of the respondents’ perception is significant only in the suffering of the
environment, comparison to imports and on the release of toxics to the atmosphere as the
standard deviations are above one. In all these cases however, the coefficients of
variations show that there are no significant variations of the respondents.
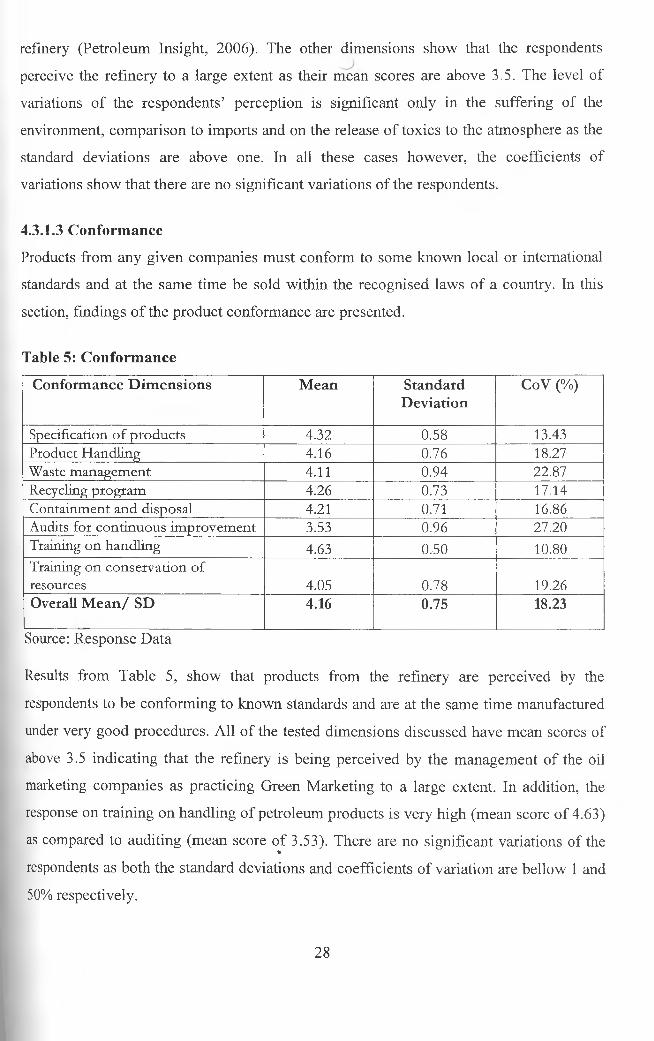
4.3.1.3 Conformance
Products from any given companies must conform to some known local or international
standards and at the same time be sold within the recognised laws of a country. In this
section, findings of the product conformance are presented.
Table 5: Conformance
Conformance Dimensions Mean StandardDeviation
CoV (%)
Specification o f products 4.32 0.58 13.43Product H andling 4.16 0.76 18.27Waste m anagem ent 4.11 0.94 22.87Recycling program 4.26 0.73 17.14Containm ent and disposal 4.21 0.71 16.86Audits for continuous im provem ent 3.53 0.96 27.20Training on handling 4.63 0.50 10.80Training on conservation o f resources 4.05 0.78 19.26Overall Mean/ SD 4.16 0.75 18.23
Source: Response Data
Results from Table 5, show that products from the refinery are perceived by the
respondents to be conforming to known standards and are at the same time manufactured
under very good procedures. All of the tested dimensions discussed have mean scores of
above 3.5 indicating that the refinery is being perceived by the management of the oil
marketing companies as practicing Green Marketing to a large extent. In addition, the
response on training on handling of petroleum products is very high (mean score of 4.63)
as compared to auditing (mean score of 3.53). There are no significant variations of the%
respondents as both the standard deviations and coefficients of variation are bellow 1 and
50% respectively.
28

4.3.1.4 Reliability
The reliability of the product supply from one source to another is very critical in
determining the turnover, and hence the profits a company is to expect. This then builds
trust between companies, which is good for business. In this section, data on the extent of
reliability of Kenya Petroleum Refineries’ products is analysed.
Table 6: Reliability
Reliability Dimensions Mean StandardDeviation
CoV (%)
Ease o f availability 4.00 1.11 27.75Location o f the com pany 3.63 1.01 27.82Schedule o f deliveries 3.89 1.15 29.56Quantities, o f deliveries 3.47 1.05 30.26Place o f delivery 4.37 0.68 15.56M anagement com m itm ent 4.05 0.85 20.99Audits for continuous im provem ent 3.53 0.96 27.20Training on handling 4.63 0.50 10.80Courteousness, friendliness and politeness 4.32 0.82 18.98Overall Mean/ SD 3.99 0.90 23.21
Source: Response Data
From Table 6, the responses show that the quantities of the deliveries are perceived to a
medium extent. The mean score is 3.47. This should be a wake up call to the management
of the company to put in structures so as to improve on the amount of product deliveries.
The rest of the other reliability dimensions are perceived to a large extent since their
mean scores are above 3.5. On the other hand, there is a significant variation on the ease
of availability of the products, location of the premises, management commitment and
courteous, friendly and polite employees vary significantly (their standard deviations are
above one). In addition, the coefficients of variations show that there are no significant
variations of the respondents’ perception.
4.3.1.5 Recycling
Green Marketing, among other activities, involves the recycling of products or by
products generated during the manufacturing processes. I'his is very critical if a company
has to be perceived to be practicing green marketing on aspects that include reduce,
reuse, recycle and recover. Findings are presented in Table 7
29

)Table 7: Recycling
Recycling Dimensions Mean StandardDeviation
CoV (%)
Ease o f recyclability or reuse 3.63 1.26 34.71M anagem ent com m itm ent 4.05 0.85 20.99W aste m anagem ent 4.11 0.94 22.87Recycling program 4.26 0.73 17.14Containm ent and disposal 4.21 0.71 16.86Training on conservation o f resources 4.05 0.78 19.26Overall Mean/ SD 4.05 0.88 21.97
Source: Response Data
The responses show that all the recycling dimensions are perceived to a large extent
(mean scores above 3.5). As this indicates that the refinery is practising green marketing
to a large extent, the firm is perceived by the respondents to have put in place a recycling
program and waste management system which has a very good containment and disposal
mechanism. The responses also show that the firm is perceived to have trained its
employees on conservation of resources to a large extent as its mean score is 4.05. There
is a significant variation of the respondents’ perception on the ease of recycling or reuse
of the petroleum products as the standard deviation is above 1.26, with the rest of the
dimensions not having significant variations on the respondents. Moreover, the
coefficients of variation indicate that there are no significant variations of the respondents
as all the recycling dimensions are less than 50%.
4.3.2 Price
In this section, data on price settings and invoicing is presented.
4.3.2.1 Price Settings
The pricing of goods and services from the manufactures would eventually determine
their selling prices to the final consumer, and this has a direct effect on the profits that
would be generated by any given company which then means that it would have a direct
bearing on the respondents’ perceptions towards green marketing practises. In this
section, findings of price settings are presented in Table 8.
30
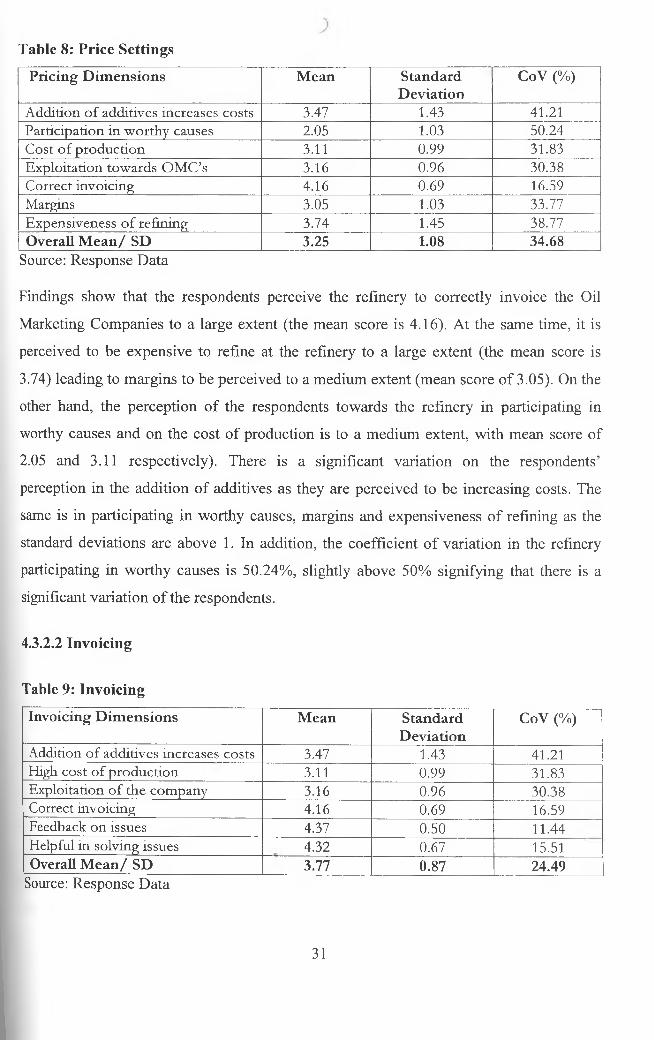
Table 8: Price Settings
Pricing Dimensions Mean StandardDeviation
CoV (%)
Addition o f additives increases costs 3.47 1.43 41.21Participation in w orthy causes 2.05 1.03 50.24Cost o f production 3.11 0.99 31.83Exploitation towards O M C ’s 3.16 0.96 30.38Correct invoicing 4.16 0.69 16.59Margins 3.05 1.03 33.77Expensiveness o f refining 3.74 1.45 38.77Overall Mean/ SD 3.25 1.08 34.68
Source: Response Data
Findings show that the respondents perceive the refinery to correctly invoice the Oil
Marketing Companies to a large extent (the mean score is 4.16), At the same time, it is
perceived to be expensive to refine at the refinery to a large extent (the mean score is
3.74) leading to margins to be perceived to a medium extent (mean score of 3.05). On the
other hand, the perception of the respondents towards the refinery in participating in
worthy causes and on the cost of production is to a medium extent, with mean score of
2.05 and 3.11 respectively). There is a significant variation on the respondents’
perception in the addition of additives as they are perceived to be increasing costs. The
same is in participating in worthy causes, margins and expensiveness of refining as the
standard deviations are above 1. In addition, the coefficient of variation in the refinery
participating in worthy causes is 50.24%, slightly above 50% signifying that there is a
significant variation of the respondents.
4.3.2.2 Invoicing
Table 9: Invoicing
Invoicing Dimensions Mean StandardDeviation
CoV (%)
Addition o f additives increases costs 3.47 1.43 41.21High cost o f production 3.11 0.99 31.83Exploitation o f the com pany 3.16 0.96 30.38Correct invoicing 4.16 0.69 16.59Feedback on issues 4.37 0.50 11.44Helpful in solving issues 4.32 0.67 15.51Overall Mean/ SD 3.77 0.87 24.49
Source: Response Data
31

;From Table 9, findings indicate that the refinery is perceived to be exploiting the oil
marketing companies to a medium extent as the mean score is 3.16. In addition, the cost
of production is perceived to a medium extent, as its mean score is 3.11, the same with
the addition of additives, which has a mean score of 3.47. However, most respondents
perceive the refinery to be invoicing them correctly and they receive feed back on issues
dealing with invoicing whenever they are raised (mean of 4.16 and 4.37 respectively). In
addition the firm is being helpful to the marketers in solving any arising issues to a large
extent. However, there is a significant variation of the respondents’ perception on the
addition of additives as the standard deviation is 1.43 with no significant level of
variation of the respondents when the coefficients of variation are considered.
4.3.3 Promotion
Promotion variables that were tested include corporate activities and location.
4.3.3.1 Corporate Activities
In today’s world, most companies are considered to be citizens. They can be judged as
either good or bad corporate citizens depending on whether they payback to the society
what they owe to them or not. Findings of the corporate activities are presented in this
section.
Table 10: Corporate Activities
Corporate Dimensions Mean StandardDeviation
CoV (%)
Participation in w orthy causes 2.05 1.03 50.24A good corporate citizen 2.95 1.27 43.05Management com m itm ent 4.05 0.85 20.99Customer survey 2.32 1.29 55.60Audits for continuous im provem ent 3.53 0.96 27.20Training on handling 4.63 0.50 10.80Overall Mean/ SD 3.26 0.98 34.65
Source: Response Data
It is shown in Table 10 that the company is both perceived to participate in worthy causes
and a good corporate citizen to a medium extent (the mean scores are 2.05 and 2.95
respectively). Also, the marketing companies perceive the refinery to carry out surveys to
a medium extent (mean score of 2.32). However, the findings show that the perceptions
on the management commitment, audits for continuous improvement and training on
32
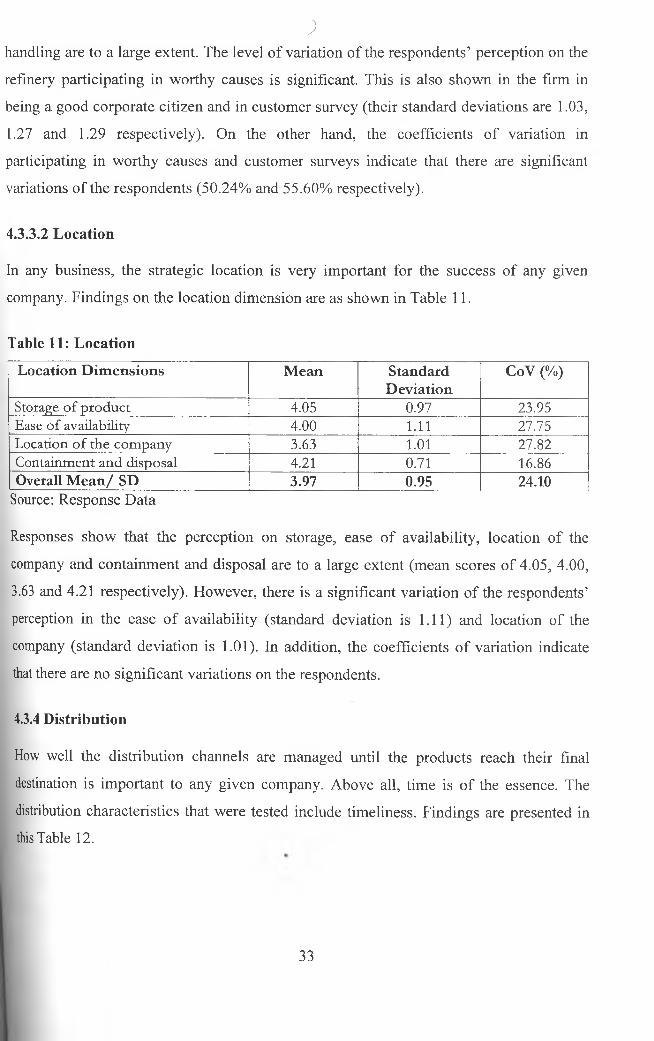
handling are to a large extent. The level of variation of the respondents’ perception on the
refinery participating in worthy causes is significant. This is also shown in the firm in
being a good corporate citizen and in customer survey (their standard deviations are 1.03,
1.27 and 1.29 respectively). On the other hand, the coefficients of variation in
participating in worthy causes and customer surveys indicate that there are significant
variations of the respondents (50.24% and 55.60% respectively).
9
4.3.3.2 Location
In any business, the strategic location is very important for the success of any given
company. Findings on the location dimension are as shown in Table 11.
Table 11: Location
Location Dimensions Mean StandardDeviation
CoV (%)
Storage o f p roduct 4.05 0.97 23.95Ease o f availability 4.00 1.11 27.75Location o f the com pany 3.63 1.01 27.82Containment and disposal 4.21 0.71 16.86Overall Mean/ SD 3.97 0.95 24.10
Source: Response Data
Responses show that the perception on storage, ease of availability, location of the
company and containment and disposal are to a large extent (mean scores of 4.05, 4.00,
3.63 and 4.21 respectively). However, there is a significant variation of the respondents’
perception in the ease of availability (standard deviation is 1.11) and location of the
company (standard deviation is 1.01). In addition, the coefficients of variation indicate
that there are no significant variations on the respondents.
4.3.4 Distribution
How well the distribution channels are managed until the products reach their final
destination is important to any given company. Above all, time is of the essence. The
distribution characteristics that were tested include timeliness. Findings are presented in this Table 12.
33

Table 12: Timeliness
Timeliness Dimensions Mean StandardDeviation
CoV (%)
Storage o f products 4.05 0.97 23.95Ease o f availability 4.00 1.11 27.75Schedule o f deliveries 3.89 1.15 29.56Quantities o f deliveries 3.47 1.05 30.26Place o f delivery 4.37 0.68 15.56Overall Mean/ SD 3.96 0.99 25.42
Source: Response Data
The responses on the dimensions that include storage, ease of availability, schedule of
deliveries and place of delivery are all to a large extent (all the mean scores are above
3.5). However, responses on quantities are to a medium extent (mean score is 3.47).
However, the place of delivery and storage of products show that the level of variation of
the respondents’ perception is not significant as the standard deviations are 0.68 and 0.97
respectively. In addition, there is no significant variation of the respondents on the
timeliness dimension when the coefficients of variation are considered.
4.3.5 Process Management
In any organization, any activities done without the management support are likely to
fail. For this to be avoided, the management has to give support to each and every
department of the company. In this section, the aim was to find out how well the refinery
processes were managed by the refinery. The process management characteristics that
were tested include commitment, service delivery; quality audits, health, safety and
environmental performance and expertise.
4.3.5.1 Commitment
Table 13: Commitment
Commitment Dimensions Mean StandardDeviation
CoV (%)
Schedule o f deliveries 3.89 1.15 29.56Regular checks 4.53 0.70 15.45Investigations on incidences 4.47 0.70 15.66Training on handling 4.63 0.50 10.80Courteousness, friendliness and %
politeness 4.32 0.82 18.98Overall Mean/ SD 4.37 0.77 18.09
Source: Response Data
34
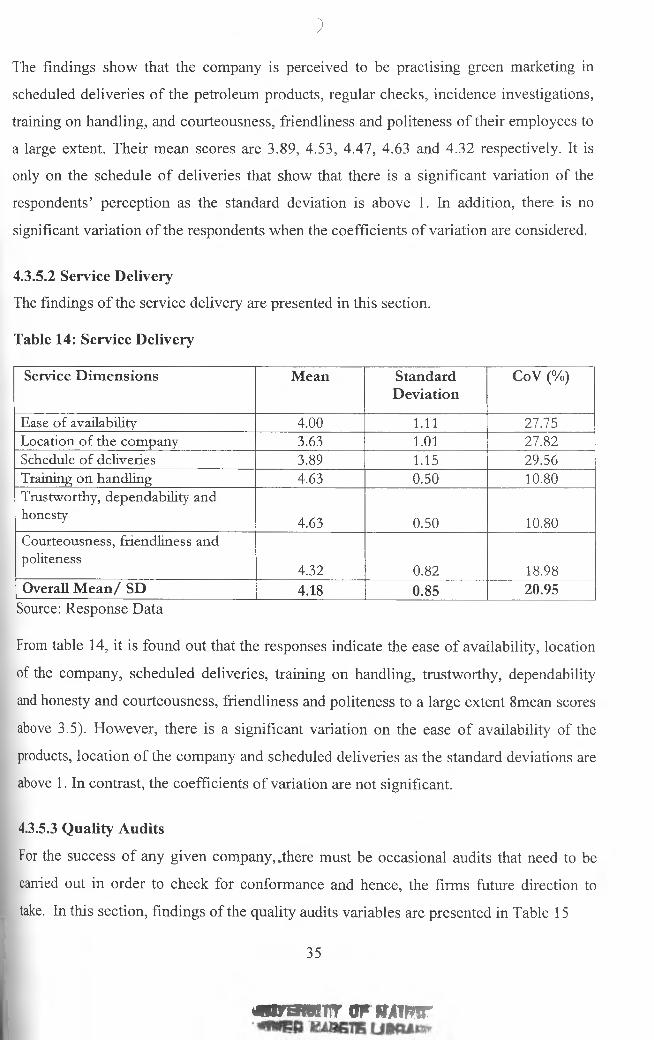
;
The findings show that the company is perceived to be practising green marketing in
scheduled deliveries of the petroleum products, regular checks, incidence investigations,
training on handling, and courteousness, friendliness and politeness of their employees to
a large extent. Their mean scores are 3.89, 4.53, 4.47, 4.63 and 4.32 respectively. It is
only on the schedule of deliveries that show that there is a significant variation of the
respondents’ perception as the standard deviation is above 1. In addition, there is no
significant variation of the respondents when the coefficients of variation are considered.
43.5.2 Service DeliveryThe findings of the service delivery are presented in this section.
Table 14: Service Delivery
Service Dimensions Mean StandardDeviation
CoV (%)
Ease o f availability 4.00 1.11 27.75Location o f the com pany 3.63 1.01 27.82Schedule o f deliveries 3.89 1.15 29.56Training on handling 4.63 0.50 10.80Trustworthy, dependability and honesty
4.63 0.50 10.80Courteousness, friendliness and politeness
4.32 0.82 18.98Overall Mean/ SD 4.18 0.85 20.95
Source: Response Data
From table 14, it is found out that the responses indicate the ease of availability, location
of the company, scheduled deliveries, training on handling, trustworthy, dependability
and honesty and courteousness, friendliness and politeness to a large extent 8mean scores
above 3.5). However, there is a significant variation on the ease of availability of the
products, location of the company and scheduled deliveries as the standard deviations are
above 1. In contrast, the coefficients of variation are not significant.
43.5.3 Quality Audits
For the success of any given company, ..there must be occasional audits that need to be
carried out in order to check for conformance and hence, the firms future direction to
take. In this section, findings of the quality audits variables are presented in Table 15
35
m n ra iM T r o w ftA im r

)
Table 15: Quality Audits
Quality Audits Dimensions Mean StandardDeviation
CoY (%)
Specification o f products 4.32 0.58 13.43Storage o f products 4.05 0.97 23.95Ease o f Recyclability or reuse 3.63 1.26 34.71A ddition o f additives increases costs 3.47 1.43 41.21M anagem ent com m itm ent 4.05 0.85 20.99Release o f toxics 3.26 1.19 36.50W aste m anagem ent 4.11 0.94 22.87Containm ent and disposal 4.21 0.71 16.86Regular checks 4.53 0.70 15.45Investigations on incidences 4.47 0.70 15.66Provision o f protective gears 4.53 0.61 13.47Audits for continuous im provem ent 3.53 0.96 27.20Inform ation to staff 4.47 0.70 15.66Overall Mean/ SD 4.05 0.89 22.92
Source: Response Data
The findings show that on the release of toxics, the refinery is perceived to a medium
extent. The same is with the addition of additives to determine if they increased costs
(mean scores are 3.26 and 3.47 respectively). The other dimensions are to a large extent.
In addition, the level of variations of the respondents’ perception is significant in the ease
of recycling or reuse, addition of additives in determining if they increase costs and
release of toxics during the refining process. In this case, the standard deviations are 1.26,
1.43 and 1.19 respectively. Moreover, there are no significant variations on the
respondents’ perception on all the relevant issues as their coefficients of variation are less
than 50%.
4.3.5.4 Health, Safety and Environmental Performance
The health of the employees, their safety and the company’s performance towards the
environment are crucial factors to consider when a company lays down its foundation
towards protecting the environment. For the given company this has an inclination
towards affecting the perception of people in green marketing. The findings of the health,
safety and environmental performance are presented in Table 16.
36
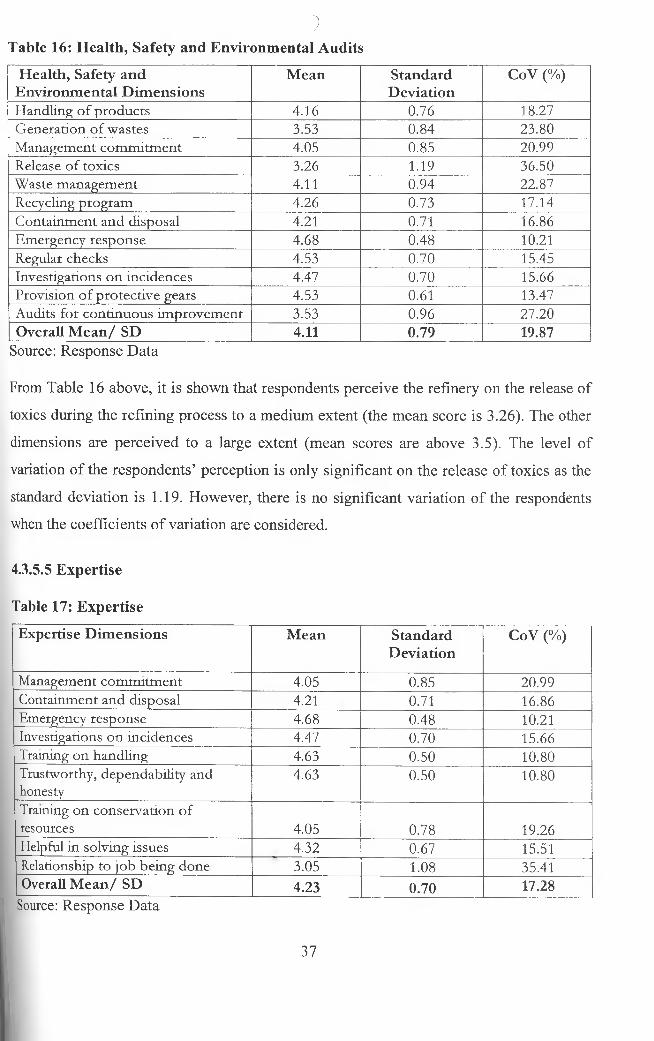
)Table 16: Health, Safety and Environmental Audits
Health, Safety and Environmental Dimensions
Mean StandardDeviation
CoV (%)
Handling o f products 4.16 0.76 18.27G eneration o f wastes 3.53 0.84 23.80M anagem ent com m itm ent 4.05 0.85 20.99Release o f toxics 3.26 1.19 36.50W aste m anagem ent 4.11 0.94 22.87Recycling program 4.26 0.73 17.14Containm ent and disposal 4.21 0.71 16.86Em ergency response 4.68 0.48 10.21Regular checks 4.53 0.70 15.45Investigations on incidences 4.47 0.70 15.66Provision o f protective gears 4.53 0.61 13.47Audits for continuous im provem ent 3.53 0.96 27.20Overall Mean/ SD 4.11 0.79 19.87
Source: Response Data
From Table 16 above, it is shown that respondents perceive the refinery on the release of
toxics during the refining process to a medium extent (the mean score is 3.26). The other
dimensions are perceived to a large extent (mean scores are above 3.5). The level of
variation of the respondents’ perception is only significant on the release of toxics as the
standard deviation is 1.19. However, there is no significant variation of the respondents
when the coefficients of variation are considered.
4.3.5.5 Expertise
Table 17: Expertise
Expertise Dimensions Mean StandardDeviation
CoV (%)
Management com m itm ent 4.05 0.85 20.99Containment and disposal 4.21 0.71 16.86Emergency response 4.68 0.48 10.21Investigations on incidences 4.47 0.70 15.66Training on handling 4.63 0.50 10.80Trustworthy, dependability and honesty
4.63 0.50 10.80
Training on conservation o f resources 4.05 0.78 19.26Helpful in solving issues 4.32 0.67 15.51Relationship to job being done 3.05 1.08 35.41Overall Mean/ SD 4.23 0.70 17.28
Source: Response Data
37
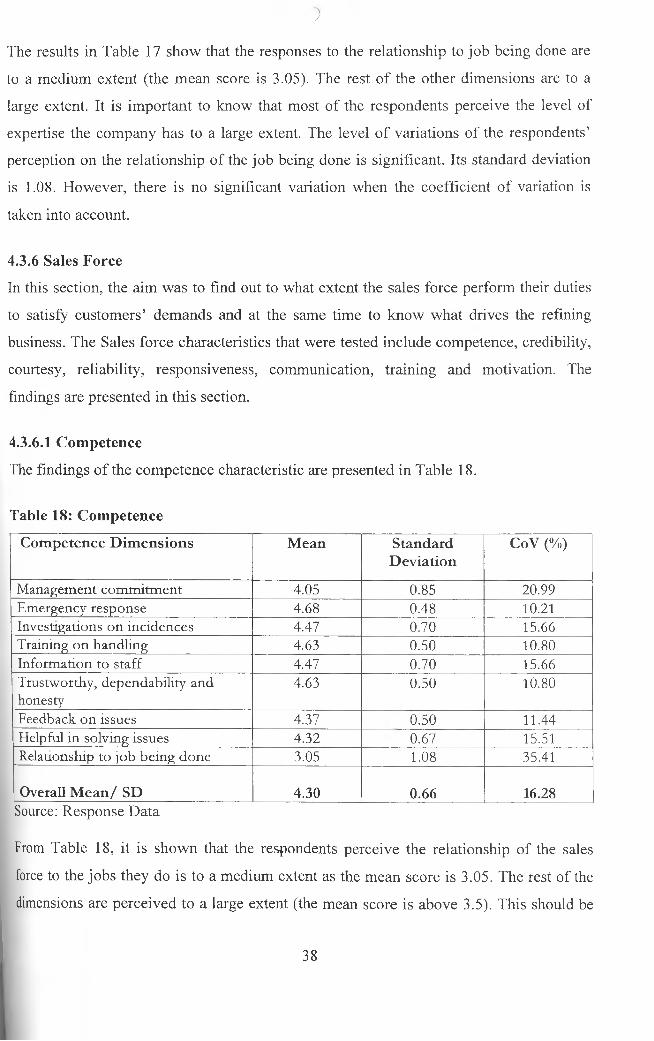
/
The results in Table 17 show that the responses to the relationship to job being done are
to a medium extent (the mean score is 3.05). The rest of the other dimensions are to a
large extent. It is important to know that most of the respondents perceive the level of
expertise the company has to a large extent. The level of variations of the respondents’
perception on the relationship of the job being done is significant. Its standard deviation
is 1.08. However, there is no significant variation when the coefficient of variation is
taken into account.
4.3.6 Sales Force
In this section, the aim was to find out to what extent the sales force perform their duties
to satisfy customers’ demands and at the same time to know what drives the refining
business. The Sales force characteristics that were tested include competence, credibility,
courtesy, reliability, responsiveness, communication, training and motivation. The
findings are presented in this section.
4.3.6.1 Competence
The findings of the competence characteristic are presented in Table 18.
Table 18: Competence
Competence Dimensions Mean StandardDeviation
CoV (%)
M anagement com m itm ent 4.05 0.85 20.99Emergency response 4.68 0.48 10.21Investigations on incidences 4.47 0.70 15.66Training on handling 4.63 0.50 10.80Inform ation to staff 4.47 0.70 15.66Trustworthy, dependability and honesty
4.63 0.50 10.80
Feedback on issues 4.37 0.50 11.44Helpful in solving issues 4.32 0.67 15.51Relationship to job being done 3.05 1.08 35.41
Overall Mean/ SD 4.30 0.66 16.28Source: Response Data
From Table 18, it is shown that the respondents perceive the relationship of the sales
force to the jobs they do is to a medium extent as the mean score is 3.05. The rest of the
dimensions are perceived to a large extent (the mean score is above 3.5). This should be
38
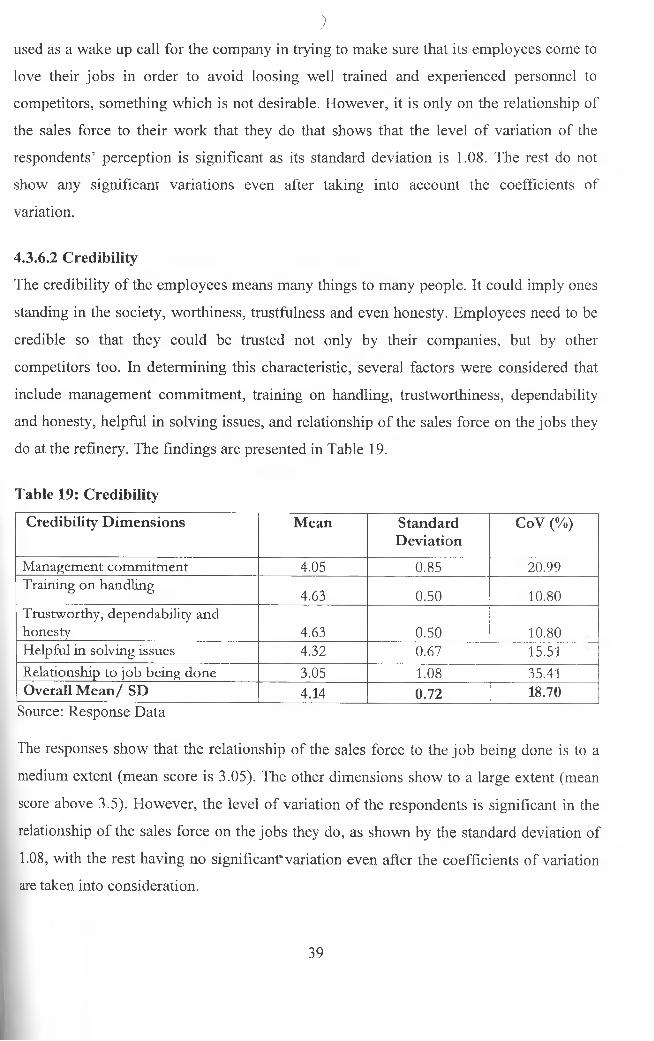
used as a wake up call for the company in trying to make sure that its employees come to
love their jobs in order to avoid loosing well trained and experienced personnel to
competitors, something which is not desirable. However, it is only on the relationship of
the sales force to their work that they do that shows that the level of variation of the
respondents’ perception is significant as its standard deviation is 1.08. The rest do not
show any significant variations even after taking into account the coefficients of
variation.
)
4.3.6.2 Credibility
The credibility of the employees means many things to many people. It could imply ones
standing in the society, worthiness, trustfulness and even honesty. Employees need to be
credible so that they could be trusted not only by their companies, but by other
competitors too. In determining this characteristic, several factors were considered that
include management commitment, training on handling, trustworthiness, dependability
and honesty, helpful in solving issues, and relationship of the sales force on the jobs they
do at the refinery. The findings are presented in Table 19.
Table 19: Credibility
Credibility Dimensions Mean StandardDeviation
CoV (%)
M anagem ent com m itm ent 4.05 0.85 20.99Training on handling
4.63 0.50 10.80Trustworthy, dependability and honesty 4.63 0.50 10.80Helpful in solving issues 4.32 0.67 15.51Relationship to job being done 3.05 1.08 35.41Overall Mean/ SD 4.14 0.72 18.70
Source: Response Data
The responses show that the relationship of the sales force to the job being done is to a
medium extent (mean score is 3.05). The other dimensions show to a large extent (mean
score above 3.5). However, the level of variation of the respondents is significant in the
relationship of the sales force on the jobs they do, as shown by the standard deviation of
1.08, with the rest having no significant-variation even after the coefficients of variation are taken into consideration.
39
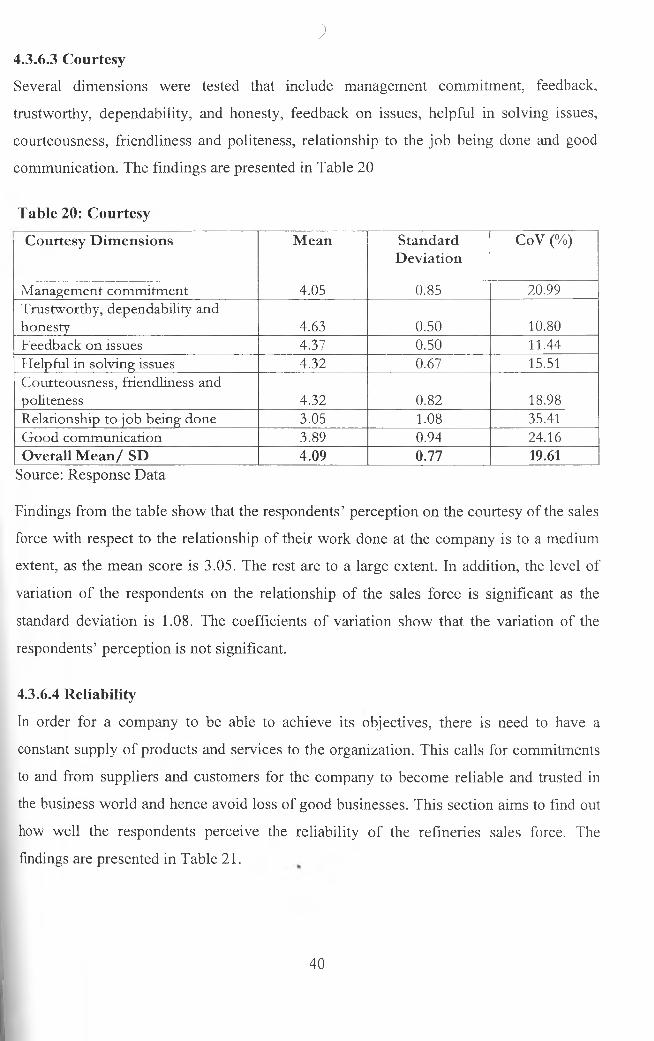
;4.3.6.3 CourtesySeveral dimensions were tested that include management commitment, feedback,
trustworthy, dependability, and honesty, feedback on issues, helpful in solving issues,
courteousness, friendliness and politeness, relationship to the job being done and good
communication. The findings are presented in Table 20
Table 20: Courtesy
Courtesy Dimensions Mean StandardDeviation
CoV (%)
M anagem ent com m itm ent 4.05 0.85 20.99Trustw orthy, dependability and honesty 4.63 0.50 10.80Feedback on issues 4.37 0.50 11.44Helpful in solving issues 4.32 0.67 15.51Courteousness, friendliness and politeness 4.32 0.82 18.98Relationship to job being done 3.05 1.08 35.41G ood com m unication 3.89 0.94 24.16Overall Mean/ SD 4.09 0.77 19.61
Source: Response Data
Findings from the table show that the respondents’ perception on the courtesy of the sales
force with respect to the relationship of their work done at the company is to a medium
extent, as the mean score is 3.05. The rest are to a large extent. In addition, the level of
variation of the respondents on the relationship of the sales force is significant as the
standard deviation is 1.08. The coefficients of variation show that the variation of the
respondents’ perception is not significant.
4.3.6.4 Reliability
In order for a company to be able to achieve its objectives, there is need to have a
constant supply of products and services to the organization. This calls for commitments
to and from suppliers and customers for the company to become reliable and trusted in
the business world and hence avoid loss of good businesses. This section aims to find out
how well the respondents perceive the reliability of the refineries sales force. The
findings are presented in Table 21.
40
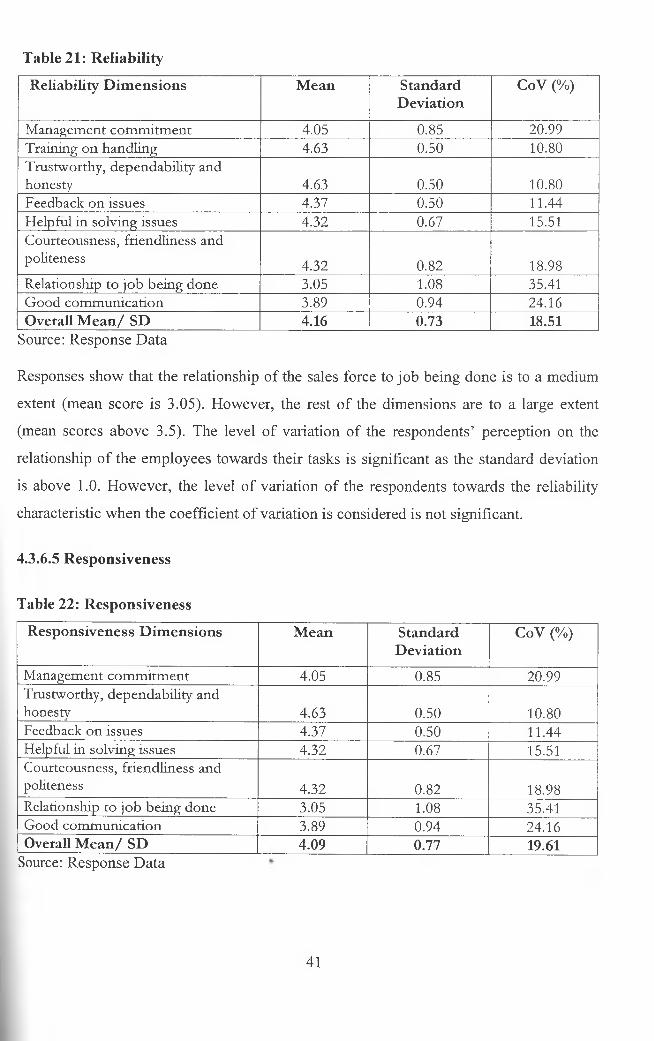
Table 21: Reliability
Reliability Dimensions Mean StandardDeviation
CoV (%)
M anagem ent com m itm ent 4.05 0.85 20.99Training on handling 4.63 0.50 10.80Trustworthy, dependability and honesty 4.63 0.50 10.80Feedback on issues 4.37 0.50 11.44Helpful in solving issues 4.32 0.67 15.51Courteousness, friendliness and politeness 4.32 0.82 18.98Relationship to job being done 3.05 1.08 35.41G ood com m unication 3.89 0.94 24.16Overall Mean/ SD 4.16 0.73 18.51
Source: Response Data
Responses show that the relationship of the sales force to job being done is to a medium
extent (mean score is 3.05). However, the rest of the dimensions are to a large extent
(mean scores above 3.5). The level of variation of the respondents’ perception on the
relationship of the employees towards their tasks is significant as the standard deviation
is above 1.0. However, the level of variation of the respondents towards the reliability
characteristic when the coefficient of variation is considered is not significant.
4.3.6.5 Responsiveness
Table 22: Responsiveness
Responsiveness Dimensions Mean StandardDeviation
CoV (%)
M anagement com m itm ent 4.05 0.85 20.99Trustworthy, dependability and honesty 4.63 0.50 10.80Feedback on issues 4.37 0.50 11.44Helpful in solving issues 4.32 0.67 15.51Courteousness, friendliness and politeness 4.32 0.82 18.98Relationship to job being done 3.05 1.08 35.41Good com m unication 3.89 0.94 24.16Overall Mean/ SD 4.09 0.77 19.61
Source: Response Data
41
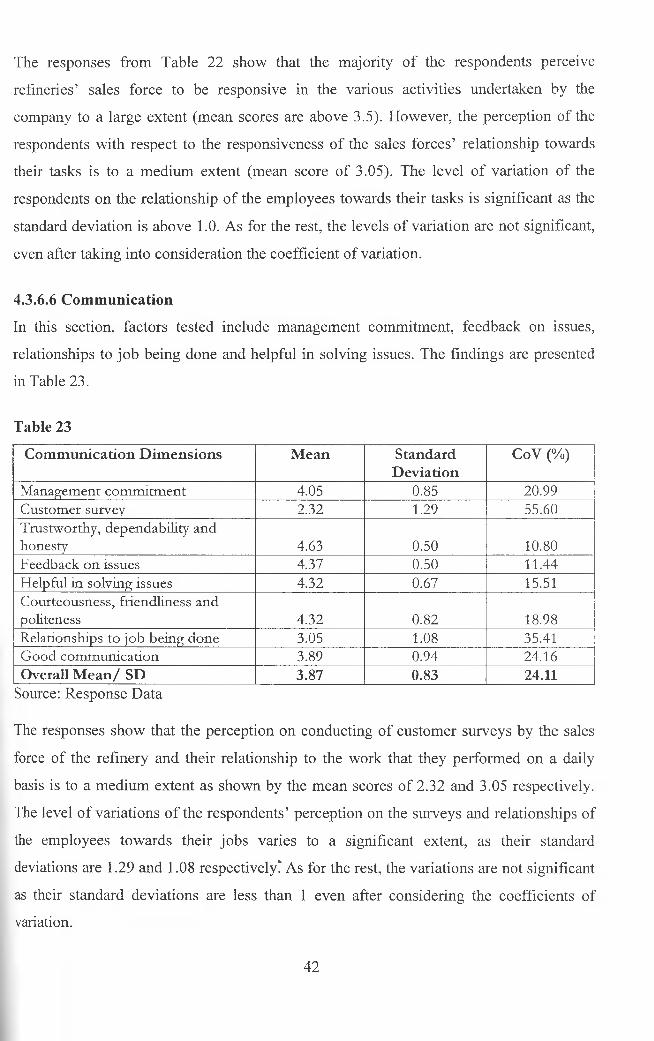
The responses from Table 22 show that the majority of the respondents perceive
refineries’ sales force to be responsive in the various activities undertaken by the
company to a large extent (mean scores are above 3.5). However, the perception of the
respondents with respect to the responsiveness of the sales forces’ relationship towards
their tasks is to a medium extent (mean score of 3.05). The level of variation of the
respondents on the relationship of the employees towards their tasks is significant as the
standard deviation is above 1.0. As for the rest, the levels of variation are not significant,
even after taking into consideration the coefficient of variation.
4.3.6.6 Communication
In this section, factors tested include management commitment, feedback on issues,
relationships to job being done and helpful in solving issues. The findings are presented
in Table 23.
Table 23
Communication Dimensions Mean StandardDeviation
CoV (%)
M anagement com m itm ent 4.05 0.85 20.99Custom er survey 2.32 1.29 55.60Trustworthy, dependability and honesty 4.63 0.50 10.80Feedback on issues 4.37 0.50 11.44Helpful in solving issues 4.32 0.67 15.51Courteousness, friendliness and politeness 4.32 0.82 18.98Relationships to job being done 3.05 1.08 35.41G ood com m unication 3.89 0.94 24.16Overall Mean/ SD 3.87 0.83 24.11
Source: Response Data
The responses show that the perception on conducting of customer surveys by the sales
force of the refinery and their relationship to the work that they performed on a daily
basis is to a medium extent as shown by the mean scores of 2.32 and 3.05 respectively.
The level of variations of the respondents’ perception on the surveys and relationships of
the employees towards their jobs varies to a significant extent, as their standard
deviations are 1.29 and 1.08 respectively) As for the rest, the variations are not significant
as their standard deviations are less than 1 even after considering the coefficients of
variation.
42
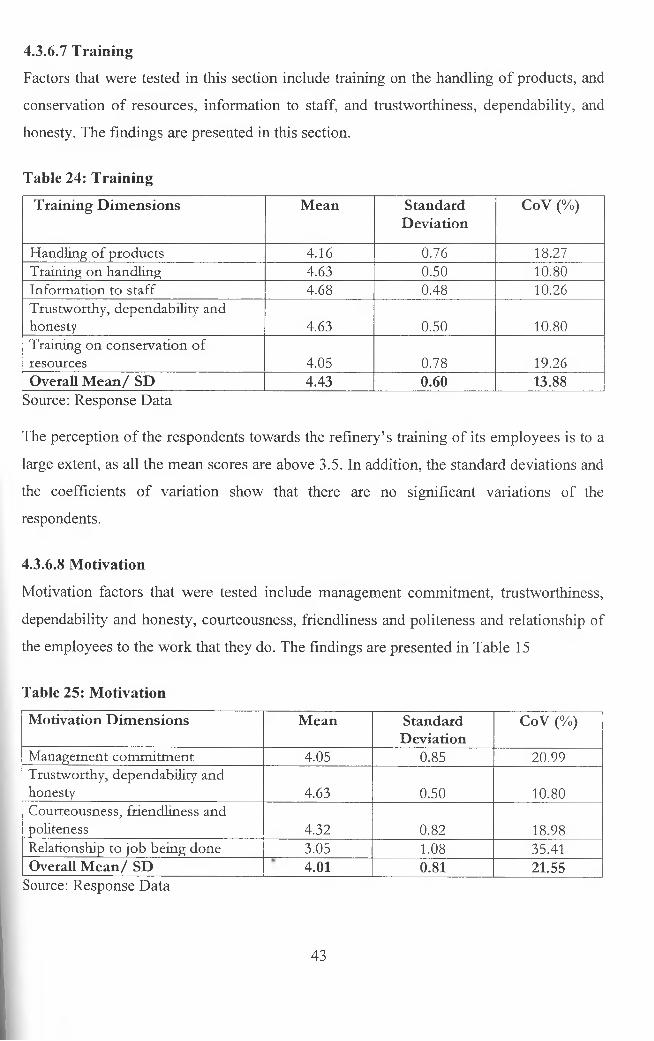
4.3.6.7 Training
Factors that were tested in this section include training on the handling of products, and
conservation of resources, information to staff, and trustworthiness, dependability, and
honesty. The findings are presented in this section.
Table 24: Training
Training Dimensions Mean StandardDeviation
CoV (%)
Handling o f products 4.16 0.76 18.27Training on handling 4.63 0.50 10.80Inform ation to staff 4.68 0.48 10.26Trustworthy, dependability and honesty 4.63 0.50 10.80Training on conservation o f resources 4.05 0.78 19.26Overall Mean/ SD 4.43 0.60 13.88
Source: Response Data
The perception of the respondents towards the refinery’s training of its employees is to a
large extent, as all the mean scores are above 3.5. In addition, the standard deviations and
the coefficients of variation show that there are no significant variations of the
respondents.
4.3.6.8 Motivation
Motivation factors that were tested include management commitment, trustworthiness,
dependability and honesty, courteousness, friendliness and politeness and relationship of
the employees to the work that they do. The findings are presented in Table 15
Table 25: Motivation
Motivation Dimensions Mean StandardDeviation
CoV (%)
M anagement com m itm ent 4.05 0.85 20.99Trustworthy, dependability and honesty 4.63 0.50 10.80Courteousness, friendliness and politeness 4.32 0.82 18.98Relationship to job being done 3.05 1.08 35.41Overall Mean/ SD 4.01 0.81 21.55
Source: Response Data
43
It is shown from Table 25 the respondents perceive the relationship of the sales
employees towards the relationship to job being done to a medium extent (its mean score
is 3.05). The rest of the dimensions are perceived to a large extent. The only aspect that
has a significant level of variation is on the relationship of the sales force towards their
jobs (the standard deviation is 1.08). The rest of the variations are not significant. Also,
the coefficients of variation show that the level of variation of the respondents’
perception is not significant.
4.4 Summary of the perception of the management of Oil Marketing Companies
towards the adoption of Green Marketing practices by the Kenya Petroleum
Refineries.
In this section, the averages for the mean, standard deviations and the coefficients of
variation for each variable is compiled in order to give an overall perception of the
characteristics of the Management of the Oil Marketing Companies towards the adoption
of Green Marketing practises by the Kenya Petroleum Refineries. Findings which are
represented in Table 26 show that the marketing mix variables of price and promotion are
perceived by the respondents in the price settings and corporate activities to a medium
extent. Their mean scores are 3.25 and 3.26 respectively. There are no significant
variations on the responses of the respondents as the standard deviations and coefficients
of variation are less than 1 and 50% respectively. On the other hand, products,
distribution, process management and sales force are perceived by the respondents to a
large extent.
In overall, the findings show that from the average mean score of the dimensions, the
respondents perceive the refinery in practicing green marketing to a large extent (the
average mean score is 4.04) and the level of variations of the respondents is not significant.
44
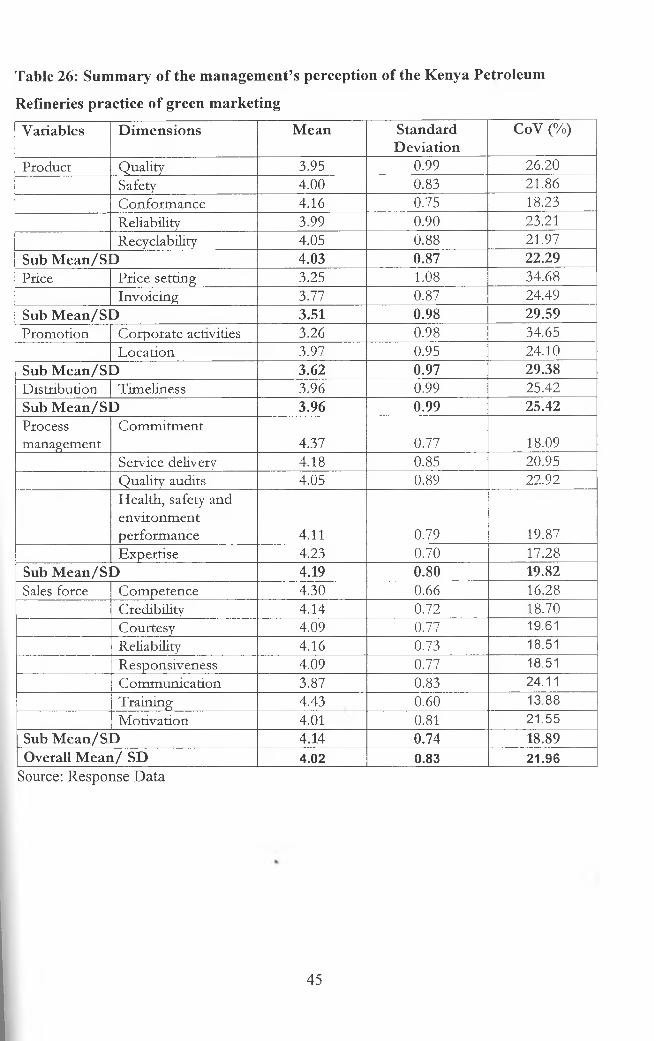
Table 26: Summary of the management’s perception of the Kenya Petroleum
Refineries practice of green marketing
Variables Dimensions Mean StandardDeviation
CoV (%)
Product Quality 3.95 0.99 26.20Safety 4.00 0.83 21.86C onform ance 4.16 0.75 18.23Reliability 3.99 0.90 23.21Recyclability 4.05 0.88 21.97
Sub Mean/S D 4.03 0.87 22.29Price Price setting 3.25 1.08 34.68
Invoicing 3.77 0.87 24.49Sub Mean/S D 3.51 0.98 29.59Prom otion C orporate activities 3.26 0.98 34.65
Location 3.97 0.95 24.10Sub Mean/S D 3.62 0.97 29.38Distribution Timeliness 3.96 0.99 25.42Sub Mean/S D 3.96 0.99 25.42Processm anagement
C om m itm ent4.37 0.77 18.09
Service delivery 4.18 0.85 20.95Quality audits 4.05 0.89 22.92H ealth, safety andenvironm entperform ance 4.11 0.79 19.87Expertise 4.23 0.70 17.28
Sub Mean/S D 4.19 0.80 19.82Sales force Com petence 4.30 0.66 16.28
Credibility 4.14 0.72 18.70Courtesy 4.09 0.77 19.61Reliability 4.16 0.73 18.51Responsiveness 4.09 0.77 18.51Com m unication 3.87 0.83 24.11Training 4.43 0.60 13.88M otivation 4.01 0.81 21.55
Sub Mean/S D 4.14 0.74 18.89Overall Mean/ SD 4.02 0.83 21.96
Source: Response Data
45

CHAPTER FIVE
DISCUSSION, CONCLUSION AND RECOMMENDATIONS
5.1 Introduction
The study sought to determine the perception of the management of the oil marketing
companies in Kenya towards the adoption of green marketing practices by the Kenya
Petroleum Refineries. After having analysed the findings, discussions, conclusions and
recommendations were presented in this chapter.
5.2 Discussion
The influence of environmental issues in today’s world can not be ignored (Walley,
Custance and Parsons, 2000). For firms to take advantage of this and be competitive,
businesses have to re-adjust their operations to accommodate this development. Many
countries, organizations and individuals have raised concerns on the effects of fossil fuels
on global warming, and currently the oil industry faces a major challenge in coming up
with better processes that lead to less harm on the environment (Sharma, 2000).
The research had the objective of determining the perception of the management of oil
marketing companies towards green marketing practices by the Kenya Petroleum
Refineries. In order for this objective to be achieved, semi-structured questionnaires were
sent to the respondents. The questionnaires were divided into two parts, part one was to
get information on the demographic profile of the Oil Marketing firms and part two was
to get the perception of the management of the oil marketing companies towards the
adoption of green marketing practises by the refinery, through a 5-point likert scale. The
questionnaires were sent to 32 Oil Marketing companies and only 19 of them were
returned. This represented a response rate of 59.38%
It was observed from the findings that 68.42% of the firms were wholly locally owned
while 31.58% were wholly foreign owned. In addition, 78.95% of the firms were less
than 20 years old.The findings were important as they show that many indigenous
Kenyans took the opportunity of the partial liberalization of the petroleum industry in
1994 to form local Oil Marketing Companies for trading. On the process, many people
were employed in the sector where they have now gained a lot of experience and are
better placed to give their opinion towards the research.
46
The finding on the product and price variables show that more needed to be done on the
refining processes. For example, when compared to imports the respondents’ perception
was that products from the refinery costed more than imports. This was so because the
refinery was perceived to be charging a high processing fee, with little profit margin
being realised by the firms due to the high crude oil prices currently experienced in the
world petroleum market (Petroleum Insight, 2006). Moreover, the refining processes
releases toxics to the atmosphere that led to the suffering of the environment to a medium
extent, seen from the mean scores of 3.26 and 3.42. The refinery therefore has to address
this concern for it to be competitive and not be perceived as being socially irresponsible
(Global Market Insight, 2006).
Promotion and distribution variables were also tested and the findings show that for the
refinery to be a good corporate citizen, it needs to re-evaluate itself on participating on
worthy causes. On this aspect, the average mean score was 2.95. From this, the refinery
as an organization has to improve on its image by paying back to the society what it owes
them. This could be achieved through the use of surveys to know how it is faring in the
provision of services to its customers of which it is currently poor at.
It had been argued in the past that where and when one needed the products or services to
be available, this had a very significant impact on the customers that the business
attracted (EPA, 2007). The refinery’s location was perceived by the respondents to be
better for business as the findings show that the perception was to a large extent as the
mean score was 3.97. In addition, the respondents’ perception on the suitability or
appropriateness of the refinery in the refining activities was to a large extent.
The process managements’ finding show that the company was rated highly in green
marketing practices. This was in agreement with the literature that argued that
environmental concerns were reshaping the way the businesses people were conducting
their businesses (Menon, Chowdhury, Jankovich, 1990). Flowever, one area that had not
been perceived positively was on the release of toxics to the environment with
respondents arguing that the company needed to improve on that aspect (mean score was
3.05). In addition, there was a need for the firm to find out why the respondents’
perception on the employee relationship with the tasks they performed was average. This
47
will help the company to put in retention structures for the company to avoid poaching by
competitors.
Findings from the sales force indicated that the sales force was perceived to be
competent, courteous reliable and credible in carrying out their tasks to a large extent, as
shown by the mean scores of above 3.5 and standard deviations of less than one.
In general, the respondents’ perception on KPRL’s adoption of green marketing practises
was to a large extent and this was in agreement with studies done in other sectors by
Obuya (2003) and Kiongera (2003).
5.3 Conclusion
The findings from the study revealed that with pressure from the parliament and other
organizations, businesspeople could re-shape their entities to take advantages of new
developments in the business world for the better. As businesses are now becoming more
competitive, those ones that do not recognise this development are likely to loose out. In
addition, the management of any company must put in place structures that support green
marketing practises for the success of the firm. As information nowadays is readily
available, customers have now become conscious of what they would like to have thus
forcing many companies to change their strategies so as to attract more customers.
From the research, findings show that the Kenya Petroleum Refineries had put in
mechanisms that help check on the environment and hence making it to be perceived as
practicing green marketing. The company has invested heavily on its employees who
were perceived to be well trained in their areas of specialization and above all, there was
management support in all the activities that take place. The location also adds to the
advantage of the firm as it is able to do business with its customers better.
5.4 Recommendations
The major challenge facing the company was on corporate social responsibility.
Respondents’ perception on this area was that the company was not doing enough to give
back to the society. It is therefore wise if the management reconsidered its attitude
towards the society.
48
Another challenge was on pricing. Many organizations felt that they were being exploited
when they refined at the company. Their suggestion was for the refinery to lower its
processing fee charges for them to increase their processing. The company need to take
up this challenge by trying to find out the real issues raised by the marketers with the
possibility of lowering the processing fee.
LIMITATIONS OF THE STUDY
The major limitation to the study was that it was done only for the Kenya Petroleum
Refineries despite the fact that there are many registered oil marketing companies
operating in the countries’ oil industry.
SUGGESTIONS FOR FURTHER RESEARCH
i. The study was limited to the Kenya Petroleum Refinery and was to determine the
perception of only those oil marketing companies that had signed a processing
agreement with the firm. However, there are other petroleum marketing companies in
the industry that do not have a refining contract with the Kenya Petroleum Refineries.
A similar research that would include all the oil marketing companies in Kenya could
be done to determine if they were perceived to be practising green marketing.
ii. There are other companies that do business with the refinery and were not involved in
the initial study. Examples of these include companies in the maintenance, information
technology, catering and the utilities. It would be a very good idea if a study was to be
carried out that would include them.
49
REFERENCES
American Wind Energy Association, (1996), Wind energy policy, transmission &
regulation Principles of Green Marketing. Adopted By the Board of Directors
of the American Wind Energy Association
Ansoff, H. (1990), Implementing Strategic Management, Practice Hall, Cambridge,
United Kingdom
Attenborough, D; Williams, C. (1984), The Living Planet, London, page 307
Barlon, K. (2006), The concept of the marketing mix: Presentation on marketing
management, vol 1, September, Oulu University -Finland
Baron, D. P. (1995), “Integrated strategy: markets and non-market components.”
California Management Review 37: 47-65
Boyd, H. Westfall, R. and Stasch, S. F. (2004), Marketing Research: Text and
Cases. Irwin, Inc, Seventh Edition.
Bradley, (1989), “The Green Marketing Mix,” Industrial Marketing Research
Association News, December, pp8-9
Bragd, A. (1998), “Learning from the Introduction of Green Products,” Gothenburg
Research Institute, Sweden
Burges, G. (2007), “California dreaming.” Pure Living, March/April Volume, London
Carson, R. (1962), Silent Spring: Houghton Miffin.
Charter, M. (1992), Greener Marketing: a responsible approach to business.
Sheffield, Greenleaf Publishing.
50
Dawson, L. M, (1969), “The human concept: New philosophy for business,” Business
Horizon, December
Diamond, J. (2005), Collapse: How societies choose to fail or survive. London, Allen
Lane
Donaldson, R. (2005), Marketing Magazine, September
Ehrlich, P. (1968), The Population Bomb: Ballantire Books, London
Environmental Protection Agency, (2007), Green Marketing: The Competitive
Advantage of Sustainability. Queensland Government, Australia
Fang, J. and Kiang, C. (September, 2006), “China’s environment: challenges and
solutions.” Environmental Society of America
Frain, J. (1986), Marketing and Society, Law and Tomorrow: Pitman, UK, Page 474
Frankfort-Nachmias, C. and Nachmias, D. (1996), Research Methods in the Social
Sciences, 5th Edition. Arnold.
Galbraith, J. K. (1958), The Affluent Society: Boston Stongthom Mifflin, page 255
Ginsberg, J.M. & Bloom, P.N. (2004). “Choosing the Right Green-Marketing
Strategy.” MIT Sloan Management Review, 46(1), pp. 79-88.
Greyser, S. A., Diamond, S. L. (1974), “Business is Adopting to Consumerism in
Marketing Management,” Harvard Business Review, 1974 page 66
Flenion, K. and Kinner, T. C. (1976b), “Ecological Marketing” American Marketing
Association
Jacoby, N. H. (1973), Corporate Power and Social Responsibility, Page 207,
209/210
51

Kotler, P. (1987), “Marketing Milestones of Four Decades: Reviewed.” American
Marketing Associations, September
Kotler, P. and Keller, L. (2005), Marketing Management, Prentice Hall
Kotler, P. and Gay, A. (2004), Principles of Marketing, 10th Edition. Prentice-Hall
Kiongera, F. (2003), An unpublished MBA project on ‘Green Marketing practices in
the Cement Industry in Kenya,’ a project of the University of Nairobi.
Menon, A., Menon, A., Chowdhury, J., & Jankovich, J. (1999), “Evolving Paradigm for
Environmental Sensitivity in Marketing Programs: A Synthesis of Theory and
Practice.” Journal of Marketing Theory and Practice, 7(2), Spring, pp. 1-15.
Nagata, S., and Okuda, S. (2005), Green process aiming at reduction of
environmental burden, Fujitsu
Obuya, E. N. (2003), an unpublished MBA project on ‘Determining the extent to
which manufacturing firms in Nairobi practice Green Marketing,’ a project
of the University of Nairobi
Omoding, I., (2006), “Kenya launches unleaded extra”. Procurement News, April
volume 1 Issue 9.
Organization for Economic Co-operation and Development, (1998), “Towards
sustainable consumption patterns: A progress report on member country init
-itiatives.” Paris: Organization for Economic Co-operation and Development
Ottman, J. A. (1993), Green marketing: Challenges and opportunities. Lincolnwood,
IL: NTC Business Books
52
Ottman, J. A. and Terry, V. (1998), “Strategic Marketing of Greener Products”. The
Journal of Sustainable Product Design, April 5.
Ottman, J. A (2002), “The Real News about Green Marketing: Yesterday, Today,
Tomorrow.” Environmental News Network March 28
Petroleum Insight, (2006), Petroleum Refining Explained, Petroleum Insight, 2nd
Quarter, page 12
Rhynes, D. (2006), “African Refineries Association Is Formed”. Petroleum Insight,
2nd Quarter, page 19
Polonsky, M. J. (1994a), “Green Marketing Regulations in the USA and Australia:
The Australian Checklist.” Marketing Greener Management International,
5:44-53
Reuters, (2006), “Fuel rules a headache for Africa”. Daily Nation, 24th March
Rothe, J. T. and Benson, L. (1974), “Intelligent Consumption: An Attractive
Alternative to the Marketing Concept”. MSU Business Topics
Schiffman, L. and Kanuk, L, (2004), Consumer Behaviour, Prentice-Hall of India.
Simbeck , D. (2004), “Key Roll of Gasification in the “Green Refinery.” Proceedings of
the Gasification Technologies Conference October 4, 2004 Washington, D. C
Simintiras, A. C., Schlegelmilch, B. B. A and Diamantopoulos, A. (May 1993),
“Greening the marketing mix: a review of the literature and an agenda for future
research.” Marketing for the New Europe: Dealing with Complexity,
Proceedings of the 22nd Annual Conference of the European Marketing
Academy, Barcelona, Volume No. 2.
53
Stanton, W. (1981), Fundamentals of Marketing: International Students Edition,
6th Edition J., Me Grow Hill, Kogakusho, Japan, page 3
Stanton, W. and Farrell, C. (1987), Fundamentals of Marketing: 8th Edition, New
York: McGraw-Hill Book Company.
Steuart, B. (1978), Psychological Principals of Marketing and Consumer Behavior,
Lexington Books Massachusetts Toronto, Chapter 1 and 18
Stuart, H. (1997), “Beyond Greening: Strategies for a sustainable world”. Harvard
Business Review, Jan-Feb, pp 66-76.
Walley, K., Custance, P. & Parsons, S. (2000), “UK Consumer Attitudes Concerning
Environmental Issues Impacting the Agrifood Industry.” Business Strategy
and the Environment, 9(6), pp. 355-366.
Westing, J. H. and Albaum, G. (1975), Modern Marketing Thought: 3rd Edition,
Macmillan Publishing Company Inc.
54
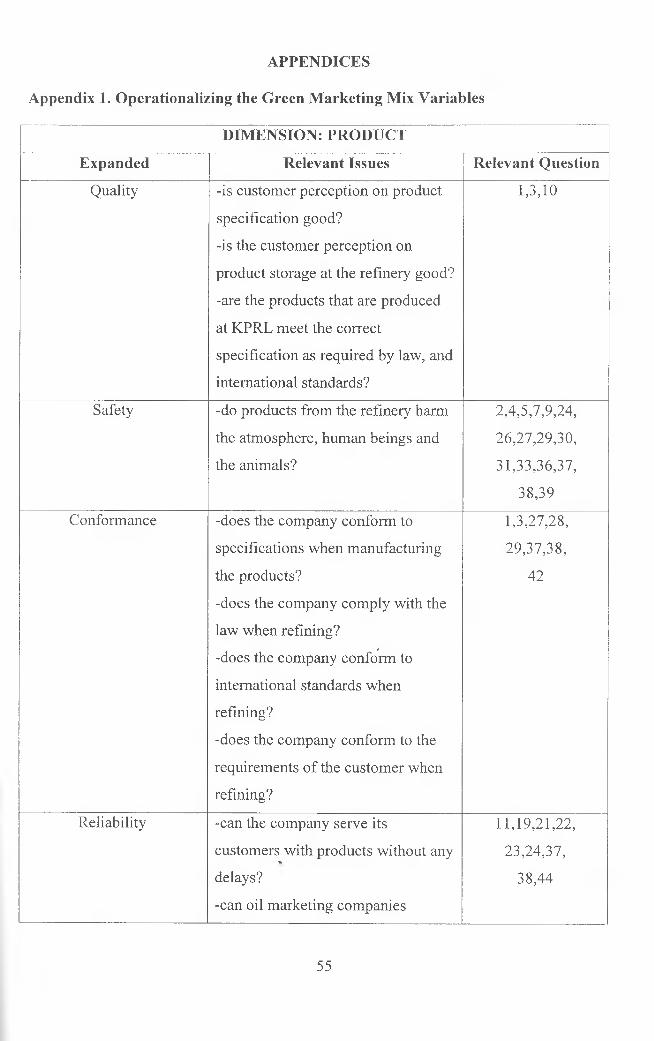
APPENDICES
Appendix 1. Operationalizing the Green Marketing Mix Variables
DIMENSION: PRODUCT
Expanded Relevant Issues Relevant Question
Quality -is customer perception on product
specification good?
-is the customer perception on
product storage at the refinery good?
-are the products that are produced
at KPRL meet the correct
specification as required by law, and
international standards?
1,3,10
Safety -do products from the refinery harm 2,4,5,7,9,24,
the atmosphere, human beings and 26,27,29,30,
the animals? 31,33,36,37,
38,39
Conformance -does the company conform to 1,3,27,28,
specifications when manufacturing 29,37,38,
the products?
-does the company comply with the
law when refining?i
-does the company conform to
international standards when
refining?
-does the company conform to the
requirements of the customer when
refining?
42
Reliability -can the company serve its 11,19,21,22,
customers with products without any *» 23,24,37,delays?
-can oil marketing companies
38,44
55
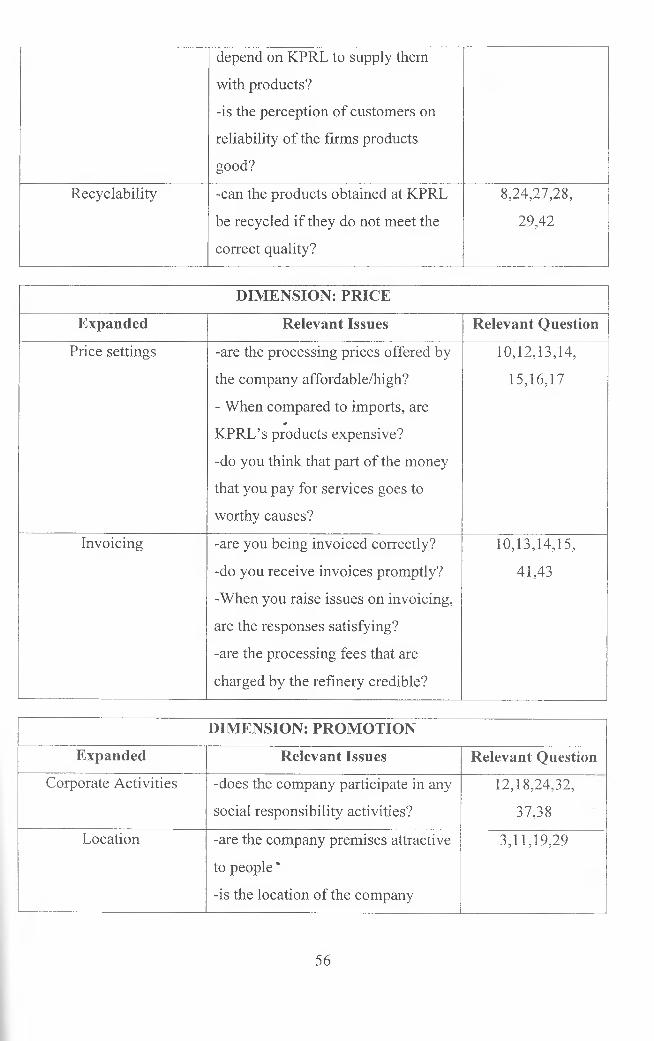
depend on KPRL to supply them
with products?
-is the perception of customers on
reliability of the firms products
good?
Recyclability -can the products obtained at KPRL
be recycled if they do not meet the
correct quality?
8,24,27,28,
29,42
DIMENSION: PRICE
Expanded Relevant Issues Relevant Question
Price settings -are the processing prices offered by
the company affordable/high?
- When compared to imports, are *
KPRL’s products expensive?
-do you think that part of the money
that you pay for services goes to
worthy causes?
10,12,13,14,
15,16,17
Invoicing -are you being invoiced correctly?
-do you receive invoices promptly?
-When you raise issues on invoicing,
are the responses satisfying?
-are the processing fees that are
charged by the refinery credible?
10,13,14,15,
41,43
DIMENSION: PROMOTION
Expanded Relevant Issues Relevant Question
Corporate Activities -does the company participate in any
social responsibility activities?
12,18,24,32,
37,38
Location -are the company premises attractive
to people ‘
-is the location of the company
3,11,19,29
56

convenient for doing business?
-are its facilities portraying the good
image of the company?
DIMENSION: DISTRIBUTION
Expanded Relevant Issues Relevant Question
Timeliness -can the products from the refinery
be maintained on spec for a long
time before their delivery to the oil
marketing companies?
-are the products delivered when
planned?
3,11,21,
22,23
DIMENSION: PROCESS MANAGEMENT
Expanded Relevant Issues Relevant Question
Commitment -is the management committed to
the task of refining?
-is the staff committed to the work
they perform?
24,31,33,
38,44
Service delivery -are KPRL offices easily accessible
to customers?
-are customers always briefed before
any activities take place?
-is staff at the refinery trustworthy
and honest?
-is the service delivery done in time?
11,19,21,38,
40,44
Quality audits -are health, safety and environment
audits usually done on a regular
basis?
-are the processes usually being
monitored to correct any deviations?
1,3,8,10,24,
26,27,29,31,
33,36,
37,39,
Health, Safety and
Environmental
-does the company have a system in
place to monitor the performance of
2,6,24,26,27,28,
29,30,31,33,36,37,
57

Performance the company in waste management,
pollution, health, safety and the
environment?
-are the employees always checked
if they are fit to work?
Expertise -does the company have the
necessary expertise in its
employment?
-is the staff skilled to carry out their
tasks?
-are staff equipped with the
necessary emergency skills?
24,29,30,33,
38,40,42,43,45
DIMENSION: SALES FORCE
Expanded Relevant Issues Relevant Question
Competence -is the staff competent on the type of
work they are performing?
-do KPRL employees solve issues/
complaints very fast?
24,30,33,38,
39,40,41,43,45
Credibility -is there trust between KPRL staff
and its customers?
-are transactions done by the
employees supported by honesty
24,38,40,43,45
Courtesy -do employees respect customers
when solving complaints?
-are employees respectful when
visiting customers?
-are employees friendly when
interfacing with customers?
24,40,41,
43,44,45,46
Reliability -can employees be relied upon when
there is a problem?
-is work between KPRL employees
24,38,40,41,
43,44,45,46
58
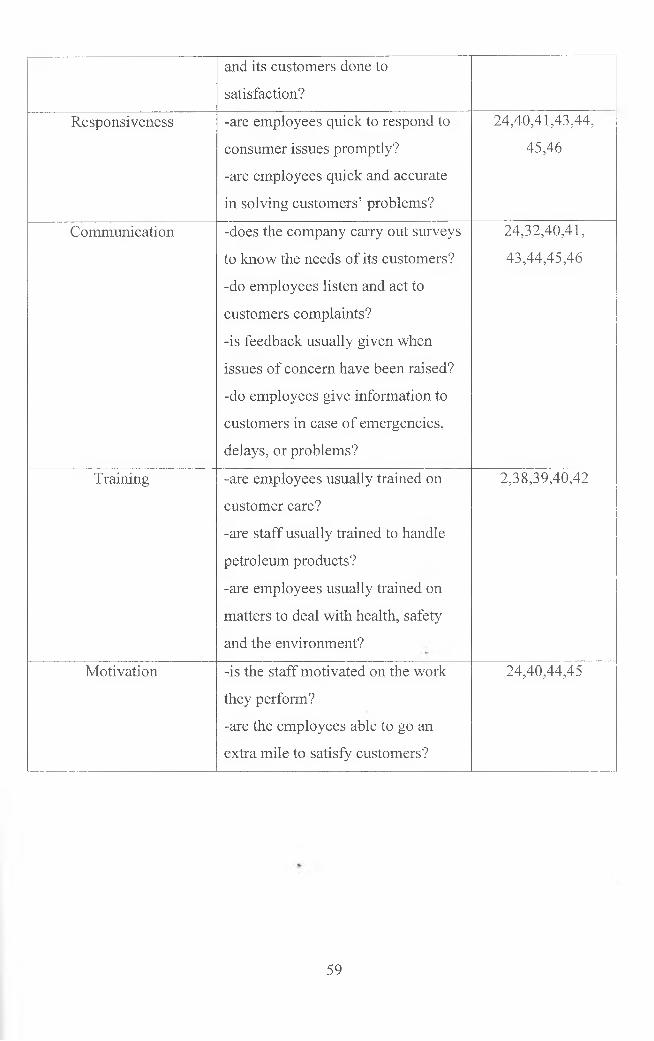
and its customers done to
satisfaction?
Responsiveness -are employees quick to respond to
consumer issues promptly?
-are employees quick and accurate
in solving customers’ problems?
24,40,41,43,44,
45,46
Communication -does the company carry out surveys
to know the needs of its customers?
-do employees listen and act to
customers complaints?
-is feedback usually given when
issues of concern have been raised?
-do employees give information to
customers in case of emergencies,
delays, or problems?
24,32,40,41,
43,44,45,46
Training -are employees usually trained on
customer care?
-are staff usually trained to handle
petroleum products?
-are employees usually trained on
matters to deal with health, safety
and the environment?
2,38,39,40,42
Motivation -is the staff motivated on the work
they perform?
-are the employees able to go an
extra mile to satisfy customers?
24,40,44,45
59
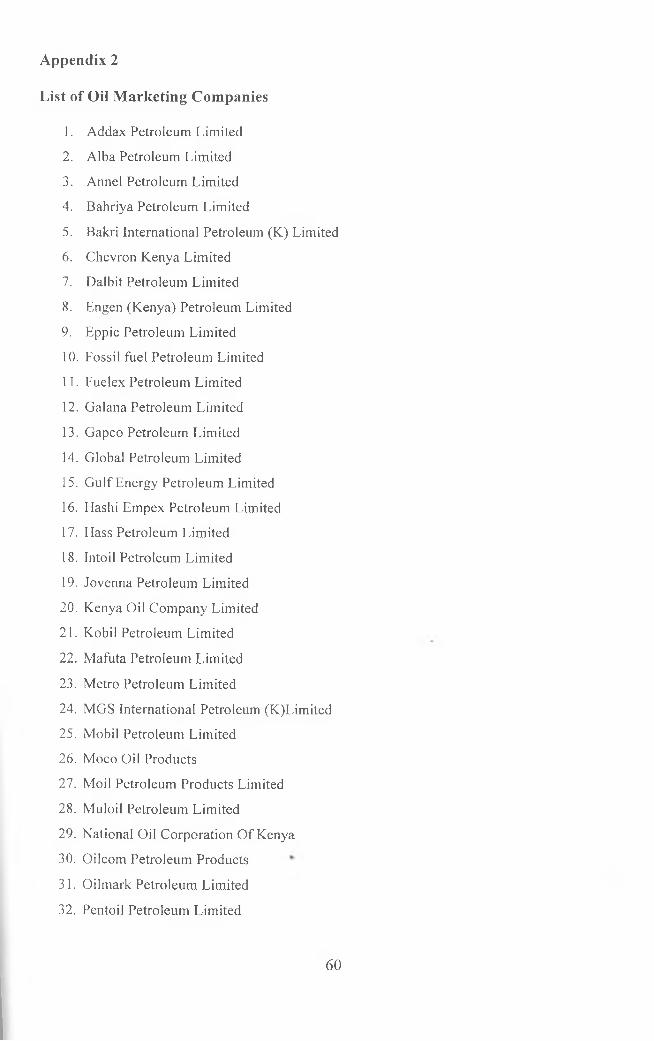
List of Oil Marketing Companies
1. Addax Petroleum Limited
2. Alba Petroleum Limited
3. Annel Petroleum Limited
4. Bahriya Petroleum Limited
5. Bakri International Petroleum (K) Limited
6. Chevron Kenya Limited
7. Dalbit Petroleum Limited
8. Engen (Kenya) Petroleum Limited
9. Eppic Petroleum Limited
10. Fossil fuel Petroleum Limited
11. Fuelex Petroleum Limited
12. Galana Petroleum Limited
13. Gapco Petroleum Limited
14. Global Petroleum Limited
15. Gulf Energy Petroleum Limited
16. Hashi Empex Petroleum Limited
17. Hass Petroleum Limited
18. Intoil Petroleum Limited
19. Jovenna Petroleum Limited
20. Kenya Oil Company Limited
21. Kobil Petroleum Limited
22. Mafuta Petroleum Limited
23. Metro Petroleum Limited
24. MGS International Petroleum (K)Limited
25. Mobil Petroleum Limited
26. Moco Oil Products
27. Moil Petroleum Products Limited
28. Muloil Petroleum Limited
29. National Oil Corporation Of Kenya
30. Oilcom Petroleum Products
31. Oilmark Petroleum Limited
32. Pentoil Petroleum Limited
Appendix 2
60

33. Petro Petroleum Limited
34. Riva Oil Products Limited
35. Royal Petroleum Limited
36. Shell Kenya Limited
37. Southwest Petroleum Limited
38. Tecaflex Petroleum Limited
39. Total Kenya Limited
40. Transoil Petroleum Limited
41. Triton Petroleum Limited
42. Vitol Petroleum Limited
Source, Kenya Petroleum Refineries Limited Hydrocarbon Entitlement Statement For April 2007
61
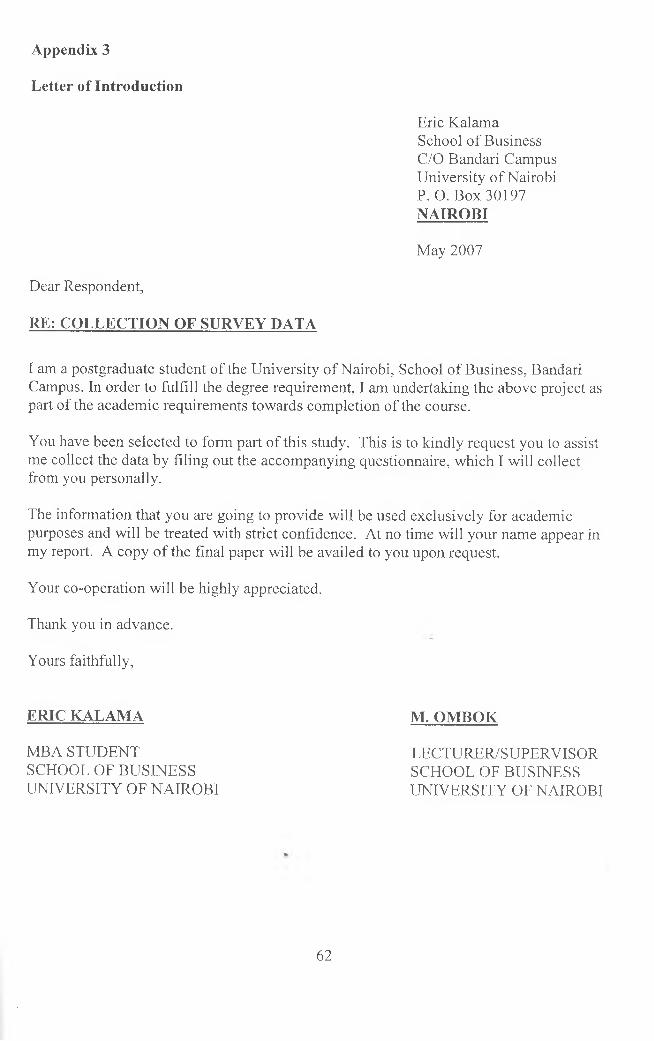
Appendix 3
Letter of Introduction
Eric Kalama School of Business C/O Bandari Campus University of NairobiP. O. Box 30197 NAIROBI
May 2007
Dear Respondent,
RE: COLLECTION OF SURVEY DATA
I am a postgraduate student of the University of Nairobi, School of Business, Bandari Campus. In order to fulfill the degree requirement, I am undertaking the above project as part of the academic requirements towards completion of the course.
You have been selected to form part of this study. This is to kindly request you to assist me collect the data by filing out the accompanying questionnaire, which I will collect from you personally.
The information that you are going to provide will be used exclusively for academic purposes and will be treated with strict confidence. At no time will your name appear in my report. A copy of the final paper will be availed to you upon request.
Your co-operation will be highly appreciated.
Thank you in advance.
Yours faithfully,
ERIC KALAMA M. OMBOK
MBA STUDENT SCHOOL OF BUSINESS UNIVERSITY OF NAIROBI
LECTURER/SUPERVISOR SCHOOL OF BUSINESS UNIVERSITY OF NAIROBI
62
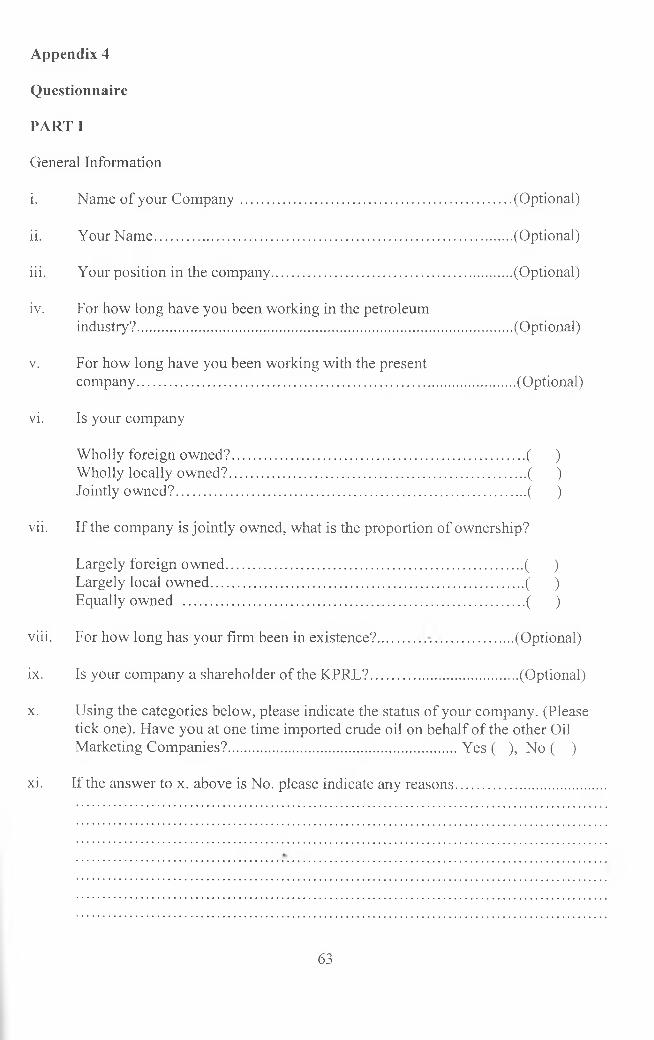
Questionnaire
PARTI
General Information
i. Name of your Company..................................................................... (Optional)
ii. Your Name.......................................................................................... (Optional)
iii. Your position in the company............................................................. (Optional)
iv. For how long have you been working in the petroleumindustry?...............................................................................................(Optional)
v. For how long have you been working with the presentcompany...............................................................................................(Optional)
vi. Is your company
Wholly foreign owned?.......................................................................... ( )Wholly locally owned?........................................................................... ( )Jointly owned?....................................................................................... ( )
vii. If the company is jointly owned, what is the proportion of ownership?
Largely foreign owned............................................................................( )Largely local owned................................................................................( )Equally owned ..................................................................................... ( )
viii. For how long has your firm been in existence?........................ (Optional)
ix. Is your company a shareholder of the KPRL?.................................... (Optional)
x. Using the categories below, please indicate the status of your company. (Pleasetick one). Have you at one time imported crude oil on behalf of the other Oil Marketing Companies?.........................................................Yes ( ), No ( )
xi. If the answer to x. above is No. please indicate any reasons.................................
Appendix 4
63
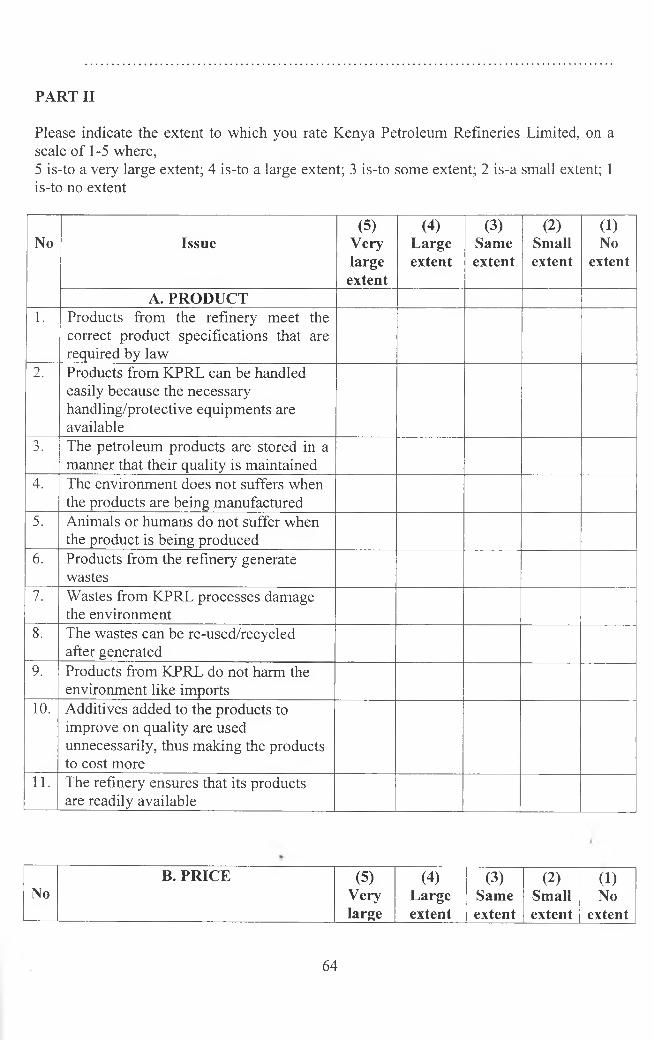
PART II
Please indicate the extent to which you rate Kenya Petroleum Refineries Limited, on a scale of 1 -5 where,5 is-to a very large extent; 4 is-to a large extent; 3 is-to some extent; 2 is-a small extent; 1 is-to no extent
No Issue(5)
Verylargeextent
(4)Largeextent
(3)Sameextent
(2)Smallextent
(1)No
extent
A. PRODUCT1 . Products from the refinery meet the
correct product specifications that are required by law
2. Products from KPRL can be handled easily because the necessary handling/protective equipments are available
3. The petroleum products are stored in a manner that their quality is maintained
4. The environment does not suffers when the products are being manufactured
5. Animals or humans do not suffer when the product is being produced
6. Products from the refinery generate wastes
7. Wastes from KPRL processes damage the environment
8. The wastes can be re-used/recycled after generated
9. Products from KPRL do not harm the environment like imports
10. Additives added to the products to improve on quality are used unnecessarily, thus making the products to cost more
11. The refinery ensures that its products are readily available
B. PRICE (5) (4) (3) (2) (1)No Very Large Same Small No
large extent extent extent extent
64
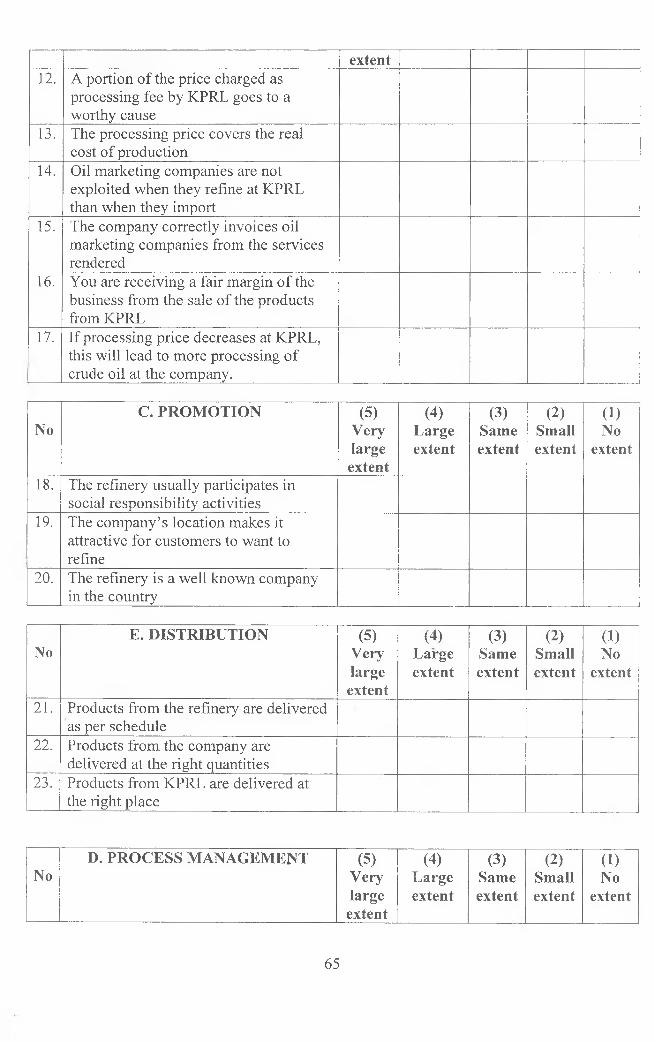
extent12. A portion of the price charged as
processing fee by KPRL goes to a worthy cause
13. The processing price covers the real cost of production
14. Oil marketing companies are not exploited when they refine at KPRL than when they import
15. The company correctly invoices oil marketing companies from the services rendered
16. You are receiving a fair margin of the business from the sale of the products from KPRL
17. If processing price decreases at KPRL, this will lead to more processing of crude oil at the company.
NoC. PROMOTION (5)
Verylarge
extent
(4)Largeextent
(3)Sameextent
(2)Smallextent
(1)No
extent
18. The refinery usually participates in social responsibility activities
19. The company’s location makes it attractive for customers to want to refine
20. The refinery is a well known company in the country
NoE. DISTRIBUTION (5)
Verylargeextent
(4)Largeextent
(3)Sameextent
(2)Smallextent
(1)No
extent
21. Products from the refinery are delivered as per schedule
22. Products from the company are delivered at the right quantities
23. Products from KPRL are delivered at the right place
D. PROCESS MANAGEMENT (5) (4) (3) (2) (1)No Very Large Same Small No
largeextent
extent extent extent extent
65
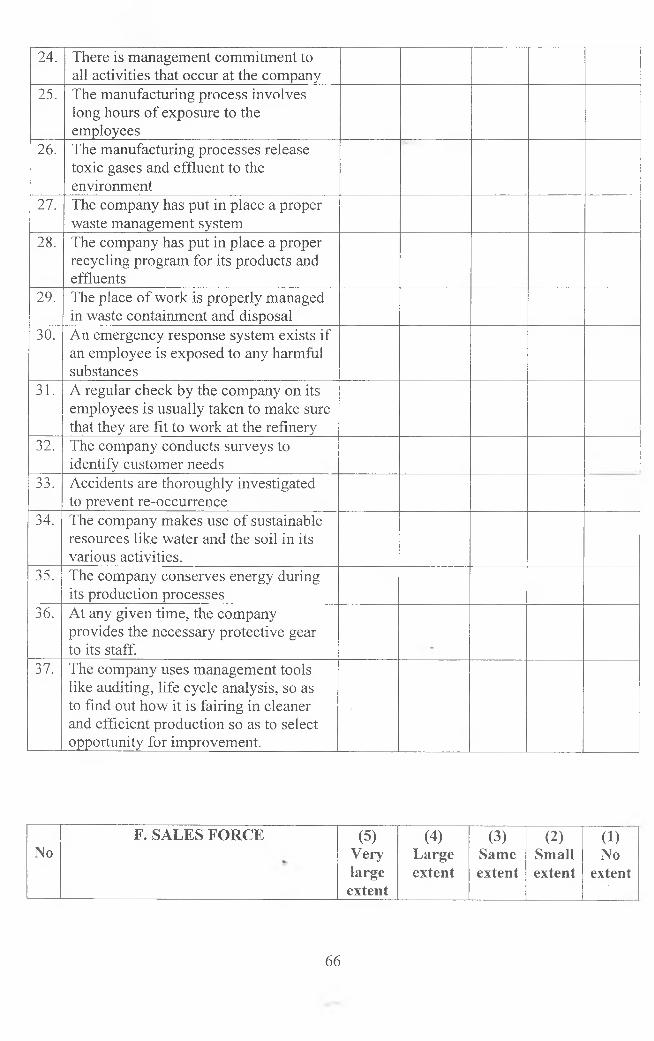
24. There is management commitment to all activities that occur at the company
25. The manufacturing process involves long hours of exposure to the employees
26. The manufacturing processes release toxic gases and effluent to the environment
27. The company has put in place a proper waste management system
28. The company has put in place a proper recycling program for its products and effluents
29. The place of work is properly managed in waste containment and disposal
30. An emergency response system exists if an employee is exposed to any harmful substances
31. A regular check by the company on its employees is usually taken to make sure that they are fit to work at the refinery
32. The company conducts surveys to identify customer needs
33. Accidents are thoroughly investigated to prevent re-occurrence
34. The company makes use of sustainable resources like water and the soil in its various activities.
35. The company conserves energy during its production processes
36. At any given time, the company provides the necessary protective gear to its staff.
37. The company uses management tools like auditing, life cycle analysis, so as to find out how it is fairing in cleaner and efficient production so as to select opportunity for improvement.
F. SALES FORCE (5) (4) (3) (2) (1)No Very Large Same Small No
large extent extent extent extentextent
66
38. Employees at the refinery are well trained to handle petroleum products
39. The staff is well informed on the hazards posed by the products
40. Employees are trust worthy, dependable, and honest when handling products.
41. The KPRL’s staff usually gives feedback to issues raised by the oil marketing companies.
42. The staff is usually trained to avoid wasted resources
43. The employees are helpful in solving customers complaints
44. The employees are courteous, friendly and polite when they serve their customers.
45. Staff is highly motivated on their work
46. Communications by KPRL’s sales force to the oil marketing companies is always good.
Thank you very much for your valuable time.
67
irnr of ft/nmr
Recommended