Global Titanium Dioxide (TiO2) Market: Analysis By Applications
(Paints & coatings, Plastics, Paper & Pulp and Others), By Region, By
Country (2018 Edition): Opportunities and Forecast (2013-2023)
• By Region - North America,
Europe, Asia Pacific and ROW.
• By Country - U.S, Canada, U.K,
Germany, France, India, China,
Japan.
November 2018

Table of Content
S.No Particulars Page No.
1. Research Methodology 16
2. Executive Summary 17
3. Strategic Recommendation 18
3.1 Focus on APAC region 18
4. Titanium Dioxide Product Outlook 19
5. Global Titanium Dioxide Market : Growth and Forecast 24
5.1 Global Titanium Dioxide Market, By Value (2013-2017) (USD Million) 25
5.2 Global Titanium Dioxide Market, By Value (2018-2023) (USD Million) 27
5.3 Global Titanium Dioxide Market, By Volume (2013-2023) (million metric tonnes) 29
6. Global Titanium Dioxide Market : By Applications 34
6.1 Global Titanium Dioxide Market, By Application (Paints & Coatings), By Value (2013-2023) (USD Million) 38
6.2 Global Titanium Dioxide Market, By Application (Plastics), By Value (2013-2023) (USD Million) 41
6.3 Global Titanium Dioxide Market, By Application (Paper & Pulp), By Value (2013-2023) (USD Million) 43
6.4 Global Titanium Dioxide Market, By Application (Other), By Value (2013-2023) (USD Million) 45
7. Global Titanium Dioxide Market : Regional Analysis 46
7.1 Global Titanium Dioxide Market Size, By Region : Breakdown (%) 47
7.1.1 Global Titanium Dioxide Market Size, By Region,2017 (%) 48
2

Table of Content
S.No Particulars Page No.
7.2.2 Global Titanium Dioxide Market Size, By Region,2023 (%) 49
8. North America Titanium Dioxide Market : Growth and Forecast 50
8.1 North America Titanium Dioxide Market, By Value (2013-2017) (USD Million) 51
8.2 North America Titanium Dioxide Market, By Value (2018-2023) (USD Million) 52
8.2.1 North America Titanium Dioxide Market, By Applications, By Value (2013-2017) (USD Million) 57
8.2.2 North America Titanium Dioxide Market, By Applications, By Value (2018-2023) (USD Million) 58
8.3 North America Titanium Dioxide Market: Country Analysis (U.S & Canada) 61
8.3.1 U.S Titanium Dioxide, By Value , (2013-2023) (USD Million) 62
8.3.2 U.S Titanium Dioxide Market, By Application, By Value , (2013-2017) (USD Million) 65
8.3.3 U.S Titanium Dioxide Market, By Application, By Value, (2018-2023) (USD Million) 67
8.3.4 Canada Titanium Dioxide, By Value , (2013-2023) (USD Million) 69
8.3.5 Canada Titanium Dioxide Market, By Application, By Value , (2013-2017) (USD Million) 72
8.3.6 Canada Titanium Dioxide Market, By Application, By Value, (2018-2023) (USD Million) 75
9. Europe Titanium Dioxide Market : Growth and Forecast 76
9.1 Europe Titanium Dioxide Market, By Value (2013-2017) (USD Million) 77
9.2 Europe Titanium Dioxide Market, By Value (2018-2023) (USD Million) 78
9.2.1 Europe Titanium Dioxide Market, By Applications, By Value (2013-2017) (USD Million) 86
9.2.2 Europe Titanium Dioxide Market, By Applications, By Value (2018-2023) (USD Million) 90
9.3 Europe Titanium Dioxide Market: Country Analysis ( Germany, U.K, France, Rest of Europe) 91
3
Table of Content
S.No Particulars Page No.
9.3.1 Germany Titanium Dioxide, By Value , (2013-2023) (USD Million) 93
9.3.2 Germany Titanium Dioxide Market, By Application, By Value , (2013-2017) (USD Million) 96
9.3.3 Germany Titanium Dioxide Market, By Application, By Value, (2018-2023) (USD Million) 99
9.3.4 U.K Titanium Dioxide, By Value , (2013-2023) (USD Million) 101
9.3.5 U.K Titanium Dioxide Market, By Application, By Value , (2013-2017) (USD Million) 104
9.3.6 U.K Titanium Dioxide Market, By Application, By Value, (2018-2023) (USD Million) 106
9.3.7 France Titanium Dioxide, By Value , (2013-2023) (USD Million) 108
9.3.8 France Titanium Dioxide Market, By Application, By Value , (2013-2017) (USD Million) 111
9.3.9 France Titanium Dioxide Market, By Application, By Value, (2018-2023) (USD Million) 113
9.3.10 Rest of Europe Titanium Dioxide, By Value , (2013-2023) (USD Million) 115
9.3.11 Rest of Europe Titanium Dioxide Market, By Application, By Value , (2013-2017) (USD Million) 117
9.3.12 Rest of Europe Titanium Dioxide Market, By Application, By Value, (2018-2023) (USD Million) 118
10. APAC Titanium Dioxide Market : Growth and Forecast 119
10.1 APAC Titanium Dioxide Market, By Value (2013-2017) (USD Million) 120
4

Table of Content
S.No Particulars Page No.
10.2 APAC Titanium Dioxide Market, By Value (2018-2023) (USD Million) 121
10.2.1 APAC Titanium Dioxide Market, By Applications, By Value (2013-2017) (USD Million) 128
10.2.2 APAC Titanium Dioxide Market, By Applications, By Value (2018-2023) (USD Million) 129
10.3 APAC Titanium Dioxide Market: Country Analysis ( China, Japan, India, Rest of APAC) 130
10.3.1 China Titanium Dioxide, By Value , (2013-2023) (USD Million) 132
10.3.2 China Titanium Dioxide Market, By Application, By Value , (2013-2017) (USD Million) 135
10.3.3 China Titanium Dioxide Market, By Application, By Value, (2018-2023) (USD Million) 136
10.3.4 Japan Titanium Dioxide, By Value , (2013-2023) (USD Million) 138
10.3.5 Japan Titanium Dioxide Market, By Application, By Value , (2013-2017) (USD Million) 141
10.3.6 Japan Titanium Dioxide Market, By Application, By Value, (2018-2023) (USD Million) 143
10.3.7 India Titanium Dioxide Market, By Value , (2013-2023) (USD Million) 145
10.3.8 India Titanium Dioxide Market, By Application, By Value , (2013-2017) (USD Million) 149
10.3.9 India Titanium Dioxide Market, By Application, By Value, (2018-2023) (USD Million) 150
10.3.10 Rest of APAC Titanium Dioxide Market, By Value , (2013-2023) (USD Million) 152
10.3.11 Rest of APAC Titanium Dioxide Market, By Application, By Value , (2013-2017) (USD Million)
154
10.3.12 Rest of APAC Titanium Dioxide Market, By Application, By Value, (2018-2023) (USD Million) 155
5

Table of Content
S.No Particulars Page No.
11. ROW Titanium Dioxide Market : Growth and Forecast 156
11.1 APAC Titanium Dioxide Market, By Value (2013-2023) (USD Million) 157
11.2 APAC Titanium Dioxide Market, By Application, By Value (2013-2017) (USD Million) 159
11.3 APAC Titanium Dioxide Market, By Application, By Value (2018-2023) (USD Million) 160
12. Global Titanium Dioxide Polymer Market Dynamics 161
12.1 Global Titanium Dioxide Market Drivers 162
12.2 Global Titanium Dioxide Market Challenges 166
12.3 Global Titanium Dioxide Market Trends 179
13. Market Share of leading companies 172
14. Company Profiling 173
14.1 Chemours 174
14.2 Kronos 178
14.3 Tronox 182
14.4 Venator 186
14.5 Argex Titanium Inc. 189
14.6 Lomon Billions 191
15. About Us 193
6
List of Figures
Figure No. Figure Title Page No.
Figure 1: Global Titanium Dioxide Market Size, By Value, forecast 2013-2017 (USD Million) 25
Figure 2: Global Titanium Dioxide Market Size, By Value, Forecast, 2018-2023 (USD Million) 27
Figure 3: Global Titanium Dioxide Market, By Volume, 2013-2023(in million metric tonnes) 29
Figure 4: Total Global TiO2 Industry Demand By Type (%) 31
Figure 5: Venator TiO2 Sales By TiO2 Type (%) 31
Figure 6: Global World Population (in Billions), 2012-2016 32
Figure 7: Growth rate of Global Cosmetic Market, 2013,2017 (In %) 32
Figure 8: Leading Paints & Coatings manufacturers worldwide in 2017 based on revenue (in billion USD) 33
Figure 9: Market value of paints and coatings industry worldwide from 2017 to 2022 (in billion U.S. dollars) 33
Figure 10: Global Titanium Dioxide Market Size, By Applications, 2017 (%) 36
Figure 11: Global Titanium Dioxide Market Size, By Applications, 2023 (%) 37
Figure 12: Global Titanium Dioxide Market, By Applications (Paints & coatings) 2013-2017 (USD Million) 38
Figure 13: Global Titanium Dioxide Market, By Applications (Paints & coatings) 2018-2023 (USD Million) 38
Figure 14: Production statistics of cars, commercial vehicles, in 2017 39
Figure 15: World Economic projections in 2016,2017,2018 40
Figure 16: Sales of vehicles in various regions in 2016 & 2017, in million 40
Figure 17: Global Titanium Dioxide Market, By Application (Plastics), 2013-2017 (USD Million) 41
Figure 18: Global Titanium Dioxide Market, By Application (Plastics), 201-2017 (USD Million) 41
Figure 19: Global Titanium Dioxide Market, By Application (Paper & Pulp), 2013-2017 (USD Million) 43
Figure 20: Global Titanium Dioxide Market, By Application (Paper & Pulp), 2018-2023 (USD Million) 43
7

List of Figures Figure No. Figure Title Page No.
Figure 21: Global Titanium Dioxide Market, By Application (Others), 2013-2017 (USD Million) 45
Figure 22: Global Titanium Dioxide Market, By Application (Others), 2018-2023 (USD Million) 45
Figure 23: Global Titanium Dioxide Market Size, By Region, 2017 (%) 48
Figure 24: Global Titanium Dioxide Market Size, By Region, 2023 (%) 49
Figure 25: North America Titanium Dioxide Market Size, By Value, 2013-2017 (USD Million) 51
Figure 26: North America Titanium Dioxide Market Size, By Value, Forecast, 2018-2023 (USD Million) 52
Figure 27: North America Population, 2013-2017 (in Billions) 53
Figure 28: North America GDP, 2012-2015 (USD Trillion) 53
Figure 29: Demand for Paint & Coatings in the U.S from 2009 to 2019, By Market (in million gallons) 54
Figure 30: Cosmetic sales in the United States in 2016, by segment (in million U.S. dollars) 54
Figure 31: Major Players in US Titanium Dioxide Market 55
Figure 32: Venator Titanium dioxide Production Capacity 55
Figure 33: Kronos expected 2018 manufacturing capacity by plant location and type of manufacturing process 56
Figure 34: North America Titanium Dioxide Market Size, By Application, By value, 2013-2017 (USD Million) 57
Figure 35: North America Titanium Dioxide Market Size, By Application, By value ,2018-2023 (USD Million) 58
Figure 36: U.S Titanium Dioxide Market Size, By Value, 2013-2023 (USD Million) 62
Figure 37: Resident population of the United States by sex and age , 2017 (in million) 64
Figure 38: U.S Titanium Dioxide Market Size, By Application, By value, 2013-2017 (USD Million) 65
Figure 39: Total Number of U.S. population, Usage of toothpaste from 2017 to 2020 (in billions) 66
Figure 40: U.S Titanium Dioxide Market Size, By Application, By value ,2018-2023 (USD Million) 67
8

List of Figures
Figure No. Figure Title Page No.
Figure 41: Canada Titanium Dioxide Market Size, By Value, 2013-2023 (USD Million) 69
Figure 42: Canada Population, 2013-2017 (in Millions) 70
Figure 43: Plastic production in the United States and Canada in 2017, by resin (in million pounds) 71
Figure 44: Car sales in Canada in October 2017 and October 2018, by brand (in units) 71
Figure 45: Canada Titanium Dioxide Market Size, By Applications, By value, 2013-2017 (USD Million) 72
Figure 46: Canada Total Sales of Vehicles 2013-2017 73
Figure 47: Total Revenue of Paints And Coatings Manufacture in Canada, 2014-2020 (in million USD) 73
Figure 48: Canada Automotive Production Data (USD Millions) 74
Figure 49: Canada Titanium Dioxide Market Size, By Applications, By value ,2018-2023 (USD Million) 75
Figure 50: Europe Titanium Dioxide Market Size, By Value, 2013-2017 (USD Million) 77
Figure 51: Europe Titanium Dioxide Market Size, By Value, Forecast, 2018-2023 (USD Million) 78
Figure 52: Europe GDP, 2013-2017 (USD Trillion) 79
Figure 53: Europe and EFTA Best Selling Cars Sales, 2016 and 2017 (in million units) 80
Figure 54: Top 5 destinations of Europe Car exports, 2016 and 2017 (trade value in million USD) 81
Figure 55: New passenger car registrations in the EU 81
Figure 56: European Union Population , 2013-2016 (in Billions) 82
Figure 57: World passenger car production 82
Figure 58: Europe number of internet users, by leading countries, 2017(Millions) 82
Figure 59: Major Players in US Titanium Dioxide Market 83
Figure 60: Venator Titanium dioxide Production Capacity 84
9
List of Figures
Figure No. Figure Title
Page No.
Figure 61: Titanium Dioxide Produced in EEA (% of total production ) 85
Figure 62: Europe Titanium Dioxide Market Size, By Application, By value, 2013-2017 (USD Million) 86
Figure 63: Pulp Production in Europe in 2016 & 2017 88
Figure 64: CEPI Paper & Board Production by Country in 2017 (Total Paper & Board Production 92.2 million tonnes) 88
Figure 65: CEPI Exports of Market Pulp to Other Regions 89
Figure 66: Europe Titanium Dioxide Market Size, By Application, By value ,2018-2023 (USD Million) 90
Figure 67: Germany Titanium Dioxide Market Size, By Value, 2013-2023 (USD Million) 93
Figure 68: European plastic demand 2016 95
Figure 69: Germany Titanium Dioxide Market Size, By Application, By value, 2013-2017 (USD Million) 96
Figure 70: Germany Population, 2012-2016 (in Millions) 98
Figure 71: Sales of new vehicles from 2013 to 2017 in Germany 98
Figure 72: Germany Titanium Dioxide Market Size, By Application, By value ,2018-2023 (USD Million) 99
Figure 73: U.K Titanium Dioxide Market Size, By Value, 2013-2023 (USD Million) 101
Figure 74: U.K Population , 2012-2017 (in Millions) 103
Figure 75: Market value of cosmetics in Great Britain from 2013 to 2017 (in 1,000 GBP) 103
Figure 76: U.K Titanium Dioxide Market Size, By Application, By value, 2013-2017 (USD Million) 104
Figure 77: U.K Production of Cars & Commercial vehicles in 2016 & 2017 105
Figure 78: U.K Titanium Dioxide Market Size, By Application, By value ,2018-2023 (USD Million) 106
Figure 79: France Titanium Dioxide Market Size, By Value, 2013-2023 (USD Million) 108
Figure 80: France Population , 2012-2017 (in Millions) 110
10
List of Figures
Figure No. Figure Title Page No.
Figure 81: France Titanium Dioxide Market Size, By Application, By value, 2013-2017 (USD Million) 111
Figure 82: France Titanium Dioxide Market Size, By Application, By value ,2018-2023 (USD Million) 113
Figure 83: Rest of Europe Titanium Dioxide Market Size, By Value, 2013-2023 (USD Million) 115
Figure 84: Europe Ink Sales By country from 2016 to 2017 (%) 116
Figure 85: Sales of new vehicles in Austria, Belgium, Denmark , 2017 116
Figure 86: Rest of Europe Titanium Dioxide Market Size, By Application, By value, 2013-2017 (USD Million) 117
Figure 87: Rest of Europe Titanium Dioxide Market Size, By Application, By value ,2018-2023 (USD Million) 118
Figure 88: APAC Titanium Dioxide Market Size, By Value, 2013-2017 (USD Million) 120
Figure 89: APAC Titanium Dioxide Market Size, By Value, Forecast, 2018-2023 (USD Million) 121
Figure 90: Asia Pacific urban population, 2013-2016 (Millions) 122
Figure 91: APAC GDP, 2012-2016 (USD Trillion) 122
Figure 92: APAC Automotive Manufacturing Output Geographic Breakdown 124
Figure 93: Number of Registrations or Sales of New Vehicles in APAC Region 2016 & 2017, By country (in Million units) 124
Figure 94: Major Players of Titanium Dioxide in APAC 125
Figure 95: Venator Titanium dioxide production capacity 126
Figure 96: Cosmetic market of Asia Pacific in billion USD, 2016-2020 127
Figure 97: APAC Titanium Dioxide Market Size, By Application, By value, 2013-2017 (USD Million) 128
Figure 98: APAC Titanium Dioxide Market Size, By Application, By value ,2018-2023 (USD Million) 129
Figure 99: China Titanium Dioxide Market Size, By Value, 2013-2023 (USD Million) 132
Figure 100: China Construction Scenario 133
11
List of Figures
Figure No. Figure Title Page No.
Figure 101: China Population, 2012-2016 (in Billions) 134
Figure 102: China Production Statistics of Motor vehicle, 2017 134
Figure 103: China Titanium Dioxide Market Size, By Application, By value, 2013-2017 (USD Million) 135
Figure 104: China Titanium Dioxide Market Size, By Application, By value ,2018-2023 (USD Million) 136
Figure 105: Japan Titanium Dioxide Market Size, By Value, 2013-2023 (USD Million) 138
Figure 106: Japan Population, 2013-2017 (in Millions) 139
Figure 107: Total new vehicle registrations in Japan including mini cars, passenger cars, trucks and buses 139
Figure 108: Best-Selling Vehicle Manufacturers in Japan in 2017 140
Figure 109: Japan Titanium Dioxide Market Size, By Application, By value, 2013-2017 (USD Million) 141
Figure 110: Japan Titanium Dioxide Market Size, By Application, By value ,2018-2023 (USD Million) 143
Figure 111: India Titanium Dioxide Market Size, By Value, 2013-2023 (USD Million) 145
Figure 112: India Population, 2012-2016 (in Billions) 147
Figure 113: India Sales of vehicle, 2013-2017 147
Figure 114: India's share of the Global Market in Paper industry 148
Figure 115: India Per Capita Consumption of Paper (kg) 148
Figure 116: China Titanium Dioxide Market Size, By Application, By value, 2013-2017 (USD Million) 149
Figure 117: India Titanium Dioxide Market Size, By Application, By value ,2018-2023 (USD Million) 150
Figure 118: Rest of APAC Titanium Dioxide Market Size, By Value, 2013-2023 (USD Million) 152
Figure 119: Cosmetic Scenario in South Korea 153
Figure 120: South Korea sales of vehicle, 2013-2017 153
12
List of Figures
Figure No. Figure Title Page No.
Figure 121: Rest of APAC Titanium Dioxide Market Size, By Application, By value, 2013-2017 (USD Million) 154
Figure 122: Rest of APAC Titanium Dioxide Market Size, By Application, By value ,2018-2023 (USD Million) 155
Figure 123: ROW Titanium Dioxide Market Size, By Value, 2013-2023 (USD Million) 157
Figure 124: Market value of paints and coatings industry worldwide from 2017 to 2022 (in billion U.S. dollars) 158
Figure 125: Cosmetic Market in USD billion 158
Figure 126: ROW Titanium Dioxide Market Size, By Application, By value, 2013-2017 (USD Million) 159
Figure 127: ROW Titanium Dioxide Market Size, By Application, By value ,2018-2023 (USD Million) 160
Figure 128: Market share of Leading Titanium dioxide Manufacturers, 2018 (%) 172
Figure 129: Chemours, Titanium Technologies Net Sales By End Market , 2017 (%) 175
Figure 130: Chemours, Production Facilities & Technical Centers 176
Figure 131: Chemours, Revenue, 2013-2017 (USD Million) 177
Figure 132: Chemours, Titanium Technologies Net Sales By Geographic region , 2017 (%) 177
Figure 133: Chemours , Sales By Region 2017 (%) 177
Figure 134: Kronos expected 2018 manufacturing capacity by plant location and type of manufacturing process 180
Figure 135: Kronos, Revenue, 2013-2017 (USD Million) 181
Figure 136: Kronos, Sales volumes percentages by geographic region, 2017 (%) 181
Figure 137: Kronos , Sales volumes percentages by end-use, 2017 (%) 181
Figure 138: Tronox TiO2 production facilities and capacity (in gross MT per year), by location, 2017 183
Figure 139: Tronox 2017 Production of TiO2 , Feedstock and Co-Products , (thousands of metric tonnes), 2017 184
Figure 140: Tornox, Revenue, 2013-2017 (USD Million) 185
13
List of Figures
Figure No. Figure Title Page No.
Figure 141: Tornox, Sales volume distribution by geography, 2017 (%) 185
Figure 142: Tornox , Sales Volume Distribution by End Use, 2017 (%) 185
Figure 143: Venator Titanium dioxide Production Capacity 187
Figure 144: Venator, Revenue, 2013-2017 (USD Million) 188
Figure 145: Ventor , Sales By Segment, 2017 (%) 188
Figure 146: Ventor titanium dioxide sales by end market 2017 (%) 188
Figure 147: Argex Titanium Inc., Revenue, 2013-2017 (USD) 190
Figure 148: Lomon Billion , Revenue, 2014-2017 (USD millions) 192
Figure 149: Lomon Billion, Pigment Production by Technology (ktpa) 192
14
For our study on Global Titanium Dioxide Market, we have conducted comprehensive secondary research
followed by an extensive primary research. In the process of secondary research, we have scrutinized
industry documents, accessed from open sources, premium paid databases (Bloomberg, Thomson Reuters,
Factiva) and our internal knowledge base. In the process of primary research, we have interviewed
various industry experts across the value chain of the medical equipment and service industry.
Market size of the actual period (2013-2017) has been evaluated on the basis of growth trends of the
industry in the last five years, and confirming the findings through primary research. Annual reports of
the companies are scanned to further validate the market size and to estimate the size of various other
applications. Market sizing and growth in the forecast period (2018-2023) is estimated through revenue
mapping, growth of new advance equipment and technology and historical growth pattern of the
industry. All the relevant data points/ statistics in the forecast period are validated through relevant and
reliable primary sources.
Report Focus: Global Titanium Dioxide Market.
- By Applications (Paints & Coatings, Plastics, Paper & Pulp and Others)
- By Region (North America, Europe, Asia Pacific and ROW),
- By Country (U.S, Canada, U.K, Germany, France, China, India, Japan)
- Company Coverage (Chemours, Huntsman, Kronos Worldwide, Tronox Limited, Argex Titanium Inc,Venator, Lomon Billions)
Companies Contacted: Kronos, Tronox
Research Methodology
15
Global Titanium Dioxide Market Overview
Source: Azoth Analytics Estimates
Xx
Xx
Xx
Xx
Xx
Xx
xxxxx
2013 2014 2015 2016 2017
Figure 1: Global Titanium Dioxide Market Size, By Value, forecast 2013-2017 (USD Million)
CAGR 2013-2017
xx%
16
Global Titanium Dioxide Market Overview
xxxx
Xx
Xx
Xx
Xx
Xx
2018 2019 2020 2021 2022 2023
Source: Azoth Analytics Estimates
CAGR 2018-2023
xx%
Figure 2: Global Titanium Dioxide Market Size, By Value, Forecast, 2018-2023 (USD Million)
17
Source: Azoth Analytics Estimates
CAGR 2013-2017
xx%
CAGR 2018-2023
xx%
Figure 3: Global Titanium Dioxide Market, By Volume, 2013-2023(in million metric tonnes)
2013 2014 2015 2016 2017 2018 2019 2020 2021 2022 2023
Global Titanium Dioxide Market- By Volume
xxxxx
18
Xx
Xx
Xx
Xx
Xx

Figure 12: Global Titanium Dioxide Market, By Applications
(Paints & coatings) 2013-2017 (USD Million)
Source: Azoth Analytics Estimates
Figure 13: Global Titanium Dioxide Market, By Applications
(Paints & coatings) 2018-2023 (USD Million)
Global Titanium Dioxide Market- By Applications (Paints & Coatings)
19
Xx
Xx
Xx
Xx
Xx
CAGR 2013-2017
xx%
CAGR 2018-2023
xx%
2013 2014 2015 2016 2017 2018 2019 2020 2021 2022 2023

• .
Figure 17: Global Titanium Dioxide Market, By Application
(Plastics), 2013-2017 (USD Million)
Source: Azoth Analytics Estimates
Figure 18: Global Titanium Dioxide Market, By Application
(Plastics), 201-2017 (USD Million)
Global Titanium Dioxide Market – By Application (Plastics)
20
Xx
Xx
Xx
Xx
Xx
CAGR 2013-2017
xx%
CAGR 2018-2023
xx%
2013 2014 2015 2016 2017 2018 2019 2020 2021 2022 2023
• .
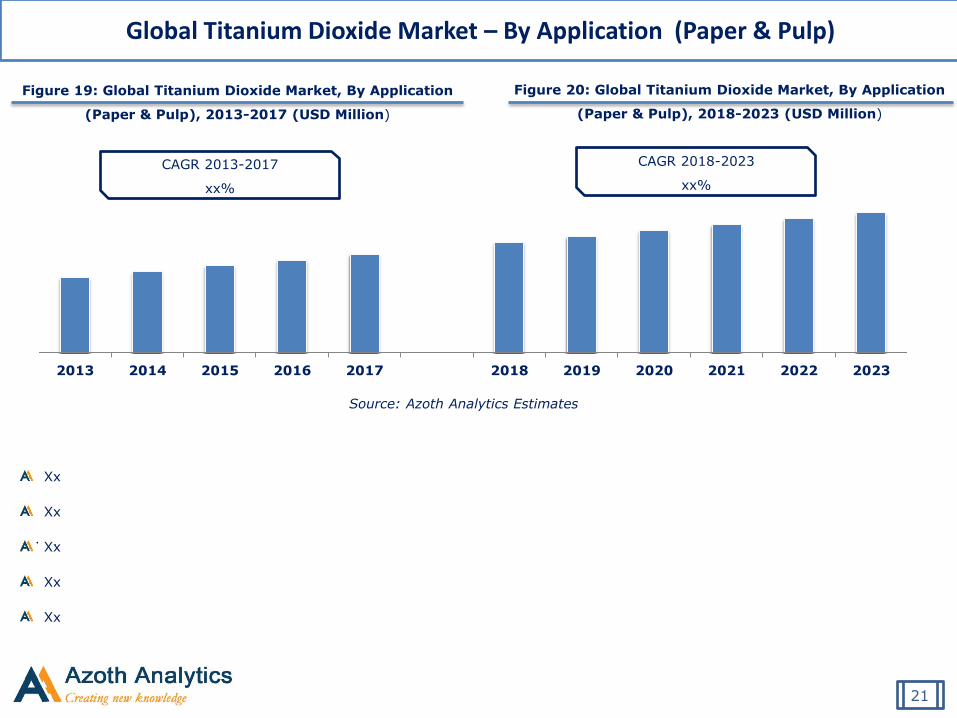
Figure 19: Global Titanium Dioxide Market, By Application
(Paper & Pulp), 2013-2017 (USD Million)
Source: Azoth Analytics Estimates
Figure 20: Global Titanium Dioxide Market, By Application
(Paper & Pulp), 2018-2023 (USD Million)
Global Titanium Dioxide Market – By Application (Paper & Pulp)
21
Xx
Xx
Xx
Xx
Xx
CAGR 2013-2017
xx%
CAGR 2018-2023
xx%
2013 2014 2015 2016 2017 2018 2019 2020 2021 2022 2023

• .
Figure 21: Global Titanium Dioxide Market, By Application
(Others), 2013-2017 (USD Million)
Source: Azoth Analytics Estimates
Figure 22: Global Titanium Dioxide Market, By Application
(Others), 2018-2023 (USD Million)
Global Titanium Dioxide Market – By Application (Others)
22
Xx
Xx
Xx
Xx
Xx
CAGR 2013-2017
xx%
CAGR 2018-2023
xx%
2013 2014 2015 2016 2017 2018 2019 2020 2021 2022 2023

North America Titanium Dioxide Market Overview
Source: Azoth Analytics Estimates
Major companies like Chemours, Kronos, Tornox are present in the North America region driving
the market of titanium dioxide
Figure 25: North America Titanium Dioxide Market Size, By Value, 2013-2017 (USD Million)
CAGR 2013-2017
xx%
23
Xx
Xx
Xx
Xx
Xx
2013 2014 2015 2016 2017

North America Titanium Dioxide Market Overview
xxxx
Source: Azoth Analytics Estimates
Figure 26: North America Titanium Dioxide Market Size, By Value, Forecast, 2018-2023 (USD Million)
24
Xx
Xx
Xx
Xx
Xx
2018 2019 2020 2021 2022 2023
CAGR 2018-2023
xx%
Source: Azoth Analytics Estimates
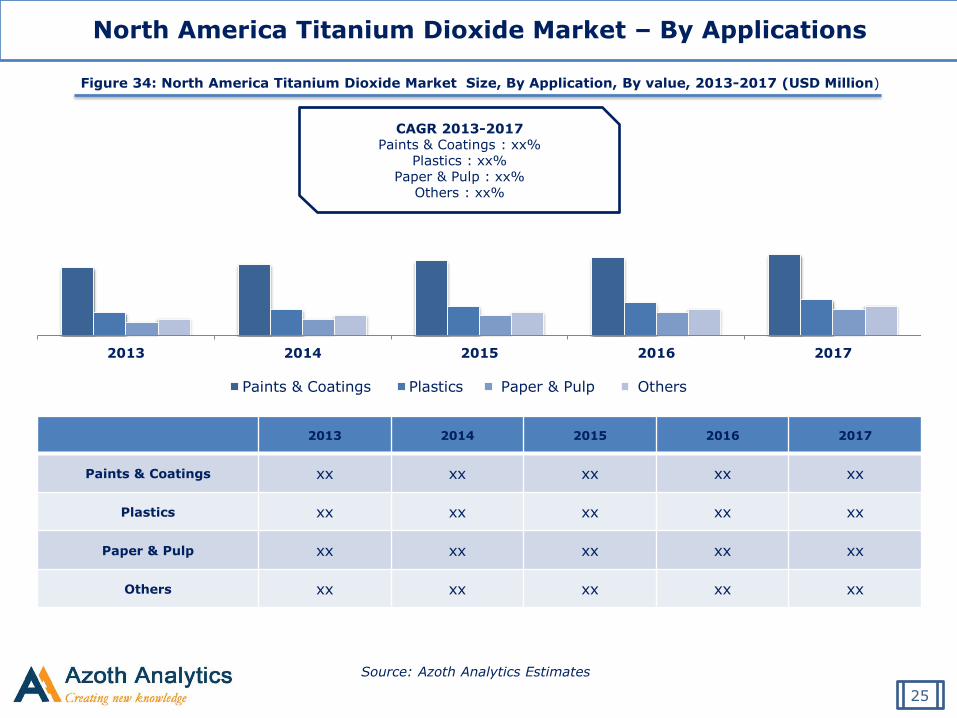
Figure 34: North America Titanium Dioxide Market Size, By Application, By value, 2013-2017 (USD Million)
CAGR 2013-2017 Paints & Coatings : xx%
Plastics : xx% Paper & Pulp : xx%
Others : xx%
North America Titanium Dioxide Market – By Applications
2013 2014 2015 2016 2017
Paints & Coatings xx xx xx xx xx
Plastics xx xx xx xx xx
Paper & Pulp xx xx xx xx xx
Others xx xx xx xx xx
2013 2014 2015 2016 2017
Paints & Coatings Plastics Paper & Pulp Others
25

Source: Azoth Analytics Estimates
Figure 35: North America Titanium Dioxide Market Size, By Application, By value ,2018-2023 (USD Million)
North America Titanium Dioxide Market- By Applications
2018 2019 2020 2021 2022 2023
Paints & Coatings xx xx xx xx xx xx
Plastics xx xx xx xx xx xx
Paper & Pulp xx xx xx xx xx xx
Others xx xx xx xx xx xx
2018 2019 2020 2021 2022 2023
Paints & Coatings Plastics Paper & Pulp Others
CAGR 2018-2023 Paints & Coatings : xx%
Plastics : xx% Paper & Pulp : xx%
Others : xx%
26
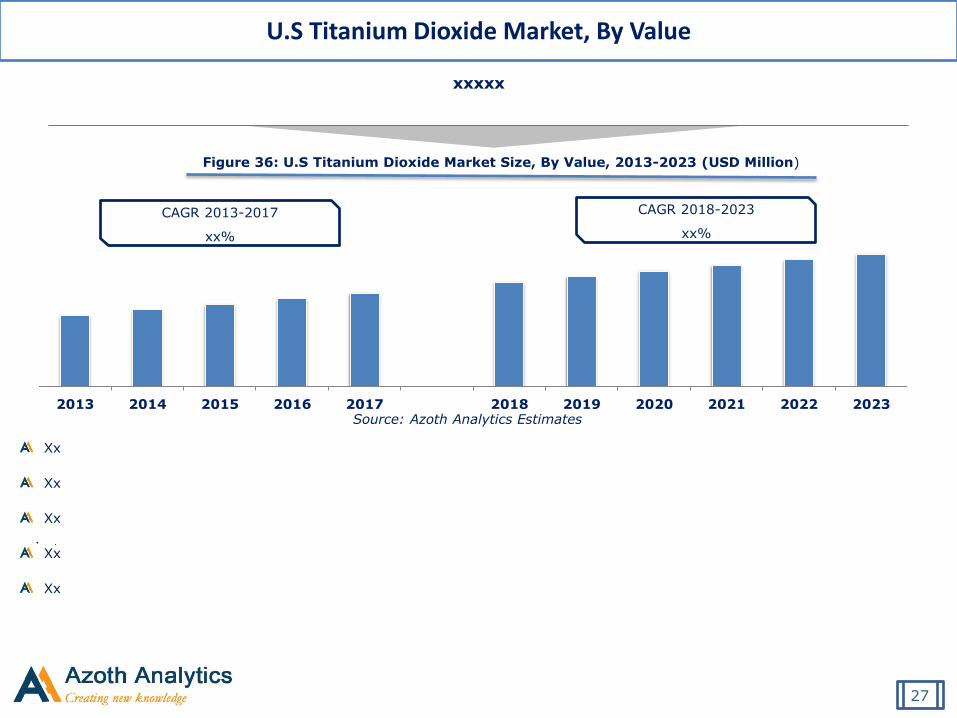
U.S Titanium Dioxide Market, By Value
• .
Source: Azoth Analytics Estimates
xxxxx
Figure 36: U.S Titanium Dioxide Market Size, By Value, 2013-2023 (USD Million)
27
Xx
Xx
Xx
Xx
Xx
CAGR 2013-2017
xx%
CAGR 2018-2023
xx%
2013 2014 2015 2016 2017 2018 2019 2020 2021 2022 2023

Source: Azoth Analytics Estimates
Figure 38: U.S Titanium Dioxide Market Size, By Application, By value, 2013-2017 (USD Million)
U.S Titanium Dioxide Market – By Applications
2013 2014 2015 2016 2017
Paints & Coatings xx xx xx xx xx
Plastics xx xx xx xx xx
Paper & Pulp xx xx xx xx xx
Others xx xx xx xx xx
28
CAGR 2013-2017 Paints & Coatings : xx%
Plastics : xx% Paper & Pulp : xx%
Others : xx%
2013 2014 2015 2016 2017
Paints & Coatings Plastics Paper & Pulp Others
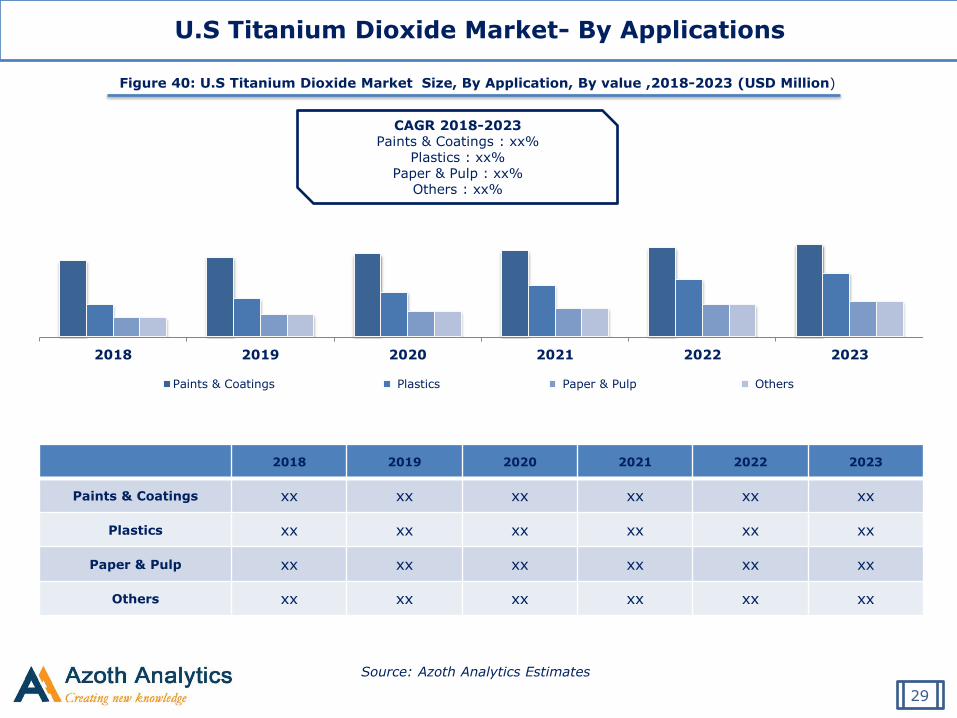
Source: Azoth Analytics Estimates
Figure 40: U.S Titanium Dioxide Market Size, By Application, By value ,2018-2023 (USD Million)
U.S Titanium Dioxide Market- By Applications
2018 2019 2020 2021 2022 2023
Paints & Coatings xx xx xx xx xx xx
Plastics xx xx xx xx xx xx
Paper & Pulp xx xx xx xx xx xx
Others xx xx xx xx xx xx
29
2018 2019 2020 2021 2022 2023
Paints & Coatings Plastics Paper & Pulp Others
CAGR 2018-2023 Paints & Coatings : xx%
Plastics : xx% Paper & Pulp : xx%
Others : xx%
About Azoth Analytics Pvt Ltd.
Azoth Analytics is a business research and analytics firm that creates in-depth research reports and provides customized research solutions and consultancy services. Verticals in which Azoth Analytics specializes include healthcare and pharmaceutical, oil and gas, retail, chemicals, automotive, FMCG, food & beverages and technology. Azoth creates comprehensive and in-depth research reports by recording, interpreting and analyzing information. Strategic market sizing and data dredging techniques include secondary research, and primary research (interviews with management personnel and industry experts).
Disclaimer: Azoth Analytics report information is based mainly on interviews and therefore, is subject to fluctuation. Azoth Analytics therefore, takes no responsibility for
any incorrect information supplied to us by industry experts, manufacturers or users. Azoth does not warranty the completeness of the information and data. Also, analysis
provided in the report are meant for customers’ internal use only and not for general publication or disclosure to third parties.
30
Recommended