
FUNCTIONAL CONDITIONING FOR
FOOTBALLGlazier Clinics March 5, 2011

“Toughen” Up???
Best Football Shape
Optimal Performance
Best Football Shape & Optimal Performance
UNDERSTAND YOUR GOALS

Aerobic Endurance: ◦ The body’s ability to use 02
for energy production for long duration activity.
Anaerobic Activity:◦ Short, intense bouts of
exercise where the body can not use 02 as an energy source.
Anaerobic Endurance:◦ The body’s ability to repeat
the short, intense bouts efficiently over time. (Football)
AEROBIC & ANAEROBIC ENDURANCE
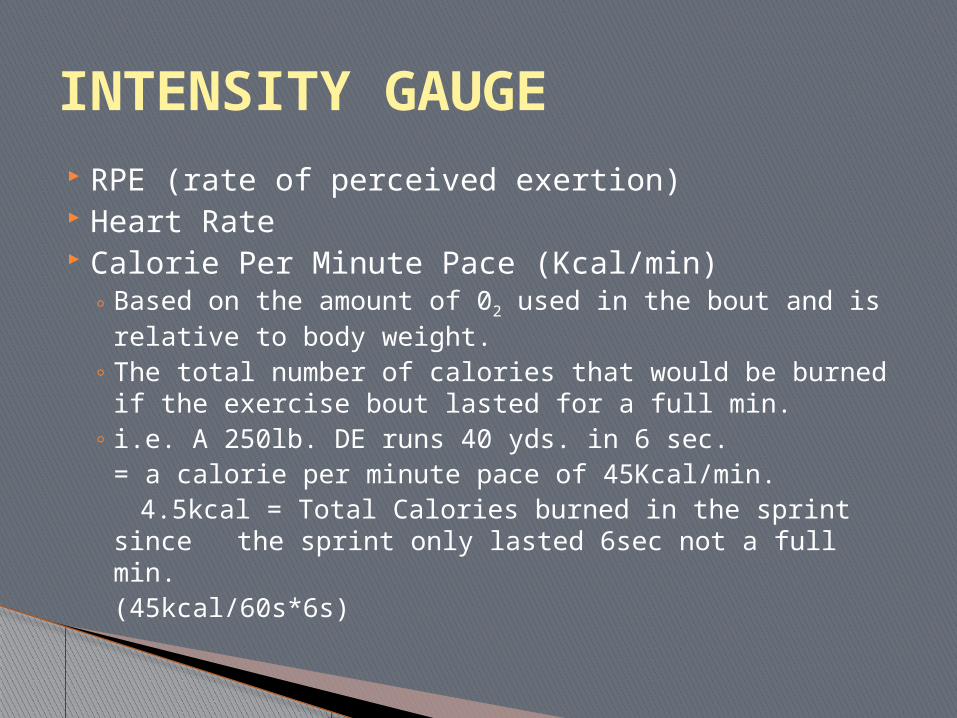
RPE (rate of perceived exertion) Heart Rate Calorie Per Minute Pace (Kcal/min)
◦ Based on the amount of 02 used in the bout and is relative to body weight.
◦ The total number of calories that would be burned if the exercise bout lasted for a full min.
◦ i.e. A 250lb. DE runs 40 yds. in 6 sec. = a calorie per minute pace of 45Kcal/min.
4.5kcal = Total Calories burned in the sprint since the sprint only lasted 6sec not a full min.
(45kcal/60s*6s)
INTENSITY GAUGE

Football is played at 45-60 kcal/min depending on the position.
A typical football play only lasts 2-6 sec. with a 25-40 sec. rest in between plays.
It is hard to match this intensity with most activities, or modes of conditioning.
CALORIE PER MINUTE PACE


Football 52
Aerobic dance: 16 Basketball (full court, vigorous): 26 Bicycling (15 mph): 13 Spinning: 12 Cross-country skiing (8 mph): 28 Golf (carrying clubs): 12 Running (5 mph): 16 Running (15 mph): 48 Soccer (vigorous): 26 Swimming (20 yards/min): 8 Swimming (50 yards/min): 19 Tennis (recreational): 8 Walking (at 3.5 mph): 9 Walking (at 4.5 mph): 13
CALORIE PER MINUTE PACEFOR A 265lb. DEFENSIVE END DURING VARIOUS ACTIVITIES
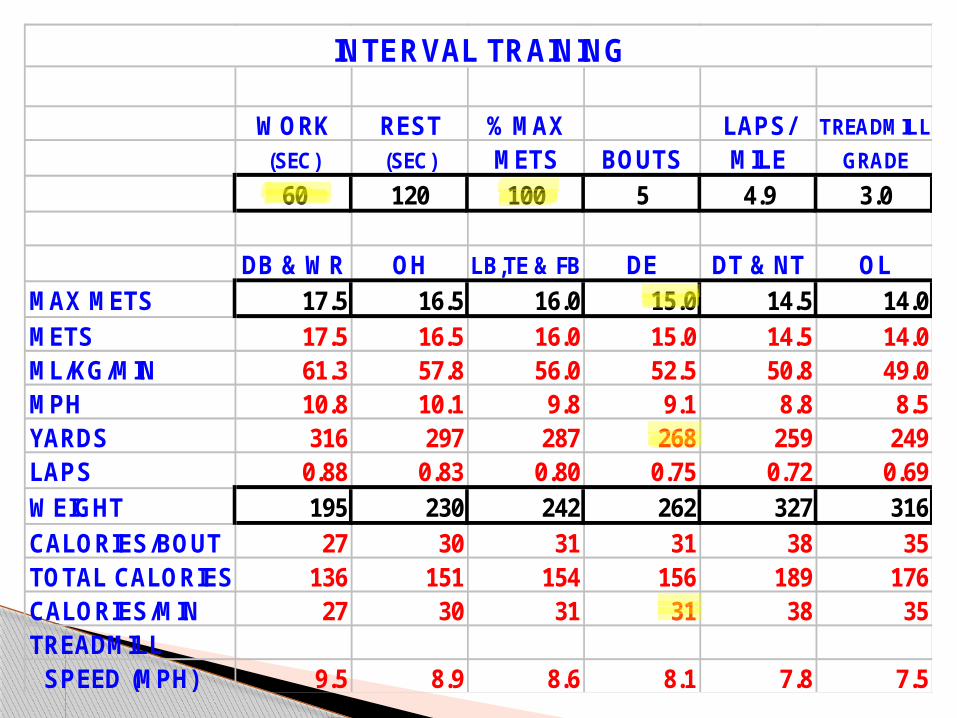
INTERVAL TRAINING
WORK REST % MAX LAPS/ TREADMILL
(SEC) (SEC) METS BOUTS MILE GRADE
60 120 100 5 4.9 3.0
DB & WR OH LB,TE & FB DE DT & NT OLMAX METS 17.5 16.5 16.0 15.0 14.5 14.0METS 17.5 16.5 16.0 15.0 14.5 14.0ML/KG/MIN 61.3 57.8 56.0 52.5 50.8 49.0MPH 10.8 10.1 9.8 9.1 8.8 8.5YARDS 316 297 287 268 259 249LAPS 0.88 0.83 0.80 0.75 0.72 0.69WEIGHT 195 230 242 262 327 316CALORIES/BOUT 27 30 31 31 38 35TOTAL CALORIES 136 151 154 156 189 176CALORIES/MIN 27 30 31 31 38 35TREADMILL SPEED (MPH) 9.5 8.9 8.6 8.1 7.8 7.5

INTERVAL TRAINING
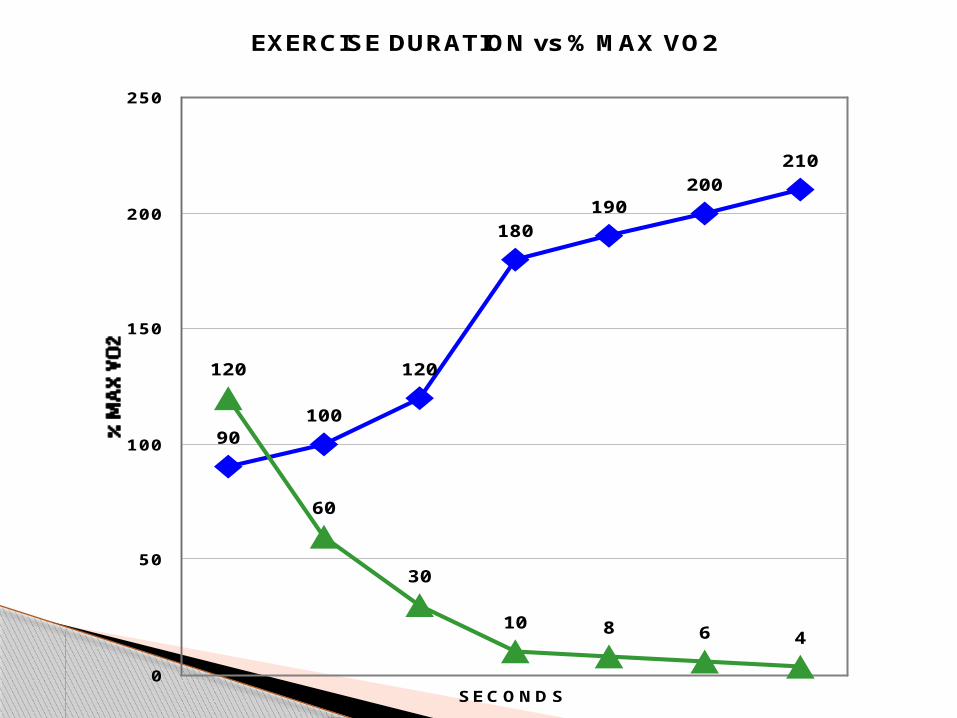
EXERCISE DURATION vs % MAX VO2
90100
120
180190
200210
120
60
30
10 8 6 4
0
50
100
150
200
250
SECONDS
40 5010 20 30 40 30
40 5010 20 30 40 30
20
20
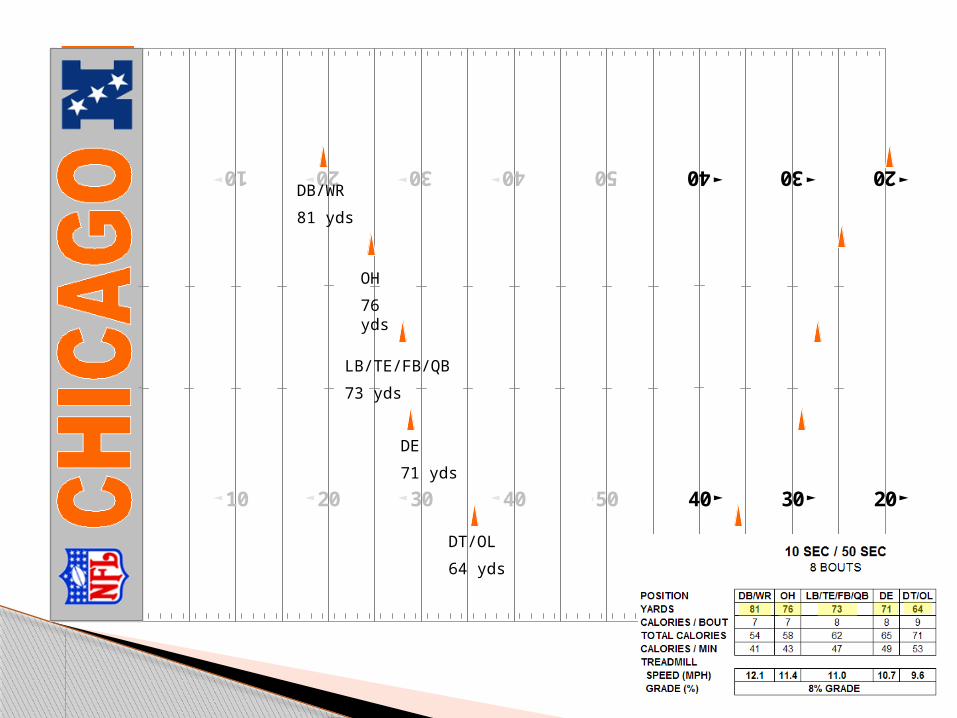
DB/WR
81 yds
OH
76 yds
LB/TE/FB/QB
73 yds
DE
71 yds
DT/OL
64 yds

PC and LA RUNS
40 5010 20 30 40 30
40 5010 20 30 40 30
20
20
+10s (5)
+40s (25)
-15pr (15)
+10s (20)
+15bp (30)
+10sl (35)
+20s (45)
-40s (25)
-10sr (20)
-5bp (20)
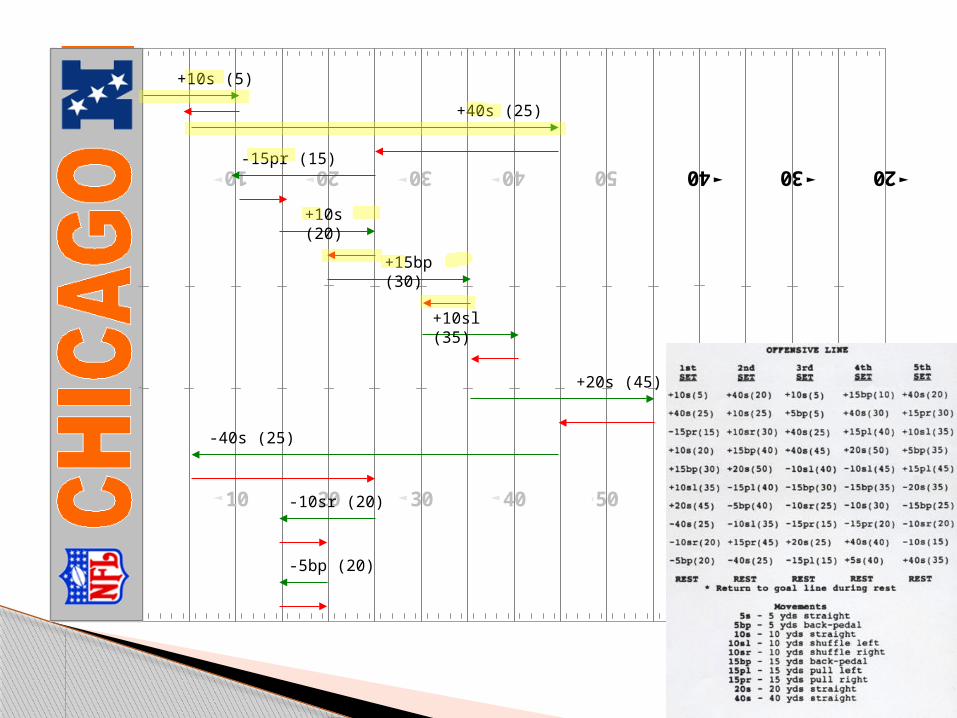
OFFENSIVE LINE DEFENSIVE LINEPLAY FIELD GO/STOP TIME(s) YARDS1 +G:36 :00-:08 8 642 -40:11 :33-:39 6 493 +G:34 1:04-1:08 4 344 +30:47 1:33-1:35 2 175 -50:01 2:00-2:06 6 496 +G:17 2:31-2:33 2 177 +20:46 2:58-3:02 4 348 -50:01 3:27-3:33 6 499 +G:36 3:58-4:06 8 6410 -40:26 4:31-4:35 4 3411 +25:42 5:00-5:02 2 1712 -49:G 5:27-5:33 6 49
PLAY DRIVE
P. 7

40 5010 20 30 40 30
40 5010 20 30 40 30
20
20
+G:36
-40:11
+G:34
+30:47
-50:01
+G:17
+20:46
-50:01
+G:36
-40:26
+25:42
-49:G

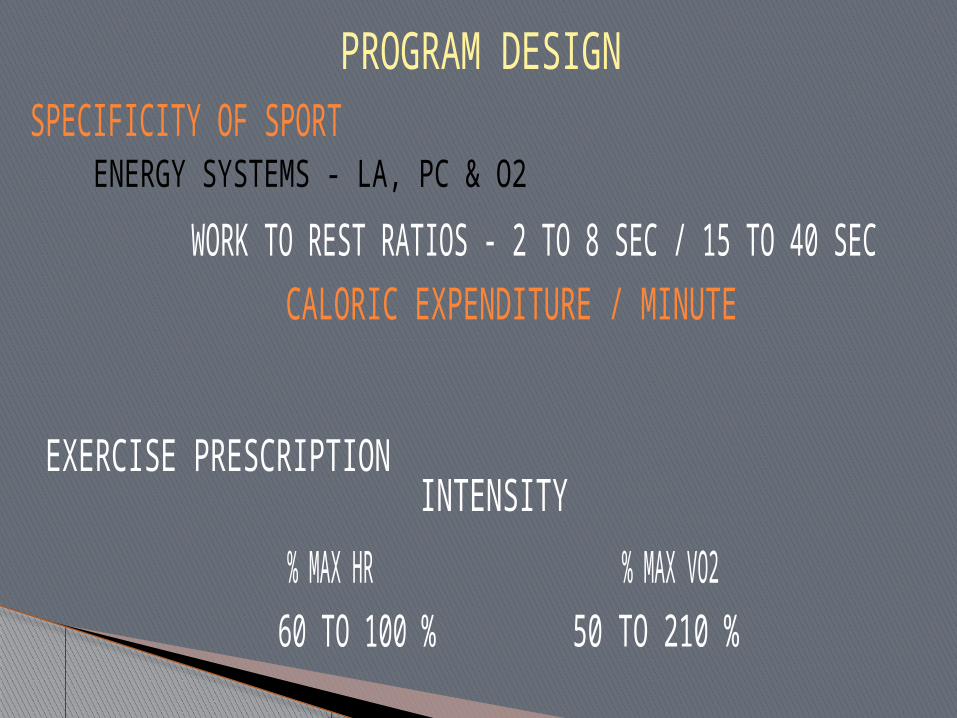
TRAINING SMART is not necessarily TRAINING HARD A smart conditioning approach should:
◦ Maximize Rest and Recovery◦ Minimize Fuel Depletion and Increase Energy
Levels◦ Optimize Gains in the Weight Room
Optimize Overall Performance
OPTIMIZE YOUR TRAINING

Recommended


![In Perfect Shape: Certifiably Optimal 3D Shape ......ing graduated non-convexity [3]. The resulting algorithm, named Shape#, is robust against 70% outliers and does not require an](https://img.dokumen.tips/doc/110x75/5f6c11534a676641c836ca0b/in-perfect-shape-certifiably-optimal-3d-shape-ing-graduated-non-convexity.jpg)


