1
Geomorphology and Dust Storms in China
edited by
David L. Alles
Western Washington University
e-mail: [email protected]
Last updated 2012-12-23
Note: In PDF format most of the images in this web paper can be enlarged for greater detail.

2
Introduction Geomorphology is the study of landforms, including their origin and evolution, and the processes that shape them. Examples of landforms are mountains and mountain ranges, valleys, basins, and plateaus. A number of factors, ranging from plate tectonics to erosion and deposition, can generate and affect landforms. China, because of its size and unique plate tectonics, has some of the most extreme landforms of any continental land mass. These landforms have, in turn, created some of the largest and most extreme deserts in the world. Landforms also influence the movement of weather systems. When seen together, it then becomes clear that the interaction of landforms and climate determines the location and severity of dust storms that plague China. The primary purpose of this paper is to use readily available data from the Internet, in the form of satellite images captured by NASA's MODIS instrument aboard the Terra and Aqua satellites and air pollution indices from China's State Environmental Protection Administration, to track the evolution of dust storms in China.
Web References http://en.wikipedia.org/wiki/Geomorphology
http://en.wikipedia.org/wiki/Geography_of_China
http://fire.biol.wwu.edu/trent/alles/AltynTagh.pdf

3
This web paper is part of a series of papers on global ecology. In addition to this paper the series includes:
Asian Air Pollution http://fire.biol.wwu.edu/trent/alles/AirPollution.pdf
Freshwater Shortage and Desertification
http://fire.biol.wwu.edu/trent/alles/WaterShortage.pdf
China's Deserts http://fire.biol.wwu.edu/trent/alles/ChinaDeserts.pdf
The Aral Sea
http://fire.biol.wwu.edu/trent/alles/AralSea.pdf
The Colorado River: An Ecological Case Study http://fire.biol.wwu.edu/trent/alles/ColoradoRiver.html
The common thread in all of these papers is to show how complex coupled natural systems and human interactions have led to the ecological crises of our times.

4
Left to right across the center of this image are the Taklimakan, Kumtag, Badain Jaran, Tengger, and central Gobi deserts in China. Because of the topography, strong west winds and the dust and sand storms they create have an almost unhindered path east across these deserts. Added to this, winds from the north and northwest have an almost unbroken path southeast across the Gobi Desert to China. To understand the varying effects of the dust storms that form in these deserts, it's necessary to distinguish between their extent, as measured by area affected, and their severity, as measured by wind speed and particulate load. Most dust storms in China are local or regional in extent. The regions of the Tarim Basin, the Alxa Plateau, and the central Mongolia Plateau all experience storms of varying severity that are localized because of wind direction and topography. In contrast, major dust storms are those that cross multiple regions. Dust from major storms can reach east to Korea, Japan, even across the Pacific to North America, and as far south as Shanghai. (Image courtesy of NASA's Blue Marble series)
Web Reference http://fire.biol.wwu.edu/trent/alles/ChinaDeserts.pdf

5
Most dust storms that reach eastern China follow one of two paths.
1. Out of the West: Cold fronts related to the Siberian High sweep east pushing strong winds over a wide area that includes the Tarim and Turpan basins, the Hexi Corridor, and Ordos Plateau. If conditions are right, the storms then move east or southeast into eastern China. The center of cold high-pressure after the fronts move through is in Xinjiang and western Inner Mongolia (Ci Longjun, 2002). 2. Down from the North: Cold fronts from northwest of Lake Baikal surge south through the basin of the Great Lakes in northwestern Mongolia to the central Gobi Desert (Ci Longjun, 2002), where they merge with strong winds flowing northeast toward an intense low pressure cyclone over eastern Mongolia. Most multi-regional storms are caused by weather systems similar to this (Wang, et al., 2004). (Notes: As a simplification, Beijing is the target of the two arrows in the above image. Note also that the degree symbol ° has been left out of latitude and longitude coordinates in this paper as a further simplification. And that UTC is short for Coordinated Universal Time, or GMT/ Zulu. China Standard Time, or CST is UTC + 8 hours.)

6
Dust and Sand Front moving across the Sahara Desert
Almost all dust and sand storms are caused by weather fronts, usually a cold front. Most storms also occur over deserts where the surface heats up quickly. As a result, the air aloft is much colder than the air at the surface. This colder air sinks to the Earth's surface and combines with surface winds to create very strong winds. If there is loose sand and dirt they become airborne. In a storm, the dust is pushed ahead of the cold front into the rising warm air over the desert. Most storms, however, only extend a few thousand feet into the air. Unlike water vapor, sand and dust, because of their weight, can only be lifted so far aloft even by very strong winds. In the upper left above, note the clouds behind and high over the dust.

7
Out of the West
This MODIS/Aqua image from April 9, 2006, 03:45 UTC, shows clear skies over north-central China. The dark area below and left of center is the Helan Mountains near the city of Yinchuan in Ningxia Province. The Yellow River's Great Bend and the Ordos Plateau are to the east of the mountains. The Badain Jaran and Tengger deserts are to the west. On the right edge of the image, east of the Taihang Mountains, clouds and smog cover the North China Plain. Note the clouds on the left that billow out from the west. These clouds are the leading edge of a storm front moving east from the Taklimakan Desert. Just a day later the area shown above was engulfed by a wave of dust and sand.

8
On April 10, 2006, 06:05 UTC, a massive wave of dust and sand blew out of the western deserts and over north-central China. The Taklimakan Desert is on the upper left edge of this MODIS/Aqua image. The central deserts, the Badain Jaran and Tengger, are completely hidden by the wave that reaches beyond the Yellow River to the Ordos Plateau. The dark Helan Mountains in Ningxia Province, however, are still visible just right of center. This multi-regional dust and sand storm was both severe and extensive, but did not reach eastern China. Note the stream of clouds just west of the Taihang Mountains (lower left) blown north by strong southerly winds that are also pulling the dust front north.

9
This MODIS/Aqua image from April 11, 2006, 05:10 UTC, shows an intense band of clouds west of the North China Plain being blown northeast by strong winds from the south. These winds swept dust from north-central China all the way to eastern Russia. The blue latitude and longitude lines are 30 to 40N and 110, 120 to 130E. Beijing lies at ~ 40N, 116E.

10
This MODIS/Terra image shows a regional dust and sand storm still blowing over the Tarim and Turpan basins, and the western Hexi Corridor on April 13, 2006. Strong spring weather systems capable of generating winds of 96 km/h (60 mph) that last for days across this area, combined with sandy soils in the region that are loose and fine, are two reasons why dust and sand storms in China’s western deserts are so severe.
Web Reference http://earthobservatory.nasa.gov/IOTD/view.php?id=4352

11
This MODIS/Aqua image shows a local dust and sand storm blowing over the eastern end of the Taklimakan Desert in the Tarim Basin on December 3, 2005. The Taklimakan is one of the world's largest sandy wastes and a main source of atmospheric dust in northern China. The next important sources are the central Gobi Desert and the deserts of the Alxa Plateau (Xuan & Sokolik, 2002). It is important to make a distinction between a "sand storm" and a "dust storm." All sand storms blow some dust, but a "dust storm" doesn't mean that sand is being blown as well. The issue is particulate size (Squires, 2002). Higher wind speeds are needed to loft sand grains even centimeters above the ground. As a result, wind blown sand usually moves as if were on a conveyer belt in a process called "creep" (Squires, 2002). Individual grains move only a short distance, but whole dune fields can migrate in this way. Fine dust on the other hand can be lofted to great heights and then blown downwind hundreds or even thousands of kilometers. The result is that dust, not sand, is what typically reaches eastern China even during major wind storms.

12
Down from the North (with a strong turn east across Mongolia)
The People's Daily reported that this storm, the season's first dust storm to hit Beijing, was one of the earliest on record and among the worst in memory. It is also one of the best documented (Liu, et al., 2004). The center of the intense low pressure system (above and left of center) that created this storm is over eastern Mongolia. The Shandong Peninsula is below and left of center.
(April 7, 2001 image courtesy of the French space agency—CNES)

13
MODIS image of April 7, 2001 dust storm: Web Reference http://earthobservatory.nasa.gov/IOTD/view.php?id=8341

14
Dust Storm of April 7, 2001
This picture shows the streets of the city of Baicheng, just west of Harbin in Heilongjiang Province, during the dust storm of April 7, 2001 (Image by Zev Levin). Baicheng was in the direct path of the storm. The dust from this storm later traveled all the way across North America. On April 18, 2001, scientists at the National Oceanic and Atmospheric Administration (NOAA) laboratory in Boulder, Colorado, reported that a huge dust storm from northern China (the one pictured above) had reached the United States "blanketing areas from Canada to Arizona with a layer of dust." (Brown, 2001)
Web References http://www.nrlmry.navy.mil/aerosol/Case_studies/20010413_epac/
http://science.nasa.gov/science-news/science-at-nasa/2001/ast17may_1/
http://www.commondreams.org/views01/0524-05.htm

15
This map shows the location and average number of days with dust storms per year in Mongolia over the last 30 years (Natsagdorj, et al., 2003).
This map shows the location and number of days per year with wind speeds equal to or greater than 17m/s (38 mph) in north-central China (Wang, et al., 2004). The windiest areas are just west of the Hunshandake sandy lands, and northern Gansu/western Inner Mongolia. Wang et al. also show that the Badain Jaran Desert of western Inner Mongolia has had the greatest number of dust storms annually from 1954 to 2000. Comparing the two data sets shows that the portion of the Gobi Desert that spans the central border between China and Mongolia has experienced the greatest number of dust storms over the last 30 years.

16
This image shows a massive low pressure cyclone northeast of the Aral Sea in Kazakhstan. A dust storm has formed in the zone of greatest pressure gradient, and, therefore, strongest winds, below and right of center beneath the edge of the clouds. The red pixels are fires. (MODIS/Terra image from May 2, 2007)
17
This enlarged MODIS/Terra image from November 10, 2002, 03:35 UTC, shows the beginning of a dust storm over the central Gobi Desert on the border between Mongolia and China. As in the previous image, this storm was formed by an intense low pressure cyclone. The center of low pressure is above and to the east. The difference here is that a strong cold front is flowing into the low pressure from northwest of Lake Baikal. This storm was unusual in that most dust storms in northern China occur in the spring or summer (Wang, et al., 2004). Note that there are two plumes of dust, one on the south that originates on the Badain Jaran Playa in China, and one on the north across the central Gobi Desert in Mongolia. The jagged line running from left to right is the border between Mongolia and China's province of Inner Mongolia. Hohhot, the capital of the province of Inner Mongolia, is covered by clouds in the lower right corner.
Web Reference http://visibleearth.nasa.gov/view.php?id=63315

18
API for Hohhot from Nov. 20th (left) to Nov. 1st of 2002
The Air Pollution Index (API) signal of this dust storm when it reached Hohhot at 40.8N, 111.7E is from the 11th. The peak from noon the 10th to noon the 11th was 500 (readings are taken at noon each day). The real value, however, is probably much greater than this, because the reporting scale stops at 500. Also the API for particulates is measured in micrograms of particles less than 10 microns (called PM10) per cubic meter of air, which means that particulates of greater size, as one would expected in a dust storm, are not included.
Data from China's State Environmental Protection Administration (SEPA now MEP)

19
This MODIS/Terra image from November 10, 2002, 03:35 UTC, is a regional view of the low pressure system. The point source of the southern plume of dust (left edge below center) is the dry lake bed of Gaxun Nur at 42.4N, 100.7E, at the north end of the Badain Jaran Playa. The top left corner of the image is just southwest of Lake Baikal. The North China Plain is in the lower right.

20
By November 11, 2002, 02:40 UTC, as this MODIS/Terra regional image shows, the cold front had occluded, or cut off, the low pressure system and pushed the dust front east toward the Korean Peninsula and south across China.
21
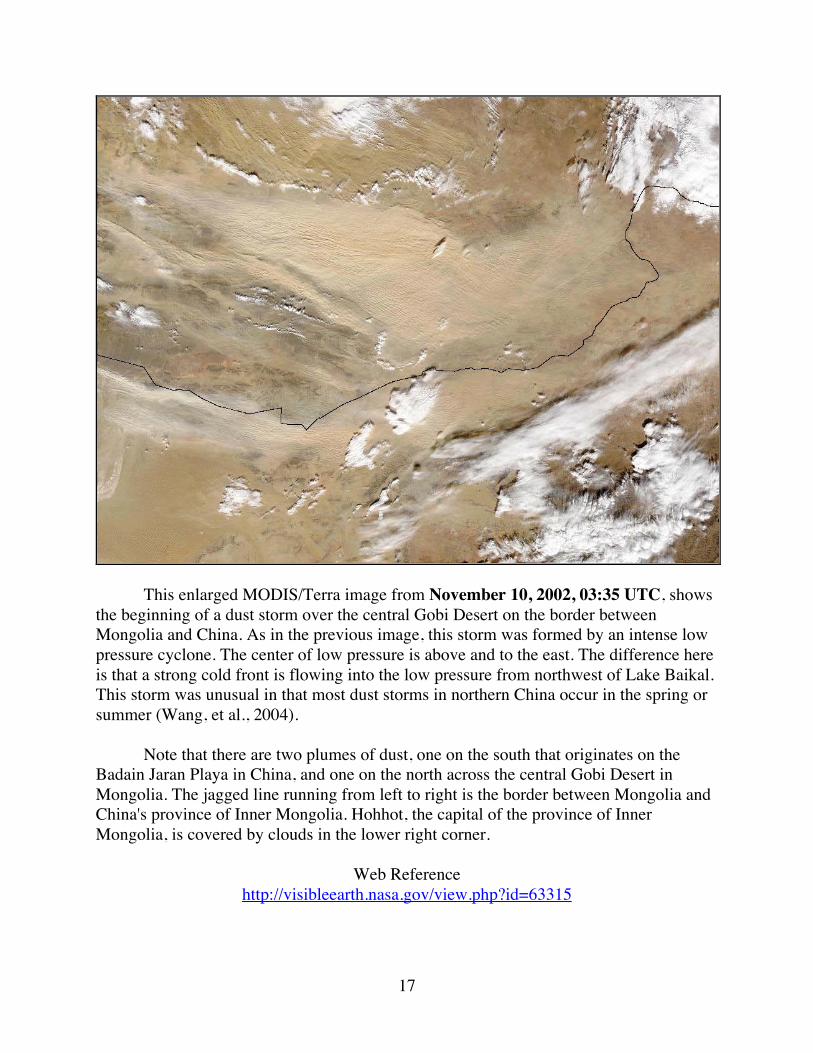
This enlarged November 11, 2002, 02:40 UTC, MODIS/Terra image, with coastlines and national borders outlined, shows the dust storm blowing east toward Korea and south over the North China Plain. Note the Shandong Peninsula in the center of the image. Beijing's API peaked at 452 on the 11th. Bottom center of the image shows smog over the Yangtze River basin and Shanghai. The plume of dust reached Shanghai the 12th, and peaked the city's API at 355 on the 13th.

22
Above is a MODIS/Terra enlarged image of the start of a Gobi dust storm on March 27, 2004, 03:40 UTC. According to the Chinese news agency an estimated 70 million people in 11 provinces were affected by this multi-regional dust and sand storm on March 27 and 28, 2004. Note the smaller dust plume from the northern Badain Jaran Desert lower left. This storm was extensively studied by John Gu and colleagues at George Mason University, VA and NASA's Goddard Space Flight Center, MD. In their study, they developed a new remote sensing algorithm to better distinguish dust clouds from water vapor clouds in MODIS satellite images (Qu, J. J., et al., 2006).

23
This is a MODIS/Terra area view of the storm on March 27, 2004, 03:40 UTC. The low pressure center is above and left near 45N, 110E. The blue latitude and longitude lines are 40N and 100, 110 to 120E. Note that 10 degrees longitude at 40N is 853 km (530 mi), and from 40N to 50N is 1111 km (691 mi). This means the area shown above spans over 1700 km W-E, and roughly 1000 km N-S.

24
Above is a MODIS/Terra regional image taken March 28, 2004, 02:45 UTC, that shows the center of the low pressure cyclone near 47N, 121E. The blue latitude and longitude lines are 40 to 50N and 120 to 130E. Beijing reached an API of 338 on the 28th because of dust from this storm.

25
This MODIS/Aqua image, captured March 30, 2007, 06:00 UTC, of southeast Mongolia and China's province of Inner Mongolia shows the start of China's first major dust storm of 2007. The are several similarities between this storm and the one that occurred on November 10, 2002. The first is that the Badain Jaran Playa (lower left edge) is, again, the source area for a southern dust plume. The second is a larger northern plume of dust across the central Gobi Desert moving into eastern Inner Mongolia.
Web Reference http://earthobservatory.nasa.gov/NaturalHazards/view.php?id=18184

26
Above is a regional MODIS/Aqua image, from March 30, 2007, 06:00 UTC, that shows the center of the low pressure cyclone near 47N, 110E. The blue latitude and longitude lines are 40 to 50N and 100, 110 to 120E.
27
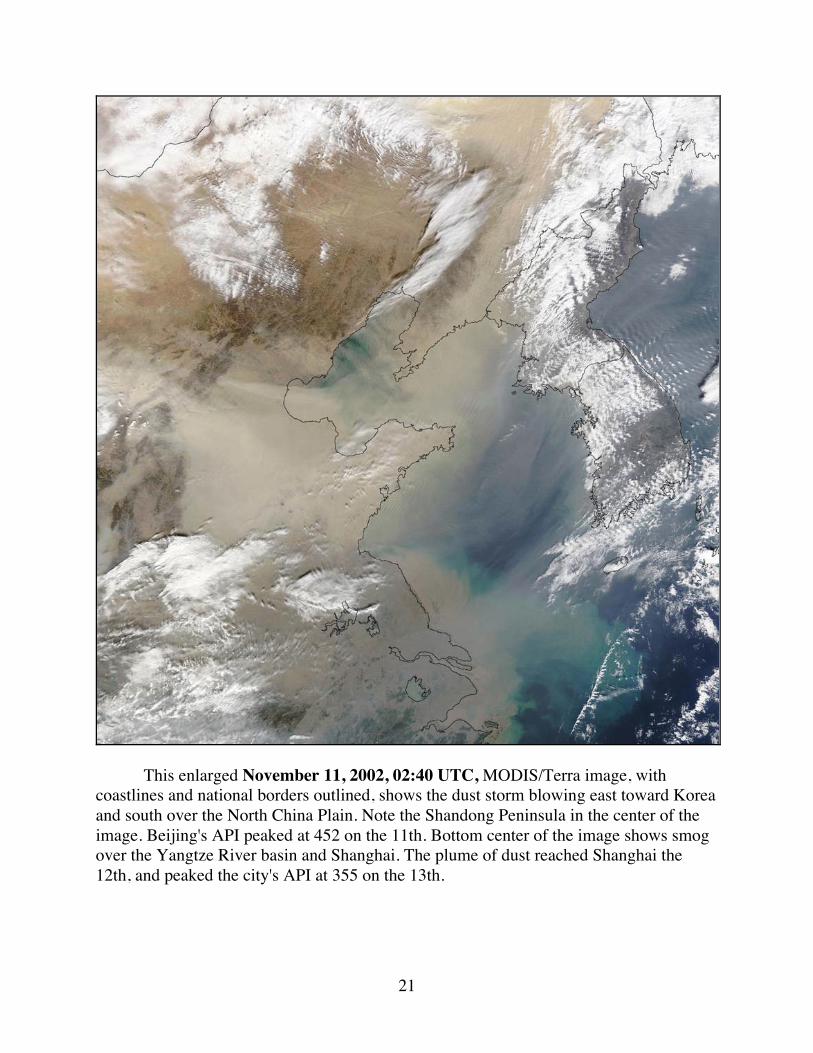
This March 30, 2007, 18:00 UTC weather satellite image was captured twelve hours after the previous MODIS/Aqua image. It shows the low pressure system, now centered at ~ 45N, 116E, over northern China directly north of Beijing. At this point the low pressure cyclone is being intensified by cold fronts from, both, out of the north and out of the west.
(Infrared image courtesy of the Japan Meteorological Agency)
Web reference http://www.jma.go.jp/en/gms/

28
In this MODIS/Terra, March 31, 2007, 03:20 UTC image a major front from the west (below center) has plunged into the dust front and produced the confusion of dust plumes shown on the left. The blue latitude and longitude lines are 40N to 50N and 110 to 120E. Note the clear skies over Beijing at ~ 40N, 116E and the Yanshan mountains just to the north. Also note that the Shandong Peninsula in the lower left is completely obscured by dust.

29
An hour and a half later on March 31, 2007, 05:00 UTC, this MODIS/Aqua image shows the front bulging to the east and revealing the Shandong Peninsula. The center of the low pressure system in the upper right is being occluded by cold dust laden air moving under the warmer white clouds above. The blue latitude and longitude lines are 40N and 110, 120 and 130E. Note that the dust front has just reached the Korean Peninsula which is covered with clouds in the lower right.

30
The same March 31, 2007, 05:00 UTC MODIS/Aqua image labeled for reference.
http://earthobservatory.nasa.gov/NaturalHazards/view.php?id=18217

31
This April 1, 2007, 02:25 UTC, MODIS/Terra image shows the cold front from the west blowing across the Korean Peninsula and the Sea of Japan to Japan's main island just south of 40° north latitude. The blue latitude and longitude lines are 40N and 120, 130 and 140E. The Korean Peninsula (below center) is covered with dust in this image.

32
Some Conclusions Most severe multi-regional dust storms in China form when strong cold fronts combine with intense low pressure cyclones. The resulting push-pull of winds rushing from high pressure to low pressure produces very strong winds. The key elements are, however, the timing and location of the high and low pressure systems. Over northern China the equivalent of a "prefect storm" forms when an intense low pressure cell moves over eastern Mongolia and combines with a powerful cold front coming from the northwest. The storms of April 7, 2001, November 11, 2002, and March 27, 2004 are classic examples of this type of weather system. The storm of April 10, 2006, was an extreme departure from this pattern. First a powerful cold front roared out of the Tarim Basin into the central deserts. Then an equally powerful warm front blasted up from southeast China pushing winds north across the Ordos Plateau to eastern Russia carrying dust with them. As a result, eastern China received almost no dust from this storm. The storm of March 31, 2007, was yet another variation. As the storm began on March 30, 2007, a low pressure cyclone had set up over eastern Mongolia and a cold front had surged out of the Lake Baikal region toward it. By early the 31st, as the low pressure cell was being occluded, a cold front blasting out of the Tarim Basin struck the dust front. By April the 1st, the cold front from the west had pushed dust over the Korean Peninsula to Japan. The March 31, 2007, combination of weather systems produced a chaotic set of dust plumes over eastern China as shown in the previous satellite images. However, it is possible to use air pollution indices to follow the movement of dust fronts during severe multi-regional dust storms. On the following page is a chart of API readings taken during this storm that tracks the dust from Chifeng (42.27N) and Hohhot in the northwest to Shanghai and Ningbo (29.87N) in the southeast. Note that there were two major plumes of dust, one north that hit from Chifeng to Dalian, and one on the south that struck Hohhot and Datong, then Jinan, Qingdao, and Lianyungang, before reaching Shanghai and Ningbo.

33
API Plot of the Dust Event from March 30 to April 3, 2007
noon noon noon noon noon Cities (NW-SE) 3-30 to 3-31 to 4-01 to 4-02 to 4-03
Harbin 81 62 42 50 50 Changchun 78 57 91 64 57 Chifeng 84 500 148 63 58 Shenyang 91 63 113 49 59 Anshan 89 72 169 62 75 Dalian 48 86 500 60 48 Hohhot 63 500 75 51 51 Datong 65 423 85 61 66 Beijing 66 103 63 48 40 Tianjin 45 62 178 93 38 Jinan 100 172 358 84 71 Qingdao 73 64 379 260 79 Lianyungang 82 54 500 140 67 Shanghai 117 116 125 500 212 Ningbo 98 94 97 368 335 Hangzhou 95 147 106 183 174 Red = Grade 5 Blue = above normal
Data from China's State Environmental Protection Administration

34
Dust over Shanghai April 2, 2007
Because of the complexity of landforms and weather systems, Beijing was only slightly affected by the dust storm of March 30 to April 3, 2007. In contrast, the storm affected Shanghai more than any dust storm in the last five years (API 355 on November 13, 2002, versus >500 for this storm), and reached at least as far south as Ningbo at 30° north latitude. In 2005, a paper in the journal Nature (Liu & Diamond, 2005) examined China’s changing environment. Partially worsened by human actions such as overgrazing and grassland degradation, dust storms began to increase in the 20th century. Between AD 300 and 1949, northeastern China saw a dust storm on average every 31 years. After 1990, the average jumped to one such storm per year. According to news reports at the time this storm hit, the average rate of dust storms for the Beijing region in northeastern China was five or six a year.
(Photograph courtesy of Jongo News)

35
References
Brown, L. (2001, May 24). Dust Bowl Threatening China's Future. Earth Policy Institute, Common Dreams News Center. Last accessed 2007-10-8: Ci Longjun (2002). Disasters of strong sandstorms over large areas and the spread of land desertification in China. In Yang Youlin, Victor Squires & Lu Qi (Eds.), Global Alarm: Dust and Sandstorms from the World's Drylands, (pp. 215-254). New York: United Nations. Liu, J., et al. (2004). An Intensive Mongolian Cyclone Genesis Induced Severe Dust Storm. TAO, 15, 5(Dec), 1019-1033. Liu, J., & Diamond, J. (2005). China’s Environment in a Globalizing World. Nature. 435(June 30), 1179-1186. Natsagdorj, L., et al. (2003). Analysis of dust storms observed in Mongolia during 1937–1999. Atmospheric Environment, 37, 1401–1411. Squires, Victor R. (2002). Dust and sandstorms: an early warning of impending disaster. In Yang Youlin, Victor Squires & Lu Qi (Eds.), Global Alarm: Dust and Sandstorms from the World's Drylands, (pp. 15-73). New York: United Nations. Qu, J. J., et al. (2006). Asian Dust Storm Monitoring Combining Terra and Aqua MODIS SRB Measurements. IEEE Geoscience and Remote Sensing Letters, 3, 4(Oct), 484-486. Wang, X., et al. (2004). Modern dust storms in China: an overview. Journal of Arid Environments, 58, 559–574. Xuan, J., & Sokolik, I. N. (2002). Sources of wind-blown dust in Northern China: towards developing an Asian Dust Databank. In : Lee, J. A. and Zobeck, T. M., (Eds.), Proceedings of ICAR5/GCTE-SEN Joint Conference, International Center for Arid and Semiarid Lands Studies. Lubbock, TX: Texas Tech University, USDA Pub. 2-02, 357.
----------------------------
For further information on related topics go to:
Global Ecology and Remote Sensing http://fire.biol.wwu.edu/trent/alles/GlobalEcologyindex.html
Alles Biology Home Page http://fire.biol.wwu.edu/trent/alles/index.html
Recommended