
Geobiology 2013 Lecture 12
The Climate History of Earth
1 Proterozoic events- this lecture
Phanerozoic Climate later-maybe
Images courtesy of NASA
1
Need to know Timing of 5 periods of extreme climate in Earths history
Elements of Snowball Earth Theory
Evidence for widespread low latitude glaciations at end of Precambrian
Scenarios to enter extreme climate states
Scenarios to escape
Possible role in evolution of multicellular complex life
2
Assigned Readings Hoffman amp Schrag Snowball Earth Scientific American January 2000
Hoffman amp Schrag The snowball Earth This image has been removed due to copyright restrictions hypothesis testing the limits
of global change Terra Nova 2002 Stanley pp 84-101 amp 288-289
See also httpwwwsnowballearthorg
3
Extras
Kump LR Kasting JF and Crane RG (1999) The Earth System Chap 7
Royer DL Berner RA Montanez IP Tabor NJ and Beerling DJ CO2 as a primary driver of Phanerozoic climate GSA Today March 2004 pp 4-10
Lubick (2002) Nature Vol 417 12-13
Hoffman PF 2008 Snowball Earth status and new developments GEO (IGC Special Climate Issue) 11
Images courtesy of NASA44-46
Animals and the invention of the Phanerozoic Earth System Nicholas J Butterfield
Trends in Ecology and Evolution February 2011 Vol 26 No 2
4
Recap on O2-Paradigm bull The C-cycle has evolved radically through time
bull Prior to 22 Ga anaerobic prokaryotes dominatedwide spread of δorg (δo) values oxygenicphotosynthesis extant but oxygen remained low assinks gtgt sources
bull Mantle may have been an important sink forelectrons ie oxidising power (CloudHolland)
bull Extreme δcarb (δa) values around 22 Ga probablysignify the GOE and rise to prominence ofaerobes Decreased spread of δorg (δa) valuesmay reflect dominance of aerobic autotrophs andreductive pentose (Benson-Calvin C3) cycle
5
Recap on O2-Paradigm bull Although ample evidence for aerobes the
abundance of O2 in atm and ocean remained low (sulfidic ocean) until another major oxidationevent caused a second reorganization In the Neoproterozoic This was also signified by extreme δa fluctuations
bull The Neoproterozoic reorganization culminated in pO2 rising to near PAL allowing animals toflourish and stabilizing of the new regime
bull Environmental evolution reflected changes in thebalance between thermal crustal atmospheric ampbiological processes
6
This image and its caption have been removed due to copyright restrictions
Please see Figure 1 in A D Anbar and A H Knoll Proterozoic Ocean Chemistry and Evolution A Bioinorganic Bridge Science 2002 297 1132
7
GSA Bulletin September 2005 v 117 no 9-10 p 1181-1207 Toward a Neoproterozoic composite carbon-isotope record Galen P Halverson Paul F Hoffman Daniel P Schrag Adam C Maloof and A Hugh N Rice
8
Image courtesy of the Geological Society of America Used with permission
GSA Today Volume 14 Number 3 March 2004
9
Image courtesy of the Geological Society of America Used with permission
Outline bullOverview of Earths climate history
bullClimate feedbacks what keeps climate away from extremes Planetary Energy Balance Greenhouse Effect Geochemical Carbon Cycle CO2 Temperature Precipitation-Weathering Feedback
bullCase studiesNeoproterozoic glaciations (750-580 Ma) bullhttpwwwsnowballearthorg Permo-carboniferous Glaciations (300-275 Ma) Mesozoic Warmth (245-65 Ma) Cenozoic Cooling (100-0 Ma) Pleistocene Glaciations (05-0 Ma)
10
Mostly sunny with a 10 chance of snow Earths Climate History
Images courtesy of NASA
11
This image has been removed due to copyright restrictions
Climate Controls - Long amp Short Timescales
bullSolar output (luminosity) 109 yr
bullContinental drift (tectonics) 108 yr
bullOrogeny (tectonics) 107 yr
bullOrbital geometry (Earth -Sun distance) 104-105 yr
bullOcean circulation (geography climate) 101 -103 yr
bullComposition of the atmosphere (biology tectonics volcanoes) 100-105 yr
12
Faint Young Sun Paradox
Faint Young
Sun Paradox
4 1H--gt4He Incr density=
incr luminosity
Liquid H2O existed gt4 Ga (sed rocks life zircon δ18O)
13
Contemporary Solar Variability
Image removed due to copyright restrictions
Please see Fig 9 in Froumlhlich C ldquoSolar Irradiance Variability Since 1978rdquo Space Science Reviews 125 (August 2006) 53-65
bullContemporary Solar Variability ~01 bullAssociated with 11-year sunspot cycle
14
Energy Balance S= solar flux
T = effective radiating temperature
A= albedo or reflectivity as a fraction of incident radiation
RE = earth radius
Stefan_Boltzmann law Energy Flux = const T4
Const σ = 567 10-8 wm2K4
The StefanndashBoltzmann law states that the total energy radiated per unit surface area of a black body in unit time (known variously as the black-body irradiance energy flux density or radiant flux j is directly proportional to the fourth power of the black bodys absolute temperature)
Adapted from Kump et al (1999)
15
Therefore Lower S must have been compensated by larger
greenhouse effect
16
Greenhouse Gases
Those that absorb IR radiation efficiently N2O CO2 CH4 H2O
17
Image removed due to copyright restrictions
Please see Fig 1 in Hofmann D J et al ldquoTracking Climate Forcing The Annual Greenhouse Gas Indexrdquo Eos 87 (November 14 2006) 509-511
18
Image removed due to copyright restrictions
Please see Fig 2 in Hofmann D J et al ldquoTracking Climate Forcing The Annual Greenhouse Gas Indexrdquo Eos 87 (November 14 2006) 509-511
19
How much CO2 Required for TS gt 0degC
Image removed due to copyright restrictions
Please see Fig 2 in Kasting James F ldquoEarthrsquos Early Atmosphererdquo Science 259 (February 12 1993) 920-926
httpwwwgeoscpsuedu~kastingPersonalPage PdfScience_93pdf
Venus Same qty of C as Earth All in atmos -gt TS lt 450degC
20
Mostly sunny with a 10 chance of snow Earths Climate History
Images courtesy of NASA
What caused these climate perturbations
21
This image has been removed due to copyright restrictions
Steady State amp Residence Time Steady State Inflows = Outflows
Any imbalance in I or O leads to changes in reservoir size
Inflow Atmospheric CO2
760 Gton C
Outflow 60 Gton Cyr 60 Gton Cyr
Respiration Photosynthesis
1 Gton = 109 1000 kg = 1015 g
The Residence time of a molecule is the average amount of time it is expected to remain in a given reservoir
Example tR of atmospheric CO2 = 76060 = 13 yr
22
The Biogeochemical
Carbon Cycle
23
----------------------------------------------
+ H2O
-------------------------------------
Chemical Weathering = chemical attack of rocks by dilute acid
C O2 + H2O lt---gt H2CO3
1 Carbonate Weathering The - BiogeochemicalC a C O3 + H2CO3 --gt Ca2+ + 2 HCO3
Carbon Cycle 2 Silicate Weathering
C a S i O3 + 2 H2CO3 --gt Ca2+ + 2HCO3- + SiO2
bull 2x CO2 consumption for silicates
bull Carbonates weather faster than silicates
24
Carbonate Image removed due to copyright restrictions rocks weather
faster than silicate rocks
25
Products of Image removed due to copyright restrictions weathering
Please see Kump L R et alThe Earth System Upper Saddle River NJ Pearson Prentice Hall 1999 precipitaed as
CaCO3 amp SiO2 in ocean
26
-------------------------------------
Net Reaction of Rock Weathering +
Carbonate and Silica Precipitation in Ocean
CaSiO3 + CO2 --gt CaCO3 + SiO2
bull CO2 consumed (~ 003 Gt Cyr)
bull Would deplete atmospheric CO2 in 20 kyr
bull Plate tectonics returns CO2 via Volcanism and Metamorphism
Carbonate Metamorphism
C a C O3 + SiO2 --gt CaSiO3 + CO2
bull CO2 produced from subducted marine sediments
Net reaction of
geochemical carbon cycle
(Urey Reaction)
27
Image removed due to copyright restrictions
Please see Fig 10-11 in Stanley (course text)
Carbonate-Silicate Geochemical Cycle
bullCO2 released from volcanism dissolves in H2O forming carbonic acid H2CO3
bullH2CO3 dissolves rocks
bullWeathering products transported to ocean by rivers
bullCaCO3 precipitation in shallow amp deep water
bullCycle closed when CaCO3 metamorphosed in subduction zone or during orogeny
28
bull Geologic record indicates climate has rarely reached or maintained extreme Greenhouse or Icehouse conditions
bull Negative feedbacks between climate and Geochemical Carbon Cycle must exist
bull Thus far only identified for Carbonate-Silicate Geochemical Cycle
Temp rainfall enhance weathering rates (Walker et al 1981)
(Ie no obvious climate dependence of tectonics or organic carbon geochemical cycle)
How are CO2 levels
kept in balance
Feedbacks
Adapted from Kump et al (1999)
29
The Proterozoic Glaciations
(Snowball Earth)
httpwwwsnowballearthorg
Images courtesy of NASAReading bullHoffman amp Schrag (2002) Terra Nova Vol 14(3)129-155 bullLubick (2002) Nature Vol 417 12-13
30
Figure 1 (A) Present-day locations of the Neoproterozoic successions
GSA Bulletin September 2005 v 117 no 9-10 p 1181-1207 Toward a Neoproterozoic composite carbon-isotope record Galen P Halverson Paul F Hoffman Daniel P Schrag Adam C Maloof and A Hugh N Rice
31
Image courtesy of the Geological Society of America Used with permission
f organic-C buried
13C fractionation εTOC
δ13C limestones
δ13C marine organic matter
750 Ma 720 Ma 580 Ma
MarinoanVaranger Sturtian glacial(s) glacial(s)
Carbon Isotopic Excursions 800-500Ma
What caused these massive
perturbations to the carbon cycle during the late Proterozoic
Hayes et al Chem Geol 161 37 1999
32
Courtesy Elsevier Inc httpwwwsciencedirectcom Used with permission
Neoproterozoic Glaciations Evidence
3-4 global glaciations followed by extreme greenhouses 750-580 Ma bullHarland (1964) Kirschvink (1992)
bullHoffman et al (1998) Science v 281 1342-6 Hoffman amp Schrag (2000) Sci Am Jan 68-75
Image removed due to copyright restrictions
Please see Fig 3 in Hoffman Paul F and Schrag Daniel P ldquoSnowball Earthrdquo Scientific American 282 (January 2000) 68
Snowball-related Events bullBreakup of equatorial supercontinent 770 Ma bullEnhanced weathering from increased rainfall (more land close to sea) bullDrawdown atmospheric CO2 Global cooling bullRunaway albedo effect when sea ice lt 30deg latitude bullGlobal glaciation for ~10 Myr (avg T ~ shy50degC) bullSea ice ~1000 m thick geothermal heat flux (007 Wm2) keeps ocean liquid
33
Tillites GeologicPacked pebbles sand amp Evidencemud Remnants of moraines for Glaciers
Copyright Marli Miller University of Oregon Image from Earth Science World Image Bank httpwwwearthscienceworldorgimages Used with permission
Glacial Striations Scratches from rocks dragged by moving ice
Courtesy Walter Siegmund Image from Wikimedia Commons httpcommonswikimediaorg
Used with permission
Dropstones Rocks transported by icebergs which melt releasing load into finely laminated sediment (IRD)
Copyright Bruce Molnia Terra Photographics Image from Earth Science World Image Bank Kump et al (1999)httpwwwearthscienceworldorgimages
Used with permission
34
Glacial sediments ndash poorly sorted angular clasts including dropstones ndash Namibia c 750 Ma
Courtesy Daniel Schrag Used with permission
35
Image removed due to copyright restriction
Please see Fig 2 in Hoffman Paul F and Schrag Daniel P ldquoThe Snowball Earth Hypothesis Testing the Limits of Global Changerdquo Terra Nova 14 (2002) 129-155
Neoproterozoic Glacial Deposits
From Norway Mauritania NW Canada Namibia Australia Oman
bullGlacial striations bullDropstones bullDiamictites bullAnomalous Iron Formations
36
Equatorial Continents
Image removed due to copyright restrictions
Please see Fig 1 in Hoffman Paul F and Schrag Daniel P ldquoSnowball Earthrdquo Scientific American 282 (January 2000) 68
bullHarland amp Rudwick (1964) identified glacial sediments at what looked like equatorial latitudes by paleomagnetism bullGeorge Williams (1975) identified low a latitude glacial sequence in S Australia amp attributed to episode of extreme obliquity (tilt)
37
Determining Paleolatitude from Remnant Magnetism
bullPaleomagnetism latitude of formation of rock
bullNatural Remnant Magnetism (NRM) inclination varies with magnetic latitude -vertical magn poles -horz magn equator (many Neoprot glac deposits)
bullMagn polar drift avgs out on T~10 ky
Image from P Hoffman
38
This image has been removed due to copyright restrictions
Paleolatitude from
Paleomagnetism Image removed due to copyright restriction
Please see Fig 1 in Hoffman Paul F and Schrag Daniel P ldquoThe Snowball Earth Hypothesis Testing the Limits of Global Changerdquo Terra Nova 14 (2002) 129-155
39
What can explain glaciers on all continents when they
appear to have been close to the equator
40
High Obliquity Hypothesis
George Williams (1975)
bullEarths tilt (obliquity) controls seasonality bullAt high tilt angles (gt 54deg) the poles receive more mean annual solar radiation than the tropics (sun constantly overhead in summer) bullGlaciers may be able to form at low latitudes Problems bullEven the tropics get quite warm at the equinoxes bullMoon stabilizes obliquity bullWould need v large impact to destabilize moon orbit doesnt support this Image from P Hoffman
41
This image has been removed due to copyright restrictions
Snowball Earth Hypothesis ~3-4 global glaciations followed by extreme greenhouses 750-580 Ma
bullHarland (1964) Williams 1976-86 Kirschvink (1992) bullHoffman et al (1998) Science v 281 1342-6 Hoffman amp Schrag (2000) Sci Am Jan
68-75 Snowball Events
bullBreakup of equatorial supercontinent 770 Ma bullEnhanced weathering from increased rainfall (more land close to sea) bullDrawdown atmCO2 Global cooling bullRunaway albedo effect when sea ice lt 30deg latitude bullGlobal glaciation for ~10 Myr (avg T ~ -50degC) bullSea ice ~1000 m thick geothermal heat flux (007 Wm2) keeps ocean
Images courtesy of NASA liquid
42
Image removed due to copyright restrictions
Please see Fig 2 in Hoffman Paul F and Schrag Daniel P ldquoSnowball Earthrdquo Scientific American 282 (January 2000) 68
lsquoProloguersquo to
Snowball
bullBreakup of equatorial supercontinent bullEnhanced weathering from increased rainfall (more land close to sea) + carbon burial bullDrawdown atmospheric CO2 Global cooling
bullIs this enough
43
Image removed due to copyright restrictions
Please see Fig 2 in Hoffman Paul F and Schrag Daniel P ldquoSnowball Earthrdquo Scientific American 282 (January 2000) 68
Deep Freeze
bullGlobal cooling causes sea ice margin to move equatorward
bullRunaway albedo effect when sea ice lt30deg latitude
bullEntire ocean possibly covered with ice
44
Budyko-Sellers Runaway Albedo
Feedback
1 Eq continents incr weathering lowers CO2 slow cooling equatorward movement of ice
2 Runaway albedo 3 Slow buildup of CO2
from volcanoes 4 Rapid decay of ice in
102 yr High Ts from enhanced H20-T feedback
5 Slow CO2 drawdown from weathering
Image from P Hoffman
45
This image has been removed due to copyright restrictions
Profiles of the 1998 Blue Planet Prize Recipients
Dr Mikhail I Budyko ((Д-р ΜИ Будыко) (Born in January 1920 in Gomel in the former Soviet Union (now Belarus) Head of the Division for Climate Change Research State Hydrological Institute St Petersburg
As shown by the unusual weather patterns caused by the El Nino effect a wide spectrum of climate changes on Earth is having a profound effect on human lives and the environment Since the 1970s great advances have been made in climatology the scientific study of the close relationship between climate and the environment Playing a pivotal role in the development of climatology has been Dr Mikhail I Budyko one of this years winners of the Blue Planet Prize In the 1950s Dr Budyko conducted quantitative studies of the global climate by calculating the heat balance of the Earths surface This balance involves energy from the sun which is the most important determining factor for the Earths climate First Dr Budyko calculated the energy balance of certain regions of the Earth and then he verified his calculations by making comparisons with observational data Next using weather data collected from all over the world Dr Budyko carried out heat balance calculations for all regions of the world and confirmed that they checked out with observational data He announced his findings in 1956 with the publication of his book Heat Balance of the Earths Surface
46
Image removed due to copyright restrictions
Please see Fig 3 in Hoffman Paul F and Schrag Daniel P ldquoSnowball Earthrdquo Scientific American 282 (January 2000) 68
Snowball Peak
bullGlobal glaciation for ~10 Myr (avg T ~ -50degC)
bullSea ice ~1000 m thick geothermal heat flux (007 Wm2) keeps ocean liquid
47
Breaking out of the Snowball
bullVolcanic outgassing of CO2 over ~106 yr may have
Image removed due to copyright restrictions increased greenhouse effect Please see Fig 2 in Lubick sufficiently to melt back theNaomi ldquoPalaeoclimatology Snowball Fightsrdquo Nature 417 ice(May 2 2002) 12-13
48
Bring on the Heat Hothouse follows
Image removed due to copyright restrictions
Please see Fig 3 in Hoffman Paul F and Schrag Daniel P ldquoSnowball Earthrdquo Scientific American 282 (January 2000) 68
Snowball Hothouse Events
bullSlow CO2 buildup to ~350 PAL from volcanoes bullTropical ice melts albedo feedback decreases water vapor feedback increases bullGlobal T reaches ~ +50degC in 102 yr bullHigh T amp rainfall enhance weathering bullWeathering products + CO2 = carbonate precipitation in warm water
49
Evidence for Snowball Earth Hypothesis
bullStratigraphy globally-dispersed glacial deposits
bullCarbon isotopes negative δ13C excursions through glacial sections (δ13C reaches ~ -5 to -7permil) Little or no biological productivity (no light)
bullAnomalous banded iron formations wIRD only BIFs after 17 Ga Anoxic seawater covered by ice
bullCambrian explosion Rapid diversification of multicellular life 575-525 Ma expected to result from long periods of isolation and extreme environments (genetic bottleneck and flush)
50
Carbon Isotopic Evidence for Snowball δ13C values of -5permil (mantle value) consistent with dead ice-covered
ocean
Image from P Hoffman
51
This image has been removed due to copyright restrictions
Carbon Isotope
Fractionation
bullAs fraction of organic carbon buried approaches zero δ13C of CaCO3 approaches mantle (input) value
Image from P Hoffman
52
This image has been removed due to copyright restrictions
f organic-C buried
13C fractionation εTOC
δ13C limestones
δ13C marine organic matter
Carbon Isotopic Excursions 800-500Ma
More complete sediment record
+
Improved chronology
=
More detailed picture showing abrupt and extreme
C-isotopic shifts
A global composite of 13C data shows 4 excursions
Plus one at the pC-C boundary
Hayes et al Chem Geol 161 37 1999
53
Courtesy Elsevier Inc httpwwwsciencedirectcom Used with permission
This image has been removed due to copyright restrictions
Please see Figure 2 Details -gt
Calibrating the Cryogenian Francis A Macdonald Mark D Schmitz James L Crowley Charles F Roots David S Jones Adam C Maloof Justin V StraussPhoebe A Cohen David T Johnston Daniel P Schrag SCIENCE VOL 327 5 MARCH 2010
Fig 2 Neoproterozoic composite carbonate d13C chemostratigraphy with U-Pb ID-TIMS ages that are directly linked to isotopic profiles (11) Bars indicate the time spans of fossil assemblages representing eukaryotic crown groups Asterisks indicate fossil groups of uncertain taxonomic affinity Bars faded upward reflect uncertainty in the minimum age constraint bars faded downward reflect uncertainty in the maximum age constraint Dashes represent the time span where a fossil record has not been identified but for which the eukaryotic groups presence is inferred from its occurrence in Ediacaran or Phanerozoic strata Dashes with question marks indicate that earlier records have been proposed but the relationships between these fossils and the crown groups are uncertain
54
Anomalous Banded Iron Formations
bullAfter a ~1 Gyr absence BIFs return to the geologic record
bullImplies an anoxic ocean
bullConsistent with ice-covered ocean
Image from P hoffman
55
This image has been removed due to copyright restrictions
BIF + Dropstone = Ice-covered anoxic ocean
McKenzie Mtns Western Canada Image from P Hoffman 56
This image has been removed due to copyright restrictions
Animal Radiation Response to genetic
bottlenecks amp flushes
Image from P Hoffman
57
This image has been removed due to copyright restrictions
One Complete Snowball-Hothouse Episode
Image from P Hoffman
58
This image has been removed due to copyright restrictions
The Geochemical Carbon Cycle
Image from P Hoffman 59
IThis image has been removed due to copyright restrictions
Geologic Evidence for Hothouse Aftermath Cap Carbonates
Thick sequences of inorganically precipitated CaCO3 overly all
Neoproterozoic glacial deposits
60
Image removed due to copyright restriction
Please see Fig 3 in Hoffman Paul F and Schrag Daniel P ldquoThe Snowball Earth Hypothesis Testing the Limits of Global Changerdquo Terra Nova 14 (2002) 129-155
Neoproterozoic Cap Carbonates-1
bullThick sequences of inorganically precipitated carbonate minerals overly Late Proterozoic glacial deposits bullConsistent with massive flux of weathering products to ocean in snowball aftermath
61
Cap Carbonates 3
Image removed due to copyright restriction
Please see Fig 5c in Hoffman Paul F and Schrag Daniel P ldquoThe Snowball Earth Hypothesis Testing the Limits of Global Changerdquo Terra Nova 14 (2002) 129-155
bullNamibia
62
Glacial Deposit Overlain by Cap
Image removed due to copyright restrictions Carbonate in Please see Prof Hoffmans site on the Snowball Earth hypothesis httpwwwsnowballearthorg Namibia (~700 Ma)
Hoffman amp Schrag (2000)
63
Image removed due to copyright restriction
Please see Fig 9 in Hoffman Paul F and Schrag Daniel P ldquoThe Snowball Earth Hypothesis Testing the Limits of Global Changerdquo Terra Nova 14 (2002) 129-155
Geologic amp Isotopic Change Associated with Snowball Event
(Namibia)
64
How Long Did it Last bullBig open question Recent work by Sam Bowring (MIT)
suggests Gaskiers glacial episode lasted lt 1 Myr
bullCanadian glacial episode with good age
Image removed due to copyright restrictions Please see Prof Hoffmans site on the Snowball Earth hypothesis controls probably httpwwwsnowballearthorg lasted lt 1 Myr
bullCap carbonates likely deposited within 103shy104 yr
Image from P Hoffman
65
How Long Did it Last
Gaskiers Fm Newfoundland
Images removed due to copyright restrictions
Images from S Bowring
66
How Long Did it Last Ediacaran-burying ash (Drook Formation)
Images removed due to copyright restrictions
Image from S Bowring
67
What kept this from happening after ~580 Ma bullHigher solar luminosity (~5 increase)
bullLess landmass near equator = lower weathering rates () John Edmond weathering rates limited by abundance of fresh rock not temperature
bullIncreased bioturbation (eukaryote diversity following re-oxygenation of ocean) Less C accumulation in sediments offsets lower weathering rates
bulllower iron and phosphorous concentrations in better-oxygenated Phanerozoic ocean [Fe(II) is soluble Fe(III) is less so] Decreased 1deg production = Decreased CO2 drawdown
What we would like to know CO2 concentrations through snowballhothouse cycle
68
Image removed due to copyright restrictions
Please see Lubick Naomi ldquoPalaeoclimatology Snowball Fightsrdquo Nature 417 (May 2 2002) 12-13
Potential Problems with the lsquoSnowball Earth hypothesisrsquo
bullOceanatmosphere climate models cannot seem to keep entire ocean covered with ice bullNo evidence for lower sea level bullWeathering reactions are slowhellip Maybe too slow to be the source of cap carbonates
69
Alternate Cause for Cap Carbonate Deposition amp 13C Depletions
Gas Hydrate Destabilization
Kennedy et al (2001) Geology Vol 29(5) 443-446
bullCaCO3 precipitation does not require increased weathering flux of minerals
bullCan be caused by increased seawater alkalinity resulting from CH4 consumption by sulphateshyreducing bacteria
70
Image removed due to copyright restrictions
Please see Fig 1 in Kennedy Martin J et al ldquoAre Proterozoic Cap Carbonates and Isotopic Excursion a Record of Gas Hydrate Destabilization Following Earthrsquos Coldest Intervalsrdquo Geology 29 (May 2001) 443-446
Structures in Cap Carbonates May Result from Gas
Release bullGas Hydrate = [H2O + hydrocarbon (CH4)] ice bullCH4 from biogenic + thermogenic decomposition of deeply buried CorgbullBiogenic CH4 has very low o13C (-60 to-90permil) bullSequestered as hydrate in permafrost (gt 150 m) amp along continental margins (gt 300 m) bullDestabilized by increased temperature bullCH4 released from flooded permafrost during deglaciation
71
A Biogeochemical Model of the Proterozoic Ocean
Image removed due to copyright restrictions
Please see Fig 3a in Logan Graham A et al ldquoTerminal Proterozoic Reorganization of Biogeochemical Cyclesrdquo Nature 376 (July 6 1995) 53-56
72
After Ventilation
Image removed due to copyright restrictions
Please see Fig 3b in Logan Graham A et al ldquoTerminal Proterozoic Reorganization of Biogeochemical Cyclesrdquo Nature 376 (July 6 1995) 53-56
73
A Carbon Cycle with Two Timescales
oi
weathering volcanism
o1 1
o2-8
o2 o2 2
sedimentoa oo carbonate carbon organic carbon
74
Summarybull The C-cycle has evolved radically through time bull Prior to 22 Ga anaerobic prokaryotes dominated wide spread of oorg (oo)
values oxygenic photosynthesis extant but oxygen remained low as sinks gtgt sources
bull Mantle may have been an important sink for oxidising power bull Extreme ocarb(oa) values around 22 Ga probably signify the lsquoGOErsquo and rise
to prominence of aerobes Decreased spread of oorg (oa) values mayreflect dominance of aerobic autotrophs and reductive pentose (Benson-Calvin C3) cycle
bull Although ample evidence for aerobes the abundance of O2 in atm and ocean remained low (sulfidic ocean) until another major oxidation eventcaused a second lsquoreorganizationrsquo In the Neoproterozoic This was also signified by extreme oa fluctuations
bull The Neoproterozoic lsquoreorganizationrsquo led to pO2 rising to near PALallowing animals to flourish and stabilizing the new regime
bull Environmental evolution reflected changes in the balance between thermal crustal atmospheric amp biological processes
75
Pre-Quaternary climates
South America Africa
India
Permian pole
Glacial Striation Origin of permo shyCarboniferous Glaciation
COLD
Australia
Antarctica
Arabia
Permo-Carboniferrous Glaciations (~300-275 Ma)
Image removed due to copyright restrictions
Figure by MIT OpenCourseWare
Generalized diagram illustrating evidence for origination of Permo-Carboniferous glaciation on one large landmass Arrows indicate direction of glacial flow X = Permian pole position [After Sullivan 1974] Reproduced by permission from W Sullivan Continents in Motion The New Earth Debate copyright 1974 McGraw-Hill Publishing Co
76
Corg burial rate estimated from o13C in CaCO3
Image removed due to copyright restrictions
Please see Fig 10-9 in Stanley (course text)
Atmospheric O2 estimated from Corg burial rate
77
Mesozoic Warmth
-Ferns amp alligators in Siberia
Jurassic 220-140 Ma
78
Image from httpsimplewikipediaorgwikiFileAlligator3jpg in public domain
Image from httpcommonswikimediaorgwikiFileCoelurus_stegosaurusjpg in public domain
High CO2 Levels During MesozoicDecreasing CO2
Mesozoic i 13C = t CO2 Image removed due to copyright restrictions
Please see Fig 2 in Popp Brian N et al ldquoThe Post-Paleozoic Chronology and Mechanism of 13C Depletion in Primary Marine Organic Matterrdquo Am J of Science 289 (April 1989) 436-454
i Seafloor spreading rate
1 i CO2 outgassing
2 i subduction rate = i carbonate metamorphism = i CO2 production
3 i sea level (hotter oceanic crusthigher ridge volume = t land area
t weathering Increasing CO2
t CO2 sink
79
Cenozoic CO2 DecreaseDecreasing CO2
Image removed due to copyright restrictions
Please see Fig 2 in Popp Brian N et al ldquoThe Post-Paleozoic Chronology and Mechanism of 13C Depletion in Primary Marine Organic Matterrdquo Am J of Science 289 (April 1989) 436-454
Increasing CO2
80
What causes glacial-interglacial CO2 variations
(a still-unanswered question) Possible Scenario for lower glacial pCO2
bullIncreased Equator-Pole T gradient Wind strength Dust flux to ocean Iron flux to ocean
bull50 of global 1deg production occurs in ocean bullOcean 1deg production is limited by iron bullHigher 1deg production draws CO2 out of atmosphere amp sequesters it in the deep ocean amp sediments bullColder seawater dissolves more CO2
81
Text has been removed due to copyright restrictions
Please see Veizer Jan et al ldquoEvidence for Decoupling of Atmospheric CO2 and Global Climate during the Phanerozoic Eonrdquo Nature 408 (December 7 2000) 698
While a large and growing body of
evidence indicates that CO2 and climate co-vary there is some indication that the two may not be
closely linked at all timeshellip
(amp it is always important to remember that
correlation does not always mean causation)
82
Text removed due to copyright restrictions
Please see Hoffman Paul F ldquoComment on lsquoSnowball Earth on Trialrsquordquo Eos 88 (February 2007) 110
83
Text removed due to copyright restrictions
Please see Allen Phillip A ldquoReply to lsquoComment on Snowball Earth on Trialrsquordquo Eos 88 (February 2007) 110
84
Evidence for Glaciers on All Continents 09-06 Ga
Image removed due to copyright restrictions
Please see Fig 123 in Crowley T J and North G R Paleoclimatology New York NY Oxford University Press 1992 ISBN 0195105338
85
Neither albedo or
geothermal heat flux
changes can keep the
Earth from freezing w
30 lower S
Adapted from Kump et al (1999)
86
Therefore Lower S must have
been compensated by larger greenhouse
effect
Adapted from Kump et al (1999)
87
httpwwwscotesecomprecambrhtm
Image removed due to copyright restrictions
Please see httpwwwscotesecomimages650jpg
This map illustrates the break-up of the supercontinent Rodinia which formed 1100 million years ago The Late Precambrian was an Ice House World much like the present-day
88
Figure 15 Two permissible calibrations of the composite carbon-isotope record in Figure 14 based on available radiometric dates and delta 13C data that can be correlated into the record and contrasting interpretations of the age and duration of the Sturtian and Marinoan glaciations
GSA Bulletin September 2005 v 117 no 9-10 p 1181-1207 Toward a Neoproterozoic composite carbon-isotope record Galen P Halverson Paul F Hoffman Daniel P Schrag Adam C Maloof and A Hugh N Rice
89Image courtesy of the Geological Society of America Used with permission
GSA Bulletin September 2005 v 117 no 9-10 p 1181-1207 Toward a Neoproterozoic composite carbon-isotope record Galen P Halverson Paul F Hoffman Daniel P Schrag Adam C Maloof and A Hugh N Rice
90Image courtesy of the Geological Society of America Used with permission
MIT OpenCourseWarehttpocwmitedu
12007 Geobiology Spring 2013
For information about citing these materials or our Terms of Use visit httpocwmiteduterms

GSA Bulletin September 2005 v 117 no 9-10 p 1181-1207 Toward a Neoproterozoic composite carbon-isotope record Galen P Halverson Paul F Hoffman Daniel P Schrag Adam C Maloof and A Hugh N Rice
8
Image courtesy of the Geological Society of America Used with permission
GSA Today Volume 14 Number 3 March 2004
9
Image courtesy of the Geological Society of America Used with permission
Outline bullOverview of Earths climate history
bullClimate feedbacks what keeps climate away from extremes Planetary Energy Balance Greenhouse Effect Geochemical Carbon Cycle CO2 Temperature Precipitation-Weathering Feedback
bullCase studiesNeoproterozoic glaciations (750-580 Ma) bullhttpwwwsnowballearthorg Permo-carboniferous Glaciations (300-275 Ma) Mesozoic Warmth (245-65 Ma) Cenozoic Cooling (100-0 Ma) Pleistocene Glaciations (05-0 Ma)
10
Mostly sunny with a 10 chance of snow Earths Climate History
Images courtesy of NASA
11
This image has been removed due to copyright restrictions
Climate Controls - Long amp Short Timescales
bullSolar output (luminosity) 109 yr
bullContinental drift (tectonics) 108 yr
bullOrogeny (tectonics) 107 yr
bullOrbital geometry (Earth -Sun distance) 104-105 yr
bullOcean circulation (geography climate) 101 -103 yr
bullComposition of the atmosphere (biology tectonics volcanoes) 100-105 yr
12
Faint Young Sun Paradox
Faint Young
Sun Paradox
4 1H--gt4He Incr density=
incr luminosity
Liquid H2O existed gt4 Ga (sed rocks life zircon δ18O)
13
Contemporary Solar Variability
Image removed due to copyright restrictions
Please see Fig 9 in Froumlhlich C ldquoSolar Irradiance Variability Since 1978rdquo Space Science Reviews 125 (August 2006) 53-65
bullContemporary Solar Variability ~01 bullAssociated with 11-year sunspot cycle
14
Energy Balance S= solar flux
T = effective radiating temperature
A= albedo or reflectivity as a fraction of incident radiation
RE = earth radius
Stefan_Boltzmann law Energy Flux = const T4
Const σ = 567 10-8 wm2K4
The StefanndashBoltzmann law states that the total energy radiated per unit surface area of a black body in unit time (known variously as the black-body irradiance energy flux density or radiant flux j is directly proportional to the fourth power of the black bodys absolute temperature)
Adapted from Kump et al (1999)
15
Therefore Lower S must have been compensated by larger
greenhouse effect
16
Greenhouse Gases
Those that absorb IR radiation efficiently N2O CO2 CH4 H2O
17
Image removed due to copyright restrictions
Please see Fig 1 in Hofmann D J et al ldquoTracking Climate Forcing The Annual Greenhouse Gas Indexrdquo Eos 87 (November 14 2006) 509-511
18
Image removed due to copyright restrictions
Please see Fig 2 in Hofmann D J et al ldquoTracking Climate Forcing The Annual Greenhouse Gas Indexrdquo Eos 87 (November 14 2006) 509-511
19
How much CO2 Required for TS gt 0degC
Image removed due to copyright restrictions
Please see Fig 2 in Kasting James F ldquoEarthrsquos Early Atmosphererdquo Science 259 (February 12 1993) 920-926
httpwwwgeoscpsuedu~kastingPersonalPage PdfScience_93pdf
Venus Same qty of C as Earth All in atmos -gt TS lt 450degC
20
Mostly sunny with a 10 chance of snow Earths Climate History
Images courtesy of NASA
What caused these climate perturbations
21
This image has been removed due to copyright restrictions
Steady State amp Residence Time Steady State Inflows = Outflows
Any imbalance in I or O leads to changes in reservoir size
Inflow Atmospheric CO2
760 Gton C
Outflow 60 Gton Cyr 60 Gton Cyr
Respiration Photosynthesis
1 Gton = 109 1000 kg = 1015 g
The Residence time of a molecule is the average amount of time it is expected to remain in a given reservoir
Example tR of atmospheric CO2 = 76060 = 13 yr
22
The Biogeochemical
Carbon Cycle
23
----------------------------------------------
+ H2O
-------------------------------------
Chemical Weathering = chemical attack of rocks by dilute acid
C O2 + H2O lt---gt H2CO3
1 Carbonate Weathering The - BiogeochemicalC a C O3 + H2CO3 --gt Ca2+ + 2 HCO3
Carbon Cycle 2 Silicate Weathering
C a S i O3 + 2 H2CO3 --gt Ca2+ + 2HCO3- + SiO2
bull 2x CO2 consumption for silicates
bull Carbonates weather faster than silicates
24
Carbonate Image removed due to copyright restrictions rocks weather
faster than silicate rocks
25
Products of Image removed due to copyright restrictions weathering
Please see Kump L R et alThe Earth System Upper Saddle River NJ Pearson Prentice Hall 1999 precipitaed as
CaCO3 amp SiO2 in ocean
26
-------------------------------------
Net Reaction of Rock Weathering +
Carbonate and Silica Precipitation in Ocean
CaSiO3 + CO2 --gt CaCO3 + SiO2
bull CO2 consumed (~ 003 Gt Cyr)
bull Would deplete atmospheric CO2 in 20 kyr
bull Plate tectonics returns CO2 via Volcanism and Metamorphism
Carbonate Metamorphism
C a C O3 + SiO2 --gt CaSiO3 + CO2
bull CO2 produced from subducted marine sediments
Net reaction of
geochemical carbon cycle
(Urey Reaction)
27
Image removed due to copyright restrictions
Please see Fig 10-11 in Stanley (course text)
Carbonate-Silicate Geochemical Cycle
bullCO2 released from volcanism dissolves in H2O forming carbonic acid H2CO3
bullH2CO3 dissolves rocks
bullWeathering products transported to ocean by rivers
bullCaCO3 precipitation in shallow amp deep water
bullCycle closed when CaCO3 metamorphosed in subduction zone or during orogeny
28
bull Geologic record indicates climate has rarely reached or maintained extreme Greenhouse or Icehouse conditions
bull Negative feedbacks between climate and Geochemical Carbon Cycle must exist
bull Thus far only identified for Carbonate-Silicate Geochemical Cycle
Temp rainfall enhance weathering rates (Walker et al 1981)
(Ie no obvious climate dependence of tectonics or organic carbon geochemical cycle)
How are CO2 levels
kept in balance
Feedbacks
Adapted from Kump et al (1999)
29
The Proterozoic Glaciations
(Snowball Earth)
httpwwwsnowballearthorg
Images courtesy of NASAReading bullHoffman amp Schrag (2002) Terra Nova Vol 14(3)129-155 bullLubick (2002) Nature Vol 417 12-13
30
Figure 1 (A) Present-day locations of the Neoproterozoic successions
GSA Bulletin September 2005 v 117 no 9-10 p 1181-1207 Toward a Neoproterozoic composite carbon-isotope record Galen P Halverson Paul F Hoffman Daniel P Schrag Adam C Maloof and A Hugh N Rice
31
Image courtesy of the Geological Society of America Used with permission
f organic-C buried
13C fractionation εTOC
δ13C limestones
δ13C marine organic matter
750 Ma 720 Ma 580 Ma
MarinoanVaranger Sturtian glacial(s) glacial(s)
Carbon Isotopic Excursions 800-500Ma
What caused these massive
perturbations to the carbon cycle during the late Proterozoic
Hayes et al Chem Geol 161 37 1999
32
Courtesy Elsevier Inc httpwwwsciencedirectcom Used with permission
Neoproterozoic Glaciations Evidence
3-4 global glaciations followed by extreme greenhouses 750-580 Ma bullHarland (1964) Kirschvink (1992)
bullHoffman et al (1998) Science v 281 1342-6 Hoffman amp Schrag (2000) Sci Am Jan 68-75
Image removed due to copyright restrictions
Please see Fig 3 in Hoffman Paul F and Schrag Daniel P ldquoSnowball Earthrdquo Scientific American 282 (January 2000) 68
Snowball-related Events bullBreakup of equatorial supercontinent 770 Ma bullEnhanced weathering from increased rainfall (more land close to sea) bullDrawdown atmospheric CO2 Global cooling bullRunaway albedo effect when sea ice lt 30deg latitude bullGlobal glaciation for ~10 Myr (avg T ~ shy50degC) bullSea ice ~1000 m thick geothermal heat flux (007 Wm2) keeps ocean liquid
33
Tillites GeologicPacked pebbles sand amp Evidencemud Remnants of moraines for Glaciers
Copyright Marli Miller University of Oregon Image from Earth Science World Image Bank httpwwwearthscienceworldorgimages Used with permission
Glacial Striations Scratches from rocks dragged by moving ice
Courtesy Walter Siegmund Image from Wikimedia Commons httpcommonswikimediaorg
Used with permission
Dropstones Rocks transported by icebergs which melt releasing load into finely laminated sediment (IRD)
Copyright Bruce Molnia Terra Photographics Image from Earth Science World Image Bank Kump et al (1999)httpwwwearthscienceworldorgimages
Used with permission
34
Glacial sediments ndash poorly sorted angular clasts including dropstones ndash Namibia c 750 Ma
Courtesy Daniel Schrag Used with permission
35
Image removed due to copyright restriction
Please see Fig 2 in Hoffman Paul F and Schrag Daniel P ldquoThe Snowball Earth Hypothesis Testing the Limits of Global Changerdquo Terra Nova 14 (2002) 129-155
Neoproterozoic Glacial Deposits
From Norway Mauritania NW Canada Namibia Australia Oman
bullGlacial striations bullDropstones bullDiamictites bullAnomalous Iron Formations
36
Equatorial Continents
Image removed due to copyright restrictions
Please see Fig 1 in Hoffman Paul F and Schrag Daniel P ldquoSnowball Earthrdquo Scientific American 282 (January 2000) 68
bullHarland amp Rudwick (1964) identified glacial sediments at what looked like equatorial latitudes by paleomagnetism bullGeorge Williams (1975) identified low a latitude glacial sequence in S Australia amp attributed to episode of extreme obliquity (tilt)
37
Determining Paleolatitude from Remnant Magnetism
bullPaleomagnetism latitude of formation of rock
bullNatural Remnant Magnetism (NRM) inclination varies with magnetic latitude -vertical magn poles -horz magn equator (many Neoprot glac deposits)
bullMagn polar drift avgs out on T~10 ky
Image from P Hoffman
38
This image has been removed due to copyright restrictions
Paleolatitude from
Paleomagnetism Image removed due to copyright restriction
Please see Fig 1 in Hoffman Paul F and Schrag Daniel P ldquoThe Snowball Earth Hypothesis Testing the Limits of Global Changerdquo Terra Nova 14 (2002) 129-155
39
What can explain glaciers on all continents when they
appear to have been close to the equator
40
High Obliquity Hypothesis
George Williams (1975)
bullEarths tilt (obliquity) controls seasonality bullAt high tilt angles (gt 54deg) the poles receive more mean annual solar radiation than the tropics (sun constantly overhead in summer) bullGlaciers may be able to form at low latitudes Problems bullEven the tropics get quite warm at the equinoxes bullMoon stabilizes obliquity bullWould need v large impact to destabilize moon orbit doesnt support this Image from P Hoffman
41
This image has been removed due to copyright restrictions
Snowball Earth Hypothesis ~3-4 global glaciations followed by extreme greenhouses 750-580 Ma
bullHarland (1964) Williams 1976-86 Kirschvink (1992) bullHoffman et al (1998) Science v 281 1342-6 Hoffman amp Schrag (2000) Sci Am Jan
68-75 Snowball Events
bullBreakup of equatorial supercontinent 770 Ma bullEnhanced weathering from increased rainfall (more land close to sea) bullDrawdown atmCO2 Global cooling bullRunaway albedo effect when sea ice lt 30deg latitude bullGlobal glaciation for ~10 Myr (avg T ~ -50degC) bullSea ice ~1000 m thick geothermal heat flux (007 Wm2) keeps ocean
Images courtesy of NASA liquid
42
Image removed due to copyright restrictions
Please see Fig 2 in Hoffman Paul F and Schrag Daniel P ldquoSnowball Earthrdquo Scientific American 282 (January 2000) 68
lsquoProloguersquo to
Snowball
bullBreakup of equatorial supercontinent bullEnhanced weathering from increased rainfall (more land close to sea) + carbon burial bullDrawdown atmospheric CO2 Global cooling
bullIs this enough
43
Image removed due to copyright restrictions
Please see Fig 2 in Hoffman Paul F and Schrag Daniel P ldquoSnowball Earthrdquo Scientific American 282 (January 2000) 68
Deep Freeze
bullGlobal cooling causes sea ice margin to move equatorward
bullRunaway albedo effect when sea ice lt30deg latitude
bullEntire ocean possibly covered with ice
44
Budyko-Sellers Runaway Albedo
Feedback
1 Eq continents incr weathering lowers CO2 slow cooling equatorward movement of ice
2 Runaway albedo 3 Slow buildup of CO2
from volcanoes 4 Rapid decay of ice in
102 yr High Ts from enhanced H20-T feedback
5 Slow CO2 drawdown from weathering
Image from P Hoffman
45
This image has been removed due to copyright restrictions
Profiles of the 1998 Blue Planet Prize Recipients
Dr Mikhail I Budyko ((Д-р ΜИ Будыко) (Born in January 1920 in Gomel in the former Soviet Union (now Belarus) Head of the Division for Climate Change Research State Hydrological Institute St Petersburg
As shown by the unusual weather patterns caused by the El Nino effect a wide spectrum of climate changes on Earth is having a profound effect on human lives and the environment Since the 1970s great advances have been made in climatology the scientific study of the close relationship between climate and the environment Playing a pivotal role in the development of climatology has been Dr Mikhail I Budyko one of this years winners of the Blue Planet Prize In the 1950s Dr Budyko conducted quantitative studies of the global climate by calculating the heat balance of the Earths surface This balance involves energy from the sun which is the most important determining factor for the Earths climate First Dr Budyko calculated the energy balance of certain regions of the Earth and then he verified his calculations by making comparisons with observational data Next using weather data collected from all over the world Dr Budyko carried out heat balance calculations for all regions of the world and confirmed that they checked out with observational data He announced his findings in 1956 with the publication of his book Heat Balance of the Earths Surface
46
Image removed due to copyright restrictions
Please see Fig 3 in Hoffman Paul F and Schrag Daniel P ldquoSnowball Earthrdquo Scientific American 282 (January 2000) 68
Snowball Peak
bullGlobal glaciation for ~10 Myr (avg T ~ -50degC)
bullSea ice ~1000 m thick geothermal heat flux (007 Wm2) keeps ocean liquid
47
Breaking out of the Snowball
bullVolcanic outgassing of CO2 over ~106 yr may have
Image removed due to copyright restrictions increased greenhouse effect Please see Fig 2 in Lubick sufficiently to melt back theNaomi ldquoPalaeoclimatology Snowball Fightsrdquo Nature 417 ice(May 2 2002) 12-13
48
Bring on the Heat Hothouse follows
Image removed due to copyright restrictions
Please see Fig 3 in Hoffman Paul F and Schrag Daniel P ldquoSnowball Earthrdquo Scientific American 282 (January 2000) 68
Snowball Hothouse Events
bullSlow CO2 buildup to ~350 PAL from volcanoes bullTropical ice melts albedo feedback decreases water vapor feedback increases bullGlobal T reaches ~ +50degC in 102 yr bullHigh T amp rainfall enhance weathering bullWeathering products + CO2 = carbonate precipitation in warm water
49
Evidence for Snowball Earth Hypothesis
bullStratigraphy globally-dispersed glacial deposits
bullCarbon isotopes negative δ13C excursions through glacial sections (δ13C reaches ~ -5 to -7permil) Little or no biological productivity (no light)
bullAnomalous banded iron formations wIRD only BIFs after 17 Ga Anoxic seawater covered by ice
bullCambrian explosion Rapid diversification of multicellular life 575-525 Ma expected to result from long periods of isolation and extreme environments (genetic bottleneck and flush)
50
Carbon Isotopic Evidence for Snowball δ13C values of -5permil (mantle value) consistent with dead ice-covered
ocean
Image from P Hoffman
51
This image has been removed due to copyright restrictions
Carbon Isotope
Fractionation
bullAs fraction of organic carbon buried approaches zero δ13C of CaCO3 approaches mantle (input) value
Image from P Hoffman
52
This image has been removed due to copyright restrictions
f organic-C buried
13C fractionation εTOC
δ13C limestones
δ13C marine organic matter
Carbon Isotopic Excursions 800-500Ma
More complete sediment record
+
Improved chronology
=
More detailed picture showing abrupt and extreme
C-isotopic shifts
A global composite of 13C data shows 4 excursions
Plus one at the pC-C boundary
Hayes et al Chem Geol 161 37 1999
53
Courtesy Elsevier Inc httpwwwsciencedirectcom Used with permission
This image has been removed due to copyright restrictions
Please see Figure 2 Details -gt
Calibrating the Cryogenian Francis A Macdonald Mark D Schmitz James L Crowley Charles F Roots David S Jones Adam C Maloof Justin V StraussPhoebe A Cohen David T Johnston Daniel P Schrag SCIENCE VOL 327 5 MARCH 2010
Fig 2 Neoproterozoic composite carbonate d13C chemostratigraphy with U-Pb ID-TIMS ages that are directly linked to isotopic profiles (11) Bars indicate the time spans of fossil assemblages representing eukaryotic crown groups Asterisks indicate fossil groups of uncertain taxonomic affinity Bars faded upward reflect uncertainty in the minimum age constraint bars faded downward reflect uncertainty in the maximum age constraint Dashes represent the time span where a fossil record has not been identified but for which the eukaryotic groups presence is inferred from its occurrence in Ediacaran or Phanerozoic strata Dashes with question marks indicate that earlier records have been proposed but the relationships between these fossils and the crown groups are uncertain
54
Anomalous Banded Iron Formations
bullAfter a ~1 Gyr absence BIFs return to the geologic record
bullImplies an anoxic ocean
bullConsistent with ice-covered ocean
Image from P hoffman
55
This image has been removed due to copyright restrictions
BIF + Dropstone = Ice-covered anoxic ocean
McKenzie Mtns Western Canada Image from P Hoffman 56
This image has been removed due to copyright restrictions
Animal Radiation Response to genetic
bottlenecks amp flushes
Image from P Hoffman
57
This image has been removed due to copyright restrictions
One Complete Snowball-Hothouse Episode
Image from P Hoffman
58
This image has been removed due to copyright restrictions
The Geochemical Carbon Cycle
Image from P Hoffman 59
IThis image has been removed due to copyright restrictions
Geologic Evidence for Hothouse Aftermath Cap Carbonates
Thick sequences of inorganically precipitated CaCO3 overly all
Neoproterozoic glacial deposits
60
Image removed due to copyright restriction
Please see Fig 3 in Hoffman Paul F and Schrag Daniel P ldquoThe Snowball Earth Hypothesis Testing the Limits of Global Changerdquo Terra Nova 14 (2002) 129-155
Neoproterozoic Cap Carbonates-1
bullThick sequences of inorganically precipitated carbonate minerals overly Late Proterozoic glacial deposits bullConsistent with massive flux of weathering products to ocean in snowball aftermath
61
Cap Carbonates 3
Image removed due to copyright restriction
Please see Fig 5c in Hoffman Paul F and Schrag Daniel P ldquoThe Snowball Earth Hypothesis Testing the Limits of Global Changerdquo Terra Nova 14 (2002) 129-155
bullNamibia
62
Glacial Deposit Overlain by Cap
Image removed due to copyright restrictions Carbonate in Please see Prof Hoffmans site on the Snowball Earth hypothesis httpwwwsnowballearthorg Namibia (~700 Ma)
Hoffman amp Schrag (2000)
63
Image removed due to copyright restriction
Please see Fig 9 in Hoffman Paul F and Schrag Daniel P ldquoThe Snowball Earth Hypothesis Testing the Limits of Global Changerdquo Terra Nova 14 (2002) 129-155
Geologic amp Isotopic Change Associated with Snowball Event
(Namibia)
64
How Long Did it Last bullBig open question Recent work by Sam Bowring (MIT)
suggests Gaskiers glacial episode lasted lt 1 Myr
bullCanadian glacial episode with good age
Image removed due to copyright restrictions Please see Prof Hoffmans site on the Snowball Earth hypothesis controls probably httpwwwsnowballearthorg lasted lt 1 Myr
bullCap carbonates likely deposited within 103shy104 yr
Image from P Hoffman
65
How Long Did it Last
Gaskiers Fm Newfoundland
Images removed due to copyright restrictions
Images from S Bowring
66
How Long Did it Last Ediacaran-burying ash (Drook Formation)
Images removed due to copyright restrictions
Image from S Bowring
67
What kept this from happening after ~580 Ma bullHigher solar luminosity (~5 increase)
bullLess landmass near equator = lower weathering rates () John Edmond weathering rates limited by abundance of fresh rock not temperature
bullIncreased bioturbation (eukaryote diversity following re-oxygenation of ocean) Less C accumulation in sediments offsets lower weathering rates
bulllower iron and phosphorous concentrations in better-oxygenated Phanerozoic ocean [Fe(II) is soluble Fe(III) is less so] Decreased 1deg production = Decreased CO2 drawdown
What we would like to know CO2 concentrations through snowballhothouse cycle
68
Image removed due to copyright restrictions
Please see Lubick Naomi ldquoPalaeoclimatology Snowball Fightsrdquo Nature 417 (May 2 2002) 12-13
Potential Problems with the lsquoSnowball Earth hypothesisrsquo
bullOceanatmosphere climate models cannot seem to keep entire ocean covered with ice bullNo evidence for lower sea level bullWeathering reactions are slowhellip Maybe too slow to be the source of cap carbonates
69
Alternate Cause for Cap Carbonate Deposition amp 13C Depletions
Gas Hydrate Destabilization
Kennedy et al (2001) Geology Vol 29(5) 443-446
bullCaCO3 precipitation does not require increased weathering flux of minerals
bullCan be caused by increased seawater alkalinity resulting from CH4 consumption by sulphateshyreducing bacteria
70
Image removed due to copyright restrictions
Please see Fig 1 in Kennedy Martin J et al ldquoAre Proterozoic Cap Carbonates and Isotopic Excursion a Record of Gas Hydrate Destabilization Following Earthrsquos Coldest Intervalsrdquo Geology 29 (May 2001) 443-446
Structures in Cap Carbonates May Result from Gas
Release bullGas Hydrate = [H2O + hydrocarbon (CH4)] ice bullCH4 from biogenic + thermogenic decomposition of deeply buried CorgbullBiogenic CH4 has very low o13C (-60 to-90permil) bullSequestered as hydrate in permafrost (gt 150 m) amp along continental margins (gt 300 m) bullDestabilized by increased temperature bullCH4 released from flooded permafrost during deglaciation
71
A Biogeochemical Model of the Proterozoic Ocean
Image removed due to copyright restrictions
Please see Fig 3a in Logan Graham A et al ldquoTerminal Proterozoic Reorganization of Biogeochemical Cyclesrdquo Nature 376 (July 6 1995) 53-56
72
After Ventilation
Image removed due to copyright restrictions
Please see Fig 3b in Logan Graham A et al ldquoTerminal Proterozoic Reorganization of Biogeochemical Cyclesrdquo Nature 376 (July 6 1995) 53-56
73
A Carbon Cycle with Two Timescales
oi
weathering volcanism
o1 1
o2-8
o2 o2 2
sedimentoa oo carbonate carbon organic carbon
74
Summarybull The C-cycle has evolved radically through time bull Prior to 22 Ga anaerobic prokaryotes dominated wide spread of oorg (oo)
values oxygenic photosynthesis extant but oxygen remained low as sinks gtgt sources
bull Mantle may have been an important sink for oxidising power bull Extreme ocarb(oa) values around 22 Ga probably signify the lsquoGOErsquo and rise
to prominence of aerobes Decreased spread of oorg (oa) values mayreflect dominance of aerobic autotrophs and reductive pentose (Benson-Calvin C3) cycle
bull Although ample evidence for aerobes the abundance of O2 in atm and ocean remained low (sulfidic ocean) until another major oxidation eventcaused a second lsquoreorganizationrsquo In the Neoproterozoic This was also signified by extreme oa fluctuations
bull The Neoproterozoic lsquoreorganizationrsquo led to pO2 rising to near PALallowing animals to flourish and stabilizing the new regime
bull Environmental evolution reflected changes in the balance between thermal crustal atmospheric amp biological processes
75
Pre-Quaternary climates
South America Africa
India
Permian pole
Glacial Striation Origin of permo shyCarboniferous Glaciation
COLD
Australia
Antarctica
Arabia
Permo-Carboniferrous Glaciations (~300-275 Ma)
Image removed due to copyright restrictions
Figure by MIT OpenCourseWare
Generalized diagram illustrating evidence for origination of Permo-Carboniferous glaciation on one large landmass Arrows indicate direction of glacial flow X = Permian pole position [After Sullivan 1974] Reproduced by permission from W Sullivan Continents in Motion The New Earth Debate copyright 1974 McGraw-Hill Publishing Co
76
Corg burial rate estimated from o13C in CaCO3
Image removed due to copyright restrictions
Please see Fig 10-9 in Stanley (course text)
Atmospheric O2 estimated from Corg burial rate
77
Mesozoic Warmth
-Ferns amp alligators in Siberia
Jurassic 220-140 Ma
78
Image from httpsimplewikipediaorgwikiFileAlligator3jpg in public domain
Image from httpcommonswikimediaorgwikiFileCoelurus_stegosaurusjpg in public domain
High CO2 Levels During MesozoicDecreasing CO2
Mesozoic i 13C = t CO2 Image removed due to copyright restrictions
Please see Fig 2 in Popp Brian N et al ldquoThe Post-Paleozoic Chronology and Mechanism of 13C Depletion in Primary Marine Organic Matterrdquo Am J of Science 289 (April 1989) 436-454
i Seafloor spreading rate
1 i CO2 outgassing
2 i subduction rate = i carbonate metamorphism = i CO2 production
3 i sea level (hotter oceanic crusthigher ridge volume = t land area
t weathering Increasing CO2
t CO2 sink
79
Cenozoic CO2 DecreaseDecreasing CO2
Image removed due to copyright restrictions
Please see Fig 2 in Popp Brian N et al ldquoThe Post-Paleozoic Chronology and Mechanism of 13C Depletion in Primary Marine Organic Matterrdquo Am J of Science 289 (April 1989) 436-454
Increasing CO2
80
What causes glacial-interglacial CO2 variations
(a still-unanswered question) Possible Scenario for lower glacial pCO2
bullIncreased Equator-Pole T gradient Wind strength Dust flux to ocean Iron flux to ocean
bull50 of global 1deg production occurs in ocean bullOcean 1deg production is limited by iron bullHigher 1deg production draws CO2 out of atmosphere amp sequesters it in the deep ocean amp sediments bullColder seawater dissolves more CO2
81
Text has been removed due to copyright restrictions
Please see Veizer Jan et al ldquoEvidence for Decoupling of Atmospheric CO2 and Global Climate during the Phanerozoic Eonrdquo Nature 408 (December 7 2000) 698
While a large and growing body of
evidence indicates that CO2 and climate co-vary there is some indication that the two may not be
closely linked at all timeshellip
(amp it is always important to remember that
correlation does not always mean causation)
82
Text removed due to copyright restrictions
Please see Hoffman Paul F ldquoComment on lsquoSnowball Earth on Trialrsquordquo Eos 88 (February 2007) 110
83
Text removed due to copyright restrictions
Please see Allen Phillip A ldquoReply to lsquoComment on Snowball Earth on Trialrsquordquo Eos 88 (February 2007) 110
84
Evidence for Glaciers on All Continents 09-06 Ga
Image removed due to copyright restrictions
Please see Fig 123 in Crowley T J and North G R Paleoclimatology New York NY Oxford University Press 1992 ISBN 0195105338
85
Neither albedo or
geothermal heat flux
changes can keep the
Earth from freezing w
30 lower S
Adapted from Kump et al (1999)
86
Therefore Lower S must have
been compensated by larger greenhouse
effect
Adapted from Kump et al (1999)
87
httpwwwscotesecomprecambrhtm
Image removed due to copyright restrictions
Please see httpwwwscotesecomimages650jpg
This map illustrates the break-up of the supercontinent Rodinia which formed 1100 million years ago The Late Precambrian was an Ice House World much like the present-day
88
Figure 15 Two permissible calibrations of the composite carbon-isotope record in Figure 14 based on available radiometric dates and delta 13C data that can be correlated into the record and contrasting interpretations of the age and duration of the Sturtian and Marinoan glaciations
GSA Bulletin September 2005 v 117 no 9-10 p 1181-1207 Toward a Neoproterozoic composite carbon-isotope record Galen P Halverson Paul F Hoffman Daniel P Schrag Adam C Maloof and A Hugh N Rice
89Image courtesy of the Geological Society of America Used with permission
GSA Bulletin September 2005 v 117 no 9-10 p 1181-1207 Toward a Neoproterozoic composite carbon-isotope record Galen P Halverson Paul F Hoffman Daniel P Schrag Adam C Maloof and A Hugh N Rice
90Image courtesy of the Geological Society of America Used with permission
MIT OpenCourseWarehttpocwmitedu
12007 Geobiology Spring 2013
For information about citing these materials or our Terms of Use visit httpocwmiteduterms

Mostly sunny with a 10 chance of snow Earths Climate History
Images courtesy of NASA
11
This image has been removed due to copyright restrictions
Climate Controls - Long amp Short Timescales
bullSolar output (luminosity) 109 yr
bullContinental drift (tectonics) 108 yr
bullOrogeny (tectonics) 107 yr
bullOrbital geometry (Earth -Sun distance) 104-105 yr
bullOcean circulation (geography climate) 101 -103 yr
bullComposition of the atmosphere (biology tectonics volcanoes) 100-105 yr
12
Faint Young Sun Paradox
Faint Young
Sun Paradox
4 1H--gt4He Incr density=
incr luminosity
Liquid H2O existed gt4 Ga (sed rocks life zircon δ18O)
13
Contemporary Solar Variability
Image removed due to copyright restrictions
Please see Fig 9 in Froumlhlich C ldquoSolar Irradiance Variability Since 1978rdquo Space Science Reviews 125 (August 2006) 53-65
bullContemporary Solar Variability ~01 bullAssociated with 11-year sunspot cycle
14
Energy Balance S= solar flux
T = effective radiating temperature
A= albedo or reflectivity as a fraction of incident radiation
RE = earth radius
Stefan_Boltzmann law Energy Flux = const T4
Const σ = 567 10-8 wm2K4
The StefanndashBoltzmann law states that the total energy radiated per unit surface area of a black body in unit time (known variously as the black-body irradiance energy flux density or radiant flux j is directly proportional to the fourth power of the black bodys absolute temperature)
Adapted from Kump et al (1999)
15
Therefore Lower S must have been compensated by larger
greenhouse effect
16
Greenhouse Gases
Those that absorb IR radiation efficiently N2O CO2 CH4 H2O
17
Image removed due to copyright restrictions
Please see Fig 1 in Hofmann D J et al ldquoTracking Climate Forcing The Annual Greenhouse Gas Indexrdquo Eos 87 (November 14 2006) 509-511
18
Image removed due to copyright restrictions
Please see Fig 2 in Hofmann D J et al ldquoTracking Climate Forcing The Annual Greenhouse Gas Indexrdquo Eos 87 (November 14 2006) 509-511
19
How much CO2 Required for TS gt 0degC
Image removed due to copyright restrictions
Please see Fig 2 in Kasting James F ldquoEarthrsquos Early Atmosphererdquo Science 259 (February 12 1993) 920-926
httpwwwgeoscpsuedu~kastingPersonalPage PdfScience_93pdf
Venus Same qty of C as Earth All in atmos -gt TS lt 450degC
20
Mostly sunny with a 10 chance of snow Earths Climate History
Images courtesy of NASA
What caused these climate perturbations
21
This image has been removed due to copyright restrictions
Steady State amp Residence Time Steady State Inflows = Outflows
Any imbalance in I or O leads to changes in reservoir size
Inflow Atmospheric CO2
760 Gton C
Outflow 60 Gton Cyr 60 Gton Cyr
Respiration Photosynthesis
1 Gton = 109 1000 kg = 1015 g
The Residence time of a molecule is the average amount of time it is expected to remain in a given reservoir
Example tR of atmospheric CO2 = 76060 = 13 yr
22
The Biogeochemical
Carbon Cycle
23
----------------------------------------------
+ H2O
-------------------------------------
Chemical Weathering = chemical attack of rocks by dilute acid
C O2 + H2O lt---gt H2CO3
1 Carbonate Weathering The - BiogeochemicalC a C O3 + H2CO3 --gt Ca2+ + 2 HCO3
Carbon Cycle 2 Silicate Weathering
C a S i O3 + 2 H2CO3 --gt Ca2+ + 2HCO3- + SiO2
bull 2x CO2 consumption for silicates
bull Carbonates weather faster than silicates
24
Carbonate Image removed due to copyright restrictions rocks weather
faster than silicate rocks
25
Products of Image removed due to copyright restrictions weathering
Please see Kump L R et alThe Earth System Upper Saddle River NJ Pearson Prentice Hall 1999 precipitaed as
CaCO3 amp SiO2 in ocean
26
-------------------------------------
Net Reaction of Rock Weathering +
Carbonate and Silica Precipitation in Ocean
CaSiO3 + CO2 --gt CaCO3 + SiO2
bull CO2 consumed (~ 003 Gt Cyr)
bull Would deplete atmospheric CO2 in 20 kyr
bull Plate tectonics returns CO2 via Volcanism and Metamorphism
Carbonate Metamorphism
C a C O3 + SiO2 --gt CaSiO3 + CO2
bull CO2 produced from subducted marine sediments
Net reaction of
geochemical carbon cycle
(Urey Reaction)
27
Image removed due to copyright restrictions
Please see Fig 10-11 in Stanley (course text)
Carbonate-Silicate Geochemical Cycle
bullCO2 released from volcanism dissolves in H2O forming carbonic acid H2CO3
bullH2CO3 dissolves rocks
bullWeathering products transported to ocean by rivers
bullCaCO3 precipitation in shallow amp deep water
bullCycle closed when CaCO3 metamorphosed in subduction zone or during orogeny
28
bull Geologic record indicates climate has rarely reached or maintained extreme Greenhouse or Icehouse conditions
bull Negative feedbacks between climate and Geochemical Carbon Cycle must exist
bull Thus far only identified for Carbonate-Silicate Geochemical Cycle
Temp rainfall enhance weathering rates (Walker et al 1981)
(Ie no obvious climate dependence of tectonics or organic carbon geochemical cycle)
How are CO2 levels
kept in balance
Feedbacks
Adapted from Kump et al (1999)
29
The Proterozoic Glaciations
(Snowball Earth)
httpwwwsnowballearthorg
Images courtesy of NASAReading bullHoffman amp Schrag (2002) Terra Nova Vol 14(3)129-155 bullLubick (2002) Nature Vol 417 12-13
30
Figure 1 (A) Present-day locations of the Neoproterozoic successions
GSA Bulletin September 2005 v 117 no 9-10 p 1181-1207 Toward a Neoproterozoic composite carbon-isotope record Galen P Halverson Paul F Hoffman Daniel P Schrag Adam C Maloof and A Hugh N Rice
31
Image courtesy of the Geological Society of America Used with permission
f organic-C buried
13C fractionation εTOC
δ13C limestones
δ13C marine organic matter
750 Ma 720 Ma 580 Ma
MarinoanVaranger Sturtian glacial(s) glacial(s)
Carbon Isotopic Excursions 800-500Ma
What caused these massive
perturbations to the carbon cycle during the late Proterozoic
Hayes et al Chem Geol 161 37 1999
32
Courtesy Elsevier Inc httpwwwsciencedirectcom Used with permission
Neoproterozoic Glaciations Evidence
3-4 global glaciations followed by extreme greenhouses 750-580 Ma bullHarland (1964) Kirschvink (1992)
bullHoffman et al (1998) Science v 281 1342-6 Hoffman amp Schrag (2000) Sci Am Jan 68-75
Image removed due to copyright restrictions
Please see Fig 3 in Hoffman Paul F and Schrag Daniel P ldquoSnowball Earthrdquo Scientific American 282 (January 2000) 68
Snowball-related Events bullBreakup of equatorial supercontinent 770 Ma bullEnhanced weathering from increased rainfall (more land close to sea) bullDrawdown atmospheric CO2 Global cooling bullRunaway albedo effect when sea ice lt 30deg latitude bullGlobal glaciation for ~10 Myr (avg T ~ shy50degC) bullSea ice ~1000 m thick geothermal heat flux (007 Wm2) keeps ocean liquid
33
Tillites GeologicPacked pebbles sand amp Evidencemud Remnants of moraines for Glaciers
Copyright Marli Miller University of Oregon Image from Earth Science World Image Bank httpwwwearthscienceworldorgimages Used with permission
Glacial Striations Scratches from rocks dragged by moving ice
Courtesy Walter Siegmund Image from Wikimedia Commons httpcommonswikimediaorg
Used with permission
Dropstones Rocks transported by icebergs which melt releasing load into finely laminated sediment (IRD)
Copyright Bruce Molnia Terra Photographics Image from Earth Science World Image Bank Kump et al (1999)httpwwwearthscienceworldorgimages
Used with permission
34
Glacial sediments ndash poorly sorted angular clasts including dropstones ndash Namibia c 750 Ma
Courtesy Daniel Schrag Used with permission
35
Image removed due to copyright restriction
Please see Fig 2 in Hoffman Paul F and Schrag Daniel P ldquoThe Snowball Earth Hypothesis Testing the Limits of Global Changerdquo Terra Nova 14 (2002) 129-155
Neoproterozoic Glacial Deposits
From Norway Mauritania NW Canada Namibia Australia Oman
bullGlacial striations bullDropstones bullDiamictites bullAnomalous Iron Formations
36
Equatorial Continents
Image removed due to copyright restrictions
Please see Fig 1 in Hoffman Paul F and Schrag Daniel P ldquoSnowball Earthrdquo Scientific American 282 (January 2000) 68
bullHarland amp Rudwick (1964) identified glacial sediments at what looked like equatorial latitudes by paleomagnetism bullGeorge Williams (1975) identified low a latitude glacial sequence in S Australia amp attributed to episode of extreme obliquity (tilt)
37
Determining Paleolatitude from Remnant Magnetism
bullPaleomagnetism latitude of formation of rock
bullNatural Remnant Magnetism (NRM) inclination varies with magnetic latitude -vertical magn poles -horz magn equator (many Neoprot glac deposits)
bullMagn polar drift avgs out on T~10 ky
Image from P Hoffman
38
This image has been removed due to copyright restrictions
Paleolatitude from
Paleomagnetism Image removed due to copyright restriction
Please see Fig 1 in Hoffman Paul F and Schrag Daniel P ldquoThe Snowball Earth Hypothesis Testing the Limits of Global Changerdquo Terra Nova 14 (2002) 129-155
39
What can explain glaciers on all continents when they
appear to have been close to the equator
40
High Obliquity Hypothesis
George Williams (1975)
bullEarths tilt (obliquity) controls seasonality bullAt high tilt angles (gt 54deg) the poles receive more mean annual solar radiation than the tropics (sun constantly overhead in summer) bullGlaciers may be able to form at low latitudes Problems bullEven the tropics get quite warm at the equinoxes bullMoon stabilizes obliquity bullWould need v large impact to destabilize moon orbit doesnt support this Image from P Hoffman
41
This image has been removed due to copyright restrictions
Snowball Earth Hypothesis ~3-4 global glaciations followed by extreme greenhouses 750-580 Ma
bullHarland (1964) Williams 1976-86 Kirschvink (1992) bullHoffman et al (1998) Science v 281 1342-6 Hoffman amp Schrag (2000) Sci Am Jan
68-75 Snowball Events
bullBreakup of equatorial supercontinent 770 Ma bullEnhanced weathering from increased rainfall (more land close to sea) bullDrawdown atmCO2 Global cooling bullRunaway albedo effect when sea ice lt 30deg latitude bullGlobal glaciation for ~10 Myr (avg T ~ -50degC) bullSea ice ~1000 m thick geothermal heat flux (007 Wm2) keeps ocean
Images courtesy of NASA liquid
42
Image removed due to copyright restrictions
Please see Fig 2 in Hoffman Paul F and Schrag Daniel P ldquoSnowball Earthrdquo Scientific American 282 (January 2000) 68
lsquoProloguersquo to
Snowball
bullBreakup of equatorial supercontinent bullEnhanced weathering from increased rainfall (more land close to sea) + carbon burial bullDrawdown atmospheric CO2 Global cooling
bullIs this enough
43
Image removed due to copyright restrictions
Please see Fig 2 in Hoffman Paul F and Schrag Daniel P ldquoSnowball Earthrdquo Scientific American 282 (January 2000) 68
Deep Freeze
bullGlobal cooling causes sea ice margin to move equatorward
bullRunaway albedo effect when sea ice lt30deg latitude
bullEntire ocean possibly covered with ice
44
Budyko-Sellers Runaway Albedo
Feedback
1 Eq continents incr weathering lowers CO2 slow cooling equatorward movement of ice
2 Runaway albedo 3 Slow buildup of CO2
from volcanoes 4 Rapid decay of ice in
102 yr High Ts from enhanced H20-T feedback
5 Slow CO2 drawdown from weathering
Image from P Hoffman
45
This image has been removed due to copyright restrictions
Profiles of the 1998 Blue Planet Prize Recipients
Dr Mikhail I Budyko ((Д-р ΜИ Будыко) (Born in January 1920 in Gomel in the former Soviet Union (now Belarus) Head of the Division for Climate Change Research State Hydrological Institute St Petersburg
As shown by the unusual weather patterns caused by the El Nino effect a wide spectrum of climate changes on Earth is having a profound effect on human lives and the environment Since the 1970s great advances have been made in climatology the scientific study of the close relationship between climate and the environment Playing a pivotal role in the development of climatology has been Dr Mikhail I Budyko one of this years winners of the Blue Planet Prize In the 1950s Dr Budyko conducted quantitative studies of the global climate by calculating the heat balance of the Earths surface This balance involves energy from the sun which is the most important determining factor for the Earths climate First Dr Budyko calculated the energy balance of certain regions of the Earth and then he verified his calculations by making comparisons with observational data Next using weather data collected from all over the world Dr Budyko carried out heat balance calculations for all regions of the world and confirmed that they checked out with observational data He announced his findings in 1956 with the publication of his book Heat Balance of the Earths Surface
46
Image removed due to copyright restrictions
Please see Fig 3 in Hoffman Paul F and Schrag Daniel P ldquoSnowball Earthrdquo Scientific American 282 (January 2000) 68
Snowball Peak
bullGlobal glaciation for ~10 Myr (avg T ~ -50degC)
bullSea ice ~1000 m thick geothermal heat flux (007 Wm2) keeps ocean liquid
47
Breaking out of the Snowball
bullVolcanic outgassing of CO2 over ~106 yr may have
Image removed due to copyright restrictions increased greenhouse effect Please see Fig 2 in Lubick sufficiently to melt back theNaomi ldquoPalaeoclimatology Snowball Fightsrdquo Nature 417 ice(May 2 2002) 12-13
48
Bring on the Heat Hothouse follows
Image removed due to copyright restrictions
Please see Fig 3 in Hoffman Paul F and Schrag Daniel P ldquoSnowball Earthrdquo Scientific American 282 (January 2000) 68
Snowball Hothouse Events
bullSlow CO2 buildup to ~350 PAL from volcanoes bullTropical ice melts albedo feedback decreases water vapor feedback increases bullGlobal T reaches ~ +50degC in 102 yr bullHigh T amp rainfall enhance weathering bullWeathering products + CO2 = carbonate precipitation in warm water
49
Evidence for Snowball Earth Hypothesis
bullStratigraphy globally-dispersed glacial deposits
bullCarbon isotopes negative δ13C excursions through glacial sections (δ13C reaches ~ -5 to -7permil) Little or no biological productivity (no light)
bullAnomalous banded iron formations wIRD only BIFs after 17 Ga Anoxic seawater covered by ice
bullCambrian explosion Rapid diversification of multicellular life 575-525 Ma expected to result from long periods of isolation and extreme environments (genetic bottleneck and flush)
50
Carbon Isotopic Evidence for Snowball δ13C values of -5permil (mantle value) consistent with dead ice-covered
ocean
Image from P Hoffman
51
This image has been removed due to copyright restrictions
Carbon Isotope
Fractionation
bullAs fraction of organic carbon buried approaches zero δ13C of CaCO3 approaches mantle (input) value
Image from P Hoffman
52
This image has been removed due to copyright restrictions
f organic-C buried
13C fractionation εTOC
δ13C limestones
δ13C marine organic matter
Carbon Isotopic Excursions 800-500Ma
More complete sediment record
+
Improved chronology
=
More detailed picture showing abrupt and extreme
C-isotopic shifts
A global composite of 13C data shows 4 excursions
Plus one at the pC-C boundary
Hayes et al Chem Geol 161 37 1999
53
Courtesy Elsevier Inc httpwwwsciencedirectcom Used with permission
This image has been removed due to copyright restrictions
Please see Figure 2 Details -gt
Calibrating the Cryogenian Francis A Macdonald Mark D Schmitz James L Crowley Charles F Roots David S Jones Adam C Maloof Justin V StraussPhoebe A Cohen David T Johnston Daniel P Schrag SCIENCE VOL 327 5 MARCH 2010
Fig 2 Neoproterozoic composite carbonate d13C chemostratigraphy with U-Pb ID-TIMS ages that are directly linked to isotopic profiles (11) Bars indicate the time spans of fossil assemblages representing eukaryotic crown groups Asterisks indicate fossil groups of uncertain taxonomic affinity Bars faded upward reflect uncertainty in the minimum age constraint bars faded downward reflect uncertainty in the maximum age constraint Dashes represent the time span where a fossil record has not been identified but for which the eukaryotic groups presence is inferred from its occurrence in Ediacaran or Phanerozoic strata Dashes with question marks indicate that earlier records have been proposed but the relationships between these fossils and the crown groups are uncertain
54
Anomalous Banded Iron Formations
bullAfter a ~1 Gyr absence BIFs return to the geologic record
bullImplies an anoxic ocean
bullConsistent with ice-covered ocean
Image from P hoffman
55
This image has been removed due to copyright restrictions
BIF + Dropstone = Ice-covered anoxic ocean
McKenzie Mtns Western Canada Image from P Hoffman 56
This image has been removed due to copyright restrictions
Animal Radiation Response to genetic
bottlenecks amp flushes
Image from P Hoffman
57
This image has been removed due to copyright restrictions
One Complete Snowball-Hothouse Episode
Image from P Hoffman
58
This image has been removed due to copyright restrictions
The Geochemical Carbon Cycle
Image from P Hoffman 59
IThis image has been removed due to copyright restrictions
Geologic Evidence for Hothouse Aftermath Cap Carbonates
Thick sequences of inorganically precipitated CaCO3 overly all
Neoproterozoic glacial deposits
60
Image removed due to copyright restriction
Please see Fig 3 in Hoffman Paul F and Schrag Daniel P ldquoThe Snowball Earth Hypothesis Testing the Limits of Global Changerdquo Terra Nova 14 (2002) 129-155
Neoproterozoic Cap Carbonates-1
bullThick sequences of inorganically precipitated carbonate minerals overly Late Proterozoic glacial deposits bullConsistent with massive flux of weathering products to ocean in snowball aftermath
61
Cap Carbonates 3
Image removed due to copyright restriction
Please see Fig 5c in Hoffman Paul F and Schrag Daniel P ldquoThe Snowball Earth Hypothesis Testing the Limits of Global Changerdquo Terra Nova 14 (2002) 129-155
bullNamibia
62
Glacial Deposit Overlain by Cap
Image removed due to copyright restrictions Carbonate in Please see Prof Hoffmans site on the Snowball Earth hypothesis httpwwwsnowballearthorg Namibia (~700 Ma)
Hoffman amp Schrag (2000)
63
Image removed due to copyright restriction
Please see Fig 9 in Hoffman Paul F and Schrag Daniel P ldquoThe Snowball Earth Hypothesis Testing the Limits of Global Changerdquo Terra Nova 14 (2002) 129-155
Geologic amp Isotopic Change Associated with Snowball Event
(Namibia)
64
How Long Did it Last bullBig open question Recent work by Sam Bowring (MIT)
suggests Gaskiers glacial episode lasted lt 1 Myr
bullCanadian glacial episode with good age
Image removed due to copyright restrictions Please see Prof Hoffmans site on the Snowball Earth hypothesis controls probably httpwwwsnowballearthorg lasted lt 1 Myr
bullCap carbonates likely deposited within 103shy104 yr
Image from P Hoffman
65
How Long Did it Last
Gaskiers Fm Newfoundland
Images removed due to copyright restrictions
Images from S Bowring
66
How Long Did it Last Ediacaran-burying ash (Drook Formation)
Images removed due to copyright restrictions
Image from S Bowring
67
What kept this from happening after ~580 Ma bullHigher solar luminosity (~5 increase)
bullLess landmass near equator = lower weathering rates () John Edmond weathering rates limited by abundance of fresh rock not temperature
bullIncreased bioturbation (eukaryote diversity following re-oxygenation of ocean) Less C accumulation in sediments offsets lower weathering rates
bulllower iron and phosphorous concentrations in better-oxygenated Phanerozoic ocean [Fe(II) is soluble Fe(III) is less so] Decreased 1deg production = Decreased CO2 drawdown
What we would like to know CO2 concentrations through snowballhothouse cycle
68
Image removed due to copyright restrictions
Please see Lubick Naomi ldquoPalaeoclimatology Snowball Fightsrdquo Nature 417 (May 2 2002) 12-13
Potential Problems with the lsquoSnowball Earth hypothesisrsquo
bullOceanatmosphere climate models cannot seem to keep entire ocean covered with ice bullNo evidence for lower sea level bullWeathering reactions are slowhellip Maybe too slow to be the source of cap carbonates
69
Alternate Cause for Cap Carbonate Deposition amp 13C Depletions
Gas Hydrate Destabilization
Kennedy et al (2001) Geology Vol 29(5) 443-446
bullCaCO3 precipitation does not require increased weathering flux of minerals
bullCan be caused by increased seawater alkalinity resulting from CH4 consumption by sulphateshyreducing bacteria
70
Image removed due to copyright restrictions
Please see Fig 1 in Kennedy Martin J et al ldquoAre Proterozoic Cap Carbonates and Isotopic Excursion a Record of Gas Hydrate Destabilization Following Earthrsquos Coldest Intervalsrdquo Geology 29 (May 2001) 443-446
Structures in Cap Carbonates May Result from Gas
Release bullGas Hydrate = [H2O + hydrocarbon (CH4)] ice bullCH4 from biogenic + thermogenic decomposition of deeply buried CorgbullBiogenic CH4 has very low o13C (-60 to-90permil) bullSequestered as hydrate in permafrost (gt 150 m) amp along continental margins (gt 300 m) bullDestabilized by increased temperature bullCH4 released from flooded permafrost during deglaciation
71
A Biogeochemical Model of the Proterozoic Ocean
Image removed due to copyright restrictions
Please see Fig 3a in Logan Graham A et al ldquoTerminal Proterozoic Reorganization of Biogeochemical Cyclesrdquo Nature 376 (July 6 1995) 53-56
72
After Ventilation
Image removed due to copyright restrictions
Please see Fig 3b in Logan Graham A et al ldquoTerminal Proterozoic Reorganization of Biogeochemical Cyclesrdquo Nature 376 (July 6 1995) 53-56
73
A Carbon Cycle with Two Timescales
oi
weathering volcanism
o1 1
o2-8
o2 o2 2
sedimentoa oo carbonate carbon organic carbon
74
Summarybull The C-cycle has evolved radically through time bull Prior to 22 Ga anaerobic prokaryotes dominated wide spread of oorg (oo)
values oxygenic photosynthesis extant but oxygen remained low as sinks gtgt sources
bull Mantle may have been an important sink for oxidising power bull Extreme ocarb(oa) values around 22 Ga probably signify the lsquoGOErsquo and rise
to prominence of aerobes Decreased spread of oorg (oa) values mayreflect dominance of aerobic autotrophs and reductive pentose (Benson-Calvin C3) cycle
bull Although ample evidence for aerobes the abundance of O2 in atm and ocean remained low (sulfidic ocean) until another major oxidation eventcaused a second lsquoreorganizationrsquo In the Neoproterozoic This was also signified by extreme oa fluctuations
bull The Neoproterozoic lsquoreorganizationrsquo led to pO2 rising to near PALallowing animals to flourish and stabilizing the new regime
bull Environmental evolution reflected changes in the balance between thermal crustal atmospheric amp biological processes
75
Pre-Quaternary climates
South America Africa
India
Permian pole
Glacial Striation Origin of permo shyCarboniferous Glaciation
COLD
Australia
Antarctica
Arabia
Permo-Carboniferrous Glaciations (~300-275 Ma)
Image removed due to copyright restrictions
Figure by MIT OpenCourseWare
Generalized diagram illustrating evidence for origination of Permo-Carboniferous glaciation on one large landmass Arrows indicate direction of glacial flow X = Permian pole position [After Sullivan 1974] Reproduced by permission from W Sullivan Continents in Motion The New Earth Debate copyright 1974 McGraw-Hill Publishing Co
76
Corg burial rate estimated from o13C in CaCO3
Image removed due to copyright restrictions
Please see Fig 10-9 in Stanley (course text)
Atmospheric O2 estimated from Corg burial rate
77
Mesozoic Warmth
-Ferns amp alligators in Siberia
Jurassic 220-140 Ma
78
Image from httpsimplewikipediaorgwikiFileAlligator3jpg in public domain
Image from httpcommonswikimediaorgwikiFileCoelurus_stegosaurusjpg in public domain
High CO2 Levels During MesozoicDecreasing CO2
Mesozoic i 13C = t CO2 Image removed due to copyright restrictions
Please see Fig 2 in Popp Brian N et al ldquoThe Post-Paleozoic Chronology and Mechanism of 13C Depletion in Primary Marine Organic Matterrdquo Am J of Science 289 (April 1989) 436-454
i Seafloor spreading rate
1 i CO2 outgassing
2 i subduction rate = i carbonate metamorphism = i CO2 production
3 i sea level (hotter oceanic crusthigher ridge volume = t land area
t weathering Increasing CO2
t CO2 sink
79
Cenozoic CO2 DecreaseDecreasing CO2
Image removed due to copyright restrictions
Please see Fig 2 in Popp Brian N et al ldquoThe Post-Paleozoic Chronology and Mechanism of 13C Depletion in Primary Marine Organic Matterrdquo Am J of Science 289 (April 1989) 436-454
Increasing CO2
80
What causes glacial-interglacial CO2 variations
(a still-unanswered question) Possible Scenario for lower glacial pCO2
bullIncreased Equator-Pole T gradient Wind strength Dust flux to ocean Iron flux to ocean
bull50 of global 1deg production occurs in ocean bullOcean 1deg production is limited by iron bullHigher 1deg production draws CO2 out of atmosphere amp sequesters it in the deep ocean amp sediments bullColder seawater dissolves more CO2
81
Text has been removed due to copyright restrictions
Please see Veizer Jan et al ldquoEvidence for Decoupling of Atmospheric CO2 and Global Climate during the Phanerozoic Eonrdquo Nature 408 (December 7 2000) 698
While a large and growing body of
evidence indicates that CO2 and climate co-vary there is some indication that the two may not be
closely linked at all timeshellip
(amp it is always important to remember that
correlation does not always mean causation)
82
Text removed due to copyright restrictions
Please see Hoffman Paul F ldquoComment on lsquoSnowball Earth on Trialrsquordquo Eos 88 (February 2007) 110
83
Text removed due to copyright restrictions
Please see Allen Phillip A ldquoReply to lsquoComment on Snowball Earth on Trialrsquordquo Eos 88 (February 2007) 110
84
Evidence for Glaciers on All Continents 09-06 Ga
Image removed due to copyright restrictions
Please see Fig 123 in Crowley T J and North G R Paleoclimatology New York NY Oxford University Press 1992 ISBN 0195105338
85
Neither albedo or
geothermal heat flux
changes can keep the
Earth from freezing w
30 lower S
Adapted from Kump et al (1999)
86
Therefore Lower S must have
been compensated by larger greenhouse
effect
Adapted from Kump et al (1999)
87
httpwwwscotesecomprecambrhtm
Image removed due to copyright restrictions
Please see httpwwwscotesecomimages650jpg
This map illustrates the break-up of the supercontinent Rodinia which formed 1100 million years ago The Late Precambrian was an Ice House World much like the present-day
88
Figure 15 Two permissible calibrations of the composite carbon-isotope record in Figure 14 based on available radiometric dates and delta 13C data that can be correlated into the record and contrasting interpretations of the age and duration of the Sturtian and Marinoan glaciations
GSA Bulletin September 2005 v 117 no 9-10 p 1181-1207 Toward a Neoproterozoic composite carbon-isotope record Galen P Halverson Paul F Hoffman Daniel P Schrag Adam C Maloof and A Hugh N Rice
89Image courtesy of the Geological Society of America Used with permission
GSA Bulletin September 2005 v 117 no 9-10 p 1181-1207 Toward a Neoproterozoic composite carbon-isotope record Galen P Halverson Paul F Hoffman Daniel P Schrag Adam C Maloof and A Hugh N Rice
90Image courtesy of the Geological Society of America Used with permission
MIT OpenCourseWarehttpocwmitedu
12007 Geobiology Spring 2013
For information about citing these materials or our Terms of Use visit httpocwmiteduterms
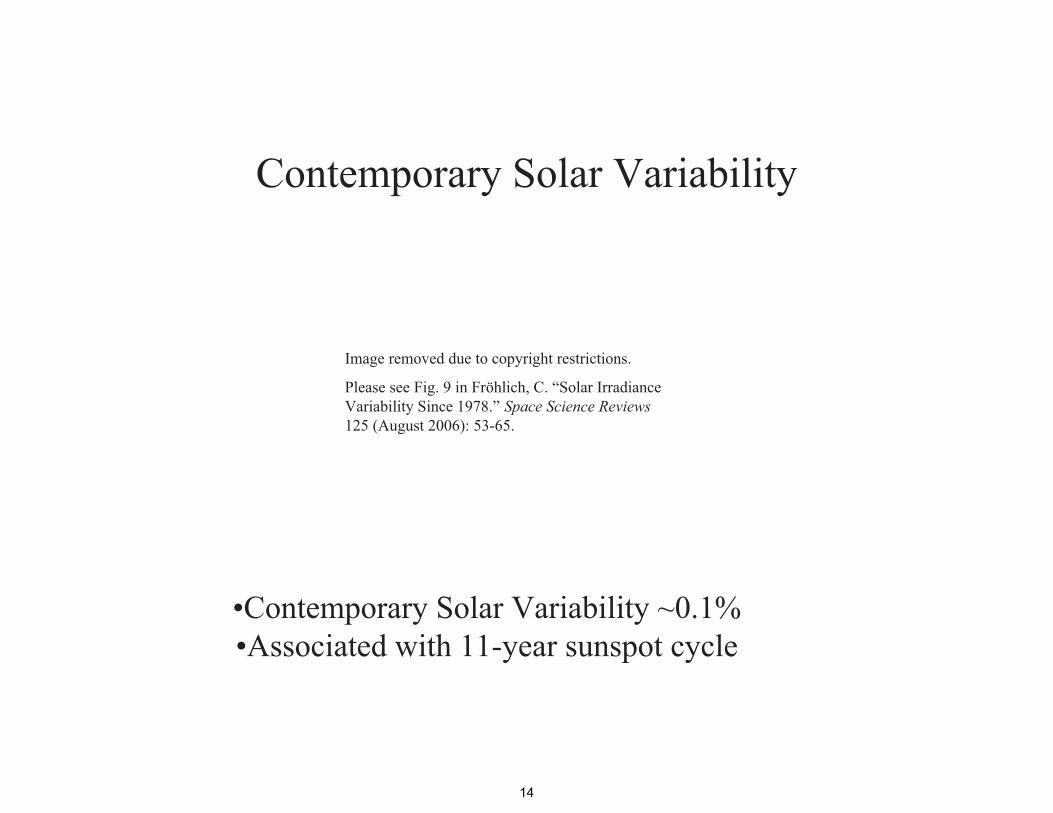
Image removed due to copyright restrictions
Please see Fig 1 in Hofmann D J et al ldquoTracking Climate Forcing The Annual Greenhouse Gas Indexrdquo Eos 87 (November 14 2006) 509-511
18
Image removed due to copyright restrictions
Please see Fig 2 in Hofmann D J et al ldquoTracking Climate Forcing The Annual Greenhouse Gas Indexrdquo Eos 87 (November 14 2006) 509-511
19
How much CO2 Required for TS gt 0degC
Image removed due to copyright restrictions
Please see Fig 2 in Kasting James F ldquoEarthrsquos Early Atmosphererdquo Science 259 (February 12 1993) 920-926
httpwwwgeoscpsuedu~kastingPersonalPage PdfScience_93pdf
Venus Same qty of C as Earth All in atmos -gt TS lt 450degC
20
Mostly sunny with a 10 chance of snow Earths Climate History
Images courtesy of NASA
What caused these climate perturbations
21
This image has been removed due to copyright restrictions
Steady State amp Residence Time Steady State Inflows = Outflows
Any imbalance in I or O leads to changes in reservoir size
Inflow Atmospheric CO2
760 Gton C
Outflow 60 Gton Cyr 60 Gton Cyr
Respiration Photosynthesis
1 Gton = 109 1000 kg = 1015 g
The Residence time of a molecule is the average amount of time it is expected to remain in a given reservoir
Example tR of atmospheric CO2 = 76060 = 13 yr
22
The Biogeochemical
Carbon Cycle
23
----------------------------------------------
+ H2O
-------------------------------------
Chemical Weathering = chemical attack of rocks by dilute acid
C O2 + H2O lt---gt H2CO3
1 Carbonate Weathering The - BiogeochemicalC a C O3 + H2CO3 --gt Ca2+ + 2 HCO3
Carbon Cycle 2 Silicate Weathering
C a S i O3 + 2 H2CO3 --gt Ca2+ + 2HCO3- + SiO2
bull 2x CO2 consumption for silicates
bull Carbonates weather faster than silicates
24
Carbonate Image removed due to copyright restrictions rocks weather
faster than silicate rocks
25
Products of Image removed due to copyright restrictions weathering
Please see Kump L R et alThe Earth System Upper Saddle River NJ Pearson Prentice Hall 1999 precipitaed as
CaCO3 amp SiO2 in ocean
26
-------------------------------------
Net Reaction of Rock Weathering +
Carbonate and Silica Precipitation in Ocean
CaSiO3 + CO2 --gt CaCO3 + SiO2
bull CO2 consumed (~ 003 Gt Cyr)
bull Would deplete atmospheric CO2 in 20 kyr
bull Plate tectonics returns CO2 via Volcanism and Metamorphism
Carbonate Metamorphism
C a C O3 + SiO2 --gt CaSiO3 + CO2
bull CO2 produced from subducted marine sediments
Net reaction of
geochemical carbon cycle
(Urey Reaction)
27
Image removed due to copyright restrictions
Please see Fig 10-11 in Stanley (course text)
Carbonate-Silicate Geochemical Cycle
bullCO2 released from volcanism dissolves in H2O forming carbonic acid H2CO3
bullH2CO3 dissolves rocks
bullWeathering products transported to ocean by rivers
bullCaCO3 precipitation in shallow amp deep water
bullCycle closed when CaCO3 metamorphosed in subduction zone or during orogeny
28
bull Geologic record indicates climate has rarely reached or maintained extreme Greenhouse or Icehouse conditions
bull Negative feedbacks between climate and Geochemical Carbon Cycle must exist
bull Thus far only identified for Carbonate-Silicate Geochemical Cycle
Temp rainfall enhance weathering rates (Walker et al 1981)
(Ie no obvious climate dependence of tectonics or organic carbon geochemical cycle)
How are CO2 levels
kept in balance
Feedbacks
Adapted from Kump et al (1999)
29
The Proterozoic Glaciations
(Snowball Earth)
httpwwwsnowballearthorg
Images courtesy of NASAReading bullHoffman amp Schrag (2002) Terra Nova Vol 14(3)129-155 bullLubick (2002) Nature Vol 417 12-13
30
Figure 1 (A) Present-day locations of the Neoproterozoic successions
GSA Bulletin September 2005 v 117 no 9-10 p 1181-1207 Toward a Neoproterozoic composite carbon-isotope record Galen P Halverson Paul F Hoffman Daniel P Schrag Adam C Maloof and A Hugh N Rice
31
Image courtesy of the Geological Society of America Used with permission
f organic-C buried
13C fractionation εTOC
δ13C limestones
δ13C marine organic matter
750 Ma 720 Ma 580 Ma
MarinoanVaranger Sturtian glacial(s) glacial(s)
Carbon Isotopic Excursions 800-500Ma
What caused these massive
perturbations to the carbon cycle during the late Proterozoic
Hayes et al Chem Geol 161 37 1999
32
Courtesy Elsevier Inc httpwwwsciencedirectcom Used with permission
Neoproterozoic Glaciations Evidence
3-4 global glaciations followed by extreme greenhouses 750-580 Ma bullHarland (1964) Kirschvink (1992)
bullHoffman et al (1998) Science v 281 1342-6 Hoffman amp Schrag (2000) Sci Am Jan 68-75
Image removed due to copyright restrictions
Please see Fig 3 in Hoffman Paul F and Schrag Daniel P ldquoSnowball Earthrdquo Scientific American 282 (January 2000) 68
Snowball-related Events bullBreakup of equatorial supercontinent 770 Ma bullEnhanced weathering from increased rainfall (more land close to sea) bullDrawdown atmospheric CO2 Global cooling bullRunaway albedo effect when sea ice lt 30deg latitude bullGlobal glaciation for ~10 Myr (avg T ~ shy50degC) bullSea ice ~1000 m thick geothermal heat flux (007 Wm2) keeps ocean liquid
33
Tillites GeologicPacked pebbles sand amp Evidencemud Remnants of moraines for Glaciers
Copyright Marli Miller University of Oregon Image from Earth Science World Image Bank httpwwwearthscienceworldorgimages Used with permission
Glacial Striations Scratches from rocks dragged by moving ice
Courtesy Walter Siegmund Image from Wikimedia Commons httpcommonswikimediaorg
Used with permission
Dropstones Rocks transported by icebergs which melt releasing load into finely laminated sediment (IRD)
Copyright Bruce Molnia Terra Photographics Image from Earth Science World Image Bank Kump et al (1999)httpwwwearthscienceworldorgimages
Used with permission
34
Glacial sediments ndash poorly sorted angular clasts including dropstones ndash Namibia c 750 Ma
Courtesy Daniel Schrag Used with permission
35
Image removed due to copyright restriction
Please see Fig 2 in Hoffman Paul F and Schrag Daniel P ldquoThe Snowball Earth Hypothesis Testing the Limits of Global Changerdquo Terra Nova 14 (2002) 129-155
Neoproterozoic Glacial Deposits
From Norway Mauritania NW Canada Namibia Australia Oman
bullGlacial striations bullDropstones bullDiamictites bullAnomalous Iron Formations
36
Equatorial Continents
Image removed due to copyright restrictions
Please see Fig 1 in Hoffman Paul F and Schrag Daniel P ldquoSnowball Earthrdquo Scientific American 282 (January 2000) 68
bullHarland amp Rudwick (1964) identified glacial sediments at what looked like equatorial latitudes by paleomagnetism bullGeorge Williams (1975) identified low a latitude glacial sequence in S Australia amp attributed to episode of extreme obliquity (tilt)
37
Determining Paleolatitude from Remnant Magnetism
bullPaleomagnetism latitude of formation of rock
bullNatural Remnant Magnetism (NRM) inclination varies with magnetic latitude -vertical magn poles -horz magn equator (many Neoprot glac deposits)
bullMagn polar drift avgs out on T~10 ky
Image from P Hoffman
38
This image has been removed due to copyright restrictions
Paleolatitude from
Paleomagnetism Image removed due to copyright restriction
Please see Fig 1 in Hoffman Paul F and Schrag Daniel P ldquoThe Snowball Earth Hypothesis Testing the Limits of Global Changerdquo Terra Nova 14 (2002) 129-155
39
What can explain glaciers on all continents when they
appear to have been close to the equator
40
High Obliquity Hypothesis
George Williams (1975)
bullEarths tilt (obliquity) controls seasonality bullAt high tilt angles (gt 54deg) the poles receive more mean annual solar radiation than the tropics (sun constantly overhead in summer) bullGlaciers may be able to form at low latitudes Problems bullEven the tropics get quite warm at the equinoxes bullMoon stabilizes obliquity bullWould need v large impact to destabilize moon orbit doesnt support this Image from P Hoffman
41
This image has been removed due to copyright restrictions
Snowball Earth Hypothesis ~3-4 global glaciations followed by extreme greenhouses 750-580 Ma
bullHarland (1964) Williams 1976-86 Kirschvink (1992) bullHoffman et al (1998) Science v 281 1342-6 Hoffman amp Schrag (2000) Sci Am Jan
68-75 Snowball Events
bullBreakup of equatorial supercontinent 770 Ma bullEnhanced weathering from increased rainfall (more land close to sea) bullDrawdown atmCO2 Global cooling bullRunaway albedo effect when sea ice lt 30deg latitude bullGlobal glaciation for ~10 Myr (avg T ~ -50degC) bullSea ice ~1000 m thick geothermal heat flux (007 Wm2) keeps ocean
Images courtesy of NASA liquid
42
Image removed due to copyright restrictions
Please see Fig 2 in Hoffman Paul F and Schrag Daniel P ldquoSnowball Earthrdquo Scientific American 282 (January 2000) 68
lsquoProloguersquo to
Snowball
bullBreakup of equatorial supercontinent bullEnhanced weathering from increased rainfall (more land close to sea) + carbon burial bullDrawdown atmospheric CO2 Global cooling
bullIs this enough
43
Image removed due to copyright restrictions
Please see Fig 2 in Hoffman Paul F and Schrag Daniel P ldquoSnowball Earthrdquo Scientific American 282 (January 2000) 68
Deep Freeze
bullGlobal cooling causes sea ice margin to move equatorward
bullRunaway albedo effect when sea ice lt30deg latitude
bullEntire ocean possibly covered with ice
44
Budyko-Sellers Runaway Albedo
Feedback
1 Eq continents incr weathering lowers CO2 slow cooling equatorward movement of ice
2 Runaway albedo 3 Slow buildup of CO2
from volcanoes 4 Rapid decay of ice in
102 yr High Ts from enhanced H20-T feedback
5 Slow CO2 drawdown from weathering
Image from P Hoffman
45
This image has been removed due to copyright restrictions
Profiles of the 1998 Blue Planet Prize Recipients
Dr Mikhail I Budyko ((Д-р ΜИ Будыко) (Born in January 1920 in Gomel in the former Soviet Union (now Belarus) Head of the Division for Climate Change Research State Hydrological Institute St Petersburg
As shown by the unusual weather patterns caused by the El Nino effect a wide spectrum of climate changes on Earth is having a profound effect on human lives and the environment Since the 1970s great advances have been made in climatology the scientific study of the close relationship between climate and the environment Playing a pivotal role in the development of climatology has been Dr Mikhail I Budyko one of this years winners of the Blue Planet Prize In the 1950s Dr Budyko conducted quantitative studies of the global climate by calculating the heat balance of the Earths surface This balance involves energy from the sun which is the most important determining factor for the Earths climate First Dr Budyko calculated the energy balance of certain regions of the Earth and then he verified his calculations by making comparisons with observational data Next using weather data collected from all over the world Dr Budyko carried out heat balance calculations for all regions of the world and confirmed that they checked out with observational data He announced his findings in 1956 with the publication of his book Heat Balance of the Earths Surface
46
Image removed due to copyright restrictions
Please see Fig 3 in Hoffman Paul F and Schrag Daniel P ldquoSnowball Earthrdquo Scientific American 282 (January 2000) 68
Snowball Peak
bullGlobal glaciation for ~10 Myr (avg T ~ -50degC)
bullSea ice ~1000 m thick geothermal heat flux (007 Wm2) keeps ocean liquid
47
Breaking out of the Snowball
bullVolcanic outgassing of CO2 over ~106 yr may have
Image removed due to copyright restrictions increased greenhouse effect Please see Fig 2 in Lubick sufficiently to melt back theNaomi ldquoPalaeoclimatology Snowball Fightsrdquo Nature 417 ice(May 2 2002) 12-13
48
Bring on the Heat Hothouse follows
Image removed due to copyright restrictions
Please see Fig 3 in Hoffman Paul F and Schrag Daniel P ldquoSnowball Earthrdquo Scientific American 282 (January 2000) 68
Snowball Hothouse Events
bullSlow CO2 buildup to ~350 PAL from volcanoes bullTropical ice melts albedo feedback decreases water vapor feedback increases bullGlobal T reaches ~ +50degC in 102 yr bullHigh T amp rainfall enhance weathering bullWeathering products + CO2 = carbonate precipitation in warm water
49
Evidence for Snowball Earth Hypothesis
bullStratigraphy globally-dispersed glacial deposits
bullCarbon isotopes negative δ13C excursions through glacial sections (δ13C reaches ~ -5 to -7permil) Little or no biological productivity (no light)
bullAnomalous banded iron formations wIRD only BIFs after 17 Ga Anoxic seawater covered by ice
bullCambrian explosion Rapid diversification of multicellular life 575-525 Ma expected to result from long periods of isolation and extreme environments (genetic bottleneck and flush)
50
Carbon Isotopic Evidence for Snowball δ13C values of -5permil (mantle value) consistent with dead ice-covered
ocean
Image from P Hoffman
51
This image has been removed due to copyright restrictions
Carbon Isotope
Fractionation
bullAs fraction of organic carbon buried approaches zero δ13C of CaCO3 approaches mantle (input) value
Image from P Hoffman
52
This image has been removed due to copyright restrictions
f organic-C buried
13C fractionation εTOC
δ13C limestones
δ13C marine organic matter
Carbon Isotopic Excursions 800-500Ma
More complete sediment record
+
Improved chronology
=
More detailed picture showing abrupt and extreme
C-isotopic shifts
A global composite of 13C data shows 4 excursions
Plus one at the pC-C boundary
Hayes et al Chem Geol 161 37 1999
53
Courtesy Elsevier Inc httpwwwsciencedirectcom Used with permission
This image has been removed due to copyright restrictions
Please see Figure 2 Details -gt
Calibrating the Cryogenian Francis A Macdonald Mark D Schmitz James L Crowley Charles F Roots David S Jones Adam C Maloof Justin V StraussPhoebe A Cohen David T Johnston Daniel P Schrag SCIENCE VOL 327 5 MARCH 2010
Fig 2 Neoproterozoic composite carbonate d13C chemostratigraphy with U-Pb ID-TIMS ages that are directly linked to isotopic profiles (11) Bars indicate the time spans of fossil assemblages representing eukaryotic crown groups Asterisks indicate fossil groups of uncertain taxonomic affinity Bars faded upward reflect uncertainty in the minimum age constraint bars faded downward reflect uncertainty in the maximum age constraint Dashes represent the time span where a fossil record has not been identified but for which the eukaryotic groups presence is inferred from its occurrence in Ediacaran or Phanerozoic strata Dashes with question marks indicate that earlier records have been proposed but the relationships between these fossils and the crown groups are uncertain
54
Anomalous Banded Iron Formations
bullAfter a ~1 Gyr absence BIFs return to the geologic record
bullImplies an anoxic ocean
bullConsistent with ice-covered ocean
Image from P hoffman
55
This image has been removed due to copyright restrictions
BIF + Dropstone = Ice-covered anoxic ocean
McKenzie Mtns Western Canada Image from P Hoffman 56
This image has been removed due to copyright restrictions
Animal Radiation Response to genetic
bottlenecks amp flushes
Image from P Hoffman
57
This image has been removed due to copyright restrictions
One Complete Snowball-Hothouse Episode
Image from P Hoffman
58
This image has been removed due to copyright restrictions
The Geochemical Carbon Cycle
Image from P Hoffman 59
IThis image has been removed due to copyright restrictions
Geologic Evidence for Hothouse Aftermath Cap Carbonates
Thick sequences of inorganically precipitated CaCO3 overly all
Neoproterozoic glacial deposits
60
Image removed due to copyright restriction
Please see Fig 3 in Hoffman Paul F and Schrag Daniel P ldquoThe Snowball Earth Hypothesis Testing the Limits of Global Changerdquo Terra Nova 14 (2002) 129-155
Neoproterozoic Cap Carbonates-1
bullThick sequences of inorganically precipitated carbonate minerals overly Late Proterozoic glacial deposits bullConsistent with massive flux of weathering products to ocean in snowball aftermath
61
Cap Carbonates 3
Image removed due to copyright restriction
Please see Fig 5c in Hoffman Paul F and Schrag Daniel P ldquoThe Snowball Earth Hypothesis Testing the Limits of Global Changerdquo Terra Nova 14 (2002) 129-155
bullNamibia
62
Glacial Deposit Overlain by Cap
Image removed due to copyright restrictions Carbonate in Please see Prof Hoffmans site on the Snowball Earth hypothesis httpwwwsnowballearthorg Namibia (~700 Ma)
Hoffman amp Schrag (2000)
63
Image removed due to copyright restriction
Please see Fig 9 in Hoffman Paul F and Schrag Daniel P ldquoThe Snowball Earth Hypothesis Testing the Limits of Global Changerdquo Terra Nova 14 (2002) 129-155
Geologic amp Isotopic Change Associated with Snowball Event
(Namibia)
64
How Long Did it Last bullBig open question Recent work by Sam Bowring (MIT)
suggests Gaskiers glacial episode lasted lt 1 Myr
bullCanadian glacial episode with good age
Image removed due to copyright restrictions Please see Prof Hoffmans site on the Snowball Earth hypothesis controls probably httpwwwsnowballearthorg lasted lt 1 Myr
bullCap carbonates likely deposited within 103shy104 yr
Image from P Hoffman
65
How Long Did it Last
Gaskiers Fm Newfoundland
Images removed due to copyright restrictions
Images from S Bowring
66
How Long Did it Last Ediacaran-burying ash (Drook Formation)
Images removed due to copyright restrictions
Image from S Bowring
67
What kept this from happening after ~580 Ma bullHigher solar luminosity (~5 increase)
bullLess landmass near equator = lower weathering rates () John Edmond weathering rates limited by abundance of fresh rock not temperature
bullIncreased bioturbation (eukaryote diversity following re-oxygenation of ocean) Less C accumulation in sediments offsets lower weathering rates
bulllower iron and phosphorous concentrations in better-oxygenated Phanerozoic ocean [Fe(II) is soluble Fe(III) is less so] Decreased 1deg production = Decreased CO2 drawdown
What we would like to know CO2 concentrations through snowballhothouse cycle
68
Image removed due to copyright restrictions
Please see Lubick Naomi ldquoPalaeoclimatology Snowball Fightsrdquo Nature 417 (May 2 2002) 12-13
Potential Problems with the lsquoSnowball Earth hypothesisrsquo
bullOceanatmosphere climate models cannot seem to keep entire ocean covered with ice bullNo evidence for lower sea level bullWeathering reactions are slowhellip Maybe too slow to be the source of cap carbonates
69
Alternate Cause for Cap Carbonate Deposition amp 13C Depletions
Gas Hydrate Destabilization
Kennedy et al (2001) Geology Vol 29(5) 443-446
bullCaCO3 precipitation does not require increased weathering flux of minerals
bullCan be caused by increased seawater alkalinity resulting from CH4 consumption by sulphateshyreducing bacteria
70
Image removed due to copyright restrictions
Please see Fig 1 in Kennedy Martin J et al ldquoAre Proterozoic Cap Carbonates and Isotopic Excursion a Record of Gas Hydrate Destabilization Following Earthrsquos Coldest Intervalsrdquo Geology 29 (May 2001) 443-446
Structures in Cap Carbonates May Result from Gas
Release bullGas Hydrate = [H2O + hydrocarbon (CH4)] ice bullCH4 from biogenic + thermogenic decomposition of deeply buried CorgbullBiogenic CH4 has very low o13C (-60 to-90permil) bullSequestered as hydrate in permafrost (gt 150 m) amp along continental margins (gt 300 m) bullDestabilized by increased temperature bullCH4 released from flooded permafrost during deglaciation
71
A Biogeochemical Model of the Proterozoic Ocean
Image removed due to copyright restrictions
Please see Fig 3a in Logan Graham A et al ldquoTerminal Proterozoic Reorganization of Biogeochemical Cyclesrdquo Nature 376 (July 6 1995) 53-56
72
After Ventilation
Image removed due to copyright restrictions
Please see Fig 3b in Logan Graham A et al ldquoTerminal Proterozoic Reorganization of Biogeochemical Cyclesrdquo Nature 376 (July 6 1995) 53-56
73
A Carbon Cycle with Two Timescales
oi
weathering volcanism
o1 1
o2-8
o2 o2 2
sedimentoa oo carbonate carbon organic carbon
74
Summarybull The C-cycle has evolved radically through time bull Prior to 22 Ga anaerobic prokaryotes dominated wide spread of oorg (oo)
values oxygenic photosynthesis extant but oxygen remained low as sinks gtgt sources
bull Mantle may have been an important sink for oxidising power bull Extreme ocarb(oa) values around 22 Ga probably signify the lsquoGOErsquo and rise
to prominence of aerobes Decreased spread of oorg (oa) values mayreflect dominance of aerobic autotrophs and reductive pentose (Benson-Calvin C3) cycle
bull Although ample evidence for aerobes the abundance of O2 in atm and ocean remained low (sulfidic ocean) until another major oxidation eventcaused a second lsquoreorganizationrsquo In the Neoproterozoic This was also signified by extreme oa fluctuations
bull The Neoproterozoic lsquoreorganizationrsquo led to pO2 rising to near PALallowing animals to flourish and stabilizing the new regime
bull Environmental evolution reflected changes in the balance between thermal crustal atmospheric amp biological processes
75
Pre-Quaternary climates
South America Africa
India
Permian pole
Glacial Striation Origin of permo shyCarboniferous Glaciation
COLD
Australia
Antarctica
Arabia
Permo-Carboniferrous Glaciations (~300-275 Ma)
Image removed due to copyright restrictions
Figure by MIT OpenCourseWare
Generalized diagram illustrating evidence for origination of Permo-Carboniferous glaciation on one large landmass Arrows indicate direction of glacial flow X = Permian pole position [After Sullivan 1974] Reproduced by permission from W Sullivan Continents in Motion The New Earth Debate copyright 1974 McGraw-Hill Publishing Co
76
Corg burial rate estimated from o13C in CaCO3
Image removed due to copyright restrictions
Please see Fig 10-9 in Stanley (course text)
Atmospheric O2 estimated from Corg burial rate
77
Mesozoic Warmth
-Ferns amp alligators in Siberia
Jurassic 220-140 Ma
78
Image from httpsimplewikipediaorgwikiFileAlligator3jpg in public domain
Image from httpcommonswikimediaorgwikiFileCoelurus_stegosaurusjpg in public domain
High CO2 Levels During MesozoicDecreasing CO2
Mesozoic i 13C = t CO2 Image removed due to copyright restrictions
Please see Fig 2 in Popp Brian N et al ldquoThe Post-Paleozoic Chronology and Mechanism of 13C Depletion in Primary Marine Organic Matterrdquo Am J of Science 289 (April 1989) 436-454
i Seafloor spreading rate
1 i CO2 outgassing
2 i subduction rate = i carbonate metamorphism = i CO2 production
3 i sea level (hotter oceanic crusthigher ridge volume = t land area
t weathering Increasing CO2
t CO2 sink
79
Cenozoic CO2 DecreaseDecreasing CO2
Image removed due to copyright restrictions
Please see Fig 2 in Popp Brian N et al ldquoThe Post-Paleozoic Chronology and Mechanism of 13C Depletion in Primary Marine Organic Matterrdquo Am J of Science 289 (April 1989) 436-454
Increasing CO2
80
What causes glacial-interglacial CO2 variations
(a still-unanswered question) Possible Scenario for lower glacial pCO2
bullIncreased Equator-Pole T gradient Wind strength Dust flux to ocean Iron flux to ocean
bull50 of global 1deg production occurs in ocean bullOcean 1deg production is limited by iron bullHigher 1deg production draws CO2 out of atmosphere amp sequesters it in the deep ocean amp sediments bullColder seawater dissolves more CO2
81
Text has been removed due to copyright restrictions
Please see Veizer Jan et al ldquoEvidence for Decoupling of Atmospheric CO2 and Global Climate during the Phanerozoic Eonrdquo Nature 408 (December 7 2000) 698
While a large and growing body of
evidence indicates that CO2 and climate co-vary there is some indication that the two may not be
closely linked at all timeshellip
(amp it is always important to remember that
correlation does not always mean causation)
82
Text removed due to copyright restrictions
Please see Hoffman Paul F ldquoComment on lsquoSnowball Earth on Trialrsquordquo Eos 88 (February 2007) 110
83
Text removed due to copyright restrictions
Please see Allen Phillip A ldquoReply to lsquoComment on Snowball Earth on Trialrsquordquo Eos 88 (February 2007) 110
84
Evidence for Glaciers on All Continents 09-06 Ga
Image removed due to copyright restrictions
Please see Fig 123 in Crowley T J and North G R Paleoclimatology New York NY Oxford University Press 1992 ISBN 0195105338
85
Neither albedo or
geothermal heat flux
changes can keep the
Earth from freezing w
30 lower S
Adapted from Kump et al (1999)
86
Therefore Lower S must have
been compensated by larger greenhouse
effect
Adapted from Kump et al (1999)
87
httpwwwscotesecomprecambrhtm
Image removed due to copyright restrictions
Please see httpwwwscotesecomimages650jpg
This map illustrates the break-up of the supercontinent Rodinia which formed 1100 million years ago The Late Precambrian was an Ice House World much like the present-day
88
Figure 15 Two permissible calibrations of the composite carbon-isotope record in Figure 14 based on available radiometric dates and delta 13C data that can be correlated into the record and contrasting interpretations of the age and duration of the Sturtian and Marinoan glaciations
GSA Bulletin September 2005 v 117 no 9-10 p 1181-1207 Toward a Neoproterozoic composite carbon-isotope record Galen P Halverson Paul F Hoffman Daniel P Schrag Adam C Maloof and A Hugh N Rice
89Image courtesy of the Geological Society of America Used with permission
GSA Bulletin September 2005 v 117 no 9-10 p 1181-1207 Toward a Neoproterozoic composite carbon-isotope record Galen P Halverson Paul F Hoffman Daniel P Schrag Adam C Maloof and A Hugh N Rice
90Image courtesy of the Geological Society of America Used with permission
MIT OpenCourseWarehttpocwmitedu
12007 Geobiology Spring 2013
For information about citing these materials or our Terms of Use visit httpocwmiteduterms

Image removed due to copyright restrictions
Please see Fig 2 in Hofmann D J et al ldquoTracking Climate Forcing The Annual Greenhouse Gas Indexrdquo Eos 87 (November 14 2006) 509-511
19
How much CO2 Required for TS gt 0degC
Image removed due to copyright restrictions
Please see Fig 2 in Kasting James F ldquoEarthrsquos Early Atmosphererdquo Science 259 (February 12 1993) 920-926
httpwwwgeoscpsuedu~kastingPersonalPage PdfScience_93pdf
Venus Same qty of C as Earth All in atmos -gt TS lt 450degC
20
Mostly sunny with a 10 chance of snow Earths Climate History
Images courtesy of NASA
What caused these climate perturbations
21
This image has been removed due to copyright restrictions
Steady State amp Residence Time Steady State Inflows = Outflows
Any imbalance in I or O leads to changes in reservoir size
Inflow Atmospheric CO2
760 Gton C
Outflow 60 Gton Cyr 60 Gton Cyr
Respiration Photosynthesis
1 Gton = 109 1000 kg = 1015 g
The Residence time of a molecule is the average amount of time it is expected to remain in a given reservoir
Example tR of atmospheric CO2 = 76060 = 13 yr
22
The Biogeochemical
Carbon Cycle
23
----------------------------------------------
+ H2O
-------------------------------------
Chemical Weathering = chemical attack of rocks by dilute acid
C O2 + H2O lt---gt H2CO3
1 Carbonate Weathering The - BiogeochemicalC a C O3 + H2CO3 --gt Ca2+ + 2 HCO3
Carbon Cycle 2 Silicate Weathering
C a S i O3 + 2 H2CO3 --gt Ca2+ + 2HCO3- + SiO2
bull 2x CO2 consumption for silicates
bull Carbonates weather faster than silicates
24
Carbonate Image removed due to copyright restrictions rocks weather
faster than silicate rocks
25
Products of Image removed due to copyright restrictions weathering
Please see Kump L R et alThe Earth System Upper Saddle River NJ Pearson Prentice Hall 1999 precipitaed as
CaCO3 amp SiO2 in ocean
26
-------------------------------------
Net Reaction of Rock Weathering +
Carbonate and Silica Precipitation in Ocean
CaSiO3 + CO2 --gt CaCO3 + SiO2
bull CO2 consumed (~ 003 Gt Cyr)
bull Would deplete atmospheric CO2 in 20 kyr
bull Plate tectonics returns CO2 via Volcanism and Metamorphism
Carbonate Metamorphism
C a C O3 + SiO2 --gt CaSiO3 + CO2
bull CO2 produced from subducted marine sediments
Net reaction of
geochemical carbon cycle
(Urey Reaction)
27
Image removed due to copyright restrictions
Please see Fig 10-11 in Stanley (course text)
Carbonate-Silicate Geochemical Cycle
bullCO2 released from volcanism dissolves in H2O forming carbonic acid H2CO3
bullH2CO3 dissolves rocks
bullWeathering products transported to ocean by rivers
bullCaCO3 precipitation in shallow amp deep water
bullCycle closed when CaCO3 metamorphosed in subduction zone or during orogeny
28
bull Geologic record indicates climate has rarely reached or maintained extreme Greenhouse or Icehouse conditions
bull Negative feedbacks between climate and Geochemical Carbon Cycle must exist
bull Thus far only identified for Carbonate-Silicate Geochemical Cycle
Temp rainfall enhance weathering rates (Walker et al 1981)
(Ie no obvious climate dependence of tectonics or organic carbon geochemical cycle)
How are CO2 levels
kept in balance
Feedbacks
Adapted from Kump et al (1999)
29
The Proterozoic Glaciations
(Snowball Earth)
httpwwwsnowballearthorg
Images courtesy of NASAReading bullHoffman amp Schrag (2002) Terra Nova Vol 14(3)129-155 bullLubick (2002) Nature Vol 417 12-13
30
Figure 1 (A) Present-day locations of the Neoproterozoic successions
GSA Bulletin September 2005 v 117 no 9-10 p 1181-1207 Toward a Neoproterozoic composite carbon-isotope record Galen P Halverson Paul F Hoffman Daniel P Schrag Adam C Maloof and A Hugh N Rice
31
Image courtesy of the Geological Society of America Used with permission
f organic-C buried
13C fractionation εTOC
δ13C limestones
δ13C marine organic matter
750 Ma 720 Ma 580 Ma
MarinoanVaranger Sturtian glacial(s) glacial(s)
Carbon Isotopic Excursions 800-500Ma
What caused these massive
perturbations to the carbon cycle during the late Proterozoic
Hayes et al Chem Geol 161 37 1999
32
Courtesy Elsevier Inc httpwwwsciencedirectcom Used with permission
Neoproterozoic Glaciations Evidence
3-4 global glaciations followed by extreme greenhouses 750-580 Ma bullHarland (1964) Kirschvink (1992)
bullHoffman et al (1998) Science v 281 1342-6 Hoffman amp Schrag (2000) Sci Am Jan 68-75
Image removed due to copyright restrictions
Please see Fig 3 in Hoffman Paul F and Schrag Daniel P ldquoSnowball Earthrdquo Scientific American 282 (January 2000) 68
Snowball-related Events bullBreakup of equatorial supercontinent 770 Ma bullEnhanced weathering from increased rainfall (more land close to sea) bullDrawdown atmospheric CO2 Global cooling bullRunaway albedo effect when sea ice lt 30deg latitude bullGlobal glaciation for ~10 Myr (avg T ~ shy50degC) bullSea ice ~1000 m thick geothermal heat flux (007 Wm2) keeps ocean liquid
33
Tillites GeologicPacked pebbles sand amp Evidencemud Remnants of moraines for Glaciers
Copyright Marli Miller University of Oregon Image from Earth Science World Image Bank httpwwwearthscienceworldorgimages Used with permission
Glacial Striations Scratches from rocks dragged by moving ice
Courtesy Walter Siegmund Image from Wikimedia Commons httpcommonswikimediaorg
Used with permission
Dropstones Rocks transported by icebergs which melt releasing load into finely laminated sediment (IRD)
Copyright Bruce Molnia Terra Photographics Image from Earth Science World Image Bank Kump et al (1999)httpwwwearthscienceworldorgimages
Used with permission
34
Glacial sediments ndash poorly sorted angular clasts including dropstones ndash Namibia c 750 Ma
Courtesy Daniel Schrag Used with permission
35
Image removed due to copyright restriction
Please see Fig 2 in Hoffman Paul F and Schrag Daniel P ldquoThe Snowball Earth Hypothesis Testing the Limits of Global Changerdquo Terra Nova 14 (2002) 129-155
Neoproterozoic Glacial Deposits
From Norway Mauritania NW Canada Namibia Australia Oman
bullGlacial striations bullDropstones bullDiamictites bullAnomalous Iron Formations
36
Equatorial Continents
Image removed due to copyright restrictions
Please see Fig 1 in Hoffman Paul F and Schrag Daniel P ldquoSnowball Earthrdquo Scientific American 282 (January 2000) 68
bullHarland amp Rudwick (1964) identified glacial sediments at what looked like equatorial latitudes by paleomagnetism bullGeorge Williams (1975) identified low a latitude glacial sequence in S Australia amp attributed to episode of extreme obliquity (tilt)
37
Determining Paleolatitude from Remnant Magnetism
bullPaleomagnetism latitude of formation of rock
bullNatural Remnant Magnetism (NRM) inclination varies with magnetic latitude -vertical magn poles -horz magn equator (many Neoprot glac deposits)
bullMagn polar drift avgs out on T~10 ky
Image from P Hoffman
38
This image has been removed due to copyright restrictions
Paleolatitude from
Paleomagnetism Image removed due to copyright restriction
Please see Fig 1 in Hoffman Paul F and Schrag Daniel P ldquoThe Snowball Earth Hypothesis Testing the Limits of Global Changerdquo Terra Nova 14 (2002) 129-155
39
What can explain glaciers on all continents when they
appear to have been close to the equator
40
High Obliquity Hypothesis
George Williams (1975)
bullEarths tilt (obliquity) controls seasonality bullAt high tilt angles (gt 54deg) the poles receive more mean annual solar radiation than the tropics (sun constantly overhead in summer) bullGlaciers may be able to form at low latitudes Problems bullEven the tropics get quite warm at the equinoxes bullMoon stabilizes obliquity bullWould need v large impact to destabilize moon orbit doesnt support this Image from P Hoffman
41
This image has been removed due to copyright restrictions
Snowball Earth Hypothesis ~3-4 global glaciations followed by extreme greenhouses 750-580 Ma
bullHarland (1964) Williams 1976-86 Kirschvink (1992) bullHoffman et al (1998) Science v 281 1342-6 Hoffman amp Schrag (2000) Sci Am Jan
68-75 Snowball Events
bullBreakup of equatorial supercontinent 770 Ma bullEnhanced weathering from increased rainfall (more land close to sea) bullDrawdown atmCO2 Global cooling bullRunaway albedo effect when sea ice lt 30deg latitude bullGlobal glaciation for ~10 Myr (avg T ~ -50degC) bullSea ice ~1000 m thick geothermal heat flux (007 Wm2) keeps ocean
Images courtesy of NASA liquid
42
Image removed due to copyright restrictions
Please see Fig 2 in Hoffman Paul F and Schrag Daniel P ldquoSnowball Earthrdquo Scientific American 282 (January 2000) 68
lsquoProloguersquo to
Snowball
bullBreakup of equatorial supercontinent bullEnhanced weathering from increased rainfall (more land close to sea) + carbon burial bullDrawdown atmospheric CO2 Global cooling
bullIs this enough
43
Image removed due to copyright restrictions
Please see Fig 2 in Hoffman Paul F and Schrag Daniel P ldquoSnowball Earthrdquo Scientific American 282 (January 2000) 68
Deep Freeze
bullGlobal cooling causes sea ice margin to move equatorward
bullRunaway albedo effect when sea ice lt30deg latitude
bullEntire ocean possibly covered with ice
44
Budyko-Sellers Runaway Albedo
Feedback
1 Eq continents incr weathering lowers CO2 slow cooling equatorward movement of ice
2 Runaway albedo 3 Slow buildup of CO2
from volcanoes 4 Rapid decay of ice in
102 yr High Ts from enhanced H20-T feedback
5 Slow CO2 drawdown from weathering
Image from P Hoffman
45
This image has been removed due to copyright restrictions
Profiles of the 1998 Blue Planet Prize Recipients
Dr Mikhail I Budyko ((Д-р ΜИ Будыко) (Born in January 1920 in Gomel in the former Soviet Union (now Belarus) Head of the Division for Climate Change Research State Hydrological Institute St Petersburg
As shown by the unusual weather patterns caused by the El Nino effect a wide spectrum of climate changes on Earth is having a profound effect on human lives and the environment Since the 1970s great advances have been made in climatology the scientific study of the close relationship between climate and the environment Playing a pivotal role in the development of climatology has been Dr Mikhail I Budyko one of this years winners of the Blue Planet Prize In the 1950s Dr Budyko conducted quantitative studies of the global climate by calculating the heat balance of the Earths surface This balance involves energy from the sun which is the most important determining factor for the Earths climate First Dr Budyko calculated the energy balance of certain regions of the Earth and then he verified his calculations by making comparisons with observational data Next using weather data collected from all over the world Dr Budyko carried out heat balance calculations for all regions of the world and confirmed that they checked out with observational data He announced his findings in 1956 with the publication of his book Heat Balance of the Earths Surface
46
Image removed due to copyright restrictions
Please see Fig 3 in Hoffman Paul F and Schrag Daniel P ldquoSnowball Earthrdquo Scientific American 282 (January 2000) 68
Snowball Peak
bullGlobal glaciation for ~10 Myr (avg T ~ -50degC)
bullSea ice ~1000 m thick geothermal heat flux (007 Wm2) keeps ocean liquid
47
Breaking out of the Snowball
bullVolcanic outgassing of CO2 over ~106 yr may have
Image removed due to copyright restrictions increased greenhouse effect Please see Fig 2 in Lubick sufficiently to melt back theNaomi ldquoPalaeoclimatology Snowball Fightsrdquo Nature 417 ice(May 2 2002) 12-13
48
Bring on the Heat Hothouse follows
Image removed due to copyright restrictions
Please see Fig 3 in Hoffman Paul F and Schrag Daniel P ldquoSnowball Earthrdquo Scientific American 282 (January 2000) 68
Snowball Hothouse Events
bullSlow CO2 buildup to ~350 PAL from volcanoes bullTropical ice melts albedo feedback decreases water vapor feedback increases bullGlobal T reaches ~ +50degC in 102 yr bullHigh T amp rainfall enhance weathering bullWeathering products + CO2 = carbonate precipitation in warm water
49
Evidence for Snowball Earth Hypothesis
bullStratigraphy globally-dispersed glacial deposits
bullCarbon isotopes negative δ13C excursions through glacial sections (δ13C reaches ~ -5 to -7permil) Little or no biological productivity (no light)
bullAnomalous banded iron formations wIRD only BIFs after 17 Ga Anoxic seawater covered by ice
bullCambrian explosion Rapid diversification of multicellular life 575-525 Ma expected to result from long periods of isolation and extreme environments (genetic bottleneck and flush)
50
Carbon Isotopic Evidence for Snowball δ13C values of -5permil (mantle value) consistent with dead ice-covered
ocean
Image from P Hoffman
51
This image has been removed due to copyright restrictions
Carbon Isotope
Fractionation
bullAs fraction of organic carbon buried approaches zero δ13C of CaCO3 approaches mantle (input) value
Image from P Hoffman
52
This image has been removed due to copyright restrictions
f organic-C buried
13C fractionation εTOC
δ13C limestones
δ13C marine organic matter
Carbon Isotopic Excursions 800-500Ma
More complete sediment record
+
Improved chronology
=
More detailed picture showing abrupt and extreme
C-isotopic shifts
A global composite of 13C data shows 4 excursions
Plus one at the pC-C boundary
Hayes et al Chem Geol 161 37 1999
53
Courtesy Elsevier Inc httpwwwsciencedirectcom Used with permission
This image has been removed due to copyright restrictions
Please see Figure 2 Details -gt
Calibrating the Cryogenian Francis A Macdonald Mark D Schmitz James L Crowley Charles F Roots David S Jones Adam C Maloof Justin V StraussPhoebe A Cohen David T Johnston Daniel P Schrag SCIENCE VOL 327 5 MARCH 2010
Fig 2 Neoproterozoic composite carbonate d13C chemostratigraphy with U-Pb ID-TIMS ages that are directly linked to isotopic profiles (11) Bars indicate the time spans of fossil assemblages representing eukaryotic crown groups Asterisks indicate fossil groups of uncertain taxonomic affinity Bars faded upward reflect uncertainty in the minimum age constraint bars faded downward reflect uncertainty in the maximum age constraint Dashes represent the time span where a fossil record has not been identified but for which the eukaryotic groups presence is inferred from its occurrence in Ediacaran or Phanerozoic strata Dashes with question marks indicate that earlier records have been proposed but the relationships between these fossils and the crown groups are uncertain
54
Anomalous Banded Iron Formations
bullAfter a ~1 Gyr absence BIFs return to the geologic record
bullImplies an anoxic ocean
bullConsistent with ice-covered ocean
Image from P hoffman
55
This image has been removed due to copyright restrictions
BIF + Dropstone = Ice-covered anoxic ocean
McKenzie Mtns Western Canada Image from P Hoffman 56
This image has been removed due to copyright restrictions
Animal Radiation Response to genetic
bottlenecks amp flushes
Image from P Hoffman
57
This image has been removed due to copyright restrictions
One Complete Snowball-Hothouse Episode
Image from P Hoffman
58
This image has been removed due to copyright restrictions
The Geochemical Carbon Cycle
Image from P Hoffman 59
IThis image has been removed due to copyright restrictions
Geologic Evidence for Hothouse Aftermath Cap Carbonates
Thick sequences of inorganically precipitated CaCO3 overly all
Neoproterozoic glacial deposits
60
Image removed due to copyright restriction
Please see Fig 3 in Hoffman Paul F and Schrag Daniel P ldquoThe Snowball Earth Hypothesis Testing the Limits of Global Changerdquo Terra Nova 14 (2002) 129-155
Neoproterozoic Cap Carbonates-1
bullThick sequences of inorganically precipitated carbonate minerals overly Late Proterozoic glacial deposits bullConsistent with massive flux of weathering products to ocean in snowball aftermath
61
Cap Carbonates 3
Image removed due to copyright restriction
Please see Fig 5c in Hoffman Paul F and Schrag Daniel P ldquoThe Snowball Earth Hypothesis Testing the Limits of Global Changerdquo Terra Nova 14 (2002) 129-155
bullNamibia
62
Glacial Deposit Overlain by Cap
Image removed due to copyright restrictions Carbonate in Please see Prof Hoffmans site on the Snowball Earth hypothesis httpwwwsnowballearthorg Namibia (~700 Ma)
Hoffman amp Schrag (2000)
63
Image removed due to copyright restriction
Please see Fig 9 in Hoffman Paul F and Schrag Daniel P ldquoThe Snowball Earth Hypothesis Testing the Limits of Global Changerdquo Terra Nova 14 (2002) 129-155
Geologic amp Isotopic Change Associated with Snowball Event
(Namibia)
64
How Long Did it Last bullBig open question Recent work by Sam Bowring (MIT)
suggests Gaskiers glacial episode lasted lt 1 Myr
bullCanadian glacial episode with good age
Image removed due to copyright restrictions Please see Prof Hoffmans site on the Snowball Earth hypothesis controls probably httpwwwsnowballearthorg lasted lt 1 Myr
bullCap carbonates likely deposited within 103shy104 yr
Image from P Hoffman
65
How Long Did it Last
Gaskiers Fm Newfoundland
Images removed due to copyright restrictions
Images from S Bowring
66
How Long Did it Last Ediacaran-burying ash (Drook Formation)
Images removed due to copyright restrictions
Image from S Bowring
67
What kept this from happening after ~580 Ma bullHigher solar luminosity (~5 increase)
bullLess landmass near equator = lower weathering rates () John Edmond weathering rates limited by abundance of fresh rock not temperature
bullIncreased bioturbation (eukaryote diversity following re-oxygenation of ocean) Less C accumulation in sediments offsets lower weathering rates
bulllower iron and phosphorous concentrations in better-oxygenated Phanerozoic ocean [Fe(II) is soluble Fe(III) is less so] Decreased 1deg production = Decreased CO2 drawdown
What we would like to know CO2 concentrations through snowballhothouse cycle
68
Image removed due to copyright restrictions
Please see Lubick Naomi ldquoPalaeoclimatology Snowball Fightsrdquo Nature 417 (May 2 2002) 12-13
Potential Problems with the lsquoSnowball Earth hypothesisrsquo
bullOceanatmosphere climate models cannot seem to keep entire ocean covered with ice bullNo evidence for lower sea level bullWeathering reactions are slowhellip Maybe too slow to be the source of cap carbonates
69
Alternate Cause for Cap Carbonate Deposition amp 13C Depletions
Gas Hydrate Destabilization
Kennedy et al (2001) Geology Vol 29(5) 443-446
bullCaCO3 precipitation does not require increased weathering flux of minerals
bullCan be caused by increased seawater alkalinity resulting from CH4 consumption by sulphateshyreducing bacteria
70
Image removed due to copyright restrictions
Please see Fig 1 in Kennedy Martin J et al ldquoAre Proterozoic Cap Carbonates and Isotopic Excursion a Record of Gas Hydrate Destabilization Following Earthrsquos Coldest Intervalsrdquo Geology 29 (May 2001) 443-446
Structures in Cap Carbonates May Result from Gas
Release bullGas Hydrate = [H2O + hydrocarbon (CH4)] ice bullCH4 from biogenic + thermogenic decomposition of deeply buried CorgbullBiogenic CH4 has very low o13C (-60 to-90permil) bullSequestered as hydrate in permafrost (gt 150 m) amp along continental margins (gt 300 m) bullDestabilized by increased temperature bullCH4 released from flooded permafrost during deglaciation
71
A Biogeochemical Model of the Proterozoic Ocean
Image removed due to copyright restrictions
Please see Fig 3a in Logan Graham A et al ldquoTerminal Proterozoic Reorganization of Biogeochemical Cyclesrdquo Nature 376 (July 6 1995) 53-56
72
After Ventilation
Image removed due to copyright restrictions
Please see Fig 3b in Logan Graham A et al ldquoTerminal Proterozoic Reorganization of Biogeochemical Cyclesrdquo Nature 376 (July 6 1995) 53-56
73
A Carbon Cycle with Two Timescales
oi
weathering volcanism
o1 1
o2-8
o2 o2 2
sedimentoa oo carbonate carbon organic carbon
74
Summarybull The C-cycle has evolved radically through time bull Prior to 22 Ga anaerobic prokaryotes dominated wide spread of oorg (oo)
values oxygenic photosynthesis extant but oxygen remained low as sinks gtgt sources
bull Mantle may have been an important sink for oxidising power bull Extreme ocarb(oa) values around 22 Ga probably signify the lsquoGOErsquo and rise
to prominence of aerobes Decreased spread of oorg (oa) values mayreflect dominance of aerobic autotrophs and reductive pentose (Benson-Calvin C3) cycle
bull Although ample evidence for aerobes the abundance of O2 in atm and ocean remained low (sulfidic ocean) until another major oxidation eventcaused a second lsquoreorganizationrsquo In the Neoproterozoic This was also signified by extreme oa fluctuations
bull The Neoproterozoic lsquoreorganizationrsquo led to pO2 rising to near PALallowing animals to flourish and stabilizing the new regime
bull Environmental evolution reflected changes in the balance between thermal crustal atmospheric amp biological processes
75
Pre-Quaternary climates
South America Africa
India
Permian pole
Glacial Striation Origin of permo shyCarboniferous Glaciation
COLD
Australia
Antarctica
Arabia
Permo-Carboniferrous Glaciations (~300-275 Ma)
Image removed due to copyright restrictions
Figure by MIT OpenCourseWare
Generalized diagram illustrating evidence for origination of Permo-Carboniferous glaciation on one large landmass Arrows indicate direction of glacial flow X = Permian pole position [After Sullivan 1974] Reproduced by permission from W Sullivan Continents in Motion The New Earth Debate copyright 1974 McGraw-Hill Publishing Co
76
Corg burial rate estimated from o13C in CaCO3
Image removed due to copyright restrictions
Please see Fig 10-9 in Stanley (course text)
Atmospheric O2 estimated from Corg burial rate
77
Mesozoic Warmth
-Ferns amp alligators in Siberia
Jurassic 220-140 Ma
78
Image from httpsimplewikipediaorgwikiFileAlligator3jpg in public domain
Image from httpcommonswikimediaorgwikiFileCoelurus_stegosaurusjpg in public domain
High CO2 Levels During MesozoicDecreasing CO2
Mesozoic i 13C = t CO2 Image removed due to copyright restrictions
Please see Fig 2 in Popp Brian N et al ldquoThe Post-Paleozoic Chronology and Mechanism of 13C Depletion in Primary Marine Organic Matterrdquo Am J of Science 289 (April 1989) 436-454
i Seafloor spreading rate
1 i CO2 outgassing
2 i subduction rate = i carbonate metamorphism = i CO2 production
3 i sea level (hotter oceanic crusthigher ridge volume = t land area
t weathering Increasing CO2
t CO2 sink
79
Cenozoic CO2 DecreaseDecreasing CO2
Image removed due to copyright restrictions
Please see Fig 2 in Popp Brian N et al ldquoThe Post-Paleozoic Chronology and Mechanism of 13C Depletion in Primary Marine Organic Matterrdquo Am J of Science 289 (April 1989) 436-454
Increasing CO2
80
What causes glacial-interglacial CO2 variations
(a still-unanswered question) Possible Scenario for lower glacial pCO2
bullIncreased Equator-Pole T gradient Wind strength Dust flux to ocean Iron flux to ocean
bull50 of global 1deg production occurs in ocean bullOcean 1deg production is limited by iron bullHigher 1deg production draws CO2 out of atmosphere amp sequesters it in the deep ocean amp sediments bullColder seawater dissolves more CO2
81
Text has been removed due to copyright restrictions
Please see Veizer Jan et al ldquoEvidence for Decoupling of Atmospheric CO2 and Global Climate during the Phanerozoic Eonrdquo Nature 408 (December 7 2000) 698
While a large and growing body of
evidence indicates that CO2 and climate co-vary there is some indication that the two may not be
closely linked at all timeshellip
(amp it is always important to remember that
correlation does not always mean causation)
82
Text removed due to copyright restrictions
Please see Hoffman Paul F ldquoComment on lsquoSnowball Earth on Trialrsquordquo Eos 88 (February 2007) 110
83
Text removed due to copyright restrictions
Please see Allen Phillip A ldquoReply to lsquoComment on Snowball Earth on Trialrsquordquo Eos 88 (February 2007) 110
84
Evidence for Glaciers on All Continents 09-06 Ga
Image removed due to copyright restrictions
Please see Fig 123 in Crowley T J and North G R Paleoclimatology New York NY Oxford University Press 1992 ISBN 0195105338
85
Neither albedo or
geothermal heat flux
changes can keep the
Earth from freezing w
30 lower S
Adapted from Kump et al (1999)
86
Therefore Lower S must have
been compensated by larger greenhouse
effect
Adapted from Kump et al (1999)
87
httpwwwscotesecomprecambrhtm
Image removed due to copyright restrictions
Please see httpwwwscotesecomimages650jpg
This map illustrates the break-up of the supercontinent Rodinia which formed 1100 million years ago The Late Precambrian was an Ice House World much like the present-day
88
Figure 15 Two permissible calibrations of the composite carbon-isotope record in Figure 14 based on available radiometric dates and delta 13C data that can be correlated into the record and contrasting interpretations of the age and duration of the Sturtian and Marinoan glaciations
GSA Bulletin September 2005 v 117 no 9-10 p 1181-1207 Toward a Neoproterozoic composite carbon-isotope record Galen P Halverson Paul F Hoffman Daniel P Schrag Adam C Maloof and A Hugh N Rice
89Image courtesy of the Geological Society of America Used with permission
GSA Bulletin September 2005 v 117 no 9-10 p 1181-1207 Toward a Neoproterozoic composite carbon-isotope record Galen P Halverson Paul F Hoffman Daniel P Schrag Adam C Maloof and A Hugh N Rice
90Image courtesy of the Geological Society of America Used with permission
MIT OpenCourseWarehttpocwmitedu
12007 Geobiology Spring 2013
For information about citing these materials or our Terms of Use visit httpocwmiteduterms
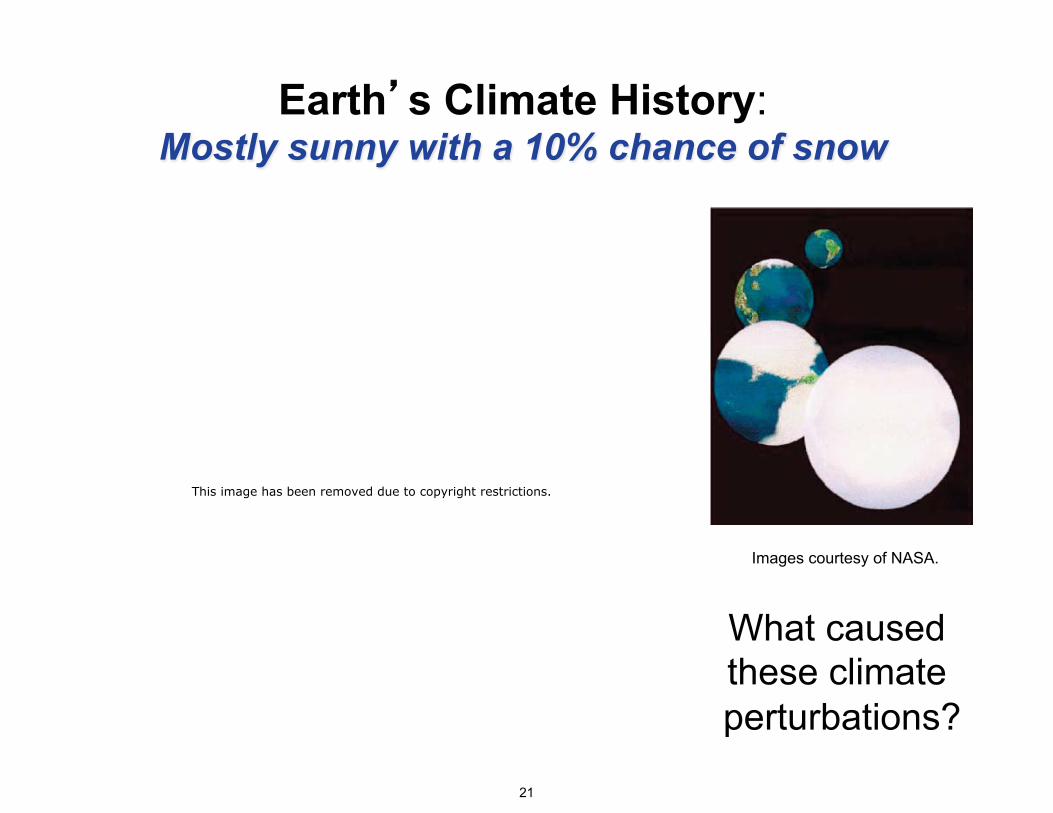
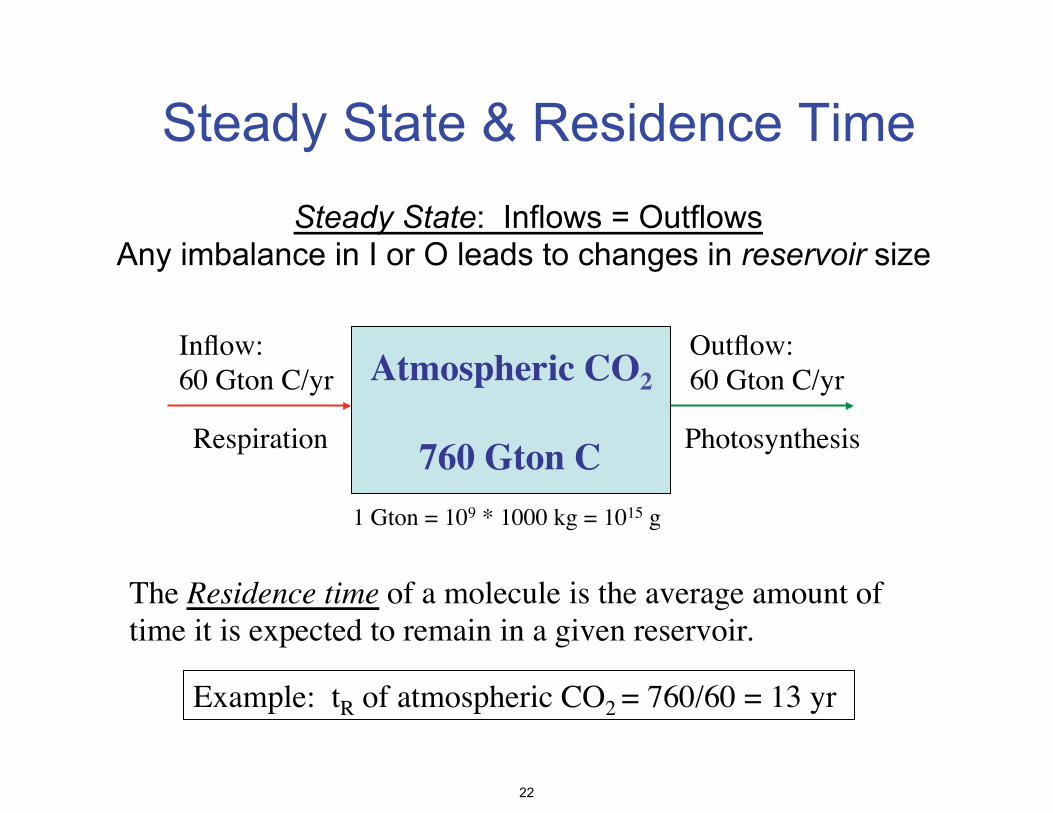

Image removed due to copyright restrictions
Please see Fig 10-11 in Stanley (course text)
Carbonate-Silicate Geochemical Cycle
bullCO2 released from volcanism dissolves in H2O forming carbonic acid H2CO3
bullH2CO3 dissolves rocks
bullWeathering products transported to ocean by rivers
bullCaCO3 precipitation in shallow amp deep water
bullCycle closed when CaCO3 metamorphosed in subduction zone or during orogeny
28
bull Geologic record indicates climate has rarely reached or maintained extreme Greenhouse or Icehouse conditions
bull Negative feedbacks between climate and Geochemical Carbon Cycle must exist
bull Thus far only identified for Carbonate-Silicate Geochemical Cycle
Temp rainfall enhance weathering rates (Walker et al 1981)
(Ie no obvious climate dependence of tectonics or organic carbon geochemical cycle)
How are CO2 levels
kept in balance
Feedbacks
Adapted from Kump et al (1999)
29
The Proterozoic Glaciations
(Snowball Earth)
httpwwwsnowballearthorg
Images courtesy of NASAReading bullHoffman amp Schrag (2002) Terra Nova Vol 14(3)129-155 bullLubick (2002) Nature Vol 417 12-13
30
Figure 1 (A) Present-day locations of the Neoproterozoic successions
GSA Bulletin September 2005 v 117 no 9-10 p 1181-1207 Toward a Neoproterozoic composite carbon-isotope record Galen P Halverson Paul F Hoffman Daniel P Schrag Adam C Maloof and A Hugh N Rice
31
Image courtesy of the Geological Society of America Used with permission
f organic-C buried
13C fractionation εTOC
δ13C limestones
δ13C marine organic matter
750 Ma 720 Ma 580 Ma
MarinoanVaranger Sturtian glacial(s) glacial(s)
Carbon Isotopic Excursions 800-500Ma
What caused these massive
perturbations to the carbon cycle during the late Proterozoic
Hayes et al Chem Geol 161 37 1999
32
Courtesy Elsevier Inc httpwwwsciencedirectcom Used with permission
Neoproterozoic Glaciations Evidence
3-4 global glaciations followed by extreme greenhouses 750-580 Ma bullHarland (1964) Kirschvink (1992)
bullHoffman et al (1998) Science v 281 1342-6 Hoffman amp Schrag (2000) Sci Am Jan 68-75
Image removed due to copyright restrictions
Please see Fig 3 in Hoffman Paul F and Schrag Daniel P ldquoSnowball Earthrdquo Scientific American 282 (January 2000) 68
Snowball-related Events bullBreakup of equatorial supercontinent 770 Ma bullEnhanced weathering from increased rainfall (more land close to sea) bullDrawdown atmospheric CO2 Global cooling bullRunaway albedo effect when sea ice lt 30deg latitude bullGlobal glaciation for ~10 Myr (avg T ~ shy50degC) bullSea ice ~1000 m thick geothermal heat flux (007 Wm2) keeps ocean liquid
33
Tillites GeologicPacked pebbles sand amp Evidencemud Remnants of moraines for Glaciers
Copyright Marli Miller University of Oregon Image from Earth Science World Image Bank httpwwwearthscienceworldorgimages Used with permission
Glacial Striations Scratches from rocks dragged by moving ice
Courtesy Walter Siegmund Image from Wikimedia Commons httpcommonswikimediaorg
Used with permission
Dropstones Rocks transported by icebergs which melt releasing load into finely laminated sediment (IRD)
Copyright Bruce Molnia Terra Photographics Image from Earth Science World Image Bank Kump et al (1999)httpwwwearthscienceworldorgimages
Used with permission
34
Glacial sediments ndash poorly sorted angular clasts including dropstones ndash Namibia c 750 Ma
Courtesy Daniel Schrag Used with permission
35
Image removed due to copyright restriction
Please see Fig 2 in Hoffman Paul F and Schrag Daniel P ldquoThe Snowball Earth Hypothesis Testing the Limits of Global Changerdquo Terra Nova 14 (2002) 129-155
Neoproterozoic Glacial Deposits
From Norway Mauritania NW Canada Namibia Australia Oman
bullGlacial striations bullDropstones bullDiamictites bullAnomalous Iron Formations
36
Equatorial Continents
Image removed due to copyright restrictions
Please see Fig 1 in Hoffman Paul F and Schrag Daniel P ldquoSnowball Earthrdquo Scientific American 282 (January 2000) 68
bullHarland amp Rudwick (1964) identified glacial sediments at what looked like equatorial latitudes by paleomagnetism bullGeorge Williams (1975) identified low a latitude glacial sequence in S Australia amp attributed to episode of extreme obliquity (tilt)
37
Determining Paleolatitude from Remnant Magnetism
bullPaleomagnetism latitude of formation of rock
bullNatural Remnant Magnetism (NRM) inclination varies with magnetic latitude -vertical magn poles -horz magn equator (many Neoprot glac deposits)
bullMagn polar drift avgs out on T~10 ky
Image from P Hoffman
38
This image has been removed due to copyright restrictions
Paleolatitude from
Paleomagnetism Image removed due to copyright restriction
Please see Fig 1 in Hoffman Paul F and Schrag Daniel P ldquoThe Snowball Earth Hypothesis Testing the Limits of Global Changerdquo Terra Nova 14 (2002) 129-155
39
What can explain glaciers on all continents when they
appear to have been close to the equator
40
High Obliquity Hypothesis
George Williams (1975)
bullEarths tilt (obliquity) controls seasonality bullAt high tilt angles (gt 54deg) the poles receive more mean annual solar radiation than the tropics (sun constantly overhead in summer) bullGlaciers may be able to form at low latitudes Problems bullEven the tropics get quite warm at the equinoxes bullMoon stabilizes obliquity bullWould need v large impact to destabilize moon orbit doesnt support this Image from P Hoffman
41
This image has been removed due to copyright restrictions
Snowball Earth Hypothesis ~3-4 global glaciations followed by extreme greenhouses 750-580 Ma
bullHarland (1964) Williams 1976-86 Kirschvink (1992) bullHoffman et al (1998) Science v 281 1342-6 Hoffman amp Schrag (2000) Sci Am Jan
68-75 Snowball Events
bullBreakup of equatorial supercontinent 770 Ma bullEnhanced weathering from increased rainfall (more land close to sea) bullDrawdown atmCO2 Global cooling bullRunaway albedo effect when sea ice lt 30deg latitude bullGlobal glaciation for ~10 Myr (avg T ~ -50degC) bullSea ice ~1000 m thick geothermal heat flux (007 Wm2) keeps ocean
Images courtesy of NASA liquid
42
Image removed due to copyright restrictions
Please see Fig 2 in Hoffman Paul F and Schrag Daniel P ldquoSnowball Earthrdquo Scientific American 282 (January 2000) 68
lsquoProloguersquo to
Snowball
bullBreakup of equatorial supercontinent bullEnhanced weathering from increased rainfall (more land close to sea) + carbon burial bullDrawdown atmospheric CO2 Global cooling
bullIs this enough
43
Image removed due to copyright restrictions
Please see Fig 2 in Hoffman Paul F and Schrag Daniel P ldquoSnowball Earthrdquo Scientific American 282 (January 2000) 68
Deep Freeze
bullGlobal cooling causes sea ice margin to move equatorward
bullRunaway albedo effect when sea ice lt30deg latitude
bullEntire ocean possibly covered with ice
44
Budyko-Sellers Runaway Albedo
Feedback
1 Eq continents incr weathering lowers CO2 slow cooling equatorward movement of ice
2 Runaway albedo 3 Slow buildup of CO2
from volcanoes 4 Rapid decay of ice in
102 yr High Ts from enhanced H20-T feedback
5 Slow CO2 drawdown from weathering
Image from P Hoffman
45
This image has been removed due to copyright restrictions
Profiles of the 1998 Blue Planet Prize Recipients
Dr Mikhail I Budyko ((Д-р ΜИ Будыко) (Born in January 1920 in Gomel in the former Soviet Union (now Belarus) Head of the Division for Climate Change Research State Hydrological Institute St Petersburg
As shown by the unusual weather patterns caused by the El Nino effect a wide spectrum of climate changes on Earth is having a profound effect on human lives and the environment Since the 1970s great advances have been made in climatology the scientific study of the close relationship between climate and the environment Playing a pivotal role in the development of climatology has been Dr Mikhail I Budyko one of this years winners of the Blue Planet Prize In the 1950s Dr Budyko conducted quantitative studies of the global climate by calculating the heat balance of the Earths surface This balance involves energy from the sun which is the most important determining factor for the Earths climate First Dr Budyko calculated the energy balance of certain regions of the Earth and then he verified his calculations by making comparisons with observational data Next using weather data collected from all over the world Dr Budyko carried out heat balance calculations for all regions of the world and confirmed that they checked out with observational data He announced his findings in 1956 with the publication of his book Heat Balance of the Earths Surface
46
Image removed due to copyright restrictions
Please see Fig 3 in Hoffman Paul F and Schrag Daniel P ldquoSnowball Earthrdquo Scientific American 282 (January 2000) 68
Snowball Peak
bullGlobal glaciation for ~10 Myr (avg T ~ -50degC)
bullSea ice ~1000 m thick geothermal heat flux (007 Wm2) keeps ocean liquid
47
Breaking out of the Snowball
bullVolcanic outgassing of CO2 over ~106 yr may have
Image removed due to copyright restrictions increased greenhouse effect Please see Fig 2 in Lubick sufficiently to melt back theNaomi ldquoPalaeoclimatology Snowball Fightsrdquo Nature 417 ice(May 2 2002) 12-13
48
Bring on the Heat Hothouse follows
Image removed due to copyright restrictions
Please see Fig 3 in Hoffman Paul F and Schrag Daniel P ldquoSnowball Earthrdquo Scientific American 282 (January 2000) 68
Snowball Hothouse Events
bullSlow CO2 buildup to ~350 PAL from volcanoes bullTropical ice melts albedo feedback decreases water vapor feedback increases bullGlobal T reaches ~ +50degC in 102 yr bullHigh T amp rainfall enhance weathering bullWeathering products + CO2 = carbonate precipitation in warm water
49
Evidence for Snowball Earth Hypothesis
bullStratigraphy globally-dispersed glacial deposits
bullCarbon isotopes negative δ13C excursions through glacial sections (δ13C reaches ~ -5 to -7permil) Little or no biological productivity (no light)
bullAnomalous banded iron formations wIRD only BIFs after 17 Ga Anoxic seawater covered by ice
bullCambrian explosion Rapid diversification of multicellular life 575-525 Ma expected to result from long periods of isolation and extreme environments (genetic bottleneck and flush)
50
Carbon Isotopic Evidence for Snowball δ13C values of -5permil (mantle value) consistent with dead ice-covered
ocean
Image from P Hoffman
51
This image has been removed due to copyright restrictions
Carbon Isotope
Fractionation
bullAs fraction of organic carbon buried approaches zero δ13C of CaCO3 approaches mantle (input) value
Image from P Hoffman
52
This image has been removed due to copyright restrictions
f organic-C buried
13C fractionation εTOC
δ13C limestones
δ13C marine organic matter
Carbon Isotopic Excursions 800-500Ma
More complete sediment record
+
Improved chronology
=
More detailed picture showing abrupt and extreme
C-isotopic shifts
A global composite of 13C data shows 4 excursions
Plus one at the pC-C boundary
Hayes et al Chem Geol 161 37 1999
53
Courtesy Elsevier Inc httpwwwsciencedirectcom Used with permission
This image has been removed due to copyright restrictions
Please see Figure 2 Details -gt
Calibrating the Cryogenian Francis A Macdonald Mark D Schmitz James L Crowley Charles F Roots David S Jones Adam C Maloof Justin V StraussPhoebe A Cohen David T Johnston Daniel P Schrag SCIENCE VOL 327 5 MARCH 2010
Fig 2 Neoproterozoic composite carbonate d13C chemostratigraphy with U-Pb ID-TIMS ages that are directly linked to isotopic profiles (11) Bars indicate the time spans of fossil assemblages representing eukaryotic crown groups Asterisks indicate fossil groups of uncertain taxonomic affinity Bars faded upward reflect uncertainty in the minimum age constraint bars faded downward reflect uncertainty in the maximum age constraint Dashes represent the time span where a fossil record has not been identified but for which the eukaryotic groups presence is inferred from its occurrence in Ediacaran or Phanerozoic strata Dashes with question marks indicate that earlier records have been proposed but the relationships between these fossils and the crown groups are uncertain
54
Anomalous Banded Iron Formations
bullAfter a ~1 Gyr absence BIFs return to the geologic record
bullImplies an anoxic ocean
bullConsistent with ice-covered ocean
Image from P hoffman
55
This image has been removed due to copyright restrictions
BIF + Dropstone = Ice-covered anoxic ocean
McKenzie Mtns Western Canada Image from P Hoffman 56
This image has been removed due to copyright restrictions
Animal Radiation Response to genetic
bottlenecks amp flushes
Image from P Hoffman
57
This image has been removed due to copyright restrictions
One Complete Snowball-Hothouse Episode
Image from P Hoffman
58
This image has been removed due to copyright restrictions
The Geochemical Carbon Cycle
Image from P Hoffman 59
IThis image has been removed due to copyright restrictions
Geologic Evidence for Hothouse Aftermath Cap Carbonates
Thick sequences of inorganically precipitated CaCO3 overly all
Neoproterozoic glacial deposits
60
Image removed due to copyright restriction
Please see Fig 3 in Hoffman Paul F and Schrag Daniel P ldquoThe Snowball Earth Hypothesis Testing the Limits of Global Changerdquo Terra Nova 14 (2002) 129-155
Neoproterozoic Cap Carbonates-1
bullThick sequences of inorganically precipitated carbonate minerals overly Late Proterozoic glacial deposits bullConsistent with massive flux of weathering products to ocean in snowball aftermath
61
Cap Carbonates 3
Image removed due to copyright restriction
Please see Fig 5c in Hoffman Paul F and Schrag Daniel P ldquoThe Snowball Earth Hypothesis Testing the Limits of Global Changerdquo Terra Nova 14 (2002) 129-155
bullNamibia
62
Glacial Deposit Overlain by Cap
Image removed due to copyright restrictions Carbonate in Please see Prof Hoffmans site on the Snowball Earth hypothesis httpwwwsnowballearthorg Namibia (~700 Ma)
Hoffman amp Schrag (2000)
63
Image removed due to copyright restriction
Please see Fig 9 in Hoffman Paul F and Schrag Daniel P ldquoThe Snowball Earth Hypothesis Testing the Limits of Global Changerdquo Terra Nova 14 (2002) 129-155
Geologic amp Isotopic Change Associated with Snowball Event
(Namibia)
64
How Long Did it Last bullBig open question Recent work by Sam Bowring (MIT)
suggests Gaskiers glacial episode lasted lt 1 Myr
bullCanadian glacial episode with good age
Image removed due to copyright restrictions Please see Prof Hoffmans site on the Snowball Earth hypothesis controls probably httpwwwsnowballearthorg lasted lt 1 Myr
bullCap carbonates likely deposited within 103shy104 yr
Image from P Hoffman
65
How Long Did it Last
Gaskiers Fm Newfoundland
Images removed due to copyright restrictions
Images from S Bowring
66
How Long Did it Last Ediacaran-burying ash (Drook Formation)
Images removed due to copyright restrictions
Image from S Bowring
67
What kept this from happening after ~580 Ma bullHigher solar luminosity (~5 increase)
bullLess landmass near equator = lower weathering rates () John Edmond weathering rates limited by abundance of fresh rock not temperature
bullIncreased bioturbation (eukaryote diversity following re-oxygenation of ocean) Less C accumulation in sediments offsets lower weathering rates
bulllower iron and phosphorous concentrations in better-oxygenated Phanerozoic ocean [Fe(II) is soluble Fe(III) is less so] Decreased 1deg production = Decreased CO2 drawdown
What we would like to know CO2 concentrations through snowballhothouse cycle
68
Image removed due to copyright restrictions
Please see Lubick Naomi ldquoPalaeoclimatology Snowball Fightsrdquo Nature 417 (May 2 2002) 12-13
Potential Problems with the lsquoSnowball Earth hypothesisrsquo
bullOceanatmosphere climate models cannot seem to keep entire ocean covered with ice bullNo evidence for lower sea level bullWeathering reactions are slowhellip Maybe too slow to be the source of cap carbonates
69
Alternate Cause for Cap Carbonate Deposition amp 13C Depletions
Gas Hydrate Destabilization
Kennedy et al (2001) Geology Vol 29(5) 443-446
bullCaCO3 precipitation does not require increased weathering flux of minerals
bullCan be caused by increased seawater alkalinity resulting from CH4 consumption by sulphateshyreducing bacteria
70
Image removed due to copyright restrictions
Please see Fig 1 in Kennedy Martin J et al ldquoAre Proterozoic Cap Carbonates and Isotopic Excursion a Record of Gas Hydrate Destabilization Following Earthrsquos Coldest Intervalsrdquo Geology 29 (May 2001) 443-446
Structures in Cap Carbonates May Result from Gas
Release bullGas Hydrate = [H2O + hydrocarbon (CH4)] ice bullCH4 from biogenic + thermogenic decomposition of deeply buried CorgbullBiogenic CH4 has very low o13C (-60 to-90permil) bullSequestered as hydrate in permafrost (gt 150 m) amp along continental margins (gt 300 m) bullDestabilized by increased temperature bullCH4 released from flooded permafrost during deglaciation
71
A Biogeochemical Model of the Proterozoic Ocean
Image removed due to copyright restrictions
Please see Fig 3a in Logan Graham A et al ldquoTerminal Proterozoic Reorganization of Biogeochemical Cyclesrdquo Nature 376 (July 6 1995) 53-56
72
After Ventilation
Image removed due to copyright restrictions
Please see Fig 3b in Logan Graham A et al ldquoTerminal Proterozoic Reorganization of Biogeochemical Cyclesrdquo Nature 376 (July 6 1995) 53-56
73
A Carbon Cycle with Two Timescales
oi
weathering volcanism
o1 1
o2-8
o2 o2 2
sedimentoa oo carbonate carbon organic carbon
74
Summarybull The C-cycle has evolved radically through time bull Prior to 22 Ga anaerobic prokaryotes dominated wide spread of oorg (oo)
values oxygenic photosynthesis extant but oxygen remained low as sinks gtgt sources
bull Mantle may have been an important sink for oxidising power bull Extreme ocarb(oa) values around 22 Ga probably signify the lsquoGOErsquo and rise
to prominence of aerobes Decreased spread of oorg (oa) values mayreflect dominance of aerobic autotrophs and reductive pentose (Benson-Calvin C3) cycle
bull Although ample evidence for aerobes the abundance of O2 in atm and ocean remained low (sulfidic ocean) until another major oxidation eventcaused a second lsquoreorganizationrsquo In the Neoproterozoic This was also signified by extreme oa fluctuations
bull The Neoproterozoic lsquoreorganizationrsquo led to pO2 rising to near PALallowing animals to flourish and stabilizing the new regime
bull Environmental evolution reflected changes in the balance between thermal crustal atmospheric amp biological processes
75
Pre-Quaternary climates
South America Africa
India
Permian pole
Glacial Striation Origin of permo shyCarboniferous Glaciation
COLD
Australia
Antarctica
Arabia
Permo-Carboniferrous Glaciations (~300-275 Ma)
Image removed due to copyright restrictions
Figure by MIT OpenCourseWare
Generalized diagram illustrating evidence for origination of Permo-Carboniferous glaciation on one large landmass Arrows indicate direction of glacial flow X = Permian pole position [After Sullivan 1974] Reproduced by permission from W Sullivan Continents in Motion The New Earth Debate copyright 1974 McGraw-Hill Publishing Co
76
Corg burial rate estimated from o13C in CaCO3
Image removed due to copyright restrictions
Please see Fig 10-9 in Stanley (course text)
Atmospheric O2 estimated from Corg burial rate
77
Mesozoic Warmth
-Ferns amp alligators in Siberia
Jurassic 220-140 Ma
78
Image from httpsimplewikipediaorgwikiFileAlligator3jpg in public domain
Image from httpcommonswikimediaorgwikiFileCoelurus_stegosaurusjpg in public domain
High CO2 Levels During MesozoicDecreasing CO2
Mesozoic i 13C = t CO2 Image removed due to copyright restrictions
Please see Fig 2 in Popp Brian N et al ldquoThe Post-Paleozoic Chronology and Mechanism of 13C Depletion in Primary Marine Organic Matterrdquo Am J of Science 289 (April 1989) 436-454
i Seafloor spreading rate
1 i CO2 outgassing
2 i subduction rate = i carbonate metamorphism = i CO2 production
3 i sea level (hotter oceanic crusthigher ridge volume = t land area
t weathering Increasing CO2
t CO2 sink
79
Cenozoic CO2 DecreaseDecreasing CO2
Image removed due to copyright restrictions
Please see Fig 2 in Popp Brian N et al ldquoThe Post-Paleozoic Chronology and Mechanism of 13C Depletion in Primary Marine Organic Matterrdquo Am J of Science 289 (April 1989) 436-454
Increasing CO2
80
What causes glacial-interglacial CO2 variations
(a still-unanswered question) Possible Scenario for lower glacial pCO2
bullIncreased Equator-Pole T gradient Wind strength Dust flux to ocean Iron flux to ocean
bull50 of global 1deg production occurs in ocean bullOcean 1deg production is limited by iron bullHigher 1deg production draws CO2 out of atmosphere amp sequesters it in the deep ocean amp sediments bullColder seawater dissolves more CO2
81
Text has been removed due to copyright restrictions
Please see Veizer Jan et al ldquoEvidence for Decoupling of Atmospheric CO2 and Global Climate during the Phanerozoic Eonrdquo Nature 408 (December 7 2000) 698
While a large and growing body of
evidence indicates that CO2 and climate co-vary there is some indication that the two may not be
closely linked at all timeshellip
(amp it is always important to remember that
correlation does not always mean causation)
82
Text removed due to copyright restrictions
Please see Hoffman Paul F ldquoComment on lsquoSnowball Earth on Trialrsquordquo Eos 88 (February 2007) 110
83
Text removed due to copyright restrictions
Please see Allen Phillip A ldquoReply to lsquoComment on Snowball Earth on Trialrsquordquo Eos 88 (February 2007) 110
84
Evidence for Glaciers on All Continents 09-06 Ga
Image removed due to copyright restrictions
Please see Fig 123 in Crowley T J and North G R Paleoclimatology New York NY Oxford University Press 1992 ISBN 0195105338
85
Neither albedo or
geothermal heat flux
changes can keep the
Earth from freezing w
30 lower S
Adapted from Kump et al (1999)
86
Therefore Lower S must have
been compensated by larger greenhouse
effect
Adapted from Kump et al (1999)
87
httpwwwscotesecomprecambrhtm
Image removed due to copyright restrictions
Please see httpwwwscotesecomimages650jpg
This map illustrates the break-up of the supercontinent Rodinia which formed 1100 million years ago The Late Precambrian was an Ice House World much like the present-day
88
Figure 15 Two permissible calibrations of the composite carbon-isotope record in Figure 14 based on available radiometric dates and delta 13C data that can be correlated into the record and contrasting interpretations of the age and duration of the Sturtian and Marinoan glaciations
GSA Bulletin September 2005 v 117 no 9-10 p 1181-1207 Toward a Neoproterozoic composite carbon-isotope record Galen P Halverson Paul F Hoffman Daniel P Schrag Adam C Maloof and A Hugh N Rice
89Image courtesy of the Geological Society of America Used with permission
GSA Bulletin September 2005 v 117 no 9-10 p 1181-1207 Toward a Neoproterozoic composite carbon-isotope record Galen P Halverson Paul F Hoffman Daniel P Schrag Adam C Maloof and A Hugh N Rice
90Image courtesy of the Geological Society of America Used with permission
MIT OpenCourseWarehttpocwmitedu
12007 Geobiology Spring 2013
For information about citing these materials or our Terms of Use visit httpocwmiteduterms
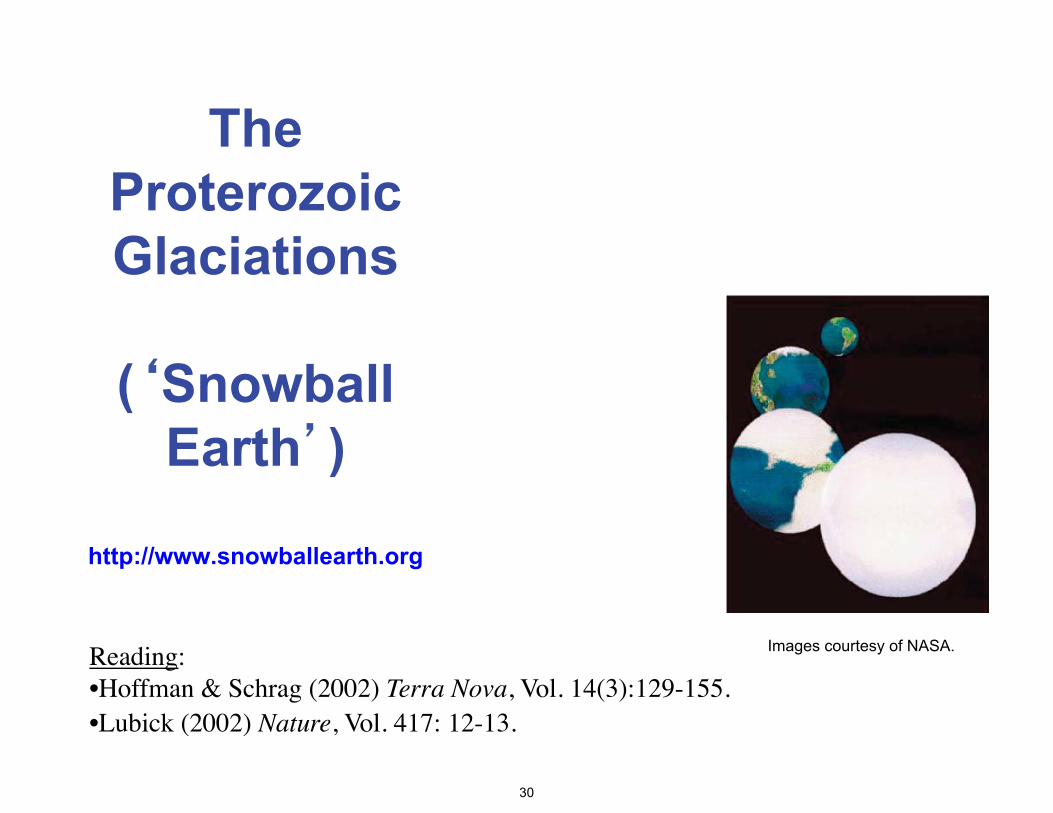

f organic-C buried
13C fractionation εTOC
δ13C limestones
δ13C marine organic matter
750 Ma 720 Ma 580 Ma
MarinoanVaranger Sturtian glacial(s) glacial(s)
Carbon Isotopic Excursions 800-500Ma
What caused these massive
perturbations to the carbon cycle during the late Proterozoic
Hayes et al Chem Geol 161 37 1999
32
Courtesy Elsevier Inc httpwwwsciencedirectcom Used with permission
Neoproterozoic Glaciations Evidence
3-4 global glaciations followed by extreme greenhouses 750-580 Ma bullHarland (1964) Kirschvink (1992)
bullHoffman et al (1998) Science v 281 1342-6 Hoffman amp Schrag (2000) Sci Am Jan 68-75
Image removed due to copyright restrictions
Please see Fig 3 in Hoffman Paul F and Schrag Daniel P ldquoSnowball Earthrdquo Scientific American 282 (January 2000) 68
Snowball-related Events bullBreakup of equatorial supercontinent 770 Ma bullEnhanced weathering from increased rainfall (more land close to sea) bullDrawdown atmospheric CO2 Global cooling bullRunaway albedo effect when sea ice lt 30deg latitude bullGlobal glaciation for ~10 Myr (avg T ~ shy50degC) bullSea ice ~1000 m thick geothermal heat flux (007 Wm2) keeps ocean liquid
33
Tillites GeologicPacked pebbles sand amp Evidencemud Remnants of moraines for Glaciers
Copyright Marli Miller University of Oregon Image from Earth Science World Image Bank httpwwwearthscienceworldorgimages Used with permission
Glacial Striations Scratches from rocks dragged by moving ice
Courtesy Walter Siegmund Image from Wikimedia Commons httpcommonswikimediaorg
Used with permission
Dropstones Rocks transported by icebergs which melt releasing load into finely laminated sediment (IRD)
Copyright Bruce Molnia Terra Photographics Image from Earth Science World Image Bank Kump et al (1999)httpwwwearthscienceworldorgimages
Used with permission
34
Glacial sediments ndash poorly sorted angular clasts including dropstones ndash Namibia c 750 Ma
Courtesy Daniel Schrag Used with permission
35
Image removed due to copyright restriction
Please see Fig 2 in Hoffman Paul F and Schrag Daniel P ldquoThe Snowball Earth Hypothesis Testing the Limits of Global Changerdquo Terra Nova 14 (2002) 129-155
Neoproterozoic Glacial Deposits
From Norway Mauritania NW Canada Namibia Australia Oman
bullGlacial striations bullDropstones bullDiamictites bullAnomalous Iron Formations
36
Equatorial Continents
Image removed due to copyright restrictions
Please see Fig 1 in Hoffman Paul F and Schrag Daniel P ldquoSnowball Earthrdquo Scientific American 282 (January 2000) 68
bullHarland amp Rudwick (1964) identified glacial sediments at what looked like equatorial latitudes by paleomagnetism bullGeorge Williams (1975) identified low a latitude glacial sequence in S Australia amp attributed to episode of extreme obliquity (tilt)
37
Determining Paleolatitude from Remnant Magnetism
bullPaleomagnetism latitude of formation of rock
bullNatural Remnant Magnetism (NRM) inclination varies with magnetic latitude -vertical magn poles -horz magn equator (many Neoprot glac deposits)
bullMagn polar drift avgs out on T~10 ky
Image from P Hoffman
38
This image has been removed due to copyright restrictions
Paleolatitude from
Paleomagnetism Image removed due to copyright restriction
Please see Fig 1 in Hoffman Paul F and Schrag Daniel P ldquoThe Snowball Earth Hypothesis Testing the Limits of Global Changerdquo Terra Nova 14 (2002) 129-155
39
What can explain glaciers on all continents when they
appear to have been close to the equator
40
High Obliquity Hypothesis
George Williams (1975)
bullEarths tilt (obliquity) controls seasonality bullAt high tilt angles (gt 54deg) the poles receive more mean annual solar radiation than the tropics (sun constantly overhead in summer) bullGlaciers may be able to form at low latitudes Problems bullEven the tropics get quite warm at the equinoxes bullMoon stabilizes obliquity bullWould need v large impact to destabilize moon orbit doesnt support this Image from P Hoffman
41
This image has been removed due to copyright restrictions
Snowball Earth Hypothesis ~3-4 global glaciations followed by extreme greenhouses 750-580 Ma
bullHarland (1964) Williams 1976-86 Kirschvink (1992) bullHoffman et al (1998) Science v 281 1342-6 Hoffman amp Schrag (2000) Sci Am Jan
68-75 Snowball Events
bullBreakup of equatorial supercontinent 770 Ma bullEnhanced weathering from increased rainfall (more land close to sea) bullDrawdown atmCO2 Global cooling bullRunaway albedo effect when sea ice lt 30deg latitude bullGlobal glaciation for ~10 Myr (avg T ~ -50degC) bullSea ice ~1000 m thick geothermal heat flux (007 Wm2) keeps ocean
Images courtesy of NASA liquid
42
Image removed due to copyright restrictions
Please see Fig 2 in Hoffman Paul F and Schrag Daniel P ldquoSnowball Earthrdquo Scientific American 282 (January 2000) 68
lsquoProloguersquo to
Snowball
bullBreakup of equatorial supercontinent bullEnhanced weathering from increased rainfall (more land close to sea) + carbon burial bullDrawdown atmospheric CO2 Global cooling
bullIs this enough
43
Image removed due to copyright restrictions
Please see Fig 2 in Hoffman Paul F and Schrag Daniel P ldquoSnowball Earthrdquo Scientific American 282 (January 2000) 68
Deep Freeze
bullGlobal cooling causes sea ice margin to move equatorward
bullRunaway albedo effect when sea ice lt30deg latitude
bullEntire ocean possibly covered with ice
44
Budyko-Sellers Runaway Albedo
Feedback
1 Eq continents incr weathering lowers CO2 slow cooling equatorward movement of ice
2 Runaway albedo 3 Slow buildup of CO2
from volcanoes 4 Rapid decay of ice in
102 yr High Ts from enhanced H20-T feedback
5 Slow CO2 drawdown from weathering
Image from P Hoffman
45
This image has been removed due to copyright restrictions
Profiles of the 1998 Blue Planet Prize Recipients
Dr Mikhail I Budyko ((Д-р ΜИ Будыко) (Born in January 1920 in Gomel in the former Soviet Union (now Belarus) Head of the Division for Climate Change Research State Hydrological Institute St Petersburg
As shown by the unusual weather patterns caused by the El Nino effect a wide spectrum of climate changes on Earth is having a profound effect on human lives and the environment Since the 1970s great advances have been made in climatology the scientific study of the close relationship between climate and the environment Playing a pivotal role in the development of climatology has been Dr Mikhail I Budyko one of this years winners of the Blue Planet Prize In the 1950s Dr Budyko conducted quantitative studies of the global climate by calculating the heat balance of the Earths surface This balance involves energy from the sun which is the most important determining factor for the Earths climate First Dr Budyko calculated the energy balance of certain regions of the Earth and then he verified his calculations by making comparisons with observational data Next using weather data collected from all over the world Dr Budyko carried out heat balance calculations for all regions of the world and confirmed that they checked out with observational data He announced his findings in 1956 with the publication of his book Heat Balance of the Earths Surface
46
Image removed due to copyright restrictions
Please see Fig 3 in Hoffman Paul F and Schrag Daniel P ldquoSnowball Earthrdquo Scientific American 282 (January 2000) 68
Snowball Peak
bullGlobal glaciation for ~10 Myr (avg T ~ -50degC)
bullSea ice ~1000 m thick geothermal heat flux (007 Wm2) keeps ocean liquid
47
Breaking out of the Snowball
bullVolcanic outgassing of CO2 over ~106 yr may have
Image removed due to copyright restrictions increased greenhouse effect Please see Fig 2 in Lubick sufficiently to melt back theNaomi ldquoPalaeoclimatology Snowball Fightsrdquo Nature 417 ice(May 2 2002) 12-13
48
Bring on the Heat Hothouse follows
Image removed due to copyright restrictions
Please see Fig 3 in Hoffman Paul F and Schrag Daniel P ldquoSnowball Earthrdquo Scientific American 282 (January 2000) 68
Snowball Hothouse Events
bullSlow CO2 buildup to ~350 PAL from volcanoes bullTropical ice melts albedo feedback decreases water vapor feedback increases bullGlobal T reaches ~ +50degC in 102 yr bullHigh T amp rainfall enhance weathering bullWeathering products + CO2 = carbonate precipitation in warm water
49
Evidence for Snowball Earth Hypothesis
bullStratigraphy globally-dispersed glacial deposits
bullCarbon isotopes negative δ13C excursions through glacial sections (δ13C reaches ~ -5 to -7permil) Little or no biological productivity (no light)
bullAnomalous banded iron formations wIRD only BIFs after 17 Ga Anoxic seawater covered by ice
bullCambrian explosion Rapid diversification of multicellular life 575-525 Ma expected to result from long periods of isolation and extreme environments (genetic bottleneck and flush)
50
Carbon Isotopic Evidence for Snowball δ13C values of -5permil (mantle value) consistent with dead ice-covered
ocean
Image from P Hoffman
51
This image has been removed due to copyright restrictions
Carbon Isotope
Fractionation
bullAs fraction of organic carbon buried approaches zero δ13C of CaCO3 approaches mantle (input) value
Image from P Hoffman
52
This image has been removed due to copyright restrictions
f organic-C buried
13C fractionation εTOC
δ13C limestones
δ13C marine organic matter
Carbon Isotopic Excursions 800-500Ma
More complete sediment record
+
Improved chronology
=
More detailed picture showing abrupt and extreme
C-isotopic shifts
A global composite of 13C data shows 4 excursions
Plus one at the pC-C boundary
Hayes et al Chem Geol 161 37 1999
53
Courtesy Elsevier Inc httpwwwsciencedirectcom Used with permission
This image has been removed due to copyright restrictions
Please see Figure 2 Details -gt
Calibrating the Cryogenian Francis A Macdonald Mark D Schmitz James L Crowley Charles F Roots David S Jones Adam C Maloof Justin V StraussPhoebe A Cohen David T Johnston Daniel P Schrag SCIENCE VOL 327 5 MARCH 2010
Fig 2 Neoproterozoic composite carbonate d13C chemostratigraphy with U-Pb ID-TIMS ages that are directly linked to isotopic profiles (11) Bars indicate the time spans of fossil assemblages representing eukaryotic crown groups Asterisks indicate fossil groups of uncertain taxonomic affinity Bars faded upward reflect uncertainty in the minimum age constraint bars faded downward reflect uncertainty in the maximum age constraint Dashes represent the time span where a fossil record has not been identified but for which the eukaryotic groups presence is inferred from its occurrence in Ediacaran or Phanerozoic strata Dashes with question marks indicate that earlier records have been proposed but the relationships between these fossils and the crown groups are uncertain
54
Anomalous Banded Iron Formations
bullAfter a ~1 Gyr absence BIFs return to the geologic record
bullImplies an anoxic ocean
bullConsistent with ice-covered ocean
Image from P hoffman
55
This image has been removed due to copyright restrictions
BIF + Dropstone = Ice-covered anoxic ocean
McKenzie Mtns Western Canada Image from P Hoffman 56
This image has been removed due to copyright restrictions
Animal Radiation Response to genetic
bottlenecks amp flushes
Image from P Hoffman
57
This image has been removed due to copyright restrictions
One Complete Snowball-Hothouse Episode
Image from P Hoffman
58
This image has been removed due to copyright restrictions
The Geochemical Carbon Cycle
Image from P Hoffman 59
IThis image has been removed due to copyright restrictions
Geologic Evidence for Hothouse Aftermath Cap Carbonates
Thick sequences of inorganically precipitated CaCO3 overly all
Neoproterozoic glacial deposits
60
Image removed due to copyright restriction
Please see Fig 3 in Hoffman Paul F and Schrag Daniel P ldquoThe Snowball Earth Hypothesis Testing the Limits of Global Changerdquo Terra Nova 14 (2002) 129-155
Neoproterozoic Cap Carbonates-1
bullThick sequences of inorganically precipitated carbonate minerals overly Late Proterozoic glacial deposits bullConsistent with massive flux of weathering products to ocean in snowball aftermath
61
Cap Carbonates 3
Image removed due to copyright restriction
Please see Fig 5c in Hoffman Paul F and Schrag Daniel P ldquoThe Snowball Earth Hypothesis Testing the Limits of Global Changerdquo Terra Nova 14 (2002) 129-155
bullNamibia
62
Glacial Deposit Overlain by Cap
Image removed due to copyright restrictions Carbonate in Please see Prof Hoffmans site on the Snowball Earth hypothesis httpwwwsnowballearthorg Namibia (~700 Ma)
Hoffman amp Schrag (2000)
63
Image removed due to copyright restriction
Please see Fig 9 in Hoffman Paul F and Schrag Daniel P ldquoThe Snowball Earth Hypothesis Testing the Limits of Global Changerdquo Terra Nova 14 (2002) 129-155
Geologic amp Isotopic Change Associated with Snowball Event
(Namibia)
64
How Long Did it Last bullBig open question Recent work by Sam Bowring (MIT)
suggests Gaskiers glacial episode lasted lt 1 Myr
bullCanadian glacial episode with good age
Image removed due to copyright restrictions Please see Prof Hoffmans site on the Snowball Earth hypothesis controls probably httpwwwsnowballearthorg lasted lt 1 Myr
bullCap carbonates likely deposited within 103shy104 yr
Image from P Hoffman
65
How Long Did it Last
Gaskiers Fm Newfoundland
Images removed due to copyright restrictions
Images from S Bowring
66
How Long Did it Last Ediacaran-burying ash (Drook Formation)
Images removed due to copyright restrictions
Image from S Bowring
67
What kept this from happening after ~580 Ma bullHigher solar luminosity (~5 increase)
bullLess landmass near equator = lower weathering rates () John Edmond weathering rates limited by abundance of fresh rock not temperature
bullIncreased bioturbation (eukaryote diversity following re-oxygenation of ocean) Less C accumulation in sediments offsets lower weathering rates
bulllower iron and phosphorous concentrations in better-oxygenated Phanerozoic ocean [Fe(II) is soluble Fe(III) is less so] Decreased 1deg production = Decreased CO2 drawdown
What we would like to know CO2 concentrations through snowballhothouse cycle
68
Image removed due to copyright restrictions
Please see Lubick Naomi ldquoPalaeoclimatology Snowball Fightsrdquo Nature 417 (May 2 2002) 12-13
Potential Problems with the lsquoSnowball Earth hypothesisrsquo
bullOceanatmosphere climate models cannot seem to keep entire ocean covered with ice bullNo evidence for lower sea level bullWeathering reactions are slowhellip Maybe too slow to be the source of cap carbonates
69
Alternate Cause for Cap Carbonate Deposition amp 13C Depletions
Gas Hydrate Destabilization
Kennedy et al (2001) Geology Vol 29(5) 443-446
bullCaCO3 precipitation does not require increased weathering flux of minerals
bullCan be caused by increased seawater alkalinity resulting from CH4 consumption by sulphateshyreducing bacteria
70
Image removed due to copyright restrictions
Please see Fig 1 in Kennedy Martin J et al ldquoAre Proterozoic Cap Carbonates and Isotopic Excursion a Record of Gas Hydrate Destabilization Following Earthrsquos Coldest Intervalsrdquo Geology 29 (May 2001) 443-446
Structures in Cap Carbonates May Result from Gas
Release bullGas Hydrate = [H2O + hydrocarbon (CH4)] ice bullCH4 from biogenic + thermogenic decomposition of deeply buried CorgbullBiogenic CH4 has very low o13C (-60 to-90permil) bullSequestered as hydrate in permafrost (gt 150 m) amp along continental margins (gt 300 m) bullDestabilized by increased temperature bullCH4 released from flooded permafrost during deglaciation
71
A Biogeochemical Model of the Proterozoic Ocean
Image removed due to copyright restrictions
Please see Fig 3a in Logan Graham A et al ldquoTerminal Proterozoic Reorganization of Biogeochemical Cyclesrdquo Nature 376 (July 6 1995) 53-56
72
After Ventilation
Image removed due to copyright restrictions
Please see Fig 3b in Logan Graham A et al ldquoTerminal Proterozoic Reorganization of Biogeochemical Cyclesrdquo Nature 376 (July 6 1995) 53-56
73
A Carbon Cycle with Two Timescales
oi
weathering volcanism
o1 1
o2-8
o2 o2 2
sedimentoa oo carbonate carbon organic carbon
74
Summarybull The C-cycle has evolved radically through time bull Prior to 22 Ga anaerobic prokaryotes dominated wide spread of oorg (oo)
values oxygenic photosynthesis extant but oxygen remained low as sinks gtgt sources
bull Mantle may have been an important sink for oxidising power bull Extreme ocarb(oa) values around 22 Ga probably signify the lsquoGOErsquo and rise
to prominence of aerobes Decreased spread of oorg (oa) values mayreflect dominance of aerobic autotrophs and reductive pentose (Benson-Calvin C3) cycle
bull Although ample evidence for aerobes the abundance of O2 in atm and ocean remained low (sulfidic ocean) until another major oxidation eventcaused a second lsquoreorganizationrsquo In the Neoproterozoic This was also signified by extreme oa fluctuations
bull The Neoproterozoic lsquoreorganizationrsquo led to pO2 rising to near PALallowing animals to flourish and stabilizing the new regime
bull Environmental evolution reflected changes in the balance between thermal crustal atmospheric amp biological processes
75
Pre-Quaternary climates
South America Africa
India
Permian pole
Glacial Striation Origin of permo shyCarboniferous Glaciation
COLD
Australia
Antarctica
Arabia
Permo-Carboniferrous Glaciations (~300-275 Ma)
Image removed due to copyright restrictions
Figure by MIT OpenCourseWare
Generalized diagram illustrating evidence for origination of Permo-Carboniferous glaciation on one large landmass Arrows indicate direction of glacial flow X = Permian pole position [After Sullivan 1974] Reproduced by permission from W Sullivan Continents in Motion The New Earth Debate copyright 1974 McGraw-Hill Publishing Co
76
Corg burial rate estimated from o13C in CaCO3
Image removed due to copyright restrictions
Please see Fig 10-9 in Stanley (course text)
Atmospheric O2 estimated from Corg burial rate
77
Mesozoic Warmth
-Ferns amp alligators in Siberia
Jurassic 220-140 Ma
78
Image from httpsimplewikipediaorgwikiFileAlligator3jpg in public domain
Image from httpcommonswikimediaorgwikiFileCoelurus_stegosaurusjpg in public domain
High CO2 Levels During MesozoicDecreasing CO2
Mesozoic i 13C = t CO2 Image removed due to copyright restrictions
Please see Fig 2 in Popp Brian N et al ldquoThe Post-Paleozoic Chronology and Mechanism of 13C Depletion in Primary Marine Organic Matterrdquo Am J of Science 289 (April 1989) 436-454
i Seafloor spreading rate
1 i CO2 outgassing
2 i subduction rate = i carbonate metamorphism = i CO2 production
3 i sea level (hotter oceanic crusthigher ridge volume = t land area
t weathering Increasing CO2
t CO2 sink
79
Cenozoic CO2 DecreaseDecreasing CO2
Image removed due to copyright restrictions
Please see Fig 2 in Popp Brian N et al ldquoThe Post-Paleozoic Chronology and Mechanism of 13C Depletion in Primary Marine Organic Matterrdquo Am J of Science 289 (April 1989) 436-454
Increasing CO2
80
What causes glacial-interglacial CO2 variations
(a still-unanswered question) Possible Scenario for lower glacial pCO2
bullIncreased Equator-Pole T gradient Wind strength Dust flux to ocean Iron flux to ocean
bull50 of global 1deg production occurs in ocean bullOcean 1deg production is limited by iron bullHigher 1deg production draws CO2 out of atmosphere amp sequesters it in the deep ocean amp sediments bullColder seawater dissolves more CO2
81
Text has been removed due to copyright restrictions
Please see Veizer Jan et al ldquoEvidence for Decoupling of Atmospheric CO2 and Global Climate during the Phanerozoic Eonrdquo Nature 408 (December 7 2000) 698
While a large and growing body of
evidence indicates that CO2 and climate co-vary there is some indication that the two may not be
closely linked at all timeshellip
(amp it is always important to remember that
correlation does not always mean causation)
82
Text removed due to copyright restrictions
Please see Hoffman Paul F ldquoComment on lsquoSnowball Earth on Trialrsquordquo Eos 88 (February 2007) 110
83
Text removed due to copyright restrictions
Please see Allen Phillip A ldquoReply to lsquoComment on Snowball Earth on Trialrsquordquo Eos 88 (February 2007) 110
84
Evidence for Glaciers on All Continents 09-06 Ga
Image removed due to copyright restrictions
Please see Fig 123 in Crowley T J and North G R Paleoclimatology New York NY Oxford University Press 1992 ISBN 0195105338
85
Neither albedo or
geothermal heat flux
changes can keep the
Earth from freezing w
30 lower S
Adapted from Kump et al (1999)
86
Therefore Lower S must have
been compensated by larger greenhouse
effect
Adapted from Kump et al (1999)
87
httpwwwscotesecomprecambrhtm
Image removed due to copyright restrictions
Please see httpwwwscotesecomimages650jpg
This map illustrates the break-up of the supercontinent Rodinia which formed 1100 million years ago The Late Precambrian was an Ice House World much like the present-day
88
Figure 15 Two permissible calibrations of the composite carbon-isotope record in Figure 14 based on available radiometric dates and delta 13C data that can be correlated into the record and contrasting interpretations of the age and duration of the Sturtian and Marinoan glaciations
GSA Bulletin September 2005 v 117 no 9-10 p 1181-1207 Toward a Neoproterozoic composite carbon-isotope record Galen P Halverson Paul F Hoffman Daniel P Schrag Adam C Maloof and A Hugh N Rice
89Image courtesy of the Geological Society of America Used with permission
GSA Bulletin September 2005 v 117 no 9-10 p 1181-1207 Toward a Neoproterozoic composite carbon-isotope record Galen P Halverson Paul F Hoffman Daniel P Schrag Adam C Maloof and A Hugh N Rice
90Image courtesy of the Geological Society of America Used with permission
MIT OpenCourseWarehttpocwmitedu
12007 Geobiology Spring 2013
For information about citing these materials or our Terms of Use visit httpocwmiteduterms
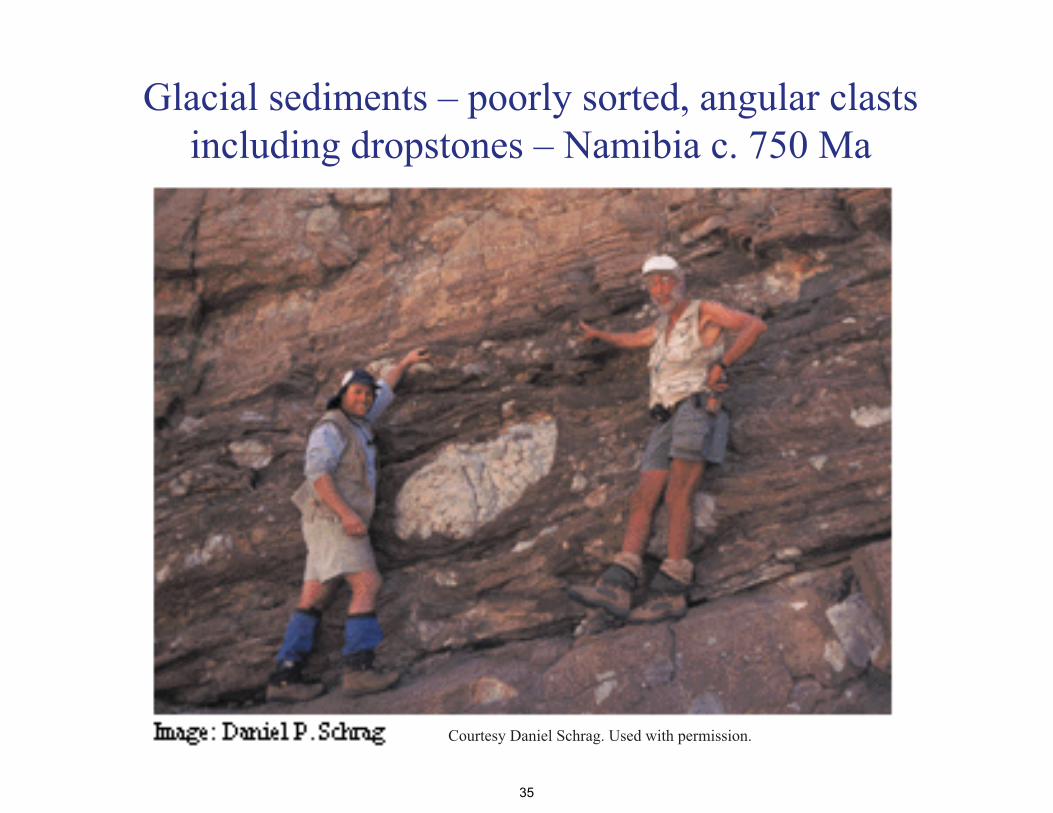

Image removed due to copyright restriction
Please see Fig 2 in Hoffman Paul F and Schrag Daniel P ldquoThe Snowball Earth Hypothesis Testing the Limits of Global Changerdquo Terra Nova 14 (2002) 129-155
Neoproterozoic Glacial Deposits
From Norway Mauritania NW Canada Namibia Australia Oman
bullGlacial striations bullDropstones bullDiamictites bullAnomalous Iron Formations
36
Equatorial Continents
Image removed due to copyright restrictions
Please see Fig 1 in Hoffman Paul F and Schrag Daniel P ldquoSnowball Earthrdquo Scientific American 282 (January 2000) 68
bullHarland amp Rudwick (1964) identified glacial sediments at what looked like equatorial latitudes by paleomagnetism bullGeorge Williams (1975) identified low a latitude glacial sequence in S Australia amp attributed to episode of extreme obliquity (tilt)
37
Determining Paleolatitude from Remnant Magnetism
bullPaleomagnetism latitude of formation of rock
bullNatural Remnant Magnetism (NRM) inclination varies with magnetic latitude -vertical magn poles -horz magn equator (many Neoprot glac deposits)
bullMagn polar drift avgs out on T~10 ky
Image from P Hoffman
38
This image has been removed due to copyright restrictions
Paleolatitude from
Paleomagnetism Image removed due to copyright restriction
Please see Fig 1 in Hoffman Paul F and Schrag Daniel P ldquoThe Snowball Earth Hypothesis Testing the Limits of Global Changerdquo Terra Nova 14 (2002) 129-155
39
What can explain glaciers on all continents when they
appear to have been close to the equator
40
High Obliquity Hypothesis
George Williams (1975)
bullEarths tilt (obliquity) controls seasonality bullAt high tilt angles (gt 54deg) the poles receive more mean annual solar radiation than the tropics (sun constantly overhead in summer) bullGlaciers may be able to form at low latitudes Problems bullEven the tropics get quite warm at the equinoxes bullMoon stabilizes obliquity bullWould need v large impact to destabilize moon orbit doesnt support this Image from P Hoffman
41
This image has been removed due to copyright restrictions
Snowball Earth Hypothesis ~3-4 global glaciations followed by extreme greenhouses 750-580 Ma
bullHarland (1964) Williams 1976-86 Kirschvink (1992) bullHoffman et al (1998) Science v 281 1342-6 Hoffman amp Schrag (2000) Sci Am Jan
68-75 Snowball Events
bullBreakup of equatorial supercontinent 770 Ma bullEnhanced weathering from increased rainfall (more land close to sea) bullDrawdown atmCO2 Global cooling bullRunaway albedo effect when sea ice lt 30deg latitude bullGlobal glaciation for ~10 Myr (avg T ~ -50degC) bullSea ice ~1000 m thick geothermal heat flux (007 Wm2) keeps ocean
Images courtesy of NASA liquid
42
Image removed due to copyright restrictions
Please see Fig 2 in Hoffman Paul F and Schrag Daniel P ldquoSnowball Earthrdquo Scientific American 282 (January 2000) 68
lsquoProloguersquo to
Snowball
bullBreakup of equatorial supercontinent bullEnhanced weathering from increased rainfall (more land close to sea) + carbon burial bullDrawdown atmospheric CO2 Global cooling
bullIs this enough
43
Image removed due to copyright restrictions
Please see Fig 2 in Hoffman Paul F and Schrag Daniel P ldquoSnowball Earthrdquo Scientific American 282 (January 2000) 68
Deep Freeze
bullGlobal cooling causes sea ice margin to move equatorward
bullRunaway albedo effect when sea ice lt30deg latitude
bullEntire ocean possibly covered with ice
44
Budyko-Sellers Runaway Albedo
Feedback
1 Eq continents incr weathering lowers CO2 slow cooling equatorward movement of ice
2 Runaway albedo 3 Slow buildup of CO2
from volcanoes 4 Rapid decay of ice in
102 yr High Ts from enhanced H20-T feedback
5 Slow CO2 drawdown from weathering
Image from P Hoffman
45
This image has been removed due to copyright restrictions
Profiles of the 1998 Blue Planet Prize Recipients
Dr Mikhail I Budyko ((Д-р ΜИ Будыко) (Born in January 1920 in Gomel in the former Soviet Union (now Belarus) Head of the Division for Climate Change Research State Hydrological Institute St Petersburg
As shown by the unusual weather patterns caused by the El Nino effect a wide spectrum of climate changes on Earth is having a profound effect on human lives and the environment Since the 1970s great advances have been made in climatology the scientific study of the close relationship between climate and the environment Playing a pivotal role in the development of climatology has been Dr Mikhail I Budyko one of this years winners of the Blue Planet Prize In the 1950s Dr Budyko conducted quantitative studies of the global climate by calculating the heat balance of the Earths surface This balance involves energy from the sun which is the most important determining factor for the Earths climate First Dr Budyko calculated the energy balance of certain regions of the Earth and then he verified his calculations by making comparisons with observational data Next using weather data collected from all over the world Dr Budyko carried out heat balance calculations for all regions of the world and confirmed that they checked out with observational data He announced his findings in 1956 with the publication of his book Heat Balance of the Earths Surface
46
Image removed due to copyright restrictions
Please see Fig 3 in Hoffman Paul F and Schrag Daniel P ldquoSnowball Earthrdquo Scientific American 282 (January 2000) 68
Snowball Peak
bullGlobal glaciation for ~10 Myr (avg T ~ -50degC)
bullSea ice ~1000 m thick geothermal heat flux (007 Wm2) keeps ocean liquid
47
Breaking out of the Snowball
bullVolcanic outgassing of CO2 over ~106 yr may have
Image removed due to copyright restrictions increased greenhouse effect Please see Fig 2 in Lubick sufficiently to melt back theNaomi ldquoPalaeoclimatology Snowball Fightsrdquo Nature 417 ice(May 2 2002) 12-13
48
Bring on the Heat Hothouse follows
Image removed due to copyright restrictions
Please see Fig 3 in Hoffman Paul F and Schrag Daniel P ldquoSnowball Earthrdquo Scientific American 282 (January 2000) 68
Snowball Hothouse Events
bullSlow CO2 buildup to ~350 PAL from volcanoes bullTropical ice melts albedo feedback decreases water vapor feedback increases bullGlobal T reaches ~ +50degC in 102 yr bullHigh T amp rainfall enhance weathering bullWeathering products + CO2 = carbonate precipitation in warm water
49
Evidence for Snowball Earth Hypothesis
bullStratigraphy globally-dispersed glacial deposits
bullCarbon isotopes negative δ13C excursions through glacial sections (δ13C reaches ~ -5 to -7permil) Little or no biological productivity (no light)
bullAnomalous banded iron formations wIRD only BIFs after 17 Ga Anoxic seawater covered by ice
bullCambrian explosion Rapid diversification of multicellular life 575-525 Ma expected to result from long periods of isolation and extreme environments (genetic bottleneck and flush)
50
Carbon Isotopic Evidence for Snowball δ13C values of -5permil (mantle value) consistent with dead ice-covered
ocean
Image from P Hoffman
51
This image has been removed due to copyright restrictions
Carbon Isotope
Fractionation
bullAs fraction of organic carbon buried approaches zero δ13C of CaCO3 approaches mantle (input) value
Image from P Hoffman
52
This image has been removed due to copyright restrictions
f organic-C buried
13C fractionation εTOC
δ13C limestones
δ13C marine organic matter
Carbon Isotopic Excursions 800-500Ma
More complete sediment record
+
Improved chronology
=
More detailed picture showing abrupt and extreme
C-isotopic shifts
A global composite of 13C data shows 4 excursions
Plus one at the pC-C boundary
Hayes et al Chem Geol 161 37 1999
53
Courtesy Elsevier Inc httpwwwsciencedirectcom Used with permission
This image has been removed due to copyright restrictions
Please see Figure 2 Details -gt
Calibrating the Cryogenian Francis A Macdonald Mark D Schmitz James L Crowley Charles F Roots David S Jones Adam C Maloof Justin V StraussPhoebe A Cohen David T Johnston Daniel P Schrag SCIENCE VOL 327 5 MARCH 2010
Fig 2 Neoproterozoic composite carbonate d13C chemostratigraphy with U-Pb ID-TIMS ages that are directly linked to isotopic profiles (11) Bars indicate the time spans of fossil assemblages representing eukaryotic crown groups Asterisks indicate fossil groups of uncertain taxonomic affinity Bars faded upward reflect uncertainty in the minimum age constraint bars faded downward reflect uncertainty in the maximum age constraint Dashes represent the time span where a fossil record has not been identified but for which the eukaryotic groups presence is inferred from its occurrence in Ediacaran or Phanerozoic strata Dashes with question marks indicate that earlier records have been proposed but the relationships between these fossils and the crown groups are uncertain
54
Anomalous Banded Iron Formations
bullAfter a ~1 Gyr absence BIFs return to the geologic record
bullImplies an anoxic ocean
bullConsistent with ice-covered ocean
Image from P hoffman
55
This image has been removed due to copyright restrictions
BIF + Dropstone = Ice-covered anoxic ocean
McKenzie Mtns Western Canada Image from P Hoffman 56
This image has been removed due to copyright restrictions
Animal Radiation Response to genetic
bottlenecks amp flushes
Image from P Hoffman
57
This image has been removed due to copyright restrictions
One Complete Snowball-Hothouse Episode
Image from P Hoffman
58
This image has been removed due to copyright restrictions
The Geochemical Carbon Cycle
Image from P Hoffman 59
IThis image has been removed due to copyright restrictions
Geologic Evidence for Hothouse Aftermath Cap Carbonates
Thick sequences of inorganically precipitated CaCO3 overly all
Neoproterozoic glacial deposits
60
Image removed due to copyright restriction
Please see Fig 3 in Hoffman Paul F and Schrag Daniel P ldquoThe Snowball Earth Hypothesis Testing the Limits of Global Changerdquo Terra Nova 14 (2002) 129-155
Neoproterozoic Cap Carbonates-1
bullThick sequences of inorganically precipitated carbonate minerals overly Late Proterozoic glacial deposits bullConsistent with massive flux of weathering products to ocean in snowball aftermath
61
Cap Carbonates 3
Image removed due to copyright restriction
Please see Fig 5c in Hoffman Paul F and Schrag Daniel P ldquoThe Snowball Earth Hypothesis Testing the Limits of Global Changerdquo Terra Nova 14 (2002) 129-155
bullNamibia
62
Glacial Deposit Overlain by Cap
Image removed due to copyright restrictions Carbonate in Please see Prof Hoffmans site on the Snowball Earth hypothesis httpwwwsnowballearthorg Namibia (~700 Ma)
Hoffman amp Schrag (2000)
63
Image removed due to copyright restriction
Please see Fig 9 in Hoffman Paul F and Schrag Daniel P ldquoThe Snowball Earth Hypothesis Testing the Limits of Global Changerdquo Terra Nova 14 (2002) 129-155
Geologic amp Isotopic Change Associated with Snowball Event
(Namibia)
64
How Long Did it Last bullBig open question Recent work by Sam Bowring (MIT)
suggests Gaskiers glacial episode lasted lt 1 Myr
bullCanadian glacial episode with good age
Image removed due to copyright restrictions Please see Prof Hoffmans site on the Snowball Earth hypothesis controls probably httpwwwsnowballearthorg lasted lt 1 Myr
bullCap carbonates likely deposited within 103shy104 yr
Image from P Hoffman
65
How Long Did it Last
Gaskiers Fm Newfoundland
Images removed due to copyright restrictions
Images from S Bowring
66
How Long Did it Last Ediacaran-burying ash (Drook Formation)
Images removed due to copyright restrictions
Image from S Bowring
67
What kept this from happening after ~580 Ma bullHigher solar luminosity (~5 increase)
bullLess landmass near equator = lower weathering rates () John Edmond weathering rates limited by abundance of fresh rock not temperature
bullIncreased bioturbation (eukaryote diversity following re-oxygenation of ocean) Less C accumulation in sediments offsets lower weathering rates
bulllower iron and phosphorous concentrations in better-oxygenated Phanerozoic ocean [Fe(II) is soluble Fe(III) is less so] Decreased 1deg production = Decreased CO2 drawdown
What we would like to know CO2 concentrations through snowballhothouse cycle
68
Image removed due to copyright restrictions
Please see Lubick Naomi ldquoPalaeoclimatology Snowball Fightsrdquo Nature 417 (May 2 2002) 12-13
Potential Problems with the lsquoSnowball Earth hypothesisrsquo
bullOceanatmosphere climate models cannot seem to keep entire ocean covered with ice bullNo evidence for lower sea level bullWeathering reactions are slowhellip Maybe too slow to be the source of cap carbonates
69
Alternate Cause for Cap Carbonate Deposition amp 13C Depletions
Gas Hydrate Destabilization
Kennedy et al (2001) Geology Vol 29(5) 443-446
bullCaCO3 precipitation does not require increased weathering flux of minerals
bullCan be caused by increased seawater alkalinity resulting from CH4 consumption by sulphateshyreducing bacteria
70
Image removed due to copyright restrictions
Please see Fig 1 in Kennedy Martin J et al ldquoAre Proterozoic Cap Carbonates and Isotopic Excursion a Record of Gas Hydrate Destabilization Following Earthrsquos Coldest Intervalsrdquo Geology 29 (May 2001) 443-446
Structures in Cap Carbonates May Result from Gas
Release bullGas Hydrate = [H2O + hydrocarbon (CH4)] ice bullCH4 from biogenic + thermogenic decomposition of deeply buried CorgbullBiogenic CH4 has very low o13C (-60 to-90permil) bullSequestered as hydrate in permafrost (gt 150 m) amp along continental margins (gt 300 m) bullDestabilized by increased temperature bullCH4 released from flooded permafrost during deglaciation
71
A Biogeochemical Model of the Proterozoic Ocean
Image removed due to copyright restrictions
Please see Fig 3a in Logan Graham A et al ldquoTerminal Proterozoic Reorganization of Biogeochemical Cyclesrdquo Nature 376 (July 6 1995) 53-56
72
After Ventilation
Image removed due to copyright restrictions
Please see Fig 3b in Logan Graham A et al ldquoTerminal Proterozoic Reorganization of Biogeochemical Cyclesrdquo Nature 376 (July 6 1995) 53-56
73
A Carbon Cycle with Two Timescales
oi
weathering volcanism
o1 1
o2-8
o2 o2 2
sedimentoa oo carbonate carbon organic carbon
74
Summarybull The C-cycle has evolved radically through time bull Prior to 22 Ga anaerobic prokaryotes dominated wide spread of oorg (oo)
values oxygenic photosynthesis extant but oxygen remained low as sinks gtgt sources
bull Mantle may have been an important sink for oxidising power bull Extreme ocarb(oa) values around 22 Ga probably signify the lsquoGOErsquo and rise
to prominence of aerobes Decreased spread of oorg (oa) values mayreflect dominance of aerobic autotrophs and reductive pentose (Benson-Calvin C3) cycle
bull Although ample evidence for aerobes the abundance of O2 in atm and ocean remained low (sulfidic ocean) until another major oxidation eventcaused a second lsquoreorganizationrsquo In the Neoproterozoic This was also signified by extreme oa fluctuations
bull The Neoproterozoic lsquoreorganizationrsquo led to pO2 rising to near PALallowing animals to flourish and stabilizing the new regime
bull Environmental evolution reflected changes in the balance between thermal crustal atmospheric amp biological processes
75
Pre-Quaternary climates
South America Africa
India
Permian pole
Glacial Striation Origin of permo shyCarboniferous Glaciation
COLD
Australia
Antarctica
Arabia
Permo-Carboniferrous Glaciations (~300-275 Ma)
Image removed due to copyright restrictions
Figure by MIT OpenCourseWare
Generalized diagram illustrating evidence for origination of Permo-Carboniferous glaciation on one large landmass Arrows indicate direction of glacial flow X = Permian pole position [After Sullivan 1974] Reproduced by permission from W Sullivan Continents in Motion The New Earth Debate copyright 1974 McGraw-Hill Publishing Co
76
Corg burial rate estimated from o13C in CaCO3
Image removed due to copyright restrictions
Please see Fig 10-9 in Stanley (course text)
Atmospheric O2 estimated from Corg burial rate
77
Mesozoic Warmth
-Ferns amp alligators in Siberia
Jurassic 220-140 Ma
78
Image from httpsimplewikipediaorgwikiFileAlligator3jpg in public domain
Image from httpcommonswikimediaorgwikiFileCoelurus_stegosaurusjpg in public domain
High CO2 Levels During MesozoicDecreasing CO2
Mesozoic i 13C = t CO2 Image removed due to copyright restrictions
Please see Fig 2 in Popp Brian N et al ldquoThe Post-Paleozoic Chronology and Mechanism of 13C Depletion in Primary Marine Organic Matterrdquo Am J of Science 289 (April 1989) 436-454
i Seafloor spreading rate
1 i CO2 outgassing
2 i subduction rate = i carbonate metamorphism = i CO2 production
3 i sea level (hotter oceanic crusthigher ridge volume = t land area
t weathering Increasing CO2
t CO2 sink
79
Cenozoic CO2 DecreaseDecreasing CO2
Image removed due to copyright restrictions
Please see Fig 2 in Popp Brian N et al ldquoThe Post-Paleozoic Chronology and Mechanism of 13C Depletion in Primary Marine Organic Matterrdquo Am J of Science 289 (April 1989) 436-454
Increasing CO2
80
What causes glacial-interglacial CO2 variations
(a still-unanswered question) Possible Scenario for lower glacial pCO2
bullIncreased Equator-Pole T gradient Wind strength Dust flux to ocean Iron flux to ocean
bull50 of global 1deg production occurs in ocean bullOcean 1deg production is limited by iron bullHigher 1deg production draws CO2 out of atmosphere amp sequesters it in the deep ocean amp sediments bullColder seawater dissolves more CO2
81
Text has been removed due to copyright restrictions
Please see Veizer Jan et al ldquoEvidence for Decoupling of Atmospheric CO2 and Global Climate during the Phanerozoic Eonrdquo Nature 408 (December 7 2000) 698
While a large and growing body of
evidence indicates that CO2 and climate co-vary there is some indication that the two may not be
closely linked at all timeshellip
(amp it is always important to remember that
correlation does not always mean causation)
82
Text removed due to copyright restrictions
Please see Hoffman Paul F ldquoComment on lsquoSnowball Earth on Trialrsquordquo Eos 88 (February 2007) 110
83
Text removed due to copyright restrictions
Please see Allen Phillip A ldquoReply to lsquoComment on Snowball Earth on Trialrsquordquo Eos 88 (February 2007) 110
84
Evidence for Glaciers on All Continents 09-06 Ga
Image removed due to copyright restrictions
Please see Fig 123 in Crowley T J and North G R Paleoclimatology New York NY Oxford University Press 1992 ISBN 0195105338
85
Neither albedo or
geothermal heat flux
changes can keep the
Earth from freezing w
30 lower S
Adapted from Kump et al (1999)
86
Therefore Lower S must have
been compensated by larger greenhouse
effect
Adapted from Kump et al (1999)
87
httpwwwscotesecomprecambrhtm
Image removed due to copyright restrictions
Please see httpwwwscotesecomimages650jpg
This map illustrates the break-up of the supercontinent Rodinia which formed 1100 million years ago The Late Precambrian was an Ice House World much like the present-day
88
Figure 15 Two permissible calibrations of the composite carbon-isotope record in Figure 14 based on available radiometric dates and delta 13C data that can be correlated into the record and contrasting interpretations of the age and duration of the Sturtian and Marinoan glaciations
GSA Bulletin September 2005 v 117 no 9-10 p 1181-1207 Toward a Neoproterozoic composite carbon-isotope record Galen P Halverson Paul F Hoffman Daniel P Schrag Adam C Maloof and A Hugh N Rice
89Image courtesy of the Geological Society of America Used with permission
GSA Bulletin September 2005 v 117 no 9-10 p 1181-1207 Toward a Neoproterozoic composite carbon-isotope record Galen P Halverson Paul F Hoffman Daniel P Schrag Adam C Maloof and A Hugh N Rice
90Image courtesy of the Geological Society of America Used with permission
MIT OpenCourseWarehttpocwmitedu
12007 Geobiology Spring 2013
For information about citing these materials or our Terms of Use visit httpocwmiteduterms

Image removed due to copyright restrictions
Please see Fig 2 in Hoffman Paul F and Schrag Daniel P ldquoSnowball Earthrdquo Scientific American 282 (January 2000) 68
lsquoProloguersquo to
Snowball
bullBreakup of equatorial supercontinent bullEnhanced weathering from increased rainfall (more land close to sea) + carbon burial bullDrawdown atmospheric CO2 Global cooling
bullIs this enough
43
Image removed due to copyright restrictions
Please see Fig 2 in Hoffman Paul F and Schrag Daniel P ldquoSnowball Earthrdquo Scientific American 282 (January 2000) 68
Deep Freeze
bullGlobal cooling causes sea ice margin to move equatorward
bullRunaway albedo effect when sea ice lt30deg latitude
bullEntire ocean possibly covered with ice
44
Budyko-Sellers Runaway Albedo
Feedback
1 Eq continents incr weathering lowers CO2 slow cooling equatorward movement of ice
2 Runaway albedo 3 Slow buildup of CO2
from volcanoes 4 Rapid decay of ice in
102 yr High Ts from enhanced H20-T feedback
5 Slow CO2 drawdown from weathering
Image from P Hoffman
45
This image has been removed due to copyright restrictions
Profiles of the 1998 Blue Planet Prize Recipients
Dr Mikhail I Budyko ((Д-р ΜИ Будыко) (Born in January 1920 in Gomel in the former Soviet Union (now Belarus) Head of the Division for Climate Change Research State Hydrological Institute St Petersburg
As shown by the unusual weather patterns caused by the El Nino effect a wide spectrum of climate changes on Earth is having a profound effect on human lives and the environment Since the 1970s great advances have been made in climatology the scientific study of the close relationship between climate and the environment Playing a pivotal role in the development of climatology has been Dr Mikhail I Budyko one of this years winners of the Blue Planet Prize In the 1950s Dr Budyko conducted quantitative studies of the global climate by calculating the heat balance of the Earths surface This balance involves energy from the sun which is the most important determining factor for the Earths climate First Dr Budyko calculated the energy balance of certain regions of the Earth and then he verified his calculations by making comparisons with observational data Next using weather data collected from all over the world Dr Budyko carried out heat balance calculations for all regions of the world and confirmed that they checked out with observational data He announced his findings in 1956 with the publication of his book Heat Balance of the Earths Surface
46
Image removed due to copyright restrictions
Please see Fig 3 in Hoffman Paul F and Schrag Daniel P ldquoSnowball Earthrdquo Scientific American 282 (January 2000) 68
Snowball Peak
bullGlobal glaciation for ~10 Myr (avg T ~ -50degC)
bullSea ice ~1000 m thick geothermal heat flux (007 Wm2) keeps ocean liquid
47
Breaking out of the Snowball
bullVolcanic outgassing of CO2 over ~106 yr may have
Image removed due to copyright restrictions increased greenhouse effect Please see Fig 2 in Lubick sufficiently to melt back theNaomi ldquoPalaeoclimatology Snowball Fightsrdquo Nature 417 ice(May 2 2002) 12-13
48
Bring on the Heat Hothouse follows
Image removed due to copyright restrictions
Please see Fig 3 in Hoffman Paul F and Schrag Daniel P ldquoSnowball Earthrdquo Scientific American 282 (January 2000) 68
Snowball Hothouse Events
bullSlow CO2 buildup to ~350 PAL from volcanoes bullTropical ice melts albedo feedback decreases water vapor feedback increases bullGlobal T reaches ~ +50degC in 102 yr bullHigh T amp rainfall enhance weathering bullWeathering products + CO2 = carbonate precipitation in warm water
49
Evidence for Snowball Earth Hypothesis
bullStratigraphy globally-dispersed glacial deposits
bullCarbon isotopes negative δ13C excursions through glacial sections (δ13C reaches ~ -5 to -7permil) Little or no biological productivity (no light)
bullAnomalous banded iron formations wIRD only BIFs after 17 Ga Anoxic seawater covered by ice
bullCambrian explosion Rapid diversification of multicellular life 575-525 Ma expected to result from long periods of isolation and extreme environments (genetic bottleneck and flush)
50
Carbon Isotopic Evidence for Snowball δ13C values of -5permil (mantle value) consistent with dead ice-covered
ocean
Image from P Hoffman
51
This image has been removed due to copyright restrictions
Carbon Isotope
Fractionation
bullAs fraction of organic carbon buried approaches zero δ13C of CaCO3 approaches mantle (input) value
Image from P Hoffman
52
This image has been removed due to copyright restrictions
f organic-C buried
13C fractionation εTOC
δ13C limestones
δ13C marine organic matter
Carbon Isotopic Excursions 800-500Ma
More complete sediment record
+
Improved chronology
=
More detailed picture showing abrupt and extreme
C-isotopic shifts
A global composite of 13C data shows 4 excursions
Plus one at the pC-C boundary
Hayes et al Chem Geol 161 37 1999
53
Courtesy Elsevier Inc httpwwwsciencedirectcom Used with permission
This image has been removed due to copyright restrictions
Please see Figure 2 Details -gt
Calibrating the Cryogenian Francis A Macdonald Mark D Schmitz James L Crowley Charles F Roots David S Jones Adam C Maloof Justin V StraussPhoebe A Cohen David T Johnston Daniel P Schrag SCIENCE VOL 327 5 MARCH 2010
Fig 2 Neoproterozoic composite carbonate d13C chemostratigraphy with U-Pb ID-TIMS ages that are directly linked to isotopic profiles (11) Bars indicate the time spans of fossil assemblages representing eukaryotic crown groups Asterisks indicate fossil groups of uncertain taxonomic affinity Bars faded upward reflect uncertainty in the minimum age constraint bars faded downward reflect uncertainty in the maximum age constraint Dashes represent the time span where a fossil record has not been identified but for which the eukaryotic groups presence is inferred from its occurrence in Ediacaran or Phanerozoic strata Dashes with question marks indicate that earlier records have been proposed but the relationships between these fossils and the crown groups are uncertain
54
Anomalous Banded Iron Formations
bullAfter a ~1 Gyr absence BIFs return to the geologic record
bullImplies an anoxic ocean
bullConsistent with ice-covered ocean
Image from P hoffman
55
This image has been removed due to copyright restrictions
BIF + Dropstone = Ice-covered anoxic ocean
McKenzie Mtns Western Canada Image from P Hoffman 56
This image has been removed due to copyright restrictions
Animal Radiation Response to genetic
bottlenecks amp flushes
Image from P Hoffman
57
This image has been removed due to copyright restrictions
One Complete Snowball-Hothouse Episode
Image from P Hoffman
58
This image has been removed due to copyright restrictions
The Geochemical Carbon Cycle
Image from P Hoffman 59
IThis image has been removed due to copyright restrictions
Geologic Evidence for Hothouse Aftermath Cap Carbonates
Thick sequences of inorganically precipitated CaCO3 overly all
Neoproterozoic glacial deposits
60
Image removed due to copyright restriction
Please see Fig 3 in Hoffman Paul F and Schrag Daniel P ldquoThe Snowball Earth Hypothesis Testing the Limits of Global Changerdquo Terra Nova 14 (2002) 129-155
Neoproterozoic Cap Carbonates-1
bullThick sequences of inorganically precipitated carbonate minerals overly Late Proterozoic glacial deposits bullConsistent with massive flux of weathering products to ocean in snowball aftermath
61
Cap Carbonates 3
Image removed due to copyright restriction
Please see Fig 5c in Hoffman Paul F and Schrag Daniel P ldquoThe Snowball Earth Hypothesis Testing the Limits of Global Changerdquo Terra Nova 14 (2002) 129-155
bullNamibia
62
Glacial Deposit Overlain by Cap
Image removed due to copyright restrictions Carbonate in Please see Prof Hoffmans site on the Snowball Earth hypothesis httpwwwsnowballearthorg Namibia (~700 Ma)
Hoffman amp Schrag (2000)
63
Image removed due to copyright restriction
Please see Fig 9 in Hoffman Paul F and Schrag Daniel P ldquoThe Snowball Earth Hypothesis Testing the Limits of Global Changerdquo Terra Nova 14 (2002) 129-155
Geologic amp Isotopic Change Associated with Snowball Event
(Namibia)
64
How Long Did it Last bullBig open question Recent work by Sam Bowring (MIT)
suggests Gaskiers glacial episode lasted lt 1 Myr
bullCanadian glacial episode with good age
Image removed due to copyright restrictions Please see Prof Hoffmans site on the Snowball Earth hypothesis controls probably httpwwwsnowballearthorg lasted lt 1 Myr
bullCap carbonates likely deposited within 103shy104 yr
Image from P Hoffman
65
How Long Did it Last
Gaskiers Fm Newfoundland
Images removed due to copyright restrictions
Images from S Bowring
66
How Long Did it Last Ediacaran-burying ash (Drook Formation)
Images removed due to copyright restrictions
Image from S Bowring
67
What kept this from happening after ~580 Ma bullHigher solar luminosity (~5 increase)
bullLess landmass near equator = lower weathering rates () John Edmond weathering rates limited by abundance of fresh rock not temperature
bullIncreased bioturbation (eukaryote diversity following re-oxygenation of ocean) Less C accumulation in sediments offsets lower weathering rates
bulllower iron and phosphorous concentrations in better-oxygenated Phanerozoic ocean [Fe(II) is soluble Fe(III) is less so] Decreased 1deg production = Decreased CO2 drawdown
What we would like to know CO2 concentrations through snowballhothouse cycle
68
Image removed due to copyright restrictions
Please see Lubick Naomi ldquoPalaeoclimatology Snowball Fightsrdquo Nature 417 (May 2 2002) 12-13
Potential Problems with the lsquoSnowball Earth hypothesisrsquo
bullOceanatmosphere climate models cannot seem to keep entire ocean covered with ice bullNo evidence for lower sea level bullWeathering reactions are slowhellip Maybe too slow to be the source of cap carbonates
69
Alternate Cause for Cap Carbonate Deposition amp 13C Depletions
Gas Hydrate Destabilization
Kennedy et al (2001) Geology Vol 29(5) 443-446
bullCaCO3 precipitation does not require increased weathering flux of minerals
bullCan be caused by increased seawater alkalinity resulting from CH4 consumption by sulphateshyreducing bacteria
70
Image removed due to copyright restrictions
Please see Fig 1 in Kennedy Martin J et al ldquoAre Proterozoic Cap Carbonates and Isotopic Excursion a Record of Gas Hydrate Destabilization Following Earthrsquos Coldest Intervalsrdquo Geology 29 (May 2001) 443-446
Structures in Cap Carbonates May Result from Gas
Release bullGas Hydrate = [H2O + hydrocarbon (CH4)] ice bullCH4 from biogenic + thermogenic decomposition of deeply buried CorgbullBiogenic CH4 has very low o13C (-60 to-90permil) bullSequestered as hydrate in permafrost (gt 150 m) amp along continental margins (gt 300 m) bullDestabilized by increased temperature bullCH4 released from flooded permafrost during deglaciation
71
A Biogeochemical Model of the Proterozoic Ocean
Image removed due to copyright restrictions
Please see Fig 3a in Logan Graham A et al ldquoTerminal Proterozoic Reorganization of Biogeochemical Cyclesrdquo Nature 376 (July 6 1995) 53-56
72
After Ventilation
Image removed due to copyright restrictions
Please see Fig 3b in Logan Graham A et al ldquoTerminal Proterozoic Reorganization of Biogeochemical Cyclesrdquo Nature 376 (July 6 1995) 53-56
73
A Carbon Cycle with Two Timescales
oi
weathering volcanism
o1 1
o2-8
o2 o2 2
sedimentoa oo carbonate carbon organic carbon
74
Summarybull The C-cycle has evolved radically through time bull Prior to 22 Ga anaerobic prokaryotes dominated wide spread of oorg (oo)
values oxygenic photosynthesis extant but oxygen remained low as sinks gtgt sources
bull Mantle may have been an important sink for oxidising power bull Extreme ocarb(oa) values around 22 Ga probably signify the lsquoGOErsquo and rise
to prominence of aerobes Decreased spread of oorg (oa) values mayreflect dominance of aerobic autotrophs and reductive pentose (Benson-Calvin C3) cycle
bull Although ample evidence for aerobes the abundance of O2 in atm and ocean remained low (sulfidic ocean) until another major oxidation eventcaused a second lsquoreorganizationrsquo In the Neoproterozoic This was also signified by extreme oa fluctuations
bull The Neoproterozoic lsquoreorganizationrsquo led to pO2 rising to near PALallowing animals to flourish and stabilizing the new regime
bull Environmental evolution reflected changes in the balance between thermal crustal atmospheric amp biological processes
75
Pre-Quaternary climates
South America Africa
India
Permian pole
Glacial Striation Origin of permo shyCarboniferous Glaciation
COLD
Australia
Antarctica
Arabia
Permo-Carboniferrous Glaciations (~300-275 Ma)
Image removed due to copyright restrictions
Figure by MIT OpenCourseWare
Generalized diagram illustrating evidence for origination of Permo-Carboniferous glaciation on one large landmass Arrows indicate direction of glacial flow X = Permian pole position [After Sullivan 1974] Reproduced by permission from W Sullivan Continents in Motion The New Earth Debate copyright 1974 McGraw-Hill Publishing Co
76
Corg burial rate estimated from o13C in CaCO3
Image removed due to copyright restrictions
Please see Fig 10-9 in Stanley (course text)
Atmospheric O2 estimated from Corg burial rate
77
Mesozoic Warmth
-Ferns amp alligators in Siberia
Jurassic 220-140 Ma
78
Image from httpsimplewikipediaorgwikiFileAlligator3jpg in public domain
Image from httpcommonswikimediaorgwikiFileCoelurus_stegosaurusjpg in public domain
High CO2 Levels During MesozoicDecreasing CO2
Mesozoic i 13C = t CO2 Image removed due to copyright restrictions
Please see Fig 2 in Popp Brian N et al ldquoThe Post-Paleozoic Chronology and Mechanism of 13C Depletion in Primary Marine Organic Matterrdquo Am J of Science 289 (April 1989) 436-454
i Seafloor spreading rate
1 i CO2 outgassing
2 i subduction rate = i carbonate metamorphism = i CO2 production
3 i sea level (hotter oceanic crusthigher ridge volume = t land area
t weathering Increasing CO2
t CO2 sink
79
Cenozoic CO2 DecreaseDecreasing CO2
Image removed due to copyright restrictions
Please see Fig 2 in Popp Brian N et al ldquoThe Post-Paleozoic Chronology and Mechanism of 13C Depletion in Primary Marine Organic Matterrdquo Am J of Science 289 (April 1989) 436-454
Increasing CO2
80
What causes glacial-interglacial CO2 variations
(a still-unanswered question) Possible Scenario for lower glacial pCO2
bullIncreased Equator-Pole T gradient Wind strength Dust flux to ocean Iron flux to ocean
bull50 of global 1deg production occurs in ocean bullOcean 1deg production is limited by iron bullHigher 1deg production draws CO2 out of atmosphere amp sequesters it in the deep ocean amp sediments bullColder seawater dissolves more CO2
81
Text has been removed due to copyright restrictions
Please see Veizer Jan et al ldquoEvidence for Decoupling of Atmospheric CO2 and Global Climate during the Phanerozoic Eonrdquo Nature 408 (December 7 2000) 698
While a large and growing body of
evidence indicates that CO2 and climate co-vary there is some indication that the two may not be
closely linked at all timeshellip
(amp it is always important to remember that
correlation does not always mean causation)
82
Text removed due to copyright restrictions
Please see Hoffman Paul F ldquoComment on lsquoSnowball Earth on Trialrsquordquo Eos 88 (February 2007) 110
83
Text removed due to copyright restrictions
Please see Allen Phillip A ldquoReply to lsquoComment on Snowball Earth on Trialrsquordquo Eos 88 (February 2007) 110
84
Evidence for Glaciers on All Continents 09-06 Ga
Image removed due to copyright restrictions
Please see Fig 123 in Crowley T J and North G R Paleoclimatology New York NY Oxford University Press 1992 ISBN 0195105338
85
Neither albedo or
geothermal heat flux
changes can keep the
Earth from freezing w
30 lower S
Adapted from Kump et al (1999)
86
Therefore Lower S must have
been compensated by larger greenhouse
effect
Adapted from Kump et al (1999)
87
httpwwwscotesecomprecambrhtm
Image removed due to copyright restrictions
Please see httpwwwscotesecomimages650jpg
This map illustrates the break-up of the supercontinent Rodinia which formed 1100 million years ago The Late Precambrian was an Ice House World much like the present-day
88
Figure 15 Two permissible calibrations of the composite carbon-isotope record in Figure 14 based on available radiometric dates and delta 13C data that can be correlated into the record and contrasting interpretations of the age and duration of the Sturtian and Marinoan glaciations
GSA Bulletin September 2005 v 117 no 9-10 p 1181-1207 Toward a Neoproterozoic composite carbon-isotope record Galen P Halverson Paul F Hoffman Daniel P Schrag Adam C Maloof and A Hugh N Rice
89Image courtesy of the Geological Society of America Used with permission
GSA Bulletin September 2005 v 117 no 9-10 p 1181-1207 Toward a Neoproterozoic composite carbon-isotope record Galen P Halverson Paul F Hoffman Daniel P Schrag Adam C Maloof and A Hugh N Rice
90Image courtesy of the Geological Society of America Used with permission
MIT OpenCourseWarehttpocwmitedu
12007 Geobiology Spring 2013
For information about citing these materials or our Terms of Use visit httpocwmiteduterms
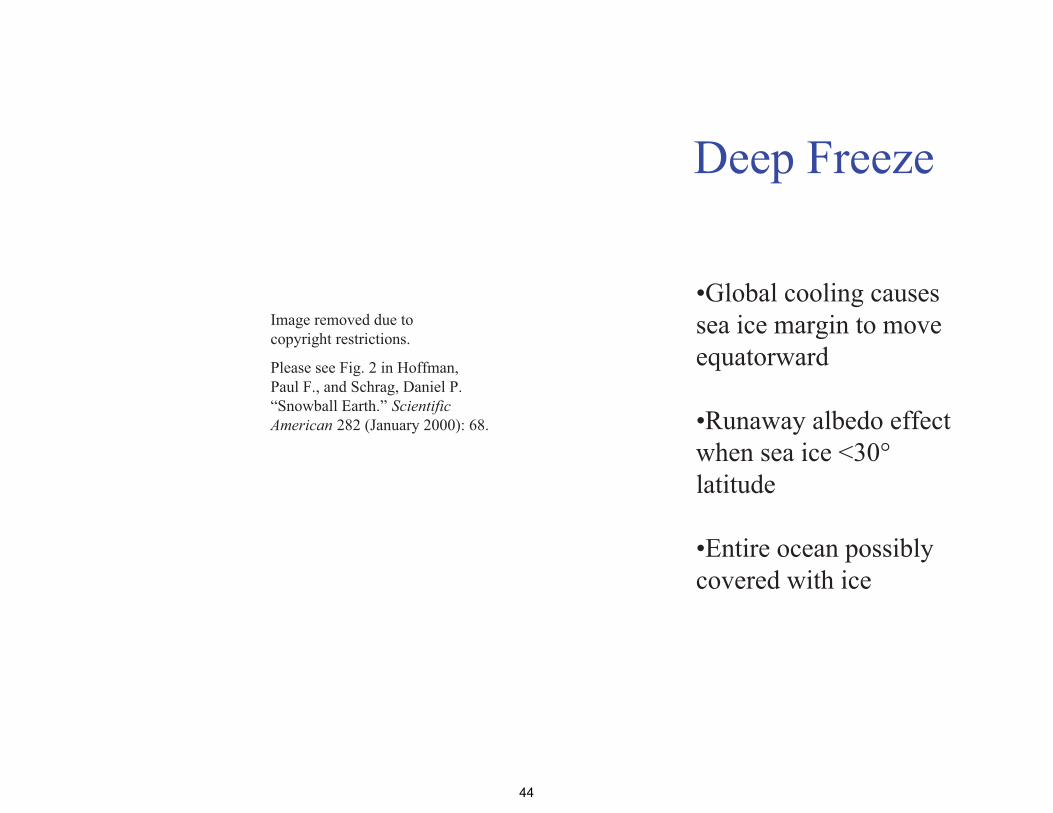
Image removed due to copyright restrictions
Please see Fig 2 in Hoffman Paul F and Schrag Daniel P ldquoSnowball Earthrdquo Scientific American 282 (January 2000) 68
Deep Freeze
bullGlobal cooling causes sea ice margin to move equatorward
bullRunaway albedo effect when sea ice lt30deg latitude
bullEntire ocean possibly covered with ice
44
Budyko-Sellers Runaway Albedo
Feedback
1 Eq continents incr weathering lowers CO2 slow cooling equatorward movement of ice
2 Runaway albedo 3 Slow buildup of CO2
from volcanoes 4 Rapid decay of ice in
102 yr High Ts from enhanced H20-T feedback
5 Slow CO2 drawdown from weathering
Image from P Hoffman
45
This image has been removed due to copyright restrictions
Profiles of the 1998 Blue Planet Prize Recipients
Dr Mikhail I Budyko ((Д-р ΜИ Будыко) (Born in January 1920 in Gomel in the former Soviet Union (now Belarus) Head of the Division for Climate Change Research State Hydrological Institute St Petersburg
As shown by the unusual weather patterns caused by the El Nino effect a wide spectrum of climate changes on Earth is having a profound effect on human lives and the environment Since the 1970s great advances have been made in climatology the scientific study of the close relationship between climate and the environment Playing a pivotal role in the development of climatology has been Dr Mikhail I Budyko one of this years winners of the Blue Planet Prize In the 1950s Dr Budyko conducted quantitative studies of the global climate by calculating the heat balance of the Earths surface This balance involves energy from the sun which is the most important determining factor for the Earths climate First Dr Budyko calculated the energy balance of certain regions of the Earth and then he verified his calculations by making comparisons with observational data Next using weather data collected from all over the world Dr Budyko carried out heat balance calculations for all regions of the world and confirmed that they checked out with observational data He announced his findings in 1956 with the publication of his book Heat Balance of the Earths Surface
46
Image removed due to copyright restrictions
Please see Fig 3 in Hoffman Paul F and Schrag Daniel P ldquoSnowball Earthrdquo Scientific American 282 (January 2000) 68
Snowball Peak
bullGlobal glaciation for ~10 Myr (avg T ~ -50degC)
bullSea ice ~1000 m thick geothermal heat flux (007 Wm2) keeps ocean liquid
47
Breaking out of the Snowball
bullVolcanic outgassing of CO2 over ~106 yr may have
Image removed due to copyright restrictions increased greenhouse effect Please see Fig 2 in Lubick sufficiently to melt back theNaomi ldquoPalaeoclimatology Snowball Fightsrdquo Nature 417 ice(May 2 2002) 12-13
48
Bring on the Heat Hothouse follows
Image removed due to copyright restrictions
Please see Fig 3 in Hoffman Paul F and Schrag Daniel P ldquoSnowball Earthrdquo Scientific American 282 (January 2000) 68
Snowball Hothouse Events
bullSlow CO2 buildup to ~350 PAL from volcanoes bullTropical ice melts albedo feedback decreases water vapor feedback increases bullGlobal T reaches ~ +50degC in 102 yr bullHigh T amp rainfall enhance weathering bullWeathering products + CO2 = carbonate precipitation in warm water
49
Evidence for Snowball Earth Hypothesis
bullStratigraphy globally-dispersed glacial deposits
bullCarbon isotopes negative δ13C excursions through glacial sections (δ13C reaches ~ -5 to -7permil) Little or no biological productivity (no light)
bullAnomalous banded iron formations wIRD only BIFs after 17 Ga Anoxic seawater covered by ice
bullCambrian explosion Rapid diversification of multicellular life 575-525 Ma expected to result from long periods of isolation and extreme environments (genetic bottleneck and flush)
50
Carbon Isotopic Evidence for Snowball δ13C values of -5permil (mantle value) consistent with dead ice-covered
ocean
Image from P Hoffman
51
This image has been removed due to copyright restrictions
Carbon Isotope
Fractionation
bullAs fraction of organic carbon buried approaches zero δ13C of CaCO3 approaches mantle (input) value
Image from P Hoffman
52
This image has been removed due to copyright restrictions
f organic-C buried
13C fractionation εTOC
δ13C limestones
δ13C marine organic matter
Carbon Isotopic Excursions 800-500Ma
More complete sediment record
+
Improved chronology
=
More detailed picture showing abrupt and extreme
C-isotopic shifts
A global composite of 13C data shows 4 excursions
Plus one at the pC-C boundary
Hayes et al Chem Geol 161 37 1999
53
Courtesy Elsevier Inc httpwwwsciencedirectcom Used with permission
This image has been removed due to copyright restrictions
Please see Figure 2 Details -gt
Calibrating the Cryogenian Francis A Macdonald Mark D Schmitz James L Crowley Charles F Roots David S Jones Adam C Maloof Justin V StraussPhoebe A Cohen David T Johnston Daniel P Schrag SCIENCE VOL 327 5 MARCH 2010
Fig 2 Neoproterozoic composite carbonate d13C chemostratigraphy with U-Pb ID-TIMS ages that are directly linked to isotopic profiles (11) Bars indicate the time spans of fossil assemblages representing eukaryotic crown groups Asterisks indicate fossil groups of uncertain taxonomic affinity Bars faded upward reflect uncertainty in the minimum age constraint bars faded downward reflect uncertainty in the maximum age constraint Dashes represent the time span where a fossil record has not been identified but for which the eukaryotic groups presence is inferred from its occurrence in Ediacaran or Phanerozoic strata Dashes with question marks indicate that earlier records have been proposed but the relationships between these fossils and the crown groups are uncertain
54
Anomalous Banded Iron Formations
bullAfter a ~1 Gyr absence BIFs return to the geologic record
bullImplies an anoxic ocean
bullConsistent with ice-covered ocean
Image from P hoffman
55
This image has been removed due to copyright restrictions
BIF + Dropstone = Ice-covered anoxic ocean
McKenzie Mtns Western Canada Image from P Hoffman 56
This image has been removed due to copyright restrictions
Animal Radiation Response to genetic
bottlenecks amp flushes
Image from P Hoffman
57
This image has been removed due to copyright restrictions
One Complete Snowball-Hothouse Episode
Image from P Hoffman
58
This image has been removed due to copyright restrictions
The Geochemical Carbon Cycle
Image from P Hoffman 59
IThis image has been removed due to copyright restrictions
Geologic Evidence for Hothouse Aftermath Cap Carbonates
Thick sequences of inorganically precipitated CaCO3 overly all
Neoproterozoic glacial deposits
60
Image removed due to copyright restriction
Please see Fig 3 in Hoffman Paul F and Schrag Daniel P ldquoThe Snowball Earth Hypothesis Testing the Limits of Global Changerdquo Terra Nova 14 (2002) 129-155
Neoproterozoic Cap Carbonates-1
bullThick sequences of inorganically precipitated carbonate minerals overly Late Proterozoic glacial deposits bullConsistent with massive flux of weathering products to ocean in snowball aftermath
61
Cap Carbonates 3
Image removed due to copyright restriction
Please see Fig 5c in Hoffman Paul F and Schrag Daniel P ldquoThe Snowball Earth Hypothesis Testing the Limits of Global Changerdquo Terra Nova 14 (2002) 129-155
bullNamibia
62
Glacial Deposit Overlain by Cap
Image removed due to copyright restrictions Carbonate in Please see Prof Hoffmans site on the Snowball Earth hypothesis httpwwwsnowballearthorg Namibia (~700 Ma)
Hoffman amp Schrag (2000)
63
Image removed due to copyright restriction
Please see Fig 9 in Hoffman Paul F and Schrag Daniel P ldquoThe Snowball Earth Hypothesis Testing the Limits of Global Changerdquo Terra Nova 14 (2002) 129-155
Geologic amp Isotopic Change Associated with Snowball Event
(Namibia)
64
How Long Did it Last bullBig open question Recent work by Sam Bowring (MIT)
suggests Gaskiers glacial episode lasted lt 1 Myr
bullCanadian glacial episode with good age
Image removed due to copyright restrictions Please see Prof Hoffmans site on the Snowball Earth hypothesis controls probably httpwwwsnowballearthorg lasted lt 1 Myr
bullCap carbonates likely deposited within 103shy104 yr
Image from P Hoffman
65
How Long Did it Last
Gaskiers Fm Newfoundland
Images removed due to copyright restrictions
Images from S Bowring
66
How Long Did it Last Ediacaran-burying ash (Drook Formation)
Images removed due to copyright restrictions
Image from S Bowring
67
What kept this from happening after ~580 Ma bullHigher solar luminosity (~5 increase)
bullLess landmass near equator = lower weathering rates () John Edmond weathering rates limited by abundance of fresh rock not temperature
bullIncreased bioturbation (eukaryote diversity following re-oxygenation of ocean) Less C accumulation in sediments offsets lower weathering rates
bulllower iron and phosphorous concentrations in better-oxygenated Phanerozoic ocean [Fe(II) is soluble Fe(III) is less so] Decreased 1deg production = Decreased CO2 drawdown
What we would like to know CO2 concentrations through snowballhothouse cycle
68
Image removed due to copyright restrictions
Please see Lubick Naomi ldquoPalaeoclimatology Snowball Fightsrdquo Nature 417 (May 2 2002) 12-13
Potential Problems with the lsquoSnowball Earth hypothesisrsquo
bullOceanatmosphere climate models cannot seem to keep entire ocean covered with ice bullNo evidence for lower sea level bullWeathering reactions are slowhellip Maybe too slow to be the source of cap carbonates
69
Alternate Cause for Cap Carbonate Deposition amp 13C Depletions
Gas Hydrate Destabilization
Kennedy et al (2001) Geology Vol 29(5) 443-446
bullCaCO3 precipitation does not require increased weathering flux of minerals
bullCan be caused by increased seawater alkalinity resulting from CH4 consumption by sulphateshyreducing bacteria
70
Image removed due to copyright restrictions
Please see Fig 1 in Kennedy Martin J et al ldquoAre Proterozoic Cap Carbonates and Isotopic Excursion a Record of Gas Hydrate Destabilization Following Earthrsquos Coldest Intervalsrdquo Geology 29 (May 2001) 443-446
Structures in Cap Carbonates May Result from Gas
Release bullGas Hydrate = [H2O + hydrocarbon (CH4)] ice bullCH4 from biogenic + thermogenic decomposition of deeply buried CorgbullBiogenic CH4 has very low o13C (-60 to-90permil) bullSequestered as hydrate in permafrost (gt 150 m) amp along continental margins (gt 300 m) bullDestabilized by increased temperature bullCH4 released from flooded permafrost during deglaciation
71
A Biogeochemical Model of the Proterozoic Ocean
Image removed due to copyright restrictions
Please see Fig 3a in Logan Graham A et al ldquoTerminal Proterozoic Reorganization of Biogeochemical Cyclesrdquo Nature 376 (July 6 1995) 53-56
72
After Ventilation
Image removed due to copyright restrictions
Please see Fig 3b in Logan Graham A et al ldquoTerminal Proterozoic Reorganization of Biogeochemical Cyclesrdquo Nature 376 (July 6 1995) 53-56
73
A Carbon Cycle with Two Timescales
oi
weathering volcanism
o1 1
o2-8
o2 o2 2
sedimentoa oo carbonate carbon organic carbon
74
Summarybull The C-cycle has evolved radically through time bull Prior to 22 Ga anaerobic prokaryotes dominated wide spread of oorg (oo)
values oxygenic photosynthesis extant but oxygen remained low as sinks gtgt sources
bull Mantle may have been an important sink for oxidising power bull Extreme ocarb(oa) values around 22 Ga probably signify the lsquoGOErsquo and rise
to prominence of aerobes Decreased spread of oorg (oa) values mayreflect dominance of aerobic autotrophs and reductive pentose (Benson-Calvin C3) cycle
bull Although ample evidence for aerobes the abundance of O2 in atm and ocean remained low (sulfidic ocean) until another major oxidation eventcaused a second lsquoreorganizationrsquo In the Neoproterozoic This was also signified by extreme oa fluctuations
bull The Neoproterozoic lsquoreorganizationrsquo led to pO2 rising to near PALallowing animals to flourish and stabilizing the new regime
bull Environmental evolution reflected changes in the balance between thermal crustal atmospheric amp biological processes
75
Pre-Quaternary climates
South America Africa
India
Permian pole
Glacial Striation Origin of permo shyCarboniferous Glaciation
COLD
Australia
Antarctica
Arabia
Permo-Carboniferrous Glaciations (~300-275 Ma)
Image removed due to copyright restrictions
Figure by MIT OpenCourseWare
Generalized diagram illustrating evidence for origination of Permo-Carboniferous glaciation on one large landmass Arrows indicate direction of glacial flow X = Permian pole position [After Sullivan 1974] Reproduced by permission from W Sullivan Continents in Motion The New Earth Debate copyright 1974 McGraw-Hill Publishing Co
76
Corg burial rate estimated from o13C in CaCO3
Image removed due to copyright restrictions
Please see Fig 10-9 in Stanley (course text)
Atmospheric O2 estimated from Corg burial rate
77
Mesozoic Warmth
-Ferns amp alligators in Siberia
Jurassic 220-140 Ma
78
Image from httpsimplewikipediaorgwikiFileAlligator3jpg in public domain
Image from httpcommonswikimediaorgwikiFileCoelurus_stegosaurusjpg in public domain
High CO2 Levels During MesozoicDecreasing CO2
Mesozoic i 13C = t CO2 Image removed due to copyright restrictions
Please see Fig 2 in Popp Brian N et al ldquoThe Post-Paleozoic Chronology and Mechanism of 13C Depletion in Primary Marine Organic Matterrdquo Am J of Science 289 (April 1989) 436-454
i Seafloor spreading rate
1 i CO2 outgassing
2 i subduction rate = i carbonate metamorphism = i CO2 production
3 i sea level (hotter oceanic crusthigher ridge volume = t land area
t weathering Increasing CO2
t CO2 sink
79
Cenozoic CO2 DecreaseDecreasing CO2
Image removed due to copyright restrictions
Please see Fig 2 in Popp Brian N et al ldquoThe Post-Paleozoic Chronology and Mechanism of 13C Depletion in Primary Marine Organic Matterrdquo Am J of Science 289 (April 1989) 436-454
Increasing CO2
80
What causes glacial-interglacial CO2 variations
(a still-unanswered question) Possible Scenario for lower glacial pCO2
bullIncreased Equator-Pole T gradient Wind strength Dust flux to ocean Iron flux to ocean
bull50 of global 1deg production occurs in ocean bullOcean 1deg production is limited by iron bullHigher 1deg production draws CO2 out of atmosphere amp sequesters it in the deep ocean amp sediments bullColder seawater dissolves more CO2
81
Text has been removed due to copyright restrictions
Please see Veizer Jan et al ldquoEvidence for Decoupling of Atmospheric CO2 and Global Climate during the Phanerozoic Eonrdquo Nature 408 (December 7 2000) 698
While a large and growing body of
evidence indicates that CO2 and climate co-vary there is some indication that the two may not be
closely linked at all timeshellip
(amp it is always important to remember that
correlation does not always mean causation)
82
Text removed due to copyright restrictions
Please see Hoffman Paul F ldquoComment on lsquoSnowball Earth on Trialrsquordquo Eos 88 (February 2007) 110
83
Text removed due to copyright restrictions
Please see Allen Phillip A ldquoReply to lsquoComment on Snowball Earth on Trialrsquordquo Eos 88 (February 2007) 110
84
Evidence for Glaciers on All Continents 09-06 Ga
Image removed due to copyright restrictions
Please see Fig 123 in Crowley T J and North G R Paleoclimatology New York NY Oxford University Press 1992 ISBN 0195105338
85
Neither albedo or
geothermal heat flux
changes can keep the
Earth from freezing w
30 lower S
Adapted from Kump et al (1999)
86
Therefore Lower S must have
been compensated by larger greenhouse
effect
Adapted from Kump et al (1999)
87
httpwwwscotesecomprecambrhtm
Image removed due to copyright restrictions
Please see httpwwwscotesecomimages650jpg
This map illustrates the break-up of the supercontinent Rodinia which formed 1100 million years ago The Late Precambrian was an Ice House World much like the present-day
88
Figure 15 Two permissible calibrations of the composite carbon-isotope record in Figure 14 based on available radiometric dates and delta 13C data that can be correlated into the record and contrasting interpretations of the age and duration of the Sturtian and Marinoan glaciations
GSA Bulletin September 2005 v 117 no 9-10 p 1181-1207 Toward a Neoproterozoic composite carbon-isotope record Galen P Halverson Paul F Hoffman Daniel P Schrag Adam C Maloof and A Hugh N Rice
89Image courtesy of the Geological Society of America Used with permission
GSA Bulletin September 2005 v 117 no 9-10 p 1181-1207 Toward a Neoproterozoic composite carbon-isotope record Galen P Halverson Paul F Hoffman Daniel P Schrag Adam C Maloof and A Hugh N Rice
90Image courtesy of the Geological Society of America Used with permission
MIT OpenCourseWarehttpocwmitedu
12007 Geobiology Spring 2013
For information about citing these materials or our Terms of Use visit httpocwmiteduterms
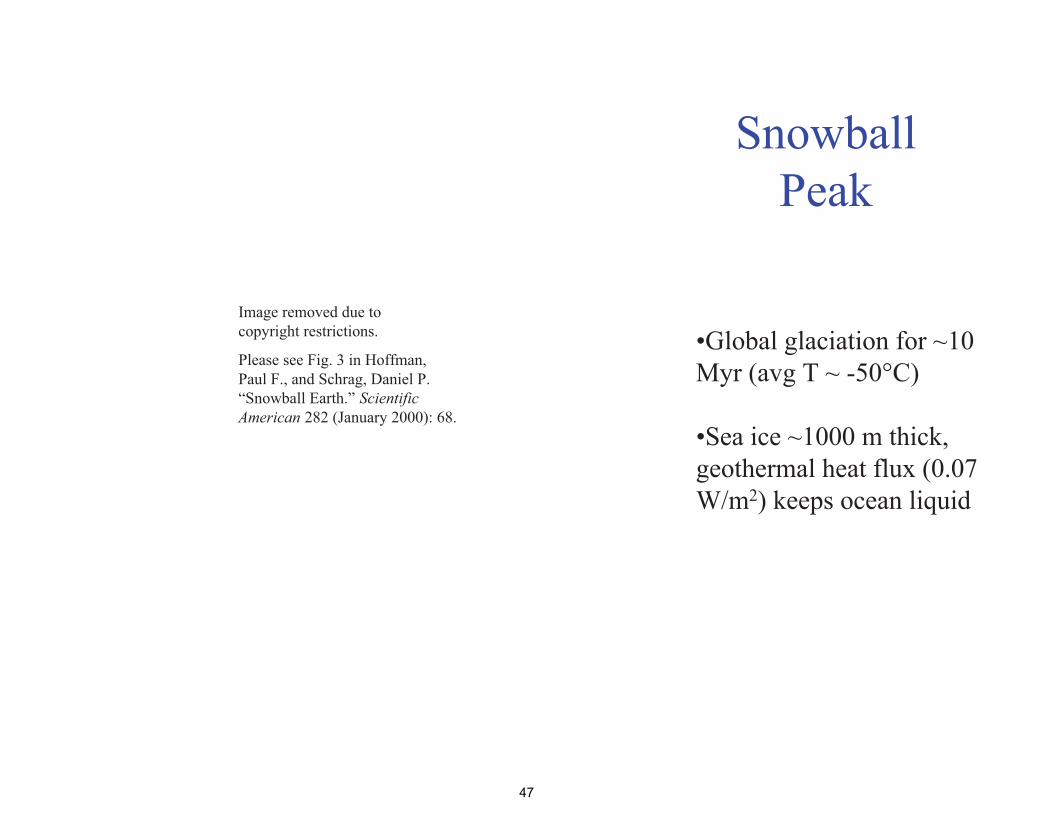
Image removed due to copyright restrictions
Please see Fig 3 in Hoffman Paul F and Schrag Daniel P ldquoSnowball Earthrdquo Scientific American 282 (January 2000) 68
Snowball Peak
bullGlobal glaciation for ~10 Myr (avg T ~ -50degC)
bullSea ice ~1000 m thick geothermal heat flux (007 Wm2) keeps ocean liquid
47
Breaking out of the Snowball
bullVolcanic outgassing of CO2 over ~106 yr may have
Image removed due to copyright restrictions increased greenhouse effect Please see Fig 2 in Lubick sufficiently to melt back theNaomi ldquoPalaeoclimatology Snowball Fightsrdquo Nature 417 ice(May 2 2002) 12-13
48
Bring on the Heat Hothouse follows
Image removed due to copyright restrictions
Please see Fig 3 in Hoffman Paul F and Schrag Daniel P ldquoSnowball Earthrdquo Scientific American 282 (January 2000) 68
Snowball Hothouse Events
bullSlow CO2 buildup to ~350 PAL from volcanoes bullTropical ice melts albedo feedback decreases water vapor feedback increases bullGlobal T reaches ~ +50degC in 102 yr bullHigh T amp rainfall enhance weathering bullWeathering products + CO2 = carbonate precipitation in warm water
49
Evidence for Snowball Earth Hypothesis
bullStratigraphy globally-dispersed glacial deposits
bullCarbon isotopes negative δ13C excursions through glacial sections (δ13C reaches ~ -5 to -7permil) Little or no biological productivity (no light)
bullAnomalous banded iron formations wIRD only BIFs after 17 Ga Anoxic seawater covered by ice
bullCambrian explosion Rapid diversification of multicellular life 575-525 Ma expected to result from long periods of isolation and extreme environments (genetic bottleneck and flush)
50
Carbon Isotopic Evidence for Snowball δ13C values of -5permil (mantle value) consistent with dead ice-covered
ocean
Image from P Hoffman
51
This image has been removed due to copyright restrictions
Carbon Isotope
Fractionation
bullAs fraction of organic carbon buried approaches zero δ13C of CaCO3 approaches mantle (input) value
Image from P Hoffman
52
This image has been removed due to copyright restrictions
f organic-C buried
13C fractionation εTOC
δ13C limestones
δ13C marine organic matter
Carbon Isotopic Excursions 800-500Ma
More complete sediment record
+
Improved chronology
=
More detailed picture showing abrupt and extreme
C-isotopic shifts
A global composite of 13C data shows 4 excursions
Plus one at the pC-C boundary
Hayes et al Chem Geol 161 37 1999
53
Courtesy Elsevier Inc httpwwwsciencedirectcom Used with permission
This image has been removed due to copyright restrictions
Please see Figure 2 Details -gt
Calibrating the Cryogenian Francis A Macdonald Mark D Schmitz James L Crowley Charles F Roots David S Jones Adam C Maloof Justin V StraussPhoebe A Cohen David T Johnston Daniel P Schrag SCIENCE VOL 327 5 MARCH 2010
Fig 2 Neoproterozoic composite carbonate d13C chemostratigraphy with U-Pb ID-TIMS ages that are directly linked to isotopic profiles (11) Bars indicate the time spans of fossil assemblages representing eukaryotic crown groups Asterisks indicate fossil groups of uncertain taxonomic affinity Bars faded upward reflect uncertainty in the minimum age constraint bars faded downward reflect uncertainty in the maximum age constraint Dashes represent the time span where a fossil record has not been identified but for which the eukaryotic groups presence is inferred from its occurrence in Ediacaran or Phanerozoic strata Dashes with question marks indicate that earlier records have been proposed but the relationships between these fossils and the crown groups are uncertain
54
Anomalous Banded Iron Formations
bullAfter a ~1 Gyr absence BIFs return to the geologic record
bullImplies an anoxic ocean
bullConsistent with ice-covered ocean
Image from P hoffman
55
This image has been removed due to copyright restrictions
BIF + Dropstone = Ice-covered anoxic ocean
McKenzie Mtns Western Canada Image from P Hoffman 56
This image has been removed due to copyright restrictions
Animal Radiation Response to genetic
bottlenecks amp flushes
Image from P Hoffman
57
This image has been removed due to copyright restrictions
One Complete Snowball-Hothouse Episode
Image from P Hoffman
58
This image has been removed due to copyright restrictions
The Geochemical Carbon Cycle
Image from P Hoffman 59
IThis image has been removed due to copyright restrictions
Geologic Evidence for Hothouse Aftermath Cap Carbonates
Thick sequences of inorganically precipitated CaCO3 overly all
Neoproterozoic glacial deposits
60
Image removed due to copyright restriction
Please see Fig 3 in Hoffman Paul F and Schrag Daniel P ldquoThe Snowball Earth Hypothesis Testing the Limits of Global Changerdquo Terra Nova 14 (2002) 129-155
Neoproterozoic Cap Carbonates-1
bullThick sequences of inorganically precipitated carbonate minerals overly Late Proterozoic glacial deposits bullConsistent with massive flux of weathering products to ocean in snowball aftermath
61
Cap Carbonates 3
Image removed due to copyright restriction
Please see Fig 5c in Hoffman Paul F and Schrag Daniel P ldquoThe Snowball Earth Hypothesis Testing the Limits of Global Changerdquo Terra Nova 14 (2002) 129-155
bullNamibia
62
Glacial Deposit Overlain by Cap
Image removed due to copyright restrictions Carbonate in Please see Prof Hoffmans site on the Snowball Earth hypothesis httpwwwsnowballearthorg Namibia (~700 Ma)
Hoffman amp Schrag (2000)
63
Image removed due to copyright restriction
Please see Fig 9 in Hoffman Paul F and Schrag Daniel P ldquoThe Snowball Earth Hypothesis Testing the Limits of Global Changerdquo Terra Nova 14 (2002) 129-155
Geologic amp Isotopic Change Associated with Snowball Event
(Namibia)
64
How Long Did it Last bullBig open question Recent work by Sam Bowring (MIT)
suggests Gaskiers glacial episode lasted lt 1 Myr
bullCanadian glacial episode with good age
Image removed due to copyright restrictions Please see Prof Hoffmans site on the Snowball Earth hypothesis controls probably httpwwwsnowballearthorg lasted lt 1 Myr
bullCap carbonates likely deposited within 103shy104 yr
Image from P Hoffman
65
How Long Did it Last
Gaskiers Fm Newfoundland
Images removed due to copyright restrictions
Images from S Bowring
66
How Long Did it Last Ediacaran-burying ash (Drook Formation)
Images removed due to copyright restrictions
Image from S Bowring
67
What kept this from happening after ~580 Ma bullHigher solar luminosity (~5 increase)
bullLess landmass near equator = lower weathering rates () John Edmond weathering rates limited by abundance of fresh rock not temperature
bullIncreased bioturbation (eukaryote diversity following re-oxygenation of ocean) Less C accumulation in sediments offsets lower weathering rates
bulllower iron and phosphorous concentrations in better-oxygenated Phanerozoic ocean [Fe(II) is soluble Fe(III) is less so] Decreased 1deg production = Decreased CO2 drawdown
What we would like to know CO2 concentrations through snowballhothouse cycle
68
Image removed due to copyright restrictions
Please see Lubick Naomi ldquoPalaeoclimatology Snowball Fightsrdquo Nature 417 (May 2 2002) 12-13
Potential Problems with the lsquoSnowball Earth hypothesisrsquo
bullOceanatmosphere climate models cannot seem to keep entire ocean covered with ice bullNo evidence for lower sea level bullWeathering reactions are slowhellip Maybe too slow to be the source of cap carbonates
69
Alternate Cause for Cap Carbonate Deposition amp 13C Depletions
Gas Hydrate Destabilization
Kennedy et al (2001) Geology Vol 29(5) 443-446
bullCaCO3 precipitation does not require increased weathering flux of minerals
bullCan be caused by increased seawater alkalinity resulting from CH4 consumption by sulphateshyreducing bacteria
70
Image removed due to copyright restrictions
Please see Fig 1 in Kennedy Martin J et al ldquoAre Proterozoic Cap Carbonates and Isotopic Excursion a Record of Gas Hydrate Destabilization Following Earthrsquos Coldest Intervalsrdquo Geology 29 (May 2001) 443-446
Structures in Cap Carbonates May Result from Gas
Release bullGas Hydrate = [H2O + hydrocarbon (CH4)] ice bullCH4 from biogenic + thermogenic decomposition of deeply buried CorgbullBiogenic CH4 has very low o13C (-60 to-90permil) bullSequestered as hydrate in permafrost (gt 150 m) amp along continental margins (gt 300 m) bullDestabilized by increased temperature bullCH4 released from flooded permafrost during deglaciation
71
A Biogeochemical Model of the Proterozoic Ocean
Image removed due to copyright restrictions
Please see Fig 3a in Logan Graham A et al ldquoTerminal Proterozoic Reorganization of Biogeochemical Cyclesrdquo Nature 376 (July 6 1995) 53-56
72
After Ventilation
Image removed due to copyright restrictions
Please see Fig 3b in Logan Graham A et al ldquoTerminal Proterozoic Reorganization of Biogeochemical Cyclesrdquo Nature 376 (July 6 1995) 53-56
73
A Carbon Cycle with Two Timescales
oi
weathering volcanism
o1 1
o2-8
o2 o2 2
sedimentoa oo carbonate carbon organic carbon
74
Summarybull The C-cycle has evolved radically through time bull Prior to 22 Ga anaerobic prokaryotes dominated wide spread of oorg (oo)
values oxygenic photosynthesis extant but oxygen remained low as sinks gtgt sources
bull Mantle may have been an important sink for oxidising power bull Extreme ocarb(oa) values around 22 Ga probably signify the lsquoGOErsquo and rise
to prominence of aerobes Decreased spread of oorg (oa) values mayreflect dominance of aerobic autotrophs and reductive pentose (Benson-Calvin C3) cycle
bull Although ample evidence for aerobes the abundance of O2 in atm and ocean remained low (sulfidic ocean) until another major oxidation eventcaused a second lsquoreorganizationrsquo In the Neoproterozoic This was also signified by extreme oa fluctuations
bull The Neoproterozoic lsquoreorganizationrsquo led to pO2 rising to near PALallowing animals to flourish and stabilizing the new regime
bull Environmental evolution reflected changes in the balance between thermal crustal atmospheric amp biological processes
75
Pre-Quaternary climates
South America Africa
India
Permian pole
Glacial Striation Origin of permo shyCarboniferous Glaciation
COLD
Australia
Antarctica
Arabia
Permo-Carboniferrous Glaciations (~300-275 Ma)
Image removed due to copyright restrictions
Figure by MIT OpenCourseWare
Generalized diagram illustrating evidence for origination of Permo-Carboniferous glaciation on one large landmass Arrows indicate direction of glacial flow X = Permian pole position [After Sullivan 1974] Reproduced by permission from W Sullivan Continents in Motion The New Earth Debate copyright 1974 McGraw-Hill Publishing Co
76
Corg burial rate estimated from o13C in CaCO3
Image removed due to copyright restrictions
Please see Fig 10-9 in Stanley (course text)
Atmospheric O2 estimated from Corg burial rate
77
Mesozoic Warmth
-Ferns amp alligators in Siberia
Jurassic 220-140 Ma
78
Image from httpsimplewikipediaorgwikiFileAlligator3jpg in public domain
Image from httpcommonswikimediaorgwikiFileCoelurus_stegosaurusjpg in public domain
High CO2 Levels During MesozoicDecreasing CO2
Mesozoic i 13C = t CO2 Image removed due to copyright restrictions
Please see Fig 2 in Popp Brian N et al ldquoThe Post-Paleozoic Chronology and Mechanism of 13C Depletion in Primary Marine Organic Matterrdquo Am J of Science 289 (April 1989) 436-454
i Seafloor spreading rate
1 i CO2 outgassing
2 i subduction rate = i carbonate metamorphism = i CO2 production
3 i sea level (hotter oceanic crusthigher ridge volume = t land area
t weathering Increasing CO2
t CO2 sink
79
Cenozoic CO2 DecreaseDecreasing CO2
Image removed due to copyright restrictions
Please see Fig 2 in Popp Brian N et al ldquoThe Post-Paleozoic Chronology and Mechanism of 13C Depletion in Primary Marine Organic Matterrdquo Am J of Science 289 (April 1989) 436-454
Increasing CO2
80
What causes glacial-interglacial CO2 variations
(a still-unanswered question) Possible Scenario for lower glacial pCO2
bullIncreased Equator-Pole T gradient Wind strength Dust flux to ocean Iron flux to ocean
bull50 of global 1deg production occurs in ocean bullOcean 1deg production is limited by iron bullHigher 1deg production draws CO2 out of atmosphere amp sequesters it in the deep ocean amp sediments bullColder seawater dissolves more CO2
81
Text has been removed due to copyright restrictions
Please see Veizer Jan et al ldquoEvidence for Decoupling of Atmospheric CO2 and Global Climate during the Phanerozoic Eonrdquo Nature 408 (December 7 2000) 698
While a large and growing body of
evidence indicates that CO2 and climate co-vary there is some indication that the two may not be
closely linked at all timeshellip
(amp it is always important to remember that
correlation does not always mean causation)
82
Text removed due to copyright restrictions
Please see Hoffman Paul F ldquoComment on lsquoSnowball Earth on Trialrsquordquo Eos 88 (February 2007) 110
83
Text removed due to copyright restrictions
Please see Allen Phillip A ldquoReply to lsquoComment on Snowball Earth on Trialrsquordquo Eos 88 (February 2007) 110
84
Evidence for Glaciers on All Continents 09-06 Ga
Image removed due to copyright restrictions
Please see Fig 123 in Crowley T J and North G R Paleoclimatology New York NY Oxford University Press 1992 ISBN 0195105338
85
Neither albedo or
geothermal heat flux
changes can keep the
Earth from freezing w
30 lower S
Adapted from Kump et al (1999)
86
Therefore Lower S must have
been compensated by larger greenhouse
effect
Adapted from Kump et al (1999)
87
httpwwwscotesecomprecambrhtm
Image removed due to copyright restrictions
Please see httpwwwscotesecomimages650jpg
This map illustrates the break-up of the supercontinent Rodinia which formed 1100 million years ago The Late Precambrian was an Ice House World much like the present-day
88
Figure 15 Two permissible calibrations of the composite carbon-isotope record in Figure 14 based on available radiometric dates and delta 13C data that can be correlated into the record and contrasting interpretations of the age and duration of the Sturtian and Marinoan glaciations
GSA Bulletin September 2005 v 117 no 9-10 p 1181-1207 Toward a Neoproterozoic composite carbon-isotope record Galen P Halverson Paul F Hoffman Daniel P Schrag Adam C Maloof and A Hugh N Rice
89Image courtesy of the Geological Society of America Used with permission
GSA Bulletin September 2005 v 117 no 9-10 p 1181-1207 Toward a Neoproterozoic composite carbon-isotope record Galen P Halverson Paul F Hoffman Daniel P Schrag Adam C Maloof and A Hugh N Rice
90Image courtesy of the Geological Society of America Used with permission
MIT OpenCourseWarehttpocwmitedu
12007 Geobiology Spring 2013
For information about citing these materials or our Terms of Use visit httpocwmiteduterms

This image has been removed due to copyright restrictions
Please see Figure 2 Details -gt
Calibrating the Cryogenian Francis A Macdonald Mark D Schmitz James L Crowley Charles F Roots David S Jones Adam C Maloof Justin V StraussPhoebe A Cohen David T Johnston Daniel P Schrag SCIENCE VOL 327 5 MARCH 2010
Fig 2 Neoproterozoic composite carbonate d13C chemostratigraphy with U-Pb ID-TIMS ages that are directly linked to isotopic profiles (11) Bars indicate the time spans of fossil assemblages representing eukaryotic crown groups Asterisks indicate fossil groups of uncertain taxonomic affinity Bars faded upward reflect uncertainty in the minimum age constraint bars faded downward reflect uncertainty in the maximum age constraint Dashes represent the time span where a fossil record has not been identified but for which the eukaryotic groups presence is inferred from its occurrence in Ediacaran or Phanerozoic strata Dashes with question marks indicate that earlier records have been proposed but the relationships between these fossils and the crown groups are uncertain
54
Anomalous Banded Iron Formations
bullAfter a ~1 Gyr absence BIFs return to the geologic record
bullImplies an anoxic ocean
bullConsistent with ice-covered ocean
Image from P hoffman
55
This image has been removed due to copyright restrictions
BIF + Dropstone = Ice-covered anoxic ocean
McKenzie Mtns Western Canada Image from P Hoffman 56
This image has been removed due to copyright restrictions
Animal Radiation Response to genetic
bottlenecks amp flushes
Image from P Hoffman
57
This image has been removed due to copyright restrictions
One Complete Snowball-Hothouse Episode
Image from P Hoffman
58
This image has been removed due to copyright restrictions
The Geochemical Carbon Cycle
Image from P Hoffman 59
IThis image has been removed due to copyright restrictions
Geologic Evidence for Hothouse Aftermath Cap Carbonates
Thick sequences of inorganically precipitated CaCO3 overly all
Neoproterozoic glacial deposits
60
Image removed due to copyright restriction
Please see Fig 3 in Hoffman Paul F and Schrag Daniel P ldquoThe Snowball Earth Hypothesis Testing the Limits of Global Changerdquo Terra Nova 14 (2002) 129-155
Neoproterozoic Cap Carbonates-1
bullThick sequences of inorganically precipitated carbonate minerals overly Late Proterozoic glacial deposits bullConsistent with massive flux of weathering products to ocean in snowball aftermath
61
Cap Carbonates 3
Image removed due to copyright restriction
Please see Fig 5c in Hoffman Paul F and Schrag Daniel P ldquoThe Snowball Earth Hypothesis Testing the Limits of Global Changerdquo Terra Nova 14 (2002) 129-155
bullNamibia
62
Glacial Deposit Overlain by Cap
Image removed due to copyright restrictions Carbonate in Please see Prof Hoffmans site on the Snowball Earth hypothesis httpwwwsnowballearthorg Namibia (~700 Ma)
Hoffman amp Schrag (2000)
63
Image removed due to copyright restriction
Please see Fig 9 in Hoffman Paul F and Schrag Daniel P ldquoThe Snowball Earth Hypothesis Testing the Limits of Global Changerdquo Terra Nova 14 (2002) 129-155
Geologic amp Isotopic Change Associated with Snowball Event
(Namibia)
64
How Long Did it Last bullBig open question Recent work by Sam Bowring (MIT)
suggests Gaskiers glacial episode lasted lt 1 Myr
bullCanadian glacial episode with good age
Image removed due to copyright restrictions Please see Prof Hoffmans site on the Snowball Earth hypothesis controls probably httpwwwsnowballearthorg lasted lt 1 Myr
bullCap carbonates likely deposited within 103shy104 yr
Image from P Hoffman
65
How Long Did it Last
Gaskiers Fm Newfoundland
Images removed due to copyright restrictions
Images from S Bowring
66
How Long Did it Last Ediacaran-burying ash (Drook Formation)
Images removed due to copyright restrictions
Image from S Bowring
67
What kept this from happening after ~580 Ma bullHigher solar luminosity (~5 increase)
bullLess landmass near equator = lower weathering rates () John Edmond weathering rates limited by abundance of fresh rock not temperature
bullIncreased bioturbation (eukaryote diversity following re-oxygenation of ocean) Less C accumulation in sediments offsets lower weathering rates
bulllower iron and phosphorous concentrations in better-oxygenated Phanerozoic ocean [Fe(II) is soluble Fe(III) is less so] Decreased 1deg production = Decreased CO2 drawdown
What we would like to know CO2 concentrations through snowballhothouse cycle
68
Image removed due to copyright restrictions
Please see Lubick Naomi ldquoPalaeoclimatology Snowball Fightsrdquo Nature 417 (May 2 2002) 12-13
Potential Problems with the lsquoSnowball Earth hypothesisrsquo
bullOceanatmosphere climate models cannot seem to keep entire ocean covered with ice bullNo evidence for lower sea level bullWeathering reactions are slowhellip Maybe too slow to be the source of cap carbonates
69
Alternate Cause for Cap Carbonate Deposition amp 13C Depletions
Gas Hydrate Destabilization
Kennedy et al (2001) Geology Vol 29(5) 443-446
bullCaCO3 precipitation does not require increased weathering flux of minerals
bullCan be caused by increased seawater alkalinity resulting from CH4 consumption by sulphateshyreducing bacteria
70
Image removed due to copyright restrictions
Please see Fig 1 in Kennedy Martin J et al ldquoAre Proterozoic Cap Carbonates and Isotopic Excursion a Record of Gas Hydrate Destabilization Following Earthrsquos Coldest Intervalsrdquo Geology 29 (May 2001) 443-446
Structures in Cap Carbonates May Result from Gas
Release bullGas Hydrate = [H2O + hydrocarbon (CH4)] ice bullCH4 from biogenic + thermogenic decomposition of deeply buried CorgbullBiogenic CH4 has very low o13C (-60 to-90permil) bullSequestered as hydrate in permafrost (gt 150 m) amp along continental margins (gt 300 m) bullDestabilized by increased temperature bullCH4 released from flooded permafrost during deglaciation
71
A Biogeochemical Model of the Proterozoic Ocean
Image removed due to copyright restrictions
Please see Fig 3a in Logan Graham A et al ldquoTerminal Proterozoic Reorganization of Biogeochemical Cyclesrdquo Nature 376 (July 6 1995) 53-56
72
After Ventilation
Image removed due to copyright restrictions
Please see Fig 3b in Logan Graham A et al ldquoTerminal Proterozoic Reorganization of Biogeochemical Cyclesrdquo Nature 376 (July 6 1995) 53-56
73
A Carbon Cycle with Two Timescales
oi
weathering volcanism
o1 1
o2-8
o2 o2 2
sedimentoa oo carbonate carbon organic carbon
74
Summarybull The C-cycle has evolved radically through time bull Prior to 22 Ga anaerobic prokaryotes dominated wide spread of oorg (oo)
values oxygenic photosynthesis extant but oxygen remained low as sinks gtgt sources
bull Mantle may have been an important sink for oxidising power bull Extreme ocarb(oa) values around 22 Ga probably signify the lsquoGOErsquo and rise
to prominence of aerobes Decreased spread of oorg (oa) values mayreflect dominance of aerobic autotrophs and reductive pentose (Benson-Calvin C3) cycle
bull Although ample evidence for aerobes the abundance of O2 in atm and ocean remained low (sulfidic ocean) until another major oxidation eventcaused a second lsquoreorganizationrsquo In the Neoproterozoic This was also signified by extreme oa fluctuations
bull The Neoproterozoic lsquoreorganizationrsquo led to pO2 rising to near PALallowing animals to flourish and stabilizing the new regime
bull Environmental evolution reflected changes in the balance between thermal crustal atmospheric amp biological processes
75
Pre-Quaternary climates
South America Africa
India
Permian pole
Glacial Striation Origin of permo shyCarboniferous Glaciation
COLD
Australia
Antarctica
Arabia
Permo-Carboniferrous Glaciations (~300-275 Ma)
Image removed due to copyright restrictions
Figure by MIT OpenCourseWare
Generalized diagram illustrating evidence for origination of Permo-Carboniferous glaciation on one large landmass Arrows indicate direction of glacial flow X = Permian pole position [After Sullivan 1974] Reproduced by permission from W Sullivan Continents in Motion The New Earth Debate copyright 1974 McGraw-Hill Publishing Co
76
Corg burial rate estimated from o13C in CaCO3
Image removed due to copyright restrictions
Please see Fig 10-9 in Stanley (course text)
Atmospheric O2 estimated from Corg burial rate
77
Mesozoic Warmth
-Ferns amp alligators in Siberia
Jurassic 220-140 Ma
78
Image from httpsimplewikipediaorgwikiFileAlligator3jpg in public domain
Image from httpcommonswikimediaorgwikiFileCoelurus_stegosaurusjpg in public domain
High CO2 Levels During MesozoicDecreasing CO2
Mesozoic i 13C = t CO2 Image removed due to copyright restrictions
Please see Fig 2 in Popp Brian N et al ldquoThe Post-Paleozoic Chronology and Mechanism of 13C Depletion in Primary Marine Organic Matterrdquo Am J of Science 289 (April 1989) 436-454
i Seafloor spreading rate
1 i CO2 outgassing
2 i subduction rate = i carbonate metamorphism = i CO2 production
3 i sea level (hotter oceanic crusthigher ridge volume = t land area
t weathering Increasing CO2
t CO2 sink
79
Cenozoic CO2 DecreaseDecreasing CO2
Image removed due to copyright restrictions
Please see Fig 2 in Popp Brian N et al ldquoThe Post-Paleozoic Chronology and Mechanism of 13C Depletion in Primary Marine Organic Matterrdquo Am J of Science 289 (April 1989) 436-454
Increasing CO2
80
What causes glacial-interglacial CO2 variations
(a still-unanswered question) Possible Scenario for lower glacial pCO2
bullIncreased Equator-Pole T gradient Wind strength Dust flux to ocean Iron flux to ocean
bull50 of global 1deg production occurs in ocean bullOcean 1deg production is limited by iron bullHigher 1deg production draws CO2 out of atmosphere amp sequesters it in the deep ocean amp sediments bullColder seawater dissolves more CO2
81
Text has been removed due to copyright restrictions
Please see Veizer Jan et al ldquoEvidence for Decoupling of Atmospheric CO2 and Global Climate during the Phanerozoic Eonrdquo Nature 408 (December 7 2000) 698
While a large and growing body of
evidence indicates that CO2 and climate co-vary there is some indication that the two may not be
closely linked at all timeshellip
(amp it is always important to remember that
correlation does not always mean causation)
82
Text removed due to copyright restrictions
Please see Hoffman Paul F ldquoComment on lsquoSnowball Earth on Trialrsquordquo Eos 88 (February 2007) 110
83
Text removed due to copyright restrictions
Please see Allen Phillip A ldquoReply to lsquoComment on Snowball Earth on Trialrsquordquo Eos 88 (February 2007) 110
84
Evidence for Glaciers on All Continents 09-06 Ga
Image removed due to copyright restrictions
Please see Fig 123 in Crowley T J and North G R Paleoclimatology New York NY Oxford University Press 1992 ISBN 0195105338
85
Neither albedo or
geothermal heat flux
changes can keep the
Earth from freezing w
30 lower S
Adapted from Kump et al (1999)
86
Therefore Lower S must have
been compensated by larger greenhouse
effect
Adapted from Kump et al (1999)
87
httpwwwscotesecomprecambrhtm
Image removed due to copyright restrictions
Please see httpwwwscotesecomimages650jpg
This map illustrates the break-up of the supercontinent Rodinia which formed 1100 million years ago The Late Precambrian was an Ice House World much like the present-day
88
Figure 15 Two permissible calibrations of the composite carbon-isotope record in Figure 14 based on available radiometric dates and delta 13C data that can be correlated into the record and contrasting interpretations of the age and duration of the Sturtian and Marinoan glaciations
GSA Bulletin September 2005 v 117 no 9-10 p 1181-1207 Toward a Neoproterozoic composite carbon-isotope record Galen P Halverson Paul F Hoffman Daniel P Schrag Adam C Maloof and A Hugh N Rice
89Image courtesy of the Geological Society of America Used with permission
GSA Bulletin September 2005 v 117 no 9-10 p 1181-1207 Toward a Neoproterozoic composite carbon-isotope record Galen P Halverson Paul F Hoffman Daniel P Schrag Adam C Maloof and A Hugh N Rice
90Image courtesy of the Geological Society of America Used with permission
MIT OpenCourseWarehttpocwmitedu
12007 Geobiology Spring 2013
For information about citing these materials or our Terms of Use visit httpocwmiteduterms
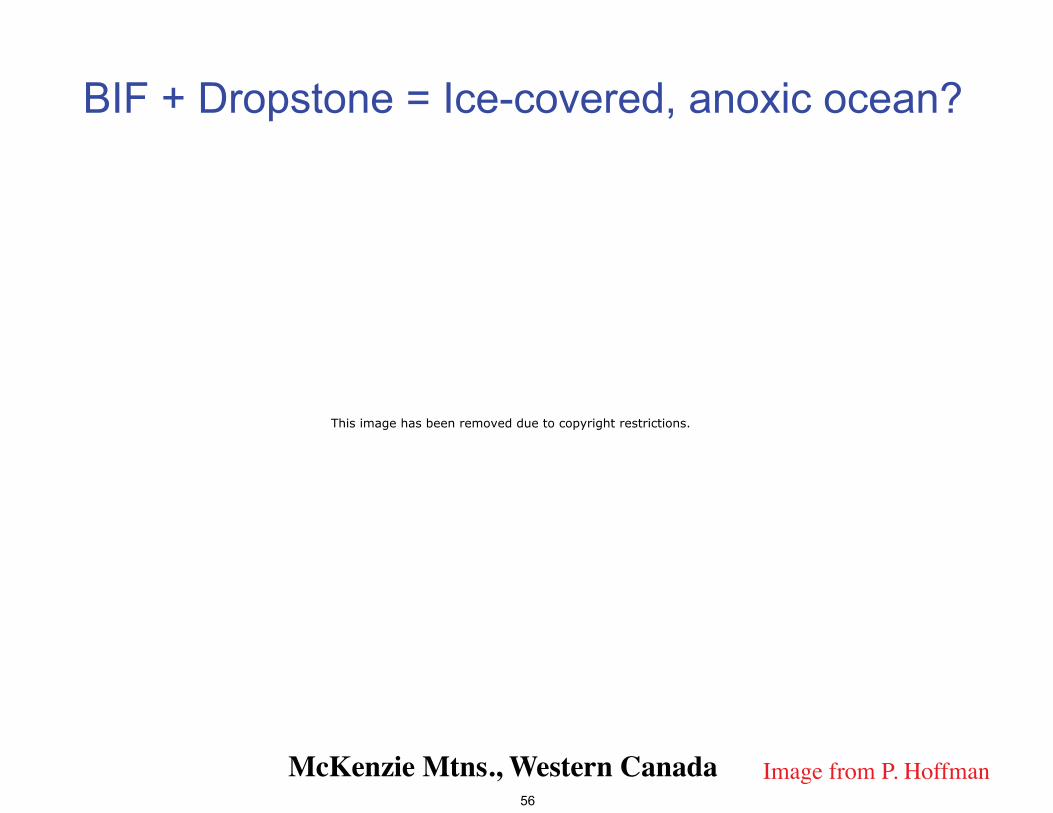
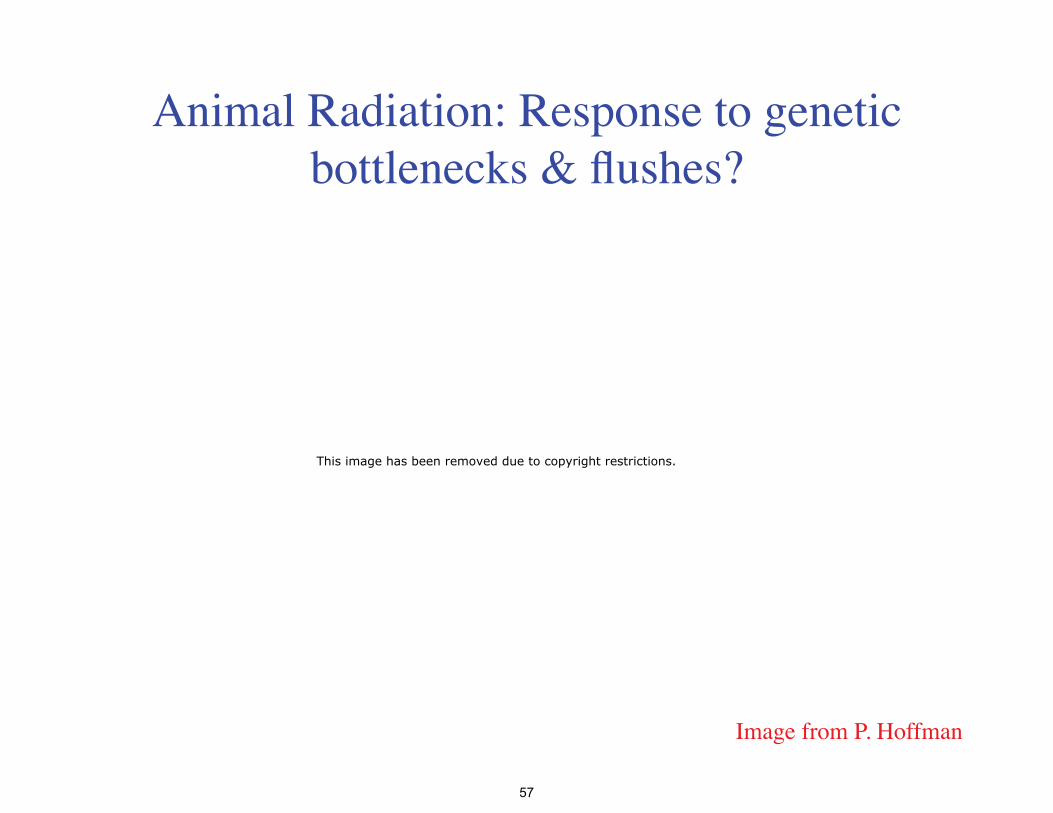

Image removed due to copyright restriction
Please see Fig 3 in Hoffman Paul F and Schrag Daniel P ldquoThe Snowball Earth Hypothesis Testing the Limits of Global Changerdquo Terra Nova 14 (2002) 129-155
Neoproterozoic Cap Carbonates-1
bullThick sequences of inorganically precipitated carbonate minerals overly Late Proterozoic glacial deposits bullConsistent with massive flux of weathering products to ocean in snowball aftermath
61
Cap Carbonates 3
Image removed due to copyright restriction
Please see Fig 5c in Hoffman Paul F and Schrag Daniel P ldquoThe Snowball Earth Hypothesis Testing the Limits of Global Changerdquo Terra Nova 14 (2002) 129-155
bullNamibia
62
Glacial Deposit Overlain by Cap
Image removed due to copyright restrictions Carbonate in Please see Prof Hoffmans site on the Snowball Earth hypothesis httpwwwsnowballearthorg Namibia (~700 Ma)
Hoffman amp Schrag (2000)
63
Image removed due to copyright restriction
Please see Fig 9 in Hoffman Paul F and Schrag Daniel P ldquoThe Snowball Earth Hypothesis Testing the Limits of Global Changerdquo Terra Nova 14 (2002) 129-155
Geologic amp Isotopic Change Associated with Snowball Event
(Namibia)
64
How Long Did it Last bullBig open question Recent work by Sam Bowring (MIT)
suggests Gaskiers glacial episode lasted lt 1 Myr
bullCanadian glacial episode with good age
Image removed due to copyright restrictions Please see Prof Hoffmans site on the Snowball Earth hypothesis controls probably httpwwwsnowballearthorg lasted lt 1 Myr
bullCap carbonates likely deposited within 103shy104 yr
Image from P Hoffman
65
How Long Did it Last
Gaskiers Fm Newfoundland
Images removed due to copyright restrictions
Images from S Bowring
66
How Long Did it Last Ediacaran-burying ash (Drook Formation)
Images removed due to copyright restrictions
Image from S Bowring
67
What kept this from happening after ~580 Ma bullHigher solar luminosity (~5 increase)
bullLess landmass near equator = lower weathering rates () John Edmond weathering rates limited by abundance of fresh rock not temperature
bullIncreased bioturbation (eukaryote diversity following re-oxygenation of ocean) Less C accumulation in sediments offsets lower weathering rates
bulllower iron and phosphorous concentrations in better-oxygenated Phanerozoic ocean [Fe(II) is soluble Fe(III) is less so] Decreased 1deg production = Decreased CO2 drawdown
What we would like to know CO2 concentrations through snowballhothouse cycle
68
Image removed due to copyright restrictions
Please see Lubick Naomi ldquoPalaeoclimatology Snowball Fightsrdquo Nature 417 (May 2 2002) 12-13
Potential Problems with the lsquoSnowball Earth hypothesisrsquo
bullOceanatmosphere climate models cannot seem to keep entire ocean covered with ice bullNo evidence for lower sea level bullWeathering reactions are slowhellip Maybe too slow to be the source of cap carbonates
69
Alternate Cause for Cap Carbonate Deposition amp 13C Depletions
Gas Hydrate Destabilization
Kennedy et al (2001) Geology Vol 29(5) 443-446
bullCaCO3 precipitation does not require increased weathering flux of minerals
bullCan be caused by increased seawater alkalinity resulting from CH4 consumption by sulphateshyreducing bacteria
70
Image removed due to copyright restrictions
Please see Fig 1 in Kennedy Martin J et al ldquoAre Proterozoic Cap Carbonates and Isotopic Excursion a Record of Gas Hydrate Destabilization Following Earthrsquos Coldest Intervalsrdquo Geology 29 (May 2001) 443-446
Structures in Cap Carbonates May Result from Gas
Release bullGas Hydrate = [H2O + hydrocarbon (CH4)] ice bullCH4 from biogenic + thermogenic decomposition of deeply buried CorgbullBiogenic CH4 has very low o13C (-60 to-90permil) bullSequestered as hydrate in permafrost (gt 150 m) amp along continental margins (gt 300 m) bullDestabilized by increased temperature bullCH4 released from flooded permafrost during deglaciation
71
A Biogeochemical Model of the Proterozoic Ocean
Image removed due to copyright restrictions
Please see Fig 3a in Logan Graham A et al ldquoTerminal Proterozoic Reorganization of Biogeochemical Cyclesrdquo Nature 376 (July 6 1995) 53-56
72
After Ventilation
Image removed due to copyright restrictions
Please see Fig 3b in Logan Graham A et al ldquoTerminal Proterozoic Reorganization of Biogeochemical Cyclesrdquo Nature 376 (July 6 1995) 53-56
73
A Carbon Cycle with Two Timescales
oi
weathering volcanism
o1 1
o2-8
o2 o2 2
sedimentoa oo carbonate carbon organic carbon
74
Summarybull The C-cycle has evolved radically through time bull Prior to 22 Ga anaerobic prokaryotes dominated wide spread of oorg (oo)
values oxygenic photosynthesis extant but oxygen remained low as sinks gtgt sources
bull Mantle may have been an important sink for oxidising power bull Extreme ocarb(oa) values around 22 Ga probably signify the lsquoGOErsquo and rise
to prominence of aerobes Decreased spread of oorg (oa) values mayreflect dominance of aerobic autotrophs and reductive pentose (Benson-Calvin C3) cycle
bull Although ample evidence for aerobes the abundance of O2 in atm and ocean remained low (sulfidic ocean) until another major oxidation eventcaused a second lsquoreorganizationrsquo In the Neoproterozoic This was also signified by extreme oa fluctuations
bull The Neoproterozoic lsquoreorganizationrsquo led to pO2 rising to near PALallowing animals to flourish and stabilizing the new regime
bull Environmental evolution reflected changes in the balance between thermal crustal atmospheric amp biological processes
75
Pre-Quaternary climates
South America Africa
India
Permian pole
Glacial Striation Origin of permo shyCarboniferous Glaciation
COLD
Australia
Antarctica
Arabia
Permo-Carboniferrous Glaciations (~300-275 Ma)
Image removed due to copyright restrictions
Figure by MIT OpenCourseWare
Generalized diagram illustrating evidence for origination of Permo-Carboniferous glaciation on one large landmass Arrows indicate direction of glacial flow X = Permian pole position [After Sullivan 1974] Reproduced by permission from W Sullivan Continents in Motion The New Earth Debate copyright 1974 McGraw-Hill Publishing Co
76
Corg burial rate estimated from o13C in CaCO3
Image removed due to copyright restrictions
Please see Fig 10-9 in Stanley (course text)
Atmospheric O2 estimated from Corg burial rate
77
Mesozoic Warmth
-Ferns amp alligators in Siberia
Jurassic 220-140 Ma
78
Image from httpsimplewikipediaorgwikiFileAlligator3jpg in public domain
Image from httpcommonswikimediaorgwikiFileCoelurus_stegosaurusjpg in public domain
High CO2 Levels During MesozoicDecreasing CO2
Mesozoic i 13C = t CO2 Image removed due to copyright restrictions
Please see Fig 2 in Popp Brian N et al ldquoThe Post-Paleozoic Chronology and Mechanism of 13C Depletion in Primary Marine Organic Matterrdquo Am J of Science 289 (April 1989) 436-454
i Seafloor spreading rate
1 i CO2 outgassing
2 i subduction rate = i carbonate metamorphism = i CO2 production
3 i sea level (hotter oceanic crusthigher ridge volume = t land area
t weathering Increasing CO2
t CO2 sink
79
Cenozoic CO2 DecreaseDecreasing CO2
Image removed due to copyright restrictions
Please see Fig 2 in Popp Brian N et al ldquoThe Post-Paleozoic Chronology and Mechanism of 13C Depletion in Primary Marine Organic Matterrdquo Am J of Science 289 (April 1989) 436-454
Increasing CO2
80
What causes glacial-interglacial CO2 variations
(a still-unanswered question) Possible Scenario for lower glacial pCO2
bullIncreased Equator-Pole T gradient Wind strength Dust flux to ocean Iron flux to ocean
bull50 of global 1deg production occurs in ocean bullOcean 1deg production is limited by iron bullHigher 1deg production draws CO2 out of atmosphere amp sequesters it in the deep ocean amp sediments bullColder seawater dissolves more CO2
81
Text has been removed due to copyright restrictions
Please see Veizer Jan et al ldquoEvidence for Decoupling of Atmospheric CO2 and Global Climate during the Phanerozoic Eonrdquo Nature 408 (December 7 2000) 698
While a large and growing body of
evidence indicates that CO2 and climate co-vary there is some indication that the two may not be
closely linked at all timeshellip
(amp it is always important to remember that
correlation does not always mean causation)
82
Text removed due to copyright restrictions
Please see Hoffman Paul F ldquoComment on lsquoSnowball Earth on Trialrsquordquo Eos 88 (February 2007) 110
83
Text removed due to copyright restrictions
Please see Allen Phillip A ldquoReply to lsquoComment on Snowball Earth on Trialrsquordquo Eos 88 (February 2007) 110
84
Evidence for Glaciers on All Continents 09-06 Ga
Image removed due to copyright restrictions
Please see Fig 123 in Crowley T J and North G R Paleoclimatology New York NY Oxford University Press 1992 ISBN 0195105338
85
Neither albedo or
geothermal heat flux
changes can keep the
Earth from freezing w
30 lower S
Adapted from Kump et al (1999)
86
Therefore Lower S must have
been compensated by larger greenhouse
effect
Adapted from Kump et al (1999)
87
httpwwwscotesecomprecambrhtm
Image removed due to copyright restrictions
Please see httpwwwscotesecomimages650jpg
This map illustrates the break-up of the supercontinent Rodinia which formed 1100 million years ago The Late Precambrian was an Ice House World much like the present-day
88
Figure 15 Two permissible calibrations of the composite carbon-isotope record in Figure 14 based on available radiometric dates and delta 13C data that can be correlated into the record and contrasting interpretations of the age and duration of the Sturtian and Marinoan glaciations
GSA Bulletin September 2005 v 117 no 9-10 p 1181-1207 Toward a Neoproterozoic composite carbon-isotope record Galen P Halverson Paul F Hoffman Daniel P Schrag Adam C Maloof and A Hugh N Rice
89Image courtesy of the Geological Society of America Used with permission
GSA Bulletin September 2005 v 117 no 9-10 p 1181-1207 Toward a Neoproterozoic composite carbon-isotope record Galen P Halverson Paul F Hoffman Daniel P Schrag Adam C Maloof and A Hugh N Rice
90Image courtesy of the Geological Society of America Used with permission
MIT OpenCourseWarehttpocwmitedu
12007 Geobiology Spring 2013
For information about citing these materials or our Terms of Use visit httpocwmiteduterms
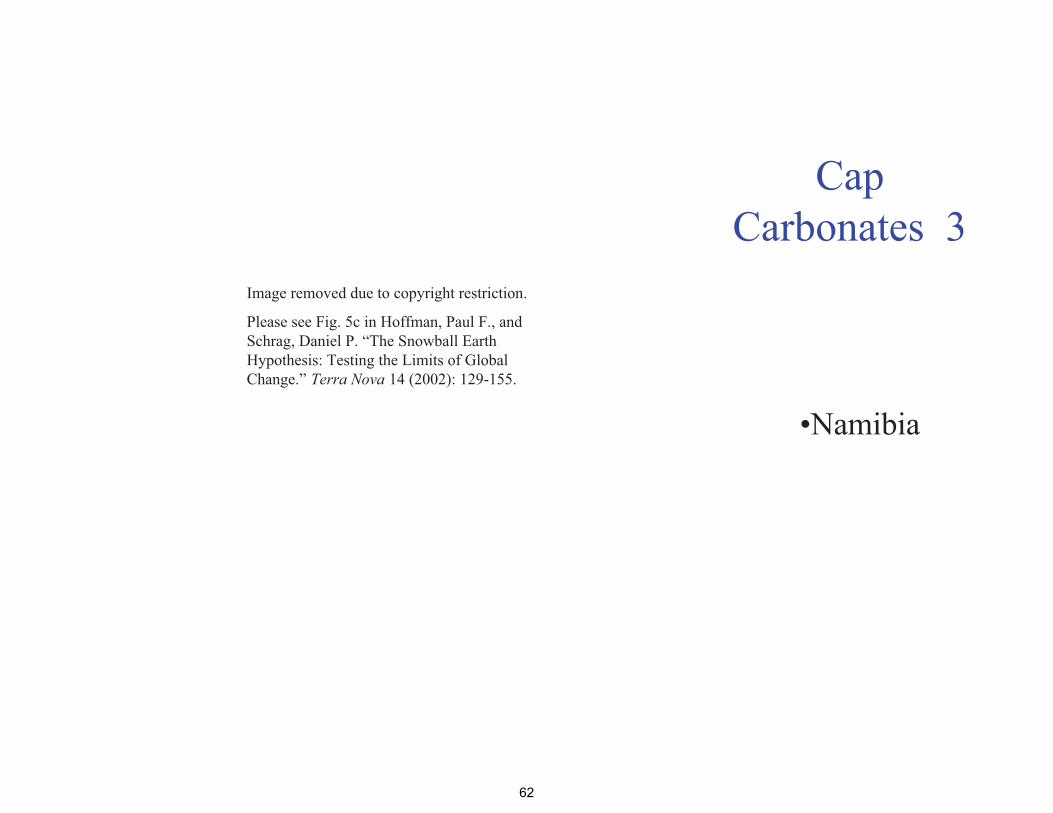
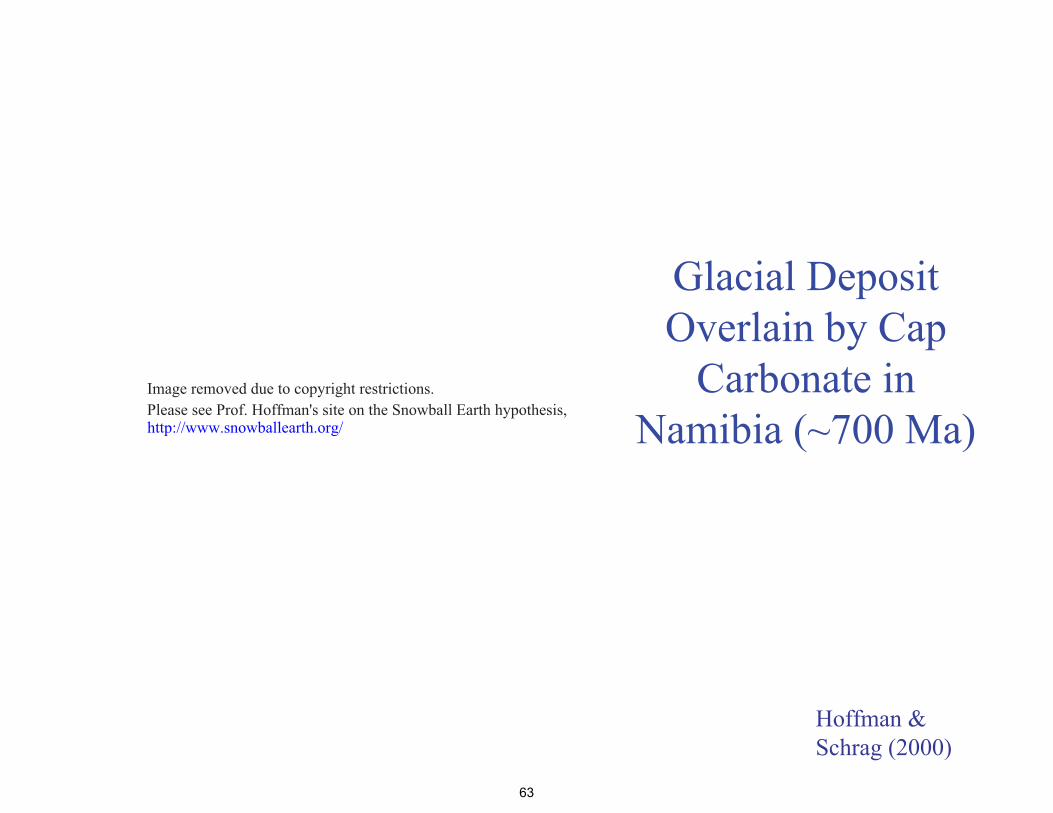
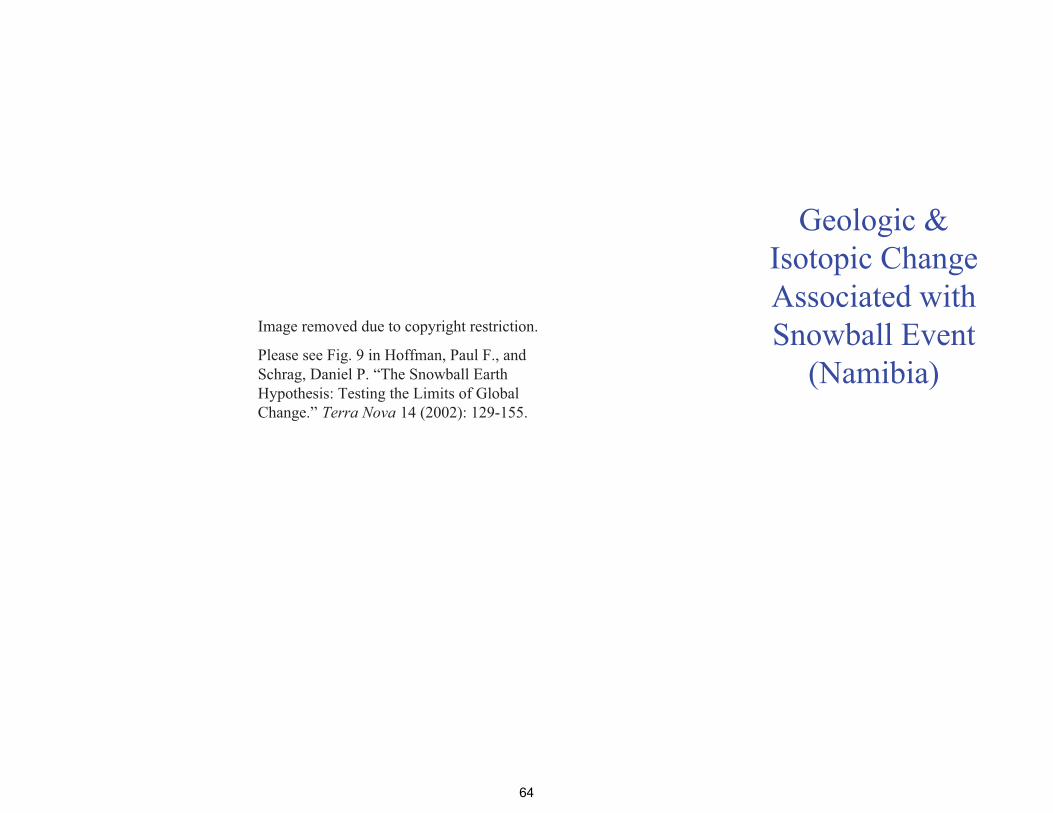
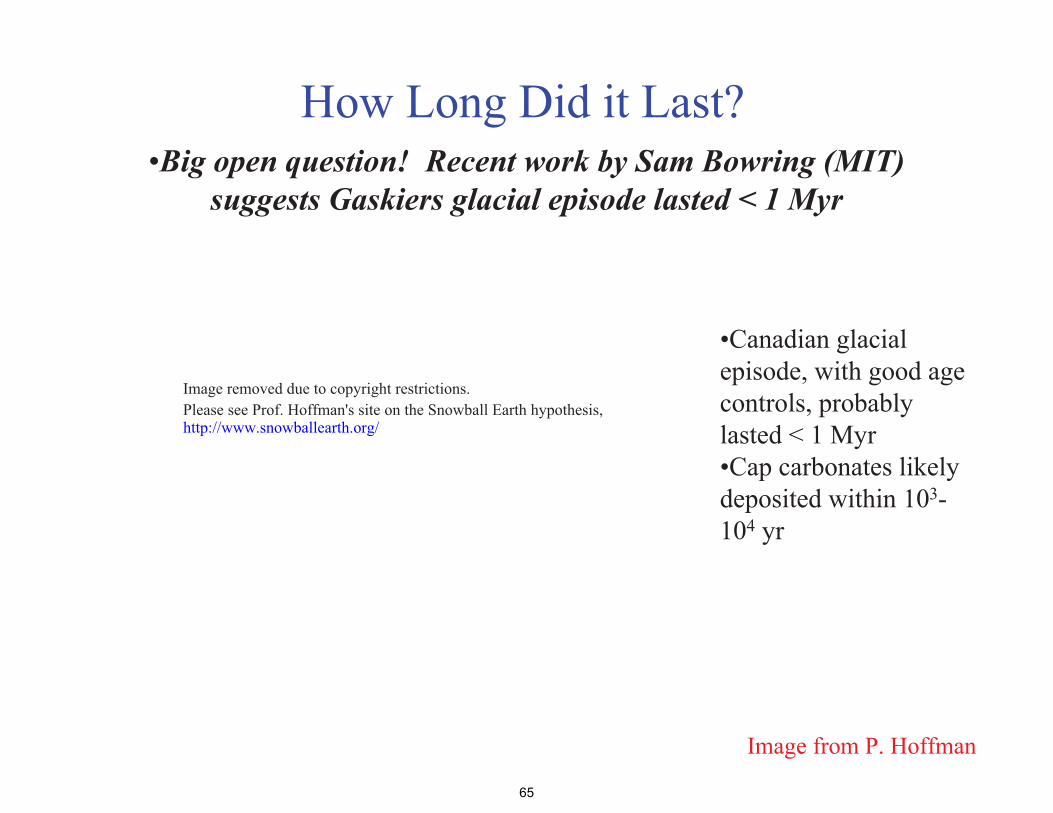
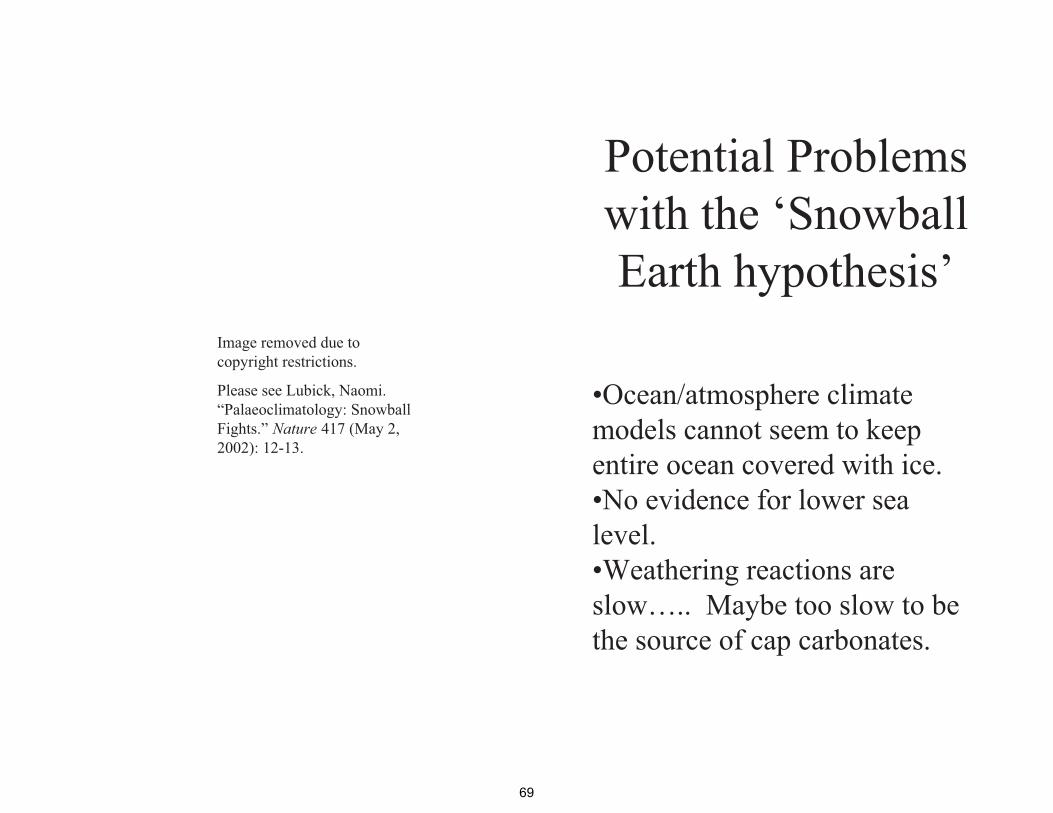
Image removed due to copyright restrictions
Please see Lubick Naomi ldquoPalaeoclimatology Snowball Fightsrdquo Nature 417 (May 2 2002) 12-13
Potential Problems with the lsquoSnowball Earth hypothesisrsquo
bullOceanatmosphere climate models cannot seem to keep entire ocean covered with ice bullNo evidence for lower sea level bullWeathering reactions are slowhellip Maybe too slow to be the source of cap carbonates
69
Alternate Cause for Cap Carbonate Deposition amp 13C Depletions
Gas Hydrate Destabilization
Kennedy et al (2001) Geology Vol 29(5) 443-446
bullCaCO3 precipitation does not require increased weathering flux of minerals
bullCan be caused by increased seawater alkalinity resulting from CH4 consumption by sulphateshyreducing bacteria
70
Image removed due to copyright restrictions
Please see Fig 1 in Kennedy Martin J et al ldquoAre Proterozoic Cap Carbonates and Isotopic Excursion a Record of Gas Hydrate Destabilization Following Earthrsquos Coldest Intervalsrdquo Geology 29 (May 2001) 443-446
Structures in Cap Carbonates May Result from Gas
Release bullGas Hydrate = [H2O + hydrocarbon (CH4)] ice bullCH4 from biogenic + thermogenic decomposition of deeply buried CorgbullBiogenic CH4 has very low o13C (-60 to-90permil) bullSequestered as hydrate in permafrost (gt 150 m) amp along continental margins (gt 300 m) bullDestabilized by increased temperature bullCH4 released from flooded permafrost during deglaciation
71
A Biogeochemical Model of the Proterozoic Ocean
Image removed due to copyright restrictions
Please see Fig 3a in Logan Graham A et al ldquoTerminal Proterozoic Reorganization of Biogeochemical Cyclesrdquo Nature 376 (July 6 1995) 53-56
72
After Ventilation
Image removed due to copyright restrictions
Please see Fig 3b in Logan Graham A et al ldquoTerminal Proterozoic Reorganization of Biogeochemical Cyclesrdquo Nature 376 (July 6 1995) 53-56
73
A Carbon Cycle with Two Timescales
oi
weathering volcanism
o1 1
o2-8
o2 o2 2
sedimentoa oo carbonate carbon organic carbon
74
Summarybull The C-cycle has evolved radically through time bull Prior to 22 Ga anaerobic prokaryotes dominated wide spread of oorg (oo)
values oxygenic photosynthesis extant but oxygen remained low as sinks gtgt sources
bull Mantle may have been an important sink for oxidising power bull Extreme ocarb(oa) values around 22 Ga probably signify the lsquoGOErsquo and rise
to prominence of aerobes Decreased spread of oorg (oa) values mayreflect dominance of aerobic autotrophs and reductive pentose (Benson-Calvin C3) cycle
bull Although ample evidence for aerobes the abundance of O2 in atm and ocean remained low (sulfidic ocean) until another major oxidation eventcaused a second lsquoreorganizationrsquo In the Neoproterozoic This was also signified by extreme oa fluctuations
bull The Neoproterozoic lsquoreorganizationrsquo led to pO2 rising to near PALallowing animals to flourish and stabilizing the new regime
bull Environmental evolution reflected changes in the balance between thermal crustal atmospheric amp biological processes
75
Pre-Quaternary climates
South America Africa
India
Permian pole
Glacial Striation Origin of permo shyCarboniferous Glaciation
COLD
Australia
Antarctica
Arabia
Permo-Carboniferrous Glaciations (~300-275 Ma)
Image removed due to copyright restrictions
Figure by MIT OpenCourseWare
Generalized diagram illustrating evidence for origination of Permo-Carboniferous glaciation on one large landmass Arrows indicate direction of glacial flow X = Permian pole position [After Sullivan 1974] Reproduced by permission from W Sullivan Continents in Motion The New Earth Debate copyright 1974 McGraw-Hill Publishing Co
76
Corg burial rate estimated from o13C in CaCO3
Image removed due to copyright restrictions
Please see Fig 10-9 in Stanley (course text)
Atmospheric O2 estimated from Corg burial rate
77
Mesozoic Warmth
-Ferns amp alligators in Siberia
Jurassic 220-140 Ma
78
Image from httpsimplewikipediaorgwikiFileAlligator3jpg in public domain
Image from httpcommonswikimediaorgwikiFileCoelurus_stegosaurusjpg in public domain
High CO2 Levels During MesozoicDecreasing CO2
Mesozoic i 13C = t CO2 Image removed due to copyright restrictions
Please see Fig 2 in Popp Brian N et al ldquoThe Post-Paleozoic Chronology and Mechanism of 13C Depletion in Primary Marine Organic Matterrdquo Am J of Science 289 (April 1989) 436-454
i Seafloor spreading rate
1 i CO2 outgassing
2 i subduction rate = i carbonate metamorphism = i CO2 production
3 i sea level (hotter oceanic crusthigher ridge volume = t land area
t weathering Increasing CO2
t CO2 sink
79
Cenozoic CO2 DecreaseDecreasing CO2
Image removed due to copyright restrictions
Please see Fig 2 in Popp Brian N et al ldquoThe Post-Paleozoic Chronology and Mechanism of 13C Depletion in Primary Marine Organic Matterrdquo Am J of Science 289 (April 1989) 436-454
Increasing CO2
80
What causes glacial-interglacial CO2 variations
(a still-unanswered question) Possible Scenario for lower glacial pCO2
bullIncreased Equator-Pole T gradient Wind strength Dust flux to ocean Iron flux to ocean
bull50 of global 1deg production occurs in ocean bullOcean 1deg production is limited by iron bullHigher 1deg production draws CO2 out of atmosphere amp sequesters it in the deep ocean amp sediments bullColder seawater dissolves more CO2
81
Text has been removed due to copyright restrictions
Please see Veizer Jan et al ldquoEvidence for Decoupling of Atmospheric CO2 and Global Climate during the Phanerozoic Eonrdquo Nature 408 (December 7 2000) 698
While a large and growing body of
evidence indicates that CO2 and climate co-vary there is some indication that the two may not be
closely linked at all timeshellip
(amp it is always important to remember that
correlation does not always mean causation)
82
Text removed due to copyright restrictions
Please see Hoffman Paul F ldquoComment on lsquoSnowball Earth on Trialrsquordquo Eos 88 (February 2007) 110
83
Text removed due to copyright restrictions
Please see Allen Phillip A ldquoReply to lsquoComment on Snowball Earth on Trialrsquordquo Eos 88 (February 2007) 110
84
Evidence for Glaciers on All Continents 09-06 Ga
Image removed due to copyright restrictions
Please see Fig 123 in Crowley T J and North G R Paleoclimatology New York NY Oxford University Press 1992 ISBN 0195105338
85
Neither albedo or
geothermal heat flux
changes can keep the
Earth from freezing w
30 lower S
Adapted from Kump et al (1999)
86
Therefore Lower S must have
been compensated by larger greenhouse
effect
Adapted from Kump et al (1999)
87
httpwwwscotesecomprecambrhtm
Image removed due to copyright restrictions
Please see httpwwwscotesecomimages650jpg
This map illustrates the break-up of the supercontinent Rodinia which formed 1100 million years ago The Late Precambrian was an Ice House World much like the present-day
88
Figure 15 Two permissible calibrations of the composite carbon-isotope record in Figure 14 based on available radiometric dates and delta 13C data that can be correlated into the record and contrasting interpretations of the age and duration of the Sturtian and Marinoan glaciations
GSA Bulletin September 2005 v 117 no 9-10 p 1181-1207 Toward a Neoproterozoic composite carbon-isotope record Galen P Halverson Paul F Hoffman Daniel P Schrag Adam C Maloof and A Hugh N Rice
89Image courtesy of the Geological Society of America Used with permission
GSA Bulletin September 2005 v 117 no 9-10 p 1181-1207 Toward a Neoproterozoic composite carbon-isotope record Galen P Halverson Paul F Hoffman Daniel P Schrag Adam C Maloof and A Hugh N Rice
90Image courtesy of the Geological Society of America Used with permission
MIT OpenCourseWarehttpocwmitedu
12007 Geobiology Spring 2013
For information about citing these materials or our Terms of Use visit httpocwmiteduterms

Image removed due to copyright restrictions
Please see Fig 1 in Kennedy Martin J et al ldquoAre Proterozoic Cap Carbonates and Isotopic Excursion a Record of Gas Hydrate Destabilization Following Earthrsquos Coldest Intervalsrdquo Geology 29 (May 2001) 443-446
Structures in Cap Carbonates May Result from Gas
Release bullGas Hydrate = [H2O + hydrocarbon (CH4)] ice bullCH4 from biogenic + thermogenic decomposition of deeply buried CorgbullBiogenic CH4 has very low o13C (-60 to-90permil) bullSequestered as hydrate in permafrost (gt 150 m) amp along continental margins (gt 300 m) bullDestabilized by increased temperature bullCH4 released from flooded permafrost during deglaciation
71
A Biogeochemical Model of the Proterozoic Ocean
Image removed due to copyright restrictions
Please see Fig 3a in Logan Graham A et al ldquoTerminal Proterozoic Reorganization of Biogeochemical Cyclesrdquo Nature 376 (July 6 1995) 53-56
72
After Ventilation
Image removed due to copyright restrictions
Please see Fig 3b in Logan Graham A et al ldquoTerminal Proterozoic Reorganization of Biogeochemical Cyclesrdquo Nature 376 (July 6 1995) 53-56
73
A Carbon Cycle with Two Timescales
oi
weathering volcanism
o1 1
o2-8
o2 o2 2
sedimentoa oo carbonate carbon organic carbon
74
Summarybull The C-cycle has evolved radically through time bull Prior to 22 Ga anaerobic prokaryotes dominated wide spread of oorg (oo)
values oxygenic photosynthesis extant but oxygen remained low as sinks gtgt sources
bull Mantle may have been an important sink for oxidising power bull Extreme ocarb(oa) values around 22 Ga probably signify the lsquoGOErsquo and rise
to prominence of aerobes Decreased spread of oorg (oa) values mayreflect dominance of aerobic autotrophs and reductive pentose (Benson-Calvin C3) cycle
bull Although ample evidence for aerobes the abundance of O2 in atm and ocean remained low (sulfidic ocean) until another major oxidation eventcaused a second lsquoreorganizationrsquo In the Neoproterozoic This was also signified by extreme oa fluctuations
bull The Neoproterozoic lsquoreorganizationrsquo led to pO2 rising to near PALallowing animals to flourish and stabilizing the new regime
bull Environmental evolution reflected changes in the balance between thermal crustal atmospheric amp biological processes
75
Pre-Quaternary climates
South America Africa
India
Permian pole
Glacial Striation Origin of permo shyCarboniferous Glaciation
COLD
Australia
Antarctica
Arabia
Permo-Carboniferrous Glaciations (~300-275 Ma)
Image removed due to copyright restrictions
Figure by MIT OpenCourseWare
Generalized diagram illustrating evidence for origination of Permo-Carboniferous glaciation on one large landmass Arrows indicate direction of glacial flow X = Permian pole position [After Sullivan 1974] Reproduced by permission from W Sullivan Continents in Motion The New Earth Debate copyright 1974 McGraw-Hill Publishing Co
76
Corg burial rate estimated from o13C in CaCO3
Image removed due to copyright restrictions
Please see Fig 10-9 in Stanley (course text)
Atmospheric O2 estimated from Corg burial rate
77
Mesozoic Warmth
-Ferns amp alligators in Siberia
Jurassic 220-140 Ma
78
Image from httpsimplewikipediaorgwikiFileAlligator3jpg in public domain
Image from httpcommonswikimediaorgwikiFileCoelurus_stegosaurusjpg in public domain
High CO2 Levels During MesozoicDecreasing CO2
Mesozoic i 13C = t CO2 Image removed due to copyright restrictions
Please see Fig 2 in Popp Brian N et al ldquoThe Post-Paleozoic Chronology and Mechanism of 13C Depletion in Primary Marine Organic Matterrdquo Am J of Science 289 (April 1989) 436-454
i Seafloor spreading rate
1 i CO2 outgassing
2 i subduction rate = i carbonate metamorphism = i CO2 production
3 i sea level (hotter oceanic crusthigher ridge volume = t land area
t weathering Increasing CO2
t CO2 sink
79
Cenozoic CO2 DecreaseDecreasing CO2
Image removed due to copyright restrictions
Please see Fig 2 in Popp Brian N et al ldquoThe Post-Paleozoic Chronology and Mechanism of 13C Depletion in Primary Marine Organic Matterrdquo Am J of Science 289 (April 1989) 436-454
Increasing CO2
80
What causes glacial-interglacial CO2 variations
(a still-unanswered question) Possible Scenario for lower glacial pCO2
bullIncreased Equator-Pole T gradient Wind strength Dust flux to ocean Iron flux to ocean
bull50 of global 1deg production occurs in ocean bullOcean 1deg production is limited by iron bullHigher 1deg production draws CO2 out of atmosphere amp sequesters it in the deep ocean amp sediments bullColder seawater dissolves more CO2
81
Text has been removed due to copyright restrictions
Please see Veizer Jan et al ldquoEvidence for Decoupling of Atmospheric CO2 and Global Climate during the Phanerozoic Eonrdquo Nature 408 (December 7 2000) 698
While a large and growing body of
evidence indicates that CO2 and climate co-vary there is some indication that the two may not be
closely linked at all timeshellip
(amp it is always important to remember that
correlation does not always mean causation)
82
Text removed due to copyright restrictions
Please see Hoffman Paul F ldquoComment on lsquoSnowball Earth on Trialrsquordquo Eos 88 (February 2007) 110
83
Text removed due to copyright restrictions
Please see Allen Phillip A ldquoReply to lsquoComment on Snowball Earth on Trialrsquordquo Eos 88 (February 2007) 110
84
Evidence for Glaciers on All Continents 09-06 Ga
Image removed due to copyright restrictions
Please see Fig 123 in Crowley T J and North G R Paleoclimatology New York NY Oxford University Press 1992 ISBN 0195105338
85
Neither albedo or
geothermal heat flux
changes can keep the
Earth from freezing w
30 lower S
Adapted from Kump et al (1999)
86
Therefore Lower S must have
been compensated by larger greenhouse
effect
Adapted from Kump et al (1999)
87
httpwwwscotesecomprecambrhtm
Image removed due to copyright restrictions
Please see httpwwwscotesecomimages650jpg
This map illustrates the break-up of the supercontinent Rodinia which formed 1100 million years ago The Late Precambrian was an Ice House World much like the present-day
88
Figure 15 Two permissible calibrations of the composite carbon-isotope record in Figure 14 based on available radiometric dates and delta 13C data that can be correlated into the record and contrasting interpretations of the age and duration of the Sturtian and Marinoan glaciations
GSA Bulletin September 2005 v 117 no 9-10 p 1181-1207 Toward a Neoproterozoic composite carbon-isotope record Galen P Halverson Paul F Hoffman Daniel P Schrag Adam C Maloof and A Hugh N Rice
89Image courtesy of the Geological Society of America Used with permission
GSA Bulletin September 2005 v 117 no 9-10 p 1181-1207 Toward a Neoproterozoic composite carbon-isotope record Galen P Halverson Paul F Hoffman Daniel P Schrag Adam C Maloof and A Hugh N Rice
90Image courtesy of the Geological Society of America Used with permission
MIT OpenCourseWarehttpocwmitedu
12007 Geobiology Spring 2013
For information about citing these materials or our Terms of Use visit httpocwmiteduterms
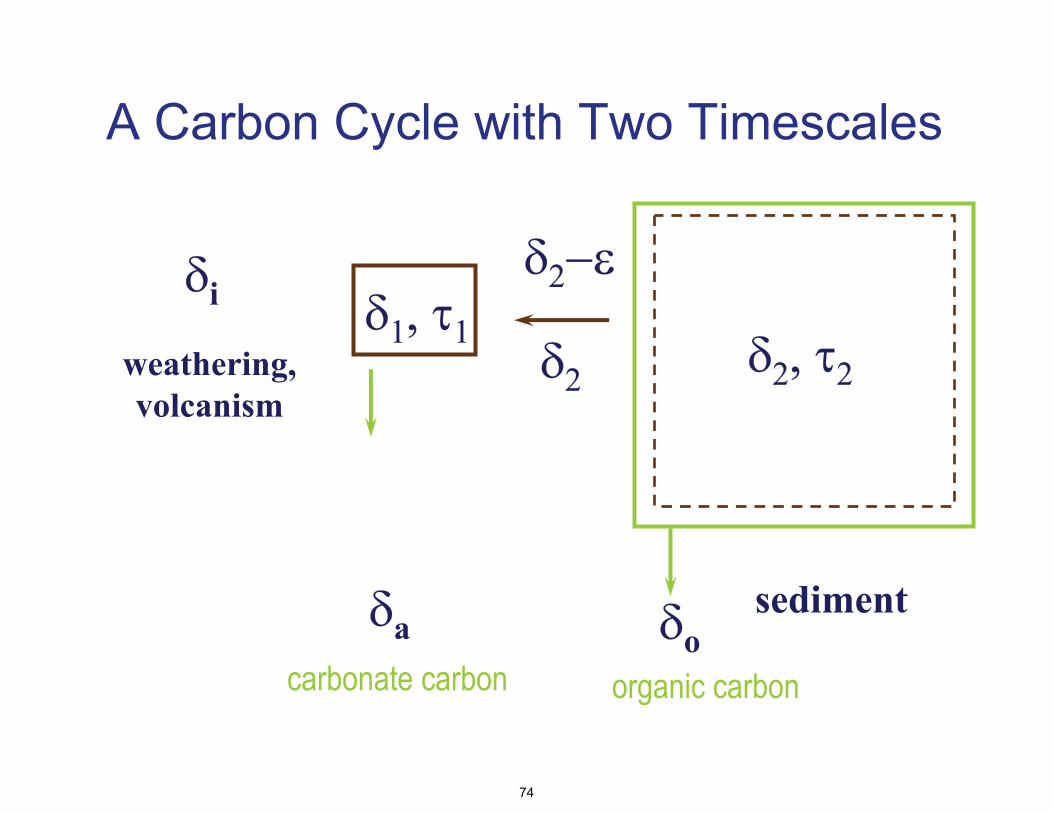
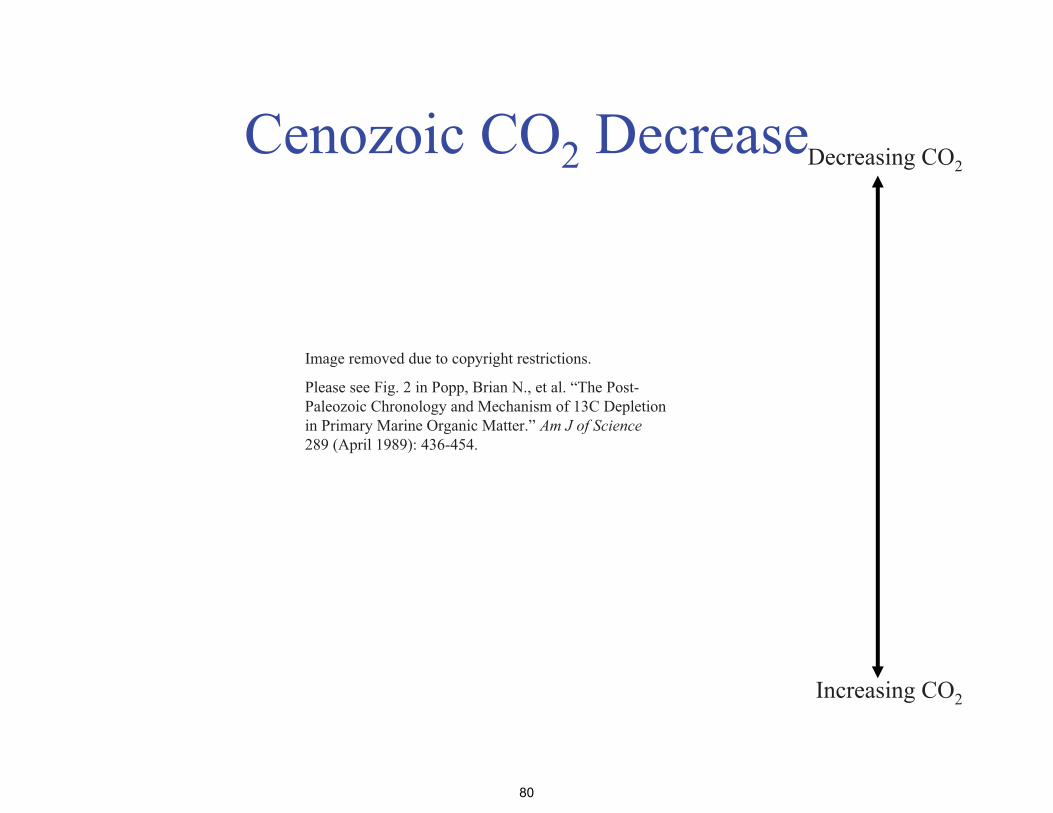

Text removed due to copyright restrictions
Please see Allen Phillip A ldquoReply to lsquoComment on Snowball Earth on Trialrsquordquo Eos 88 (February 2007) 110
84
Evidence for Glaciers on All Continents 09-06 Ga
Image removed due to copyright restrictions
Please see Fig 123 in Crowley T J and North G R Paleoclimatology New York NY Oxford University Press 1992 ISBN 0195105338
85
Neither albedo or
geothermal heat flux
changes can keep the
Earth from freezing w
30 lower S
Adapted from Kump et al (1999)
86
Therefore Lower S must have
been compensated by larger greenhouse
effect
Adapted from Kump et al (1999)
87
httpwwwscotesecomprecambrhtm
Image removed due to copyright restrictions
Please see httpwwwscotesecomimages650jpg
This map illustrates the break-up of the supercontinent Rodinia which formed 1100 million years ago The Late Precambrian was an Ice House World much like the present-day
88
Figure 15 Two permissible calibrations of the composite carbon-isotope record in Figure 14 based on available radiometric dates and delta 13C data that can be correlated into the record and contrasting interpretations of the age and duration of the Sturtian and Marinoan glaciations
GSA Bulletin September 2005 v 117 no 9-10 p 1181-1207 Toward a Neoproterozoic composite carbon-isotope record Galen P Halverson Paul F Hoffman Daniel P Schrag Adam C Maloof and A Hugh N Rice
89Image courtesy of the Geological Society of America Used with permission
GSA Bulletin September 2005 v 117 no 9-10 p 1181-1207 Toward a Neoproterozoic composite carbon-isotope record Galen P Halverson Paul F Hoffman Daniel P Schrag Adam C Maloof and A Hugh N Rice
90Image courtesy of the Geological Society of America Used with permission
MIT OpenCourseWarehttpocwmitedu
12007 Geobiology Spring 2013
For information about citing these materials or our Terms of Use visit httpocwmiteduterms
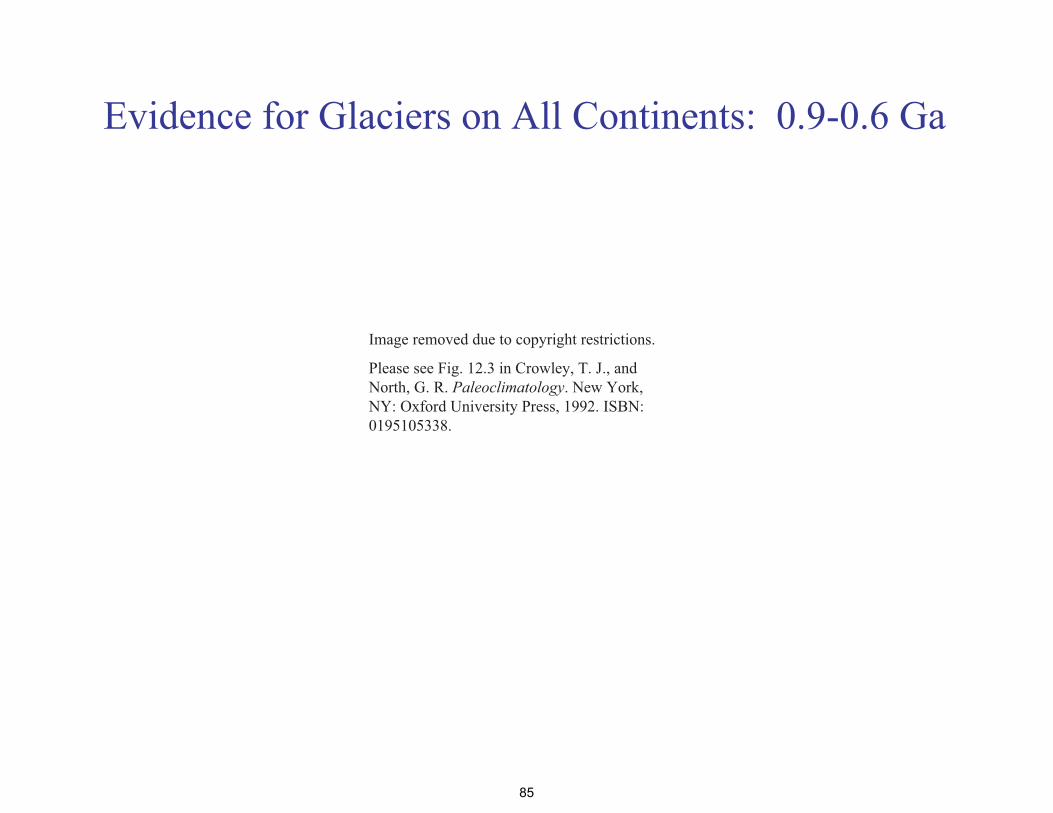
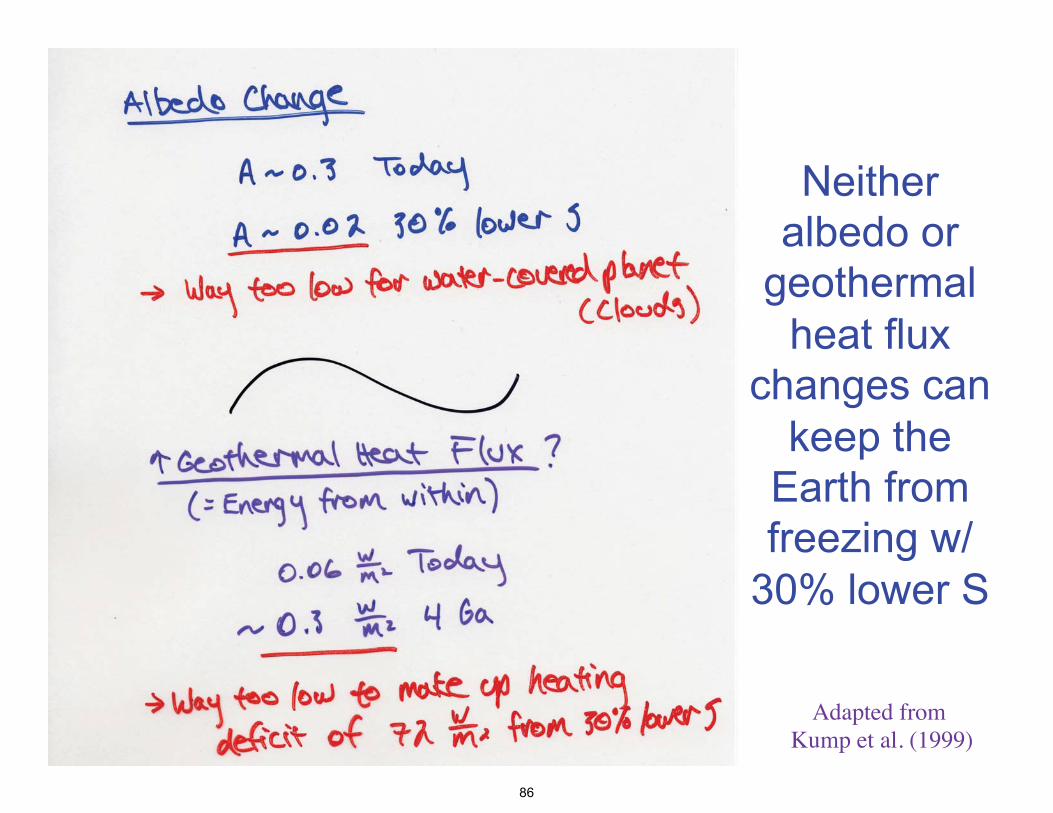
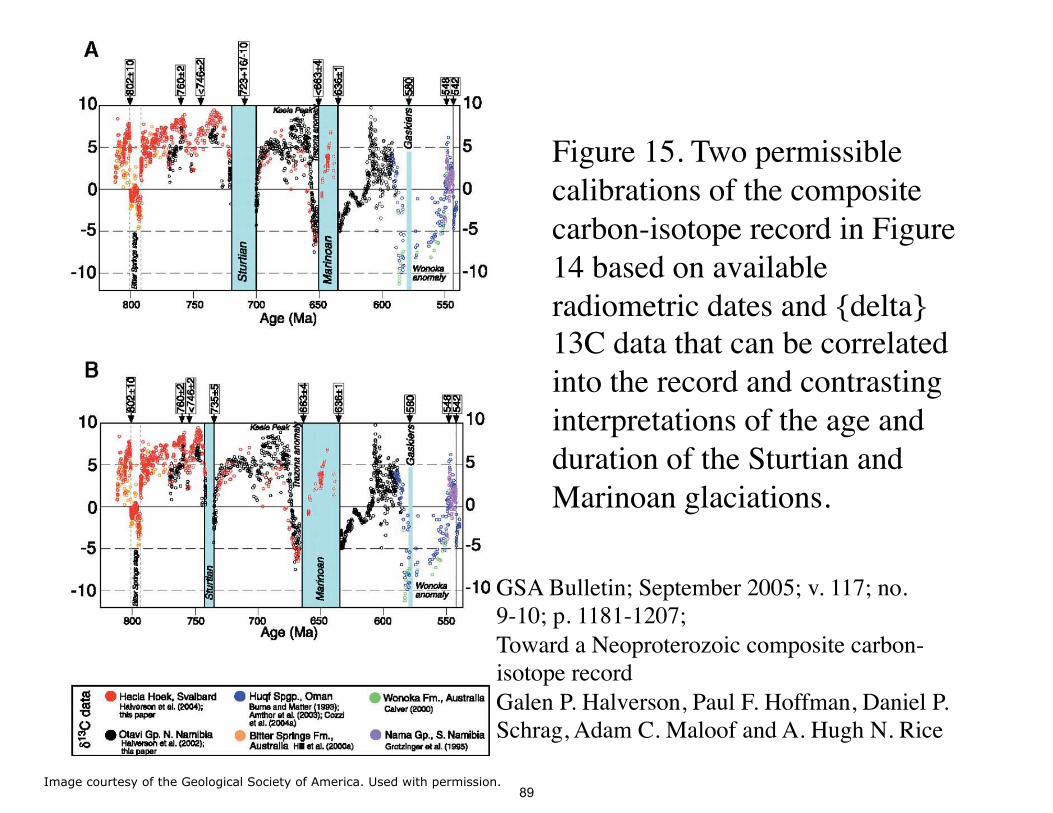

MIT OpenCourseWarehttpocwmitedu
12007 Geobiology Spring 2013
For information about citing these materials or our Terms of Use visit httpocwmiteduterms
Recommended


