@gardnercenter

Community Research for Youth and Families
Amy Gerstein
Children and Families Policy Symposium
March 4, 2015
@gardnercenter

Agenda
• About The John W. Gardner Center
• Community Research for Youth and Families
• Chronic Absenteeism: Redwood City
• Early Warning Indicators: San Francisco
• Key Takeaways

About the Gardner Center
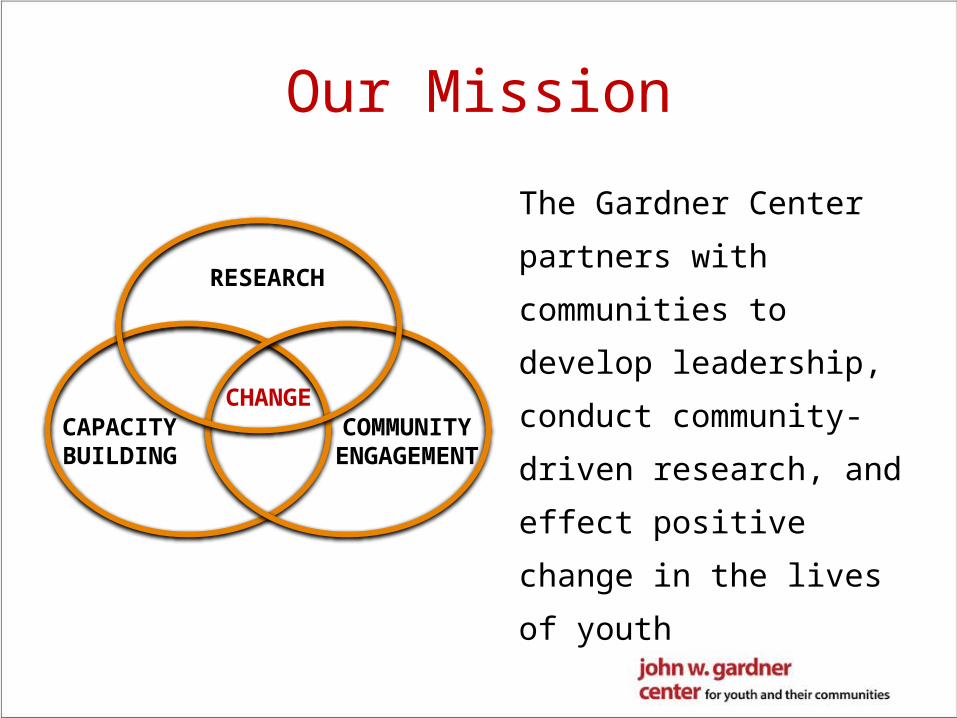
Our Mission
The Gardner Center
partners with
communities to develop
leadership, conduct
community-driven
research, and effect
positive change in the
lives of youth
RESEARCH
COMMUNITY ENGAGEMENT
CAPACITYBUILDING
CHANGE

The Youth Sector
YOUTH
AFTERSCHOOL PROGRAMS
SUMMER PROGRAMS
HEALTH SERVICES
FAMILIES
RELIGIOUS INSTITUTIONS
NEIGHBORHOODS
SCHOOLS
SOCIAL SERVICES

Our Strategies
• Implementation research
• Integrated longitudinal data analysis
• Community engagement
Community Research for Youth and Families
• Cross-sector collaborations
• Identification of problem area
• Community engaged throughout process
• Iterative discussion of questions, methods, findings, and possible solutions
• Conversations, behaviors, and policies change

Chronic Absenteeism in Redwood City

Redwood City 2020
• Concerned about chronic absence
• Believed that response should be community-wide
• Engaged Gardner Center in collaborative research process
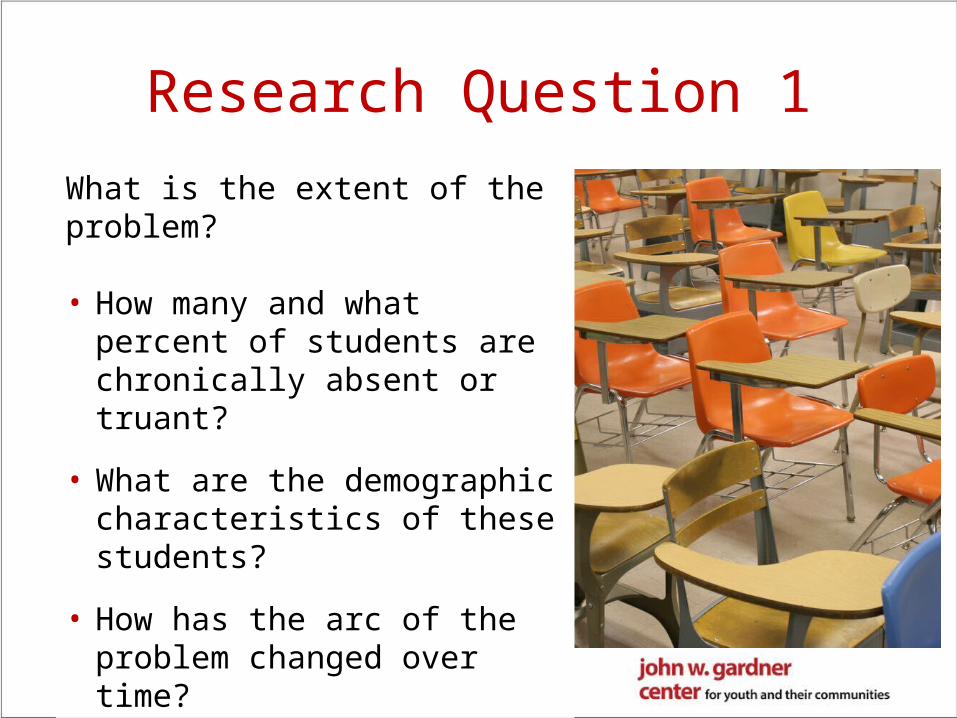
Research Question 1
What is the extent of the problem?
• How many and what percent of students are chronically absent or truant?
• What are the demographic characteristics of these students?
• How has the arc of the problem changed over time?

Research Question 2
In what ways does this affect student outcomes?
• What demographic characteristics and other factors are correlated with students’ absenteeism?
• What are educational outcomes for students with absenteeism issues over time?

Data and Analyses
• Used longitudinal linked data from the elementary and high school districts through the Youth Data Archive
• Conducted descriptive and regression-adjusted analyses
• Examined chronic absence across school years to understand the persistence of the problem

Extent of the ProblemWhat percent of Redwood City students are chronically absent?
K 1 2 3 4 5 6 7 8 9 10 11 120%
10%
20%
30%
12%
9%7% 7% 6% 6% 6% 7%
10% 10% 10% 9%11%
Grade Level

• Being an English Learner
• Having been suspended
• Having a parent who did not graduate from college
• Having made a school or district transition
• Having been tardy 3+ days
PROFILE OF CHRONIC ABSENCE
Chronically absent elementary-school students had higher rates of . . .
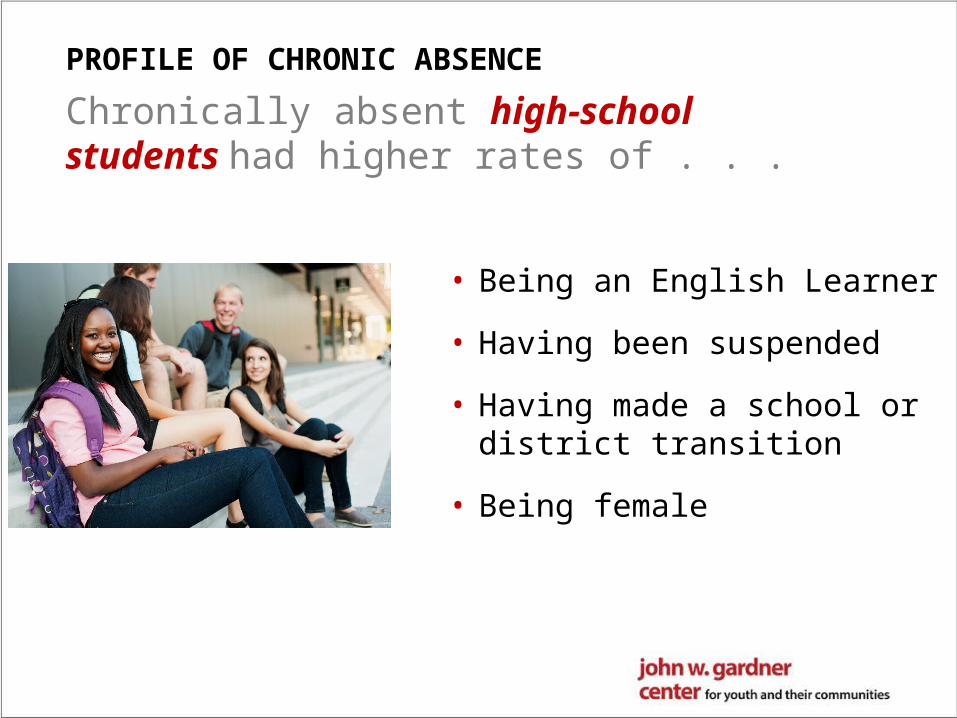
• Being an English Learner
• Having been suspended
• Having made a school or district transition
• Being female
PROFILE OF CHRONIC ABSENCE
Chronically absent high-school students had higher rates of . . .

Key IndicatorsStrongest predictors of chronic absence in a school year include . . .
ELEMENTARY SCHOOL
HIGH SCHOOL
Prior year chronic absence X XAccumulated 3+ tardies XSuspension X

Key Effects
Number of days absent had significant negative effect on students’
• California Standards Test (CST) percentiles in Math and ELA in elementary grades
• Grade point average (GPA) in high school grades

Implications for Policy and Practice
• Community-wide interventions
• System-wide response to chronic absence
• School-based focus on chronic absence

What Happened?
• Elementary district hired attendance coordinator
• Police shifted strategies
• Health system re-assessed role
• Community awareness increased

Early Warning Indicators in San Francisco

Project Goals
• Ensure that more students are graduating from high school in a timely manner
• Develop Early Warning Indicators to identify 8th and 9th grade students at risk of not graduating
• Provide extra supports to help move them back on track
• Engage in a collaborative research process

Research ObjectiveDevelop a 3 Part Indicator System that . . .
Identifies 8th grade students
who may benefit from a
summer program that
eases transition to high school
Helps high schools identify
incoming 9th grade students
who might benefit from
added supports
Monitors students during
9th grade to ensure they stay on track
for high school graduation

Data and Analyses
• Regression analysis of SFUSD administrative data
• SFUSD selected two 8th grade indicators or risk factors: (1) GPA below 2.0 (2) Attendance rate below 87.5%
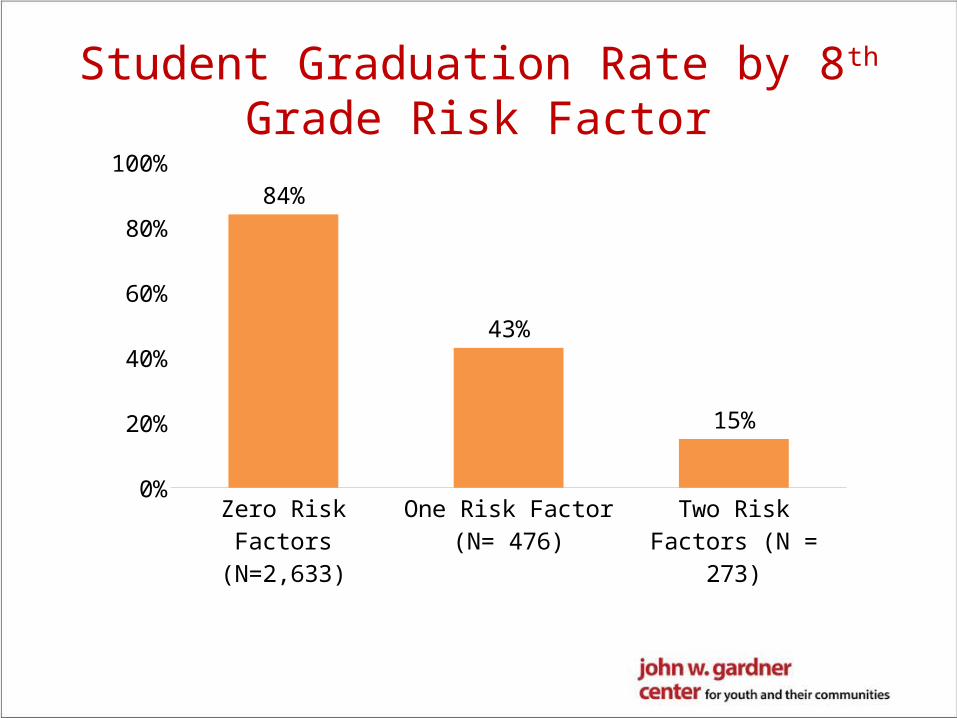
Student Graduation Rate by 8th Grade Risk Factor
Zero Risk Fac-tors (N=2,633)
One Risk Factor (N= 476)
Two Risk Factors (N = 273)
0%
20%
40%
60%
80%
100%
84%
43%
15%

Students Entering 9th Grade with At Least One Risk Factor
All S
tude
nts
Fem
ale
Male
Chine
se
Latin
o
Afric
an A
mer
ican
White
Filip
ino
Other
Asia
n/PI
All O
ther
0%
10%
20%
30%
40%
50%
60%
22% 20%25%
6%
39%
53%
19% 19%14%
19%
Questions for Policy and Practice
• What role can school staff (principals, teachers, counselors) and non-school staff (parents, external partners) play in assisting or monitoring these students?
• Given the differences in school populations across high schools, do schools need to adopt new strategies?
• What resources could help schools effectively assist these students?

What Happened?
• Students are progressing through high school
• Schools, partners & district created interventions
• Confidence that students have services they need
• Families, DCYF, and CBOs are working in partnership
• Now investigating identifying students even earlier

Key Takeaways

Key Takeaways
• Focusing on questions raised by community partners supports solutions that communities can put to work—in policy and practice.
• Regular and iterative exchanges throughout the research process generate actionable knowledge
• Working in deep partnership with communities forges relationships that extend beyond the life of a study
• Much of the work is as good as your data
Thank you for joining us today!
www.gardnercenter.stanford.edu@gardnercenter

Recommended