
ESTABLISHMENT OF A BIOFUEL
WESTERN DISTRICTS OF VICTORIA
A CONCEPT PLANFOR THE
ESTABLISHMENT OF A BIOFUEL
PRODUCTION FACILITY IN THE
WESTERN DISTRICTS OF VICTORIA
Heinz de Chelard BEng (Env) Hons
October 2009
ESTABLISHMENT OF A BIOFUEL
PRODUCTION FACILITY IN THE
WESTERN DISTRICTS OF VICTORIA
(Env) Hons

RMIT Handbury Fellowship Program
Biofuels Feasibility Investigation
ii | P a g e
Acknowledgements, disclaimers etc
Cover Photos: Sidebar: Canola crop near Dunkeld, Victoria (Carla De Angelis 2007)

RMIT Handbury Fellowship Program
Biofuels Feasibility Investigation
iii | P a g e
ContentsContents................................................................................................................................................. iii
Figures.................................................................................................................................................... vi
Tables ................................................................................................................................................... viii
Glossary.................................................................................................................................................. ix
Summary .................................................................................................................................................1
1. Introduction ....................................................................................................................................2
2. The Requirement for Alternative Agricultural Fuels.......................................................................2
2.1. Peak Oil ...................................................................................................................................3
2.2. Climate Change .......................................................................................................................5
2.3. Carbon Trading........................................................................................................................5
2.4. Relocalisation..........................................................................................................................8
3. Alternative Energy Sources for Agriculture ....................................................................................9
3.1. Energy Density ......................................................................................................................10
3.2. Liquified Petroleum Gas........................................................................................................10
3.3. Natural Gas ...........................................................................................................................11
3.4. Hydrogen...............................................................................................................................11
3.4.1. Hydrogen Fuelled Internal Combustion Engines ......................................................12
3.4.2. Hydrogen Fuel Cells.......................................................................................................12
3.5. Battery Electric Vehicles........................................................................................................13
3.6. Conclusion.............................................................................................................................13
4. Biomass .........................................................................................................................................14
4.1. Biofuel, Food and Biodiversity Loss ......................................................................................14
4.2. Biofuel Carbon Emissions......................................................................................................14
4.3. Pyrolysis ................................................................................................................................15
4.4. Ethanol ..................................................................................................................................15
4.4.1. Ethanol Production Processes.......................................................................................15
4.4.2. Ethanol Energy Balance.................................................................................................16
4.4.3. Ethanol Production By-Products ...................................................................................16
4.4.4. Carbon Emissions From Ethanol Production and Use...................................................17
4.4.5. Ethanol Production in Australia ....................................................................................19
4.4.6. Water Use During Ethanol Production..........................................................................19
4.4.7. Ethanol From Algae.......................................................................................................19
4.4.8. Engine Requirements for Ethanol Use ..........................................................................19

RMIT Handbury Fellowship Program
Biofuels Feasibility Investigation
iv | P a g e
4.5. Diesohol ................................................................................................................................20
4.6. Vegetable Oils and Animal Fats ............................................................................................20
4.7. Biodiesel................................................................................................................................21
4.7.1. Biodiesel Comparison with Petroleum Diesel...............................................................23
4.7.2. Biodiesel Advantages ....................................................................................................23
4.7.3. Biodiesel Disadvantages................................................................................................25
4.7.4. Biodiesel Production Processes ....................................................................................27
4.7.5. Biodiesel Energy Balance ..............................................................................................30
4.7.6. Biodiesel Production By-Products.................................................................................30
4.7.7. Carbon Emissions from Biodiesel Production ...............................................................31
4.7.8. Algae Feedstocks...........................................................................................................32
4.7.9. Scales of Production......................................................................................................32
4.7.10. Biodiesel Production in Australia ..................................................................................35
4.7.11. Water Use During Biodiesel Production .......................................................................36
4.7.12. Engine Requirements for Biodiesel Use........................................................................37
4.7.13. Economics of Biodiesel Production...............................................................................39
5. The Future.....................................................................................................................................39
5.1. Rationing ...............................................................................................................................39
5.2. Gas to Liquid Fuels ................................................................................................................40
5.3. Coal to Liquid Fuels ...............................................................................................................40
5.4. Algae .....................................................................................................................................41
5.4.1. Nutrient Requirements .................................................................................................42
5.4.2. CO2 Requirements.........................................................................................................43
5.4.3. Temperature Requirements..........................................................................................44
5.4.4. Light Requirements .......................................................................................................48
5.3.5. Water Requirements.....................................................................................................48
5.3.6. Products & By-Products ................................................................................................49
6. Local Scale Biofuels Production ....................................................................................................50
6.1. Methane Production.............................................................................................................53
6.2. Combined Heat and Power ...................................................................................................55
6.3. Algae Production...................................................................................................................56
6.4. Algae Processing ...................................................................................................................57
6.5. Biodiesel Production .............................................................................................................58
7. Conclusion.....................................................................................................................................58

RMIT Handbury Fellowship Program
Biofuels Feasibility Investigation
v | P a g e
7.1. Project Feasibility ..................................................................................................................59
Bibliography ..........................................................................................................................................62

RMIT Handbury Fellowship Program
Biofuels Feasibility Investigation
vi | P a g e
Figures
Figure 1. Global oil production depletion curve (Kimble, 2009).............................................................3
Figure 2. The price of a barrel of oil since first discovery in 1861 to 2009 in today's dollars
(Maidment, Puell, & Reifman, 2009). .....................................................................................................4
Figure 3. Australia’s interim carbon emissions projections with and without abatement measures
(Department of Climate Change, 2009b)................................................................................................6
Figure 4. Year 2008 contributions of total net CO2-e emissions by sector (Department of Climate
Change, 2009a). ......................................................................................................................................6
Figure 5. Year 2008 sub-sector CO2-e emissions from agriculture (Department of Climate Change,
2009b). ....................................................................................................................................................7
Figure 6. Agricultural greenhouse gas emissions projections to 2020 (Department of Climate Change,
2009b). ....................................................................................................................................................8
Figure 7. The conceptual operation of a fuel cell (FCIA, 2003)............................................................12
Figure 8. The biofuels carbon cycle (Tickell, 2003). ..............................................................................15
Figure 9. A typical first generation ethanol production process as used by the Dalby Bio-Refinery in
Queensland (DBRL, 2009). ....................................................................................................................16
Figure 10. Life cycle greenhouse gas emissions from different ethanol production methods . ..........18
Figure 11. Predicted carbon emissions savings from the establishment of a biorefinery in Western
Australia. Note that one Gigagram (Gg) equals one thousand tonnes (Grant, Beer, Campbell, &
Batten, 2008). .......................................................................................................................................18
Figure 12. Petroleum diesel emission particle constituents (source:
http://www.catf.us/publications/reports/Diesel_Health_in_America.pdf). .......................................24
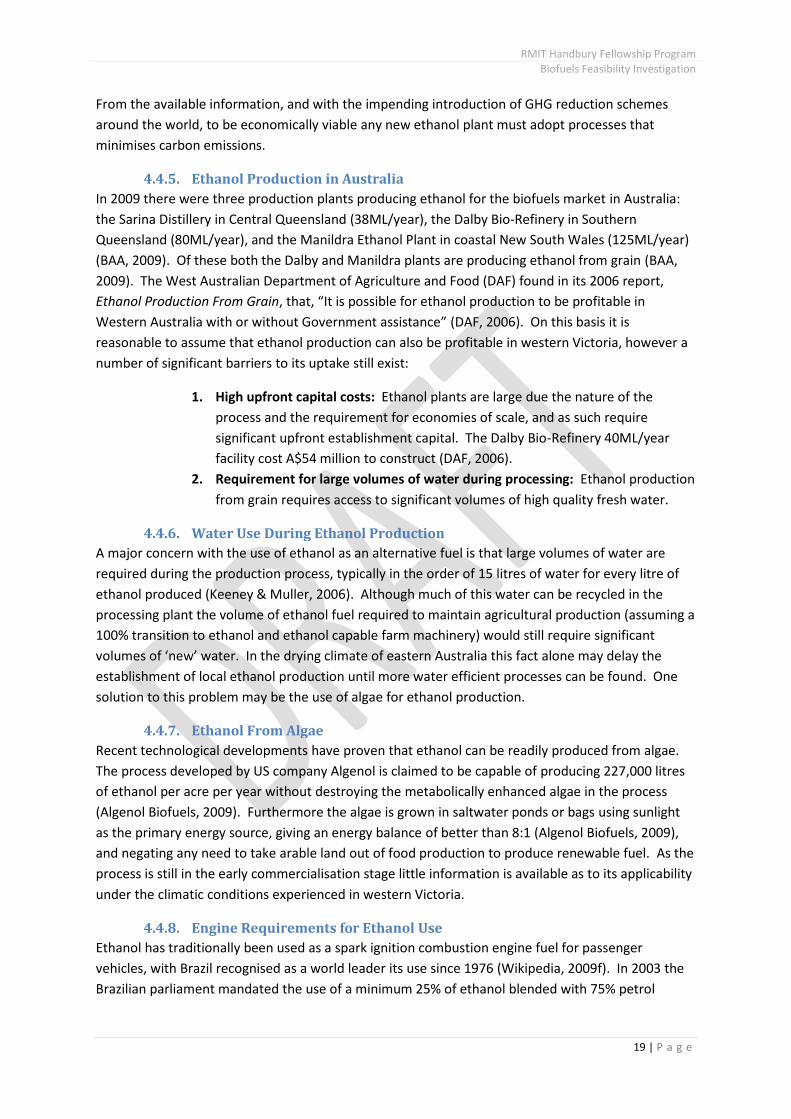
Figure 13. Long term effect of vehicle exhaust emissions particles on a human lung (Kearney, 2006).
..............................................................................................................................................................25
Figure 14. Gel point comparison of 100% biodiesel (B100) made from cottonseed oil and tallow. ....26
Figure 15. A sample of B50 biodiesel showing no signs of gelling under low temperature conditions.
..............................................................................................................................................................27
Figure 16. The triglyceride oil molecule found in vegetable and animal oils (Tickell, 2003)................28
Figure 17. The chemical reaction involved in the production of biodiesel (Tickell, 2003). ..................29
Figure 18. The biodiesel production sequence (NBB, 2007).................................................................29
Figure 19. A one litre sample of biodiesel showing the settling of glycerol as the darker layer at the
bottom of the flask. ..............................................................................................................................30
Figure 20. A comparison of full lifecycle GHG emissions from 100% biodiesel produced from various
feedstocks (Beer, Grant, & Campbell, The greenhouse and air quality emissions of biodiesel blends in
Australia, 2007).....................................................................................................................................32
Figure 21. A small biodiesel production plant capable of producing 150 - 1000L/day (BioWorks,
2005). ....................................................................................................................................................33
Figure 22. A small scale biodiesel production plant capable of producing 200L every eight hours
(Biodiesel Logic Inc, 2005).....................................................................................................................34
Figure 23. A 32,000 litre per day biodiesel production plant (BioWorks, 2005). ................................34
Figure 24. Biodiesel Producers 60 ML/year Barnawatha production facility (Biodiesel Producers,
2008). ....................................................................................................................................................35
Figure 25. The 'washing' of a biodiesel sample. Note the change in colour of the biodiesel (top) and
wash water (bottom), with each stage of the wash proceeding from left to right. .............................37

RMIT Handbury Fellowship Program
Biofuels Feasibility Investigation
vii | P a g e
Figure 26. A used in-line filter containing trapped sludge stripped from the fuel system in the first
1000km of operation of a vehicle using 100% biodiesel (Photo: Heinz de Chelard 2008). .................39
Figure 27. The basic requirements necessary for algae to thrive (Utah State University, 2009). ........41
Figure 28. The proposed configuration of the MBD Energy bioreactor field for algae production (MBD
Energy, 2009). .......................................................................................................................................42
Figure 29. An artist conception of an 'Artificial Tree' used to concentrate and store atmospheric
carbon dioxide (Flesher, 2009). ...........................................................................................................44
Figure 30. Annual temperatures and rainfall for Hamilton airport (Weather Zone, 2009)..................45
Figure 31. An example of an Open Cultivation System for biofuel algae production (Utah State
University, 2009)...................................................................................................................................46
Figure 32. An example of a Closed Cultivation System for algae production (Algbay, 2008)...............46
Figure 33. The Queensland Department of Primary Industries solar glasshouse facility at Warwick
(Qld Department of Public Works, 2009). ............................................................................................47
Figure 34. Masnedø power station in Denmark burns waste straw to produce electricity. Waste heat
is used to optimise growth conditions in the glasshouses seen on the right of the photo (Wikipedia,
2006). ....................................................................................................................................................47
Figure 35. Average daily sunshine hours at the Bureau of Meteorology's Hamilton Research Station .
(BOM, 2009)..........................................................................................................................................48
Figure 36. The proposed Local Scale Biofuels Production process. ......................................................52
Figure 37. The basic layout of a typical anaerobic digester producing methane as an effluent gas
(English 202C, Unknown). .....................................................................................................................53
Figure 38. Kerbside waste profile for the south western region of Victoria (SWRG, 2009). ................54
Figure 39. Digestate recovered from an anaerobic digester, suitable for use as a soil conditioner
(Wikipedia, 2009l). ................................................................................................................................54
Figure 40. Inputs and outputs from the methane production stage of the proposed process............55
Figure 41. Inputs and outputs from the Combined Heat and Power production process in the LSBP
facility....................................................................................................................................................56
Figure 42. The proposed inputs to and outputs from the Closed Cultivation System bioreactor........57
Figure 43. Inputs to and outputs from the algae processing stage of the proposed biofuels facility. .58
Figure 44. Inputs and outputs from the biodiesel processing stage of the proposed LSBP facility. ....58

RMIT Handbury Fellowship Program
Biofuels Feasibility Investigation
viii | P a g e
Tables
Table 1. Energy densities of existing and alternative fuels (Wikipedia, 2009g). ..................................10
Table 2. Crops suitable for oil extraction and biodiesel production (Whittington, 2006)...................21
Table 3. Oil seed crops suitable for biodiesel production in western Victoria. ....................................22
Table 4. A comparison of a number of important properties of petroleum diesel, pure canola oil and
biodiesel (Beer, et al., 2000). ................................................................................................................23
Table 5. Lifecycle Green House Gas emissions for biodiesel produced from various feedstocks (Beer,
Grant, & Campbell, The greenhouse and air quality emissions of biodiesel blends in Australia, 2007).
..............................................................................................................................................................31
Table 6. Australian current and proposed biodiesel production 2004 to 2009 (Biofuels Taskforce,
2005). Note that all values are in ML....................................................................................................36
Table 7. Manufacturers producing biodiesel compatible farm machinery (Source: Manufacturer web
sites)......................................................................................................................................................37
Table 8. Average number of days within different temperature ranges at the Hamilton airport
(Elders, 2009). .......................................................................................................................................45
Table 9. Algae products and end uses (MBD Energy, 2009). ................................................................49

RMIT Handbury Fellowship Program
Biofuels Feasibility Investigation
ix | P a g e
Glossary
B5: A blend of 5% biodiesel and 95% petroleum diesel. ‘B’ indicates Biodiesel andthe number following ‘B’ indicates the percentage biodiesel blended withpetroleum diesel e.g. B20 fuel contains 20% biodiesel and 80% petroleum diesel.
Bioreactor Any device or system that supports a biologically active environment.
CHP Combined Heat and Power: The production of two useful forms of energy fromthe same process or source, usually heat and electricity. Also known asCogeneration.
CO2 The chemical symbol for carbon dioxide
CO2-e A factor known as the global warming potential which expresses the greenhouseeffect of various gases by use of carbon dioxide as a reference gas.
CSIRO Commonwealth Scientific and Industrial Research Organisation. An AustralianGovernment organisation.
CTL: Coal to Liquid: A process whereby coal is converted to liquid hydrocarbon fuel.
DAF Dissolved Air Flotation: A method of dissolving pressurised air into a liquid toform small bubbles that float a material to the surface.
DDGS: Distillers Dry Grain with Solubles: A by-product from the production of ethanol.DDGS is dried prior to sale as a high protein stock feed.
Denaturing: The process of adding toxic chemicals to ethanol to render it unsuitable forhuman consumption.
Diesel Engine: A type of internal combustion engine that burns fuel oil with the ignitionbrought about by heat resulting from air compression.
Digester A type of bioreactor in which anaerobic digestion takes place, typically used toproduce methane.
DWG: Distillers Wet Grain: A by-product from the production of ethanol. DWG is soldas a high value supplemental stock feed. DWG is known as DDGS when dried.
Spark IgnitionEngine:
A type of internal combustion engine where the fuel-air mixture is ignited withan electrically generated spark.
E5 A blend of 5% ethanol and 95% petrol. ‘E’ indicates Ethanol and the numberfollowing ‘E’ indicates the percentage ethanol blended with petrol e.g. E20 fuelcontains 20% ethanol and 80% petrol.
Energy Balance: DEFINE THIS
Energy Density: Ratio of the mass of an energy store to the amount of energy stored. Typical

RMIT Handbury Fellowship Program
Biofuels Feasibility Investigation
x | P a g e
units are Megajoules per kilogram (MJ/kg) for solid fuels, and Megajoules perLitre (MJ/L) for liquid fuels.
Germ: The inner embryo of a seed.
GTL: Gas to Liquid: A process whereby natural gas is converted to liquid hydrocarbonfuel.
Joule The international system unit of electrical, mechanical and thermal energy.
Lux: The metric unit of illuminance. 1 lux is equal to 1 lumen per square metre.
Megajoules (MJ): One megajoule of energy = one million joules.
Megalitres (ML): One megalitre = one million litres.
Pericarp: Plant tissue developed from the ovary wall of the flower that surrounds a seed.
Relocalisation A movement by communities toward local economies, food and energyproduction.
SVO: Straight Vegetable Oil. Any vegetable oil not chemically converted and used tofuel an internal combustion engine.
Synfuel: A synthetic liquid hydrocarbon fuel produced using Gas to Liquid or Coal toLiquid technology.
Tallow: Animal fat recovered during meat processing operations. Used by restaurantsand fast food outlets to for deep frying. Can also be used to produce biodieselwhen new or after it is no longer useful for cooking.
UCO: Used Cooking Oil. Also known as WVO. A waste product from the deep frying offood. Typically reclaimed from restaurants and fast food outlets and used in theproduction of biodiesel.
WVO: Waste Vegetable Oil. Also known as UCO. A waste product from the deepfrying of food. Typically reclaimed from restaurants and fast food outlets andused in the production of biodiesel.

RMIT Handbury Fellowship Program
Biofuels Feasibility Investigation
1 | P a g e
Summary

RMIT Handbury Fellowship Program
Biofuels Feasibility Investigation
2 | P a g e
1. IntroductionPopulation growth, global warming and peak oil are three immediate and urgent problems that are
impacting on the sustainability of human societies and their supporting environments around the
world. The need to rapidly decrease carbon emissions while simultaneously reducing our
dependence on fossil fuels and provide food for a rapidly growing population necessitates the
expeditious development of an alternative fuels industry in Australia. At the same time the
statement that ‘Food is Oil’ has never been more relevant when considering the scale of modern
agricultural systems. Church (2005) in the online journal ‘Energy Bulletin’ notes that, “Vast amounts
of oil and gas are used as raw materials and energy in the manufacture of fertilisers and pesticides,
and as cheap and readily available energy at all stages of food production: from planting, irrigation,
feeding and harvesting, through to processing, distribution and packaging. In addition, fossil fuels
are essential in the construction and the repair of equipment and infrastructure needed to facilitate
this industry, including farm machinery, processing facilities, storage, ships, trucks and roads. The
industrial food supply system is one of the biggest consumers of fossil fuels and one of the greatest
producers of greenhouse gases”.
With fuel and lubricants accounting for approximately 9% of the total cost of farming (ABARE, 2006)
any price rise is likely to significantly impact food production and economic viability. Around the
world research is underway into alternative energy sources for transport, vehicle and heavy
machinery. Although many may be feasible in the medium to long term, their use in the short term
is restricted by limited range, fuel availability, and high production costs. At the same time, under
the influence of reduced rainfall and increasing average temperatures, the Southern Grampians
region in western Victoria is rapidly becoming one of the most productive oil seed and grain growing
areas of Australia.
2. The Requirement for Alternative Agricultural FuelsGlobally the human population is predicted to grow from its current level of 6.77 billion (U.S. Census
Bureau, 2006) to 9.1 billion by 2050 (Zlotnik, 2005). Australia, with present numbers of 21.9 million
(ABS, 2009), will have a population of around 42.5 million people by 2056, which amounts to an
overall increase of one person every one minute and 24 seconds (ABS, 2009). Although Australia at
this time is able to export almost two thirds of its total agricultural output (DAFF, 2007) such rapid
population increase combined with climate change, water shortages and high oil prices pose a
significant threat to our short and long term national food security (Larsen, Ryan, & Abraham, 2008).
Furthermore, the food sector accounts for over 35% of employment in the Mallee, Western District
and Wimmera regions of Victoria (Larsen, Ryan, & Abraham, 2008) and as such any threat to
agricultural production in these areas will directly impact the towns that rely on and support food
growing operations. Larsen, Ryan and Abraham (2008) also note that, “The food sector is
particularly vulnerable to environmental constraints and to social concern and action in response to
environmental and resource constraints, a vulnerability that could undermine its future economic
contribution to the State. Most commonly, this vulnerability is expressed as concerns over energy
and water usage, pre and post farm-gate. These concerns have been further sharpened by flow-on
effects of water shortages, potential carbon costs and projections of climate change and oil
scarcity”.

RMIT Handbury Fellowship Program
Biofuels Feasibility Investigation
3 | P a g e
Much uncertainty surrounds how, where and when the impacts of climate change, resource
constraints and international or local emissions control policies will affect food production (Larsen,
Ryan, & Abraham, 2008). What is known is that the implications of oil scarcity and resulting price
increases are poorly understood, as oil underpins food production through on farm machinery use ,
agrochemical production, transport and long supply chains (Larsen, Ryan, & Abraham, 2008).
Any resource constraints will therefore require producers to adapt production methods and
techniques to account for the present foreseeable threats of increasing water scarcity, land
availability, oil shortages and agricultural inputs (N-P-K fertilisers) (Larsen, Ryan, & Abraham, 2008).
Prior to onset of the Global Financial Crisis in July 2007 (Wikipedia, 2009a) the international price of
oil increased by almost 400% in 5 years (Larsen, Ryan, & Abraham, 2008). These oil price increases
have had repercussions throughout the food chain and in combination with other input costs such as
water and the impacts of climate change, have resulted in an increase in food prices known by
economists as ‘agflation’ (Larsen, Ryan, & Abraham, 2008). A slowdown in production which is
outpaced by the demand for oil will result in fuel scarcity which could seriously jeopardise food
security in Victoria, Australia and the world (Larsen, Ryan, & Abraham, 2008). The rapid rise in oil
price that occurred between 2003 and 2008 is considered by many geologists and engineers in the
oil industry as evidence of the onset of ‘Peak Oil’ (ASPO, 2009).
2.1.Peak OilIn 1956 Dr M. Hubbert, a geophysicist working in the oil industry, proposed that the rate of
petroleum production follows a bell shaped curve as shown in Figure 1 (Kimble, 2009). From this
work Hubbert accurately predicted that oil production in the United States would peak in 1972, in
the North Sea in the late 1990s (actual peak occurred in 1999 (Kimble, 2009)) and in Australia around
the year 2000 (actual peak occurred in 2002 (Riddoch, 2004)). Using production data from around
the world Hubbert was then able to estimate that global oil production would peak early in the 21st
century (Deffeyes, 2005).
Figure 1. Global oil production depletion curve (Kimble, 2009)
Kenneth Deffeyes who worked closely with Hubbert, observes in his book “Beyond Oil: The View
from Hubbert’s Peak” (Deffeyes, 2005) that as global oil production peaks and begins a gradual but

RMIT Handbury Fellowship Program
Biofuels Feasibility Investigation
4 | P a g e
increasingly rapid decline, the cost of oil is likely to rise rapidly. Figure 2 charts the rise in the actual
price of oil, in today’s terms, from the time it was first discovered in 1861 to 2009. This chart clearly
shows the rise in price as a result of the first oil shock in the 1970s and the subsequent rise from
2003 to 2008.
Figure 2. The price of a barrel of oil since first discovery in 1861 to 2009 in today's dollars(Maidment, Puell, & Reifman, 2009).
The sharp rise in oil price in the 1970s occurred when the Organisation of Arab Petroleum Exporting
Countries (OAPEC) proclaimed an oil embargo in response to the United States decision to support
the Israeli military during the Yom Kippur war (Wikipedia, 2009b). The sharp price rises from 2003
onwards however, are considered by some to be independent of political influences and instead are
an indication of the peak in global production. Experts are divided as to the exact timing with some
stating that global production peaked in 2005 (Deffeyes, 2005) and others, including the
International Energy Agency, predicting that the peak will not occur until 2020 or later (Connor,
2009). What is not in dispute is that the recent price rises are primarily a result of demand
outstripping supply.
Although the price of oil has declined sharply due to the Global Financial Crisis the International
Energy Agency predicts that an “oil crunch” will occur within the next five years as the improving
global economy and subsequent rapid increase in demand combines with a stagnation, or even a
decline, in supply (Connor, 2009). At the Future Fuels Forum held in June 2008, Australia’s
Commonwealth Scientific and Industrial Research Organisation (CSIRO) presented the results of
economic modelling showing that, “If there is a near term peak in international oil production
resulting in declining future oil supplies, petrol prices could increase to between A$2 and A$8 per
litre by 2018 (CSIRO, 2008). The CSIRO (2008) also noted that, “There is likely to be only preparatory
responses by individuals and businesses in relation to the possible decline in oil supplies due to the
uncertainty surrounding such an event”. The report notes that petroleum fuel intensive activities
would be most vulnerable to an increase in the oil price and that early action to accelerate the
availability of non oil based alternative fuels is key to avoiding high social and economic impacts, and
that, “In the event of peak oil, price impacts were found (through modelling) to be twice as high in
scenarios where fuel and vehicle infrastructure was slow to respond (CSIRO, 2008).
RMIT Handbury Fellowship Program
Biofuels Feasibility Investigation
5 | P a g e
2.2.Climate ChangeThe Federal Government Department of Climate Change states on its website that, “Climate change
is one of the greatest economic, social and environmental challenges of our time” (Department of
Climate Change, 2009a). It notes that the consensus among the majority of climate scientists is that
human activity, through the burning of fossil fuels and land clearing, is altering the Earth’s climate
(Department of Climate Change, 2009a). It is widely accepted that global emissions are at or
exceeding the higher level profile projections proposed by the Intergovernmental Panel on Climate
Change(IPCC) (DSE, 2008). Of relevance to agriculture are the following impacts of climate change
on south western Victoria (DSE, 2008):
By the year 2030:
o Average annual temperatures will be around 0.8C warmer compared to
1990 temperatures;
o The number of hot days (days over 30C) are likely to increase;
o Total annual rainfall will decrease by 4% on 1990 levels;
o The intensity of heavy rainfall events will increase in most seasons;
o Evaporation will increase, and;
o Relative humidity will decrease.
By the year 2070:
o Average annual temperatures are expected to increase by 2.4C on 1990
temperatures;
o The number of hot days will increase significantly;
o Evaporation losses will increase significantly;
o Relative humidity will decrease significantly;
o Hamilton’s temperatures will resemble those of present day Horsham,
and;
o Hamilton’s annual rainfall will be similar to that of present day Ararat.
Until recently broad acre grain and oil seed cropping was not considered viable in western Victoria
south of the rural city of Horsham. With 81% of the Glenelg Hopkins region developed for
agriculture (DSE, 2008) recent prolonged dry periods have seen broad acre cropping replace more
traditional sheep, cattle and dairy farming. Under the climatic changes detailed by DSE (2008) it can
be expected that this trend will continue as agriculture north of Horsham becomes even more
marginal as a result of increased temperatures and reduced rainfall.
2.3.Carbon TradingWithout action to reduce anthropogenic carbon releases Australia is projected by 2020 to increase
its emissions by 120% on year 2000 levels (Figure 3) (Department of Climate Change, 2009b). To
meet the carbon emissions ‘abatement challenge’ the Federal Government has proposed to
introduce a Carbon Pollution Reduction Scheme (CPRS) which will result in a cap and trade market
for carbon (Department of Climate Change, 2009b). Initially only certain industries and economic
sectors will be required to purchase carbon credits to offset their annual emissions. Although
agriculture contributes approximately 16% of Australia’s greenhouse gas emissions (Figure 4), it will
be exempt from involvement in the CPRS until 2015, after which it will be required to act to reduce

RMIT Handbury Fellowship Program
Biofuels Feasibility Investigation
6 | P a g e
carbon emissions or purchase carbon credits to offset emissions (Department of Climate Change,
2009b).
Figure 3. Australia’s interim carbon emissions projections with and without abatement measures(Department of Climate Change, 2009b).
Figure 4. Year 2008 contributions of total net CO2-e emissions by sector (Department of Climate Change, 2009a).

RMIT Handbury Fellowship Program
Biofuels Feasibility Investigation
7 | P a g e
By sub-sector, excluding savannah burning, in 2008 carbon emissions from agriculture were divided
as shown in Figure 5.
Figure 5. Year 2008 sub-sector CO2-e emissions from agriculture (Department of Climate Change, 2009b).
Modelling has shown that from 2013 to 2020 emissions from agriculture are expected to increase
from 94 Million tonnes of Carbon Dioxide equivalent gases (Mt CO2-e) to 98 Mt CO2-e, an increase of
5% (Figure 6)(Department of Climate Change, 2009b). Note that in Figure 6 the difference between
the 2007 projection and the revised 2009 projection has been attributed to drought conditions
which occurred between these years (Department of Climate Change, 2009b). Although 9% of this
projected increase will be due to rising numbers of beef cattle (from enteric fermentation, manure
management and the affect of grazing on agricultural soils) as herd numbers recover from the
drought (Department of Climate Change, 2009b), all sub-sectors of agriculture will eventually incur
increased costs as a result of the CPRS.
Cattle73%
Sheep12%
Cropping15%
Agriculture Sub-Sector Emissions (2008)
Cattle
Sheep
Cropping

RMIT Handbury Fellowship Program
Biofuels Feasibility Investigation
8 | P a g e
Figure 6. Agricultural greenhouse gas emissions projections to 2020 (Department of Climate Change, 2009b).
The direct economic impact of the CPRS on the agricultural community is unknown as figures vary
widely among sources. A summary of a number of these reports has been assembled by the
National Farmers Federation (2009) who provide the following assessment of impacts in dollar
terms:
Assuming a carbon price of $25/tCO2-e average farm incomes are likely to
change as follows:
o Beef farms: 60% reduction in income;
o Beef - Sheep farms: 47% reduction in income;
o Sheep farms: 42% reduction in income;
o Dairy farms: 34% reduction in income;
o Mixed livestock-crop farms: 30% reduction in income.
If access to free carbon permits for agriculture is not allowed, with a carbon
price of $25/tCO2-e the following costs for permits are likely to be incurred:
o Beef producer with 1000 head of cattle: $37,000 per annum;
o Sheep producer with 3000 sheep: $15,000 per annum;
o Grain farmer producing 1,000 tonnes of grain per annum: $3,500.
The impacts of climate change and the reasons for the impending introduction of the CPRS are
generally well understood by the agricultural sector (NFF, 2009). It is therefore in farmers own
interest to undertake actions that reduce their overall impact on the environment, as in any future
carbon trading scheme both emissions and sequestration will be used to determine the level of
participation (Umbers, 2007).
Energy use makes up a significant proportion of the environmental and economic impacts of
farming, and along with the issues of peak oil and climate change there is an impending requirement
for alternative energy sources that are less carbon intensive and more cost effective than the
currently used petroleum fuels.
2.4.RelocalisationUncertainties surrounding issues of population growth, peak oil and climate change have given rise
to a trend known as relocalisation. Defined as a grass roots movement in which communities are
strengthening their local economies, food and energy production, relocalisation is recognised by the
Municipal Association of Victoria (MAV) as a way for local councils to become more sustainable,
adaptive and resilient in the face of significant change (Keady, Williams, & Marshall, 2008). The
relocalisation movement has arisen from the recognition that with globalisation communities and
individuals suffer diminished control over the fundamental resources and activities required to live a
healthy and sustainable life, particularly in relation to food production, energy resources and the
ability to reduce the environmental impact of these activities (Keady, Williams, & Marshall, 2008).
A number of Australian towns have taken the concept of relocalisation to another level by joining
the Transition Towns (TT) network. Communities who are part of the TT network are working to
‘future proof’ themselves against the impacts of both climate change and peak oil (ABC, 2009a). A
major part of the TT project is the development of an Energy Descent Action Plan (EDAP) which aims
to increase resilience to, and enable communities to thrive in a post carbon fuelled world (SEAC,

RMIT Handbury Fellowship Program
Biofuels Feasibility Investigation
9 | P a g e
2007). Currently 36 Australian towns have registered their interest in joining the TT network
(Transition Katoomba, Unknown) with the model already adopted by the towns listed below, most
of whom are now advanced in their development of EDAPs (ABC, 2009a):
Noosa (Qld);
Armidale (NSW);
Bell (Vic);
Bellingen (NSW);
Hervey Bay (Qld);
Katoomba (NSW), and
Wingecarribee (NSW).
It is agreed by a range of experts that in the medium term future the world will experience a
reduction in the energy available to maintain the standard of living that Australians have come to
expect. However, predicting the outcomes of such an event is difficult as a number of options and
technologies exist to supplement falling energy supplies. Some of these options are discussed
further in Section 5.
At the same time as the concept of relocalisation and transition towns gains ground in the region,
the Australian Government’s Grain Research and Development Corporation (GRDC) notes that crop
growing has become more prevalent in south western Victoria and that this trend is likely to
continue (Whiting, 2009). The GRDC also considers that there has and will be a continuing shift in
intensive livestock production and demand for feed grains to this region (GRDC, 2009). It can be
expected that the trend away from traditional grazing operations toward large scale cropping will
also require an increase in the volume of fuel needed to support this type of agriculture. The high
probability of medium term fuel shortages has the potential to dramatically stifle this agricultural
production and therefore planning for a change to alternative energy sources is urgently required.
Ideally any alternative agricultural fuel should be produced and distributed locally, thereby returning
control over energy security to the community and reinvigorating the local economy.
3. Alternative Energy Sources for AgricultureWith a significant risk of a rapid oil price rise in the short to medium term, high input broad acre
agriculture in south western Victoria will be vulnerable to agflation. A number of existing
technologies including Liquified Petroleum Gas, natural gas, hydrogen and biomass fuels such as
ethanol and biodiesel may provide interim fuel/energy sources to maintain food production during
the transition to the high tech farms of the future. A number of these alternatives also provide the
opportunity for the regional development of a biofuels industry, though the location of processing
facilities in rural areas to support the predicted future high demand for agricultural products (CSIRO,
2008).
Traditionally the lead time for bringing a new fuel to large scale commercial production can be
decades long (CSIRO, 2008). This time can be dramatically shortened by choosing a fuel that is
compatible with existing engines and refuelling infrastructure, and which can be readily made in
processing facilities that can be scaled to produce very small (1000 litres or less) to very large daily
outputs.

RMIT Handbury Fellowship Program
Biofuels Feasibility Investigation
10 | P a g e
3.1.Energy DensityA major consideration when choosing an alternative energy source for agricultural operations will be
the energy density of the fuel. Energy density is the ratio of the energy stored in a fuel to the mass
or volume of the fuel (Wikipedia, 2009g), and therefore the lower the energy density the more fuel
is required to do the equivalent work of a more energy dense fuel. For liquid or gas fuels energy
density is measured in megajoules per litre (MJ/L), and the higher the value the greater the energy
density. Table 1 provides details of the energy densities of existing agricultural and domestic fuels as
well as the alternative fuels discussed in this report.
Table 1. Energy densities of existing and alternative fuels (Wikipedia, 2009g).
Fuel Type Volumetric Energy Density
Petrol 32 - 34.8
Diesel 40.3
Liquified Petroleum Gas (LPG) 25.3
Natural Gas 0.0364
Compressed Natural Gas (CNG) 9.0
Liquified Natural Gas (LNG) 25.5 – 28.7
Hydrogen (liquefied) 8.5 – 10.1
Pyrolysis Oil 21.35
Ethanol 18.4 – 21.2
Biodiesel 33.3 – 35.7
3.2.Liquified Petroleum GasLiquified Petroleum Gas (LPG), a mixture of propane and butane (Elgas, 2009), gained some
popularity in the 1960s with big name companies such as International Harvester producing petrol
and LPG fuelled farm machinery (Updike, 2000). The popularity of LPG for farm use declined with
the widespread introduction of more powerful diesel engines and until recently LPG has been used
mainly in purpose built vehicles or cars that have been converted to switch between LPG and petrol.
Recent advances in technology allow LPG to be injected simultaneously with diesel fuel into an
engine to produce greater fuel efficiency and increased torque (Diesel Gas Technologies, 2005).
However, as LPG cannot be used on its own to fuel a diesel engine it may only be considered a diesel
fuel extender, with claims of up to 20% improvement in fuel efficiency (Diesel Gas Technologies,
2005).
For farm use LPG conversions require the fitting of costly gas cylinder and engine control systems,
and the installation of dedicated gas storage and electrically driven refuelling systems alongside
existing gravity feed on farm diesel storage tanks. LPG also has a 40% lower energy density than
diesel fuel (Wikipedia, 2009g), necessitating the storage of greater volumes and increased machinery
running costs due to the requirement to use more LPG to achieve the same outcomes, when
compared to diesel fuel. Although the costs of modifying existing diesel engines and the installation
of additional refuelling infrastructure are high, the main factor excluding LPG from consideration as
an alternative farm fuel is that it is derived from either oil or natural gas and is therefore non
renewable (Elgas, 2009) and subject to declining availability as proposed by the Peak Oil and Peak
Gas theories.

RMIT Handbury Fellowship Program
Biofuels Feasibility Investigation
11 | P a g e
3.3.Natural GasNatural gas, a non renewable by-product of oil extraction, was first used to power a vehicle in 1860
and according to the Natural Gas Vehicle Coalition there are now more than 8.7 million Natural Gas
Vehicles (NGVs) in use around the world (Natural Gas Supply Association, 2004). Most NGVs are
used in fleet operations where large daily distances are covered during which the vehicle returns a
number of times to a centralised refuelling station (Natural Gas Supply Association, 2004). It is for
reasons of limited range, high initial cost, lack of existing refuelling infrastructure in Australia and, if
a vehicle is retrofitted to run on natural gas, the requirement to install a large steel storage vessel
(Natural Gas Supply Association, 2004), that the use of natural gas to power agricultural machinery is
not currently considered viable. Although the diesel engines that power most existing farm
machinery can be readily converted to start on diesel fuel and then change to Compressed Natural
Gas (CNG) (known as dual fuel vehicles), modification can be costly (Natural Gas Supply Association,
2004). In Australia farms are often located far from natural gas pipelines and, due to the
significantly reduced operating duration of CNG machinery (Natural Gas Supply Association, 2004) as
a result of the low energy density of natural gas, large volume storage and refuelling facilities would
be required on each farm.
Another form of highly compressed natural gas known as Liquified Natural Gas (LNG) can also be
used to fuel diesel engines, however to produce LNG the gas must be cooled to minus 162 degrees
Celsius, necessitating specialised safety, storage, transport and refuelling facilities (California Energy
Commission, 2002).
As a non renewable resource, and like oil, the extraction of natural gas will reach a peak in
production and then undergo a steepening decline. A number of researchers claim that global
supplies of natural gas will peak within several decades (Romm, 2004) with estimates ranging from
as early as 2020 (Bentley, 2002) out to 2030(EIA, 2009). As such, even if it was economically viable
to convert existing machinery stock to CNG or LNG, or to manufacture machinery to run specifically
on these fuels, this option will only provide a medium term solution for the future fuelling of
agriculture.
3.4.HydrogenWith growing concern about greenhouse gas pollution and the need to limit the impacts of climate
change many politicians view hydrogen as the ‘clean and green’ fuel of the future. The reality is that
the transition to a ‘hydrogen economy’ is many years away, and even if an intense research and
manufacturing effort was started today it is likely that a hydrogen fuelled society would not be
realised until 2050 (Romm, 2004). This is because hydrogen is not considered to be an energy
source but rather an energy carrier as large amounts of energy are required to produce it
(Wikipedia, 2009j). Although it is technically possible to produce hydrogen from renewable
resources it is not currently economically viable to do so, and as a result hydrogen is produced from
non renewable fossil fuels in a process that generates significant quantities of greenhouse gas
(Romm, 2004). Romm (2004) notes that fuelling agricultural machinery, heavy transport and
domestic vehicles with hydrogen made from fossil fuel sources such as natural gas makes no sense
economically or environmentally. A statement confirmed by the United States government when
under the Obama administration, in May 2009 it cut off funding for the development of hydrogen
fuel cell vehicles (but still funds research into stationary fuel cells), as it was deemed that other

RMIT Handbury Fellowship Program
Biofuels Feasibility Investigation
12 | P a g e
vehicle technologies will lead to faster GHG emissions reductions in a shorter time (Wikipedia,
2009k).
When an environmentally and economically sound method of producing hydrogen is developed
there will be a number of ways to use it to power agricultural machinery. Two of the most common
methods are through burning in a modified Internal Combustion Engine (ICE), or alternatively by
using it in fuel cells to produce electrical energy which can then be used to drive electric motors.
3.4.1. Hydrogen Fuelled Internal Combustion Engines
Hydrogen can be used to fuel modified internal combustion engines in the same way that petrol
fuels many existing engines. As a combustion engine fuel though, hydrogen has a number of
significant drawbacks including:
Low Energy Density: As shown in Table 1, liquefied hydrogen has an energy
density of approximately one quarter that of petroleum diesel. This low energy
density necessitates the storage of large volumes of hydrogen to obtain any
practical duration from equipment powered by spark ignition ICEs.
High Auto-Ignition Temperature: Hydrogen cannot be used directly in a diesel
engine as its high autoignition temperature will result in premature ignition
during the compression cycle (College of the Desert, 2001).
To overcome the problems encountered when using hydrogen to fuel internal combustion engines a
great deal of research is underway to develop cheap and powerful fuel cells.
3.4.2. Hydrogen Fuel Cells
A fuel cell is an electrochemical converter that produces electricity from a fuel and an oxidant which
react in the presence of an electrolyte (Wikipedia, 2009k). Although similar to batteries which store
electricity, fuel cells have no moving parts and produce electricity as long as there is enough fuel and
oxidant to enable it to do so (Figure 7) (FCIA, 2003).
Figure 7. The conceptual operation of a fuel cell (FCIA, 2003).
By electrochemically combining the fuel and oxidant without burning, fuel cells overcome many of
the inefficiencies and pollution of more traditional power systems (FCIA, 2003). An advantage of
fuel cells is that they can also operate on many different combinations of fuels including hydrogen,
hydrocarbons and alcohols, and oxidants including atmospheric oxygen, chlorine and chlorine
dioxide (Wikipedia, 2009k).

RMIT Handbury Fellowship Program
Biofuels Feasibility Investigation
13 | P a g e
Despite these advantages there are still some significant technological hurdles to overcome before
fuel cells in vehicles and machinery become common place. Hydrogen fuel cells are very expensive
to produce and they are inherently fragile (Wikipedia, 2009j). Current generation fuel cells have
problems operating at temperatures below 0C and have short service lives. In spite of these
drawbacks, the agricultural machinery manufacturer New Holland have developed a prototype
tractor (the New Holland NH2) that uses hydrogen fuel cells to power its electric motors
(Korzeniewsk, 2009). The previously discussed low energy density of hydrogen and the fact that it is
not readily storable (Romm, 2004) is a significant disadvantage for the NH2 which has a short range,
a two hour operating duration and very high initial purchase cost (Korzeniewsk, 2009). Despite
these disadvantages New Holland are continuing with the development of the NH2 and have also
developed the Energy Independent Farm concept in which they envisage that customers will
eventually produce their own hydrogen fuel from water using electricity generated from on-farm
sources, or from methane by burning crop material and animal wastes (Saunders, 2009).
Unfortunately the current state of technology precludes that, barring an early technological
breakthrough, hydrogen is unlikely to gain widespread use in the short to medium term future.
3.5.Battery Electric VehiclesElectricity has been used as an energy source for agriculture since the late 1800s when French
engineers developed an electrically driven cable plowing system (Clark, 1962), and in the early
1900s, prior to the development of light and powerful internal combustion engines, electric vehicles
were commonplace (Wikipedia, 2009c). Although electric motors can be up to 95% efficient and are
able to produce full torque over a wide RPM range (Machine Design, 2009), making them ideal for
use in agricultural machinery, battery technology has not yet developed to the point where it can
provide the range/duration and rapid recharge required. The problem of recharge rate may
eventually be overcome with the use of fuel cells however as discussed in Section 3.4.2, range and
high initial purchase cost are just two of the major factors preventing their manufacture and use.
3.6.ConclusionAlternative fuel sources that will enable the level of agricultural production to be maintained or
increased into the future must possess a number of important qualities which make them
compatible with the existing machinery stock. As the vast majority of farm machines are powered
by diesel engines the primary characteristic of any fuel must be compatibility with these engines,
preferably without major and costly modifications. A second but very important characteristic is
that the fuel must have an energy density high enough to give farm machinery an endurance or
range close to that currently provided by petroleum diesel. Thirdly, the fuel must be readily
transported and stored on farm without the requirement for new and expensive infrastructure
upgrades.
At this stage in their development none of the alternatives discussed above meet these
requirements. Biomass fuels on the other hand have the potential to meet more than just the
primary requirements of engine compatibility and energy density, they also offer the possibility of
creating new regional industries and enabling farmers to have more control over their own energy
future.

RMIT Handbury Fellowship Program
Biofuels Feasibility Investigation
14 | P a g e
4. BiomassBiomass is a renewable energy source derived from living or recently living organisms such as food
crops, crop stubble, wood waste or forest residues (Wikipedia, 2009d), and can be used to produce a
range of renewable energy sources through processes such as thermal, chemical and biochemical
conversion (Wikipedia, 2009d). Biomass fuels have a number of important properties which meet
the requirements for an environmentally sustainable energy source while increasing agricultural fuel
security and empowering rural communities through responsibility for their own energy production.
In any discussion on biomass fuels though, careful consideration must be given to the life cycle
impacts of production on food security and biodiversity loss.
4.1.Biofuel, Food and Biodiversity LossWith the push to develop alternative fuels has come concern that diverting agricultural production
from food provision will drive up the cost of food, affecting some the worlds poorest people (CSIRO,
2008). In the early 1990s the United States produced an average of 1 billion gallons of ethanol per
year (Fortenbery & Park, 2008). Production has since increased to more than 11 billion gallons and
in 2008 is estimated to have consumed 25% of the U.S. domestic corn crop as a feedstock (AgMRC,
2009). Corn prices have risen by 225% since January 2002, in line with increasing ethanol production
(AgMRC, 2009), creating an ethical and moral dilemma as people have to compete with cars for
food. An extreme example of this might occur if the United States was to convert all of its 179
million hectares of arable land to biofuel production, in which case it may be able to meet current
energy requirements but would not be able to grow any food at all (Astyk, 2006).
To compensate for the loss of food production large areas of forest and rainforest have since been
cleared to grow more feedstock for biofuels, not only in the United States, but also in Brazil and
Southeast Asia. In many cases the clearing of land for growing biofuels has further exacerbated local
and global environmental problems such as water depletion, desertification and increases in
atmospheric carbon while further decreasing the ability of local people to afford the rising cost of
food (Astyk, 2006).
Despite the negative issues of rising food cost and widespread land clearing there is still likely to be a
requirement for the production of biofuels (Astyk, 2006) if only to keep agriculture operating during
the transition period from petroleum to hydrogen or electric alternatives.
4.2.Biofuel Carbon EmissionsWhen looking at the issue of fuels for agriculture an important consideration must be the life cycle
carbon emissions of the available alternatives. In most cases there is still a requirement for some
fossil fuel component in the production of biomass fuels, and it is this component which plays a
major role in determining whether the fuel is a greater or lesser emitter of carbon than existing
petroleum fuels. Proponents claim that an advantage of the biofuel carbon cycle is that all of the
carbon released during combustion of the fuel, can be taken up by the growing of the next
generation of feedstock plants, as shown in Figure 8 (Tickell, 2003). Although this can be the case,
soil disturbance often results in the release of carbon dioxide and nitrous oxide, the latter of which is
a potent greenhouse gas (Umbers, 2007) and which therefore must also be included in the life cycle
analysis.

RMIT Handbury Fellowship Program
Biofuels Feasibility Investigation
15 | P a g e
Figure 8. The biofuels carbon cycle (Tickell, 2003).
No-till cropping and the retention of crop stubble can reduce soil carbon emissions and even act to
increase soil carbon (Umbers, 2007). If biofuels are to be a viable replacement for fossil fuels these
techniques, among others, must be adopted to reduce the life cycle emissions of biofuels to levels
well below those of fossil fuels.
4.3.PyrolysisBiomass can be used to power farm machinery by burning in a low oxygen environment (pyrolysis)
to produce a synthetic gas (syngas) which itself is used to fuel tractors, headers etc (Flannery, 2008).
The primary by-product of pyrolysis is bio-char which can be returned to the soil to sequester carbon
and possibly improve fertility (Flannery, 2008). Powering farm machinery on the by-products of
pyrolysis would require major modifications to existing equipment or the purchase of all new
machinery as the technology becomes available (Flannery, 2008). Both of these options are costly
and not yet commercially feasible due to cost, range and duration problems.
4.4.EthanolEthyl alcohol or ethanol is used mainly as an alternative fuel, or blended with petrol for use in spark
ignition engines. When produced from common crops and crop residues ethanol is considered to be
a renewable energy source provided that all minerals required for growth, such as nitrogen and
phosphorous are returned to the land (Wikipedia, 2009e). Some of the feedstocks from which
ethanol can be produced (Wikipedia, 2009e), most of which can be readily grown in western
Victoria, include sorghum, barley, potatoes, sunflower, corn, wheat, cellulose waste and harvest
waste.
4.4.1. Ethanol Production Processes
Ethanol production requires the use of a variety of processes including fermentation, distillation and
dehydration (Figure 9) (DBRL, 2009) . On completion of the production process denaturing of the is
carried to make the ethanol unpalatable for human consumption. Production methods can be
further grouped into first and second generation processes the latter of which are still under
development and use either enzymes or yeast to convert plant cellulose into ethanol, or pyrolysis to
produce a bio-oil or syngas from which ethanol can then be recovered (Wikipedia, 2009e). Second

RMIT Handbury Fellowship Program
Biofuels Feasibility Investigation
16 | P a g e
generation processes make much more efficient use of the feedstock while using much less energy
to produce a greater volume of fuel (Wikipedia, 2009e).
Figure 9. A typical first generation ethanol production process as used by the Dalby Bio-Refinery in Queensland(DBRL, 2009).
4.4.2. Ethanol Energy Balance
The efficiency of the production process is described by the concept of ‘energy balance’, which is the
ratio of the energy output of ethanol to the fossil fuel energy input required to produce the ethanol
(Algenol Biofuels, 2009). Significant controversy exists as to the viability of ethanol production from
an energy balance point of view with some claiming that more energy is required to produce ethanol
than it yields as a fuel, while others claim that ethanol produces significantly more energy than is
required to produce it. For example, renowned ecologist David Pimental calculates that ethanol
production from corn, switchgrass or wood can require up to 57% more fossil energy than it
produces, once all fertiliser, crop production and transport costs are taken into account (Pimental &
Patzek, March 2005). During their research Pimental and Patzek (2005) noted that many claims that
ethanol production provides a positive energy return are only possible if a number of production
inputs are omitted. Presenting an opposing view, Grant, Beer, Campbell and Batten (2008) in their
report, Life Cycle Assessment of Environmental Outcomes and Greenhouse Gas Emissions from
Biofuels Production in Western Australia, show that the energy balance for ethanol production from
wheat is around 9.7 (9.7 times more energy than required for production) and can be as high as 20.3
when all energy offsets are taken into account.
4.4.3. Ethanol Production By-Products
The first generation ethanol plants commonly found in use around the world use either the wet
milling or dry milling process (Wikipedia, 2009e). Wet milling refers to a procedure used to separate
the pericarp, germ and protein from the starch prior to fermentation into ethanol (Wikipedia,
2009h). Wet mill facilities can produce a range of high value by-products e.g. if corn is used as the
feedstock these include (DAF, 2006):
Corn gluten meal: Used as a high protein animal feed supplement or natural
herbicide;

RMIT Handbury Fellowship Program
Biofuels Feasibility Investigation
17 | P a g e
Corn gluten feed: Used as an animal feed;
Corn germ meal: Used in a variety of processed human and animal foods;
Corn starch: Used in a large variety of human food products;
Corn oil: Used as a high value cooking oil, and
Corn syrup and high fructose corn syrups: Used as sweeteners, humectants and
bodying agents in processed human food products.
Although the by-products of ethanol production using the wet milling process are of high value,
thereby reducing the overall cost of production, wet mill plants cost substantially more to build and
have ongoing high operating costs (DAF, 2006). The result of this is that the majority of existing
ethanol plants in the U.S. and Australia use the dry milling process (DAF, 2006).
Dry milling ethanol production plants are cheaper to build and operate, and produce only two main
by-products: Distiller Dry Grain with Solubles (DDGS) and carbon dioxide (DAF, 2006). DDGS can be
sold as a high protein livestock feed supplement, or, if they are not dried and instead sold wet they
are known as Distillers Wet Grain (DWG) (DAF, 2006). DDGS can be stored for periods greater than
12 months, however it is more expensive to produce as the drying process consumes large amounts
of energy (DAF, 2006). Alternatively, DWG must be used within four to five days of production and is
costly to transport as up to 70% of its weight consists of water, making the transport of DWG
economically viable only within a 200km radius of the production facility (DAF, 2006).
Carbon dioxide as a by-product of ethanol production can be captured and sold for use in
carbonated beverages and the manufacture of dry ice (Wikipedia, 2009h). In most cases carbon
dioxide from the fermentation process is released to the atmosphere as the profitability of
marketing and capture are very low (DAF, 2006).
4.4.4. Carbon Emissions From Ethanol Production and Use
The standard method used to determine the greenhouse gas (GHG) benefits of a biomass derived
fuel is to compare its life cycle emissions with the fossil fuel carbon emissions that the biofuel will
replace (Grant, Beer, Campbell, & Batten, 2008). Generally researchers agree that lifecycle
emissions depend on the means of production, and that the largest determinant of emissions is the
energy source used during the production process. This is evident in Figure 10 which provides an
example of the CO2-e emissions from corn based ethanol production in the United States (Wang,
Wu, & Huo, 2007). In the Australian state of New South Wales the government plans to mandate
that all petrol be blended with 10% ethanol (E10) by 2011 on the grounds that E10 fuel has positive
greenhouse benefits (Keane, 2009). This would require the construction of four new ethanol plants
powered by coal fired electricity, the combined effect of which will increase the states GHG
emissions by 1.5% (Keane, 2009).
Alternatively, an Australian study by Grant, Beer, Campbell, & Batten (2008) concluded that for one
particular ethanol plant, using wheat as a feedstock, planned for Western Australia, the greenhouse
benefit gained from the burning of ethanol waste products are more than the savings generated
from the ethanol production itself i.e. this particular plant could be considered to be an electricity
generator producing ethanol and fertilisers as co-products (Grant, Beer, Campbell, & Batten, 2008).
The primary reason for the positive emissions benefit in this example occurs because the majority of
electricity produced in Western Australia is generated by the burning of coal which produces more

RMIT Handbury Fellowship Program
Biofuels Feasibility Investigation
18 | P a g e
CO2-e emissions than the burning of crop waste (Grant, Beer, Campbell, & Batten, 2008). Figure 11
illustrates the individual and net carbon emissions benefits to be gained by the establishment of this
particular biorefinery in Western Australia.
Figure 10. Life cycle greenhouse gas emissions from different ethanol production methods .
Figure 11. Predicted carbon emissions savings from the establishment of a biorefinery in Western Australia. Note thatone Gigagram (Gg) equals one thousand tonnes (Grant, Beer, Campbell, & Batten, 2008).
RMIT Handbury Fellowship Program
Biofuels Feasibility Investigation
19 | P a g e
From the available information, and with the impending introduction of GHG reduction schemes
around the world, to be economically viable any new ethanol plant must adopt processes that
minimises carbon emissions.
4.4.5. Ethanol Production in Australia
In 2009 there were three production plants producing ethanol for the biofuels market in Australia:
the Sarina Distillery in Central Queensland (38ML/year), the Dalby Bio-Refinery in Southern
Queensland (80ML/year), and the Manildra Ethanol Plant in coastal New South Wales (125ML/year)
(BAA, 2009). Of these both the Dalby and Manildra plants are producing ethanol from grain (BAA,
2009). The West Australian Department of Agriculture and Food (DAF) found in its 2006 report,
Ethanol Production From Grain, that, “It is possible for ethanol production to be profitable in
Western Australia with or without Government assistance” (DAF, 2006). On this basis it is
reasonable to assume that ethanol production can also be profitable in western Victoria, however a
number of significant barriers to its uptake still exist:
1. High upfront capital costs: Ethanol plants are large due the nature of the
process and the requirement for economies of scale, and as such require
significant upfront establishment capital. The Dalby Bio-Refinery 40ML/year
facility cost A$54 million to construct (DAF, 2006).
2. Requirement for large volumes of water during processing: Ethanol production
from grain requires access to significant volumes of high quality fresh water.
4.4.6. Water Use During Ethanol Production
A major concern with the use of ethanol as an alternative fuel is that large volumes of water are
required during the production process, typically in the order of 15 litres of water for every litre of
ethanol produced (Keeney & Muller, 2006). Although much of this water can be recycled in the
processing plant the volume of ethanol fuel required to maintain agricultural production (assuming a
100% transition to ethanol and ethanol capable farm machinery) would still require significant
volumes of ‘new’ water. In the drying climate of eastern Australia this fact alone may delay the
establishment of local ethanol production until more water efficient processes can be found. One
solution to this problem may be the use of algae for ethanol production.
4.4.7. Ethanol From Algae
Recent technological developments have proven that ethanol can be readily produced from algae.
The process developed by US company Algenol is claimed to be capable of producing 227,000 litres
of ethanol per acre per year without destroying the metabolically enhanced algae in the process
(Algenol Biofuels, 2009). Furthermore the algae is grown in saltwater ponds or bags using sunlight
as the primary energy source, giving an energy balance of better than 8:1 (Algenol Biofuels, 2009),
and negating any need to take arable land out of food production to produce renewable fuel. As the
process is still in the early commercialisation stage little information is available as to its applicability
under the climatic conditions experienced in western Victoria.
4.4.8. Engine Requirements for Ethanol Use
Ethanol has traditionally been used as a spark ignition combustion engine fuel for passenger
vehicles, with Brazil recognised as a world leader its use since 1976 (Wikipedia, 2009f). In 2003 the
Brazilian parliament mandated the use of a minimum 25% of ethanol blended with 75% petrol

RMIT Handbury Fellowship Program
Biofuels Feasibility Investigation
20 | P a g e
(known as E25) to be used in all light vehicles, however many vehicle manufacturers now produce
cars capable of running on 100% ethanol or E100 fuel (Wikipedia, 2009f).
Two of the major drawbacks for the use of ethanol as a transition fuel for farm machinery are its low
energy density (see Table 1), requiring the use of larger volumes of fuel, and its incompatibility with
existing diesel engines. If farmers were willing and financially able to replace existing machinery a
number of manufacturers build modified heavy duty engines that can run on a range of ethanol-
diesel blends (Cornell, 2008). Engine and heavy transport vehicle manufacturer Scania for example,
markets a compression ignition engine capable of running on 100% ethanol or 100% biodiesel
(Cornell, 2008). With the ability to run E100 fuel though comes a requirement to increase fuel tank
size by 65% to 75% to account for the reduced energy density of ethanol (Cornell, 2008).
At temperatures below 11 Celsius pure ethanol fuel cannot achieve enough vapour pressure to
initiate a spark (Wikipedia, 2009e). To overcome this issue ethanol is blended with petrol in ratios
ranging from 85% ethanol – 15% petrol (E85 fuel) in mildly cold areas down to 70% ethanol – 30%
petrol (E70 fuel) in extremely cold environments (Wikipedia, 2009e). To address this issue in diesel
engines designed to use ethanol fuel a blend known as ED95 can be used. ED95 consists of 93.6%
ethanol, 3.6% ignition improver and 2.8% denaturants (Wikipedia, 2009e).
4.5.DiesoholDiesohol is defined by the Australian Fuel Quality Standards Regulations 2001 as a blend of diesel
and alcohol, where the alcohol can be methanol, ethanol or mixtures of both (Beer, et al., 2000).
APACE Research, an Australian company based in Dungog N.S.W, have successfully blended alcohol
with diesel by the addition of a patented emulsifier (Beer, et al., 2000). APACE claims that the
diesohol emulsion of 30% alcohol and 70% petroleum diesel can be run in existing engines without
modifications (Beer, et al., 2000). During emissions testing the New South Wales Office of Energy
found that 15% ethanol-diesel blend achieved the ‘lowest greenhouse gas index’ in the Australian
1992 Energy Challenge (Beer, et al., 2000). As such, from an environmental standpoint diesohol,
which is also known as E-diesel, M-diesel or Oxy-diesel (DEWHA, 2009) has some advantages,
although it has yet to be used on a commercial basis.
4.6.Vegetable Oils and Animal FatsOn the 10th of August 1893 Rudolf Diesel’s compression ignition engine, fuelled by peanut oil, ran
under its own power for the first time (Wikipedia, 2009i). With great prescience Diesel said during a
speech in 1912 that, “The use of vegetable oils for engine fuels may seem insignificant today but
such oils may become, in the course of time, as important as the petroleum and coal-tar products of
present time” (Wikipedia, 2009i). Although many modern diesel engines can be run on Straight
Vegetable Oil (SVO), and also animal fats, modification of the engine fuel system is required (Tickell,
2003). In particular, due to the high viscosity at low or even ambient temperature of vegetable oils
and animal fats, a system that allows start up and shut down using petroleum or biodiesel, switching
between petroleum and SVO, and preheating of the oil prior to injection into the engine is essential
(Tickell, 2003). Some of the advantages of using straight vegetable oil or animal fats for fuel include
(Steinman, 2005):
Fuel Compatibility: After modification the engine can still be run on 100% petroleum
diesel if the operator so chooses;

RMIT Handbury Fellowship Program
Biofuels Feasibility Investigation
21 | P a g e
Lubrication: SVO has much greater lubrication than low sulphur diesel, reducing wear
and prolonging engine life;
High Energy Content: The high energy content of SVO and animal fats allows engines to
be run with little or no power loss and little or no change in fuel consumption;
High Flashpoint Temperature: The high ignition temperature of SVO and animal fats
provides greater safety in storage and handling, and;
Reduced Emissions Pollution: Emissions from vehicles using SVO fuel have lower
sulphur, unburnt hydrocarbons, carbon monoxide, carbon dioxide and particulate
emissions.
A number of disadvantages of using SVO are (Steinman, 2005):
Fuel System Modification: As previously discussed, due to the high viscosity of SVO,
modification of the fuel system to allow start up and shut down on petroleum or
biodiesel is required. Further information can be found in Table 4 (Section 4.7.1) which
provides a comparison of viscosity and other properties of canola oil and petroleum
diesel;
Additional Fuel Tank: A second fuel tank must be fitted to the vehicle to store SVO;
Fuel Pump and Injector Damage: If the oil is not hot enough to maintain sufficiently low
viscosity damage to the fuel pump and injector pump may occur. This can be evident as
fouling with carbon deposits (coke) collecting on the injectors. Poor fuel dispersal from
the injectors may lead to premature wear and failure of pistons and cylinders.
The necessity of converting an engine and the inherent disadvantages of running it on SVO or animal
fats can be overcome through chemical modification of the oil to produce biodiesel.
4.7.BiodieselAlthough any vegetable oil can be classified as a biofuel, it must be subjected to a specific chemical
process to convert it to biodiesel (Wikipedia, 2009i). The list of vegetable oil sources (Table 2) from
which biodiesel can be made is extensive (Whittington, 2006) and includes a number of crops that
can be readily grown in the soils and climate of south west Victoria (Table 3).
Table 2. Crops suitable for oil extraction and biodiesel production (Whittington, 2006).
Oil Source Percent Oil Content
Apricot Kernels 42%
Borrage 34%
Brazil Nuts 63%
Camelina 41%
Copra 65%
Corn Germs 50%
Evening Primrose 25%
Grapes 12%
Groundnut (with shell) 47%
Hemp 34%
Jojoba 50%
Karite / Shea Nut 39%
Linseed 38%
Mustard Seed 35%
Neem Nuts 47%

RMIT Handbury Fellowship Program
Biofuels Feasibility Investigation
22 | P a g e
Oil Source Percent Oil Content
Apricot Kernels 42%
Niger Seed 40%
Palm Kernels 45%
Paprika Kernels 25%
Peach Kernels 40%
Poppy 45%
Potatoe Waste (fried) 40%
Rape Seed / Canola 42%
Safflower 35%
Sesame 50%
Soybeans 19%
Sunflower Seed 42%
Table 3. Oil seed crops suitable for biodiesel production in western Victoria.
Crop Oil Production (Litres/Hectare)
Rapeseed 320 to 360 L/Ha
Mustard Seed 230 to 350 L/Ha
Patterson’s Curse Unknown
Algae 9,000 to 18,000 L/Ha
Ref: (NREL, 2007) – Convert to metric and insert associated text.
Biodiesel can also be produced from Waste Vegetable Oil (WVO) and tallow used in restaurants and
fast food cooking (Tickell, 2003), and from oil pressed from algae (Campbell, Beer, & Batten, 2009).
The main advantage of biodiesel over other alternatives is that it shares many of the beneficial
characteristics of petroleum diesel.

RMIT Handbury Fellowship Program
Biofuels Feasibility Investigation
23 | P a g e
4.7.1. Biodiesel Comparison with Petroleum Diesel
To become accepted as an alternative agricultural fuel not only must biodiesel be suitable for use in
existing diesel engines, it must also have similar combustion properties to those of petroleum diesel.
Table 4 provides a comparison of values for a number of important properties of petroleum diesel,
canola oil and biodiesel.
Table 4. A comparison of a number of important properties of petroleum diesel, pure canola oil and biodiesel (Beer, etal., 2000).
Property Diesel Canola Biodiesel
Density (kg/L) 0.835 0.922 0.88
Gross Calorific value (MJ/L) 38.3 36.9 33.3
Viscosity (mm2/[email protected]) 3.86 37 4.7
C:H:O ratio (by mass) 86:14:0 78:10:12 57:9:8
Sulphur (%) 0.15 0.0012 <0.01
As can be seen from Table 4, biodiesel has similar density and calorific values to petroleum diesel.
The slightly lower Gross Calorific Value can result in an increase of up to 10% in fuel consumption
although many users of biodiesel do not consider this to be noticeable or significant (Tickell, 2003).
A slightly higher viscosity value for biodiesel can cause fuel flow problems at low ambient
temperatures, an issue which is further discussed in Section 4.7.3.
An advantage of biodiesel is that, as opposed to petroleum diesel, the molecule contains oxygen
which results in cleaner burning with fewer particulate emissions, a characteristic which can have
significant impacts on human health and which is further discussed in the following Sections (1 and
4.7.3) on the advantages and disadvantages of using biodiesel.
4.7.2. Biodiesel Advantages
Similar properties to petroleum diesel provide the following advantages when using biodiesel (Beer,
et al., 2000):
Engine Compatibility: Biodiesel can be used in most existing diesel engines
without modification (for more information see Section 4.7.12)
Fuel Consumption: is similar to that for petroleum diesel. A maximum 10%
increase in fuel consumption may be experienced by some users;
Engine Power and Torque: Biodiesel provides similar engine power and torque
outputs from an engine when compared to that of petroleum diesel;
Blending With Petroleum Diesel: Biodiesel can be readily blended in any ratio
with petroleum diesel, without the need for admixtures.
Further advantages of using biodiesel include:
Lubricity: Biodiesel provides high levels of lubrication when compared to low
sulphur diesel, reducing wear and prolonging engine life (Tickell, 2003);
Low Toxicity: Biodiesel is less toxic than table salt (Beer, et al., 2000) and is
therefore highly suited to use in marine and other sensitive environments
(Whittington, 2006);

RMIT Handbury Fellowship Program
Biofuels Feasibility Investigation
24 | P a g e
Biodegrability: Biodiesel degrades approximately four times faster than
petroleum diesel i.e. 85% to 88% degradation in water (Tickell, 2003). Biodiesel
blends also accelerate the degradation of the petroleum diesel component of
the fuel (Whittington, 2006);
Reduced Sulphur Content: Sulphur in the form of sulphates and oxides emitted
from diesel vehicle exhaust pose a significant risk to human health, and are a
major contributor to the formation of smog and acid rain (National Biodiesel
Board, 1998). B100 fuel contains no sulphur, completely eliminating these
compounds from the exhaust gases (National Biodiesel Board, 1998);
Reduced Tailpipe Particulate Emissions: Particulate emissions from petroleum
diesel are a significant human health issue. The combined oxygen in the
biodiesel molecule increases burning efficiency resulting in significantly reduced
particulate emissions (Beer, et al., 2000). Figure 12 illustrates the carcinogenic
nature of diesel exhaust particulate emissions with Figure 13 clearly showing the
long term effect of these emissions on human health in urban areas (Kearney,
2006).
Figure 12. Petroleum diesel emission particle constituents (source:http://www.catf.us/publications/reports/Diesel_Health_in_America.pdf).
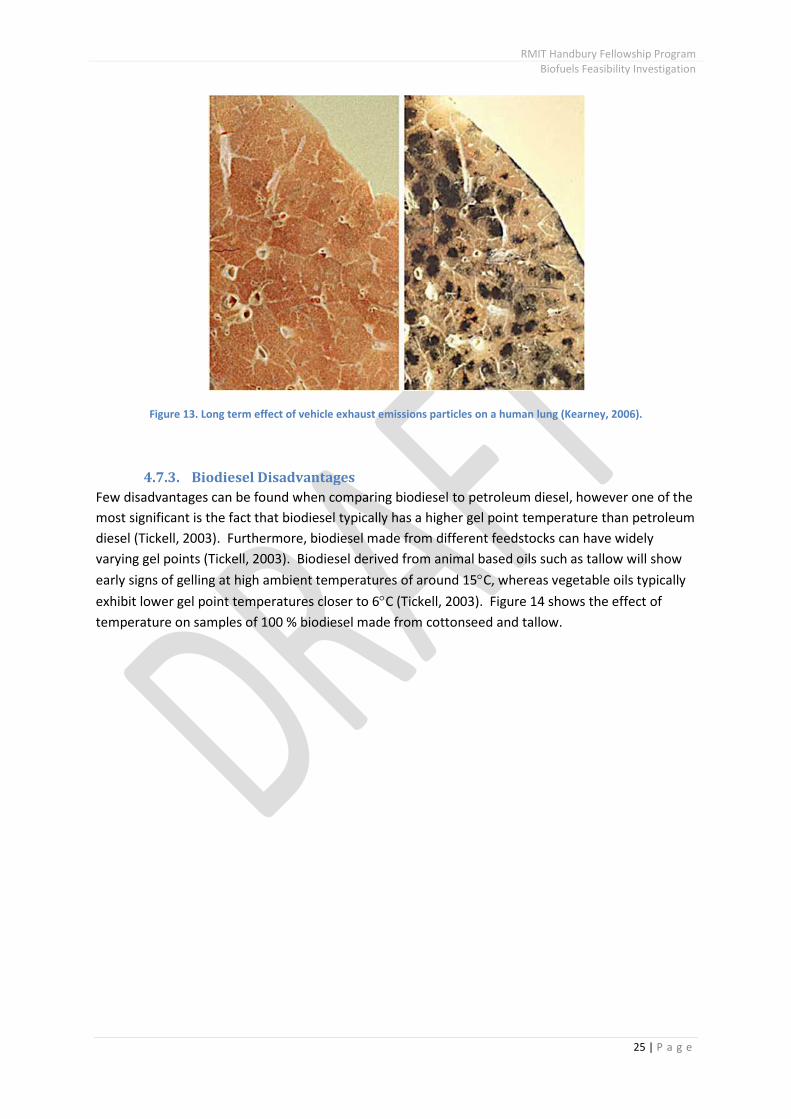
RMIT Handbury Fellowship Program
Biofuels Feasibility Investigation
25 | P a g e
Figure 13. Long term effect of vehicle exhaust emissions particles on a human lung (Kearney, 2006).
4.7.3. Biodiesel Disadvantages
Few disadvantages can be found when comparing biodiesel to petroleum diesel, however one of the
most significant is the fact that biodiesel typically has a higher gel point temperature than petroleum
diesel (Tickell, 2003). Furthermore, biodiesel made from different feedstocks can have widely
varying gel points (Tickell, 2003). Biodiesel derived from animal based oils such as tallow will show
early signs of gelling at high ambient temperatures of around 15C, whereas vegetable oils typically
exhibit lower gel point temperatures closer to 6C (Tickell, 2003). Figure 14 shows the effect of
temperature on samples of 100 % biodiesel made from cottonseed and tallow.

RMIT Handbury Fellowship Program
Biofuels Feasibility Investigation
26 | P a g e
Cottonseed biodiesel at 22C Cottonseed biodiesel at 5.3C Tallow biodiesel at 12.2CFigure 14. Gel point comparison of 100% biodiesel (B100) made from cottonseed oil and tallow.
Low temperature gelling can be overcome by blending biodiesel with petroleum diesel (Figure 15).
The lower the ambient temperature the greater the percentage of petroleum diesel required to
prevent gelling, with 20% biodiesel (B20) blends or less generally considered suitable for use at
temperatures down to -15C (Whittington, 2006). Research into additives to reduce the gel point
temperature of biodiesel made from vegetable oils has the potential to negate the requirement for
blending with petroleum diesel in typical Australian climatic conditions. Flinders University has
recently developed an additive that will lower the gel point of tallow based biodiesel to around -6C
(Flinders University, 2008), although it is uncertain as to whether this additive can be used in
vegetable oil based biodiesel.

RMIT Handbury Fellowship Program
Biofuels Feasibility Investigation
27 | P a g e
Cottonseed biodiesel + 50% petroleum diesel at 22C Cottonseed biodiesel + 50% petroleum diesel at 5.3C(no gelling)
Figure 15. A sample of B50 biodiesel showing no signs of gelling under low temperature conditions.
Other methods to overcome high gel point temperatures include the use of fuel heaters and storage
of vehicles in or near buildings (Whittington, 2006).
A further disadvantage of using biodiesel in older model engines is that it can affect the integrity of
rubber seals in the fuel system. This issue is discussed further in Section 4.7.12.
4.7.4. Biodiesel Production Processes
Converting vegetable or animal oils to biodiesel is undertaken in a process known as
transesterification (Tickell, 2003). This reaction combines 80-90% triglyceride oil (vegetable oil or
tallow), 10-20% alcohol and 0.35-1.5% catalyst in a reaction that produces a fuel with a number of
similarities to petroleum diesel (Tickell, 2003). The alcohol can be either methanol or ethanol, with
methanol being most commonly used as it produces a more stable reaction (Tickell, 2003) which
proceeds at lower temperatures (Beer, Grant, & Campbell, 2007), and is therefore less energy
intensive and safer. Although methanol can be manufactured from wood or hemp (Handmade
Projects, Unknown), for economic reasons it is typically made from coal or natural gas (Tickell, 2003).
The methanol component of biodiesel production is one source of greenhouse gas emissions
produced during the biodiesel lifecycle which is discussed further in Section 4.7.7. Excess methanol
is often added to the reaction to push it to completion and this methanol can be readily recovered
for reuse in further biodiesel production (Handmade Projects, Unknown).

RMIT Handbury Fellowship Program
Biofuels Feasibility Investigation
28 | P a g e
A catalyst is a substance that initiates a reaction between two other substances but which itself is
not changed in the reaction (ed. Ludowyk & Moore, 1998). In making biodiesel, Sodium Hydroxide
(NaOH) or Potassium Hydroxide (KOH) is added to break or ‘crack’ the triglyceride oil molecule
(Figure 16), releasing the fatty acid arms known as esters to combine with the alcohol.
Figure 16. The triglyceride oil molecule found in vegetable and animal oils (Tickell, 2003).
Glycerol is the only by-product of the reaction which is shown in full in Figure 17. The uses of
glycerol are discussed further in Section 1. The entire biodiesel reaction is carried out in a
production process that typically follows the flowchart shown in Figure 18.

RMIT Handbury Fellowship Program
Biofuels Feasibility Investigation
29 | P a g e
Figure 17. The chemical reaction involved in the production of biodiesel (Tickell, 2003).
Figure 18. The biodiesel production sequence (NBB, 2007).

RMIT Handbury Fellowship Program
Biofuels Feasibility Investigation
30 | P a g e
4.7.5. Biodiesel Energy Balance
The energy balance for biodiesel production varies significantly depending on factors such as the
source of the oil feedstock and the energy required to carry out the transesterification process
(Beer, et al., 2000). Typically the energy needed to produce biodiesel from oil seed crops is very high
and lies within the range of 0.62 to 0.70 MJ/MJ of biodiesel produced (Beer, et al., 2000). This does
not compare favourably with the energy balance of conventional diesel ranging from 0.10 to 0.14
MJ/MJ of diesel produced (Beer, et al., 2000). The energy balance can be improved if tallow or Used
Cooking Oil are used as biodiesel feedstocks, however MJ/MJ values are still higher than those for
conventional diesel. Biodiesel made from algae oil on the other hand can have MJ/MJ values in
same range as conventional diesel, particularly if the production by-products are used in the
generation of electricity to power the process (Campbell, Beer, & Batten, 2009). In all cases higher
energy inputs equate to higher costs and reduced profit margins, an issue which is further discussed
in Section 1.
4.7.6. Biodiesel Production By-Products
Glycerol is the only by-product created during the transesterification process. Approximately 200mL
is produced per litre of biodiesel (Figure 19), and may be recovered for a variety of economic uses
including soap production, stock feed and for pharmaceutical purposes (Tickell, 2003).
Figure 19. A one litre sample of biodiesel showing the settling of glycerol as the darker layer at the bottom of the flask.

RMIT Handbury Fellowship Program
Biofuels Feasibility Investigation
31 | P a g e
Glycerol may also be used as a feedstock for anaerobic digestion to produce methane for electricity
generation (Campbell, Beer, & Batten, 2009).
Prior to further processing, excess methanol required to progress the transesterification reaction can
be recovered from the glycerol for re-use in the biodiesel production process (Handmade Projects,
Unknown).
4.7.7. Carbon Emissions from Biodiesel Production
A number of producers and authors who write about biodiesel make the claim that the process is
effectively carbon neutral, with reductions in GHG emissions ranging from 90 to 100% (Tickell, 2003.,
Eco Tech, unknown., and Biodiesel Producers,2008). As is the case for the life cycle carbon
emissions from ethanol production, opinions with respect to emissions from biodiesel also vary
widely. Research undertaken by the CSIRO notes that when compared to the equivalent petroleum
diesel fuel emissions, reductions of between 49% and 80% are possible depending on the feedstock
used (Beer, Grant, & Campbell, 2007).
When discussing GHG emissions with respect to the fuel production lifecycle the terms ‘upstream’
and ‘downstream’ or ‘tailpipe ‘are frequently used. ‘Upstream’ refers to all emissions resulting from
the producing of the feedstock, reacting/processing and distribution of the fuel prior to burning in an
internal combustion engine. ‘Downstream/tailpipe’ emissions are those produced as a result of the
final burning of the fuel to power a vehicle or machine. For example, Beer, Grant & Campbell (2007)
found that when using canola oil as a feedstock, emissions from upstream processes are
approximately 3.5 times higher than the upstream emissions from the refining of petroleum diesel.
However, when the fuel is burnt the carbon dioxide emissions are offset by the carbon dioxide
sequestered during the growth of the canola plant, resulting in zero tailpipe GHG emissions (Beer,
Grant, & Campbell, 2007). This is not to say that there are no GHG emissions from the use of canola
biodiesel as fossil fuels are still widely used in a number of upstream processes. Using B100
produced from canola does however reduce GHG emissions by 49% when compared to the use of
100% petroleum diesel (Beer, Grant, & Campbell, 2007). For other feedstocks the lifecycle
reductions in GHG emissions are shown in Table 5.
Table 5. Lifecycle Green House Gas emissions for biodiesel produced from various feedstocks (Beer, Grant, & Campbell,The greenhouse and air quality emissions of biodiesel blends in Australia, 2007).
Feedstock Lifecycle GHG EmissionsReduction
Canola Oil 49%
Tallow 76%
Used Cooking Oil 87%
Palm Oil(from existing plantations)
80%
Palm Oil(from cleared rainforest or peat swampforest)
-800% to -2,100%
Note that in Table 5 the emissions reductions for tallow and Used Cooking Oil are based on the
assumption that tallow is being diverted from existing market uses whereas UCO is considered to be
a waste product with no existing market (Beer, Grant, & Campbell, The greenhouse and air quality

RMIT Handbury Fellowship Program
Biofuels Feasibility Investigation
32 | P a g e
emissions of biodiesel blends in Australia, 2007). Table 5 also shows a significant increase in
emissions from palm oil grown on land previously occupied by rainforest or peat swamp forest as
the burning of cleared vegetation produces large volumes of CO2 and that vegetation is no longer in
existence to absorb GHGs (Beer, Grant, & Campbell, 2007). Figure 20 provides a visual indication of
the lifecycle emissions of GHG from B100 fuel produced from various feedstocks (Beer, Grant, &
Campbell, 2007).
Figure 20. A comparison of full lifecycle GHG emissions from 100% biodiesel produced from various feedstocks (Beer,Grant, & Campbell, The greenhouse and air quality emissions of biodiesel blends in Australia, 2007).
4.7.8. Algae Feedstocks
Research into the use of algae as a feedstock for alternative fuels began in the United States during
the oil crisis of the 1970s (Campbell, Beer, & Batten, 2009). The recent rise in oil prices has seen a
resurgence in this research (Campbell, Beer, & Batten, 2009). Current indications are that algae has
the potential to supplement biodiesel and ethanol feedstocks without removing land from food
production. The Carbon emissions implications of producing biodiesel from algae are also proving to
be favourable as Campbell, Beer & Batten (2009) have shown that, “it is possible to produce algal
biodiesel at less cost and with a substantial greenhouse gas and energy balance advantage over
fossil diesel”. Algae shows significant promise as a biofuel feedstock and its use in a small to
medium scale production facility is discussed in depth in Section 6.
4.7.9. Scales of Production
One of the significant advantages of biodiesel as an alternative fuel is the ability to produce it with
low technology equipment in very small to very large batches. Two process types are typically used;
settling or batch and continuous (Handmade Projects, Unknown). Smaller scale units rely on the
settling process whereby the feedstock, alcohol and catalyst are manually prepared and transferred
to the processing plant. Following vigorous mixing the contents are allowed to settle for a
RMIT Handbury Fellowship Program
Biofuels Feasibility Investigation
33 | P a g e
predetermined period after which the glycerol and biodiesel are separated. The biodiesel is then
‘washed’ using water or a chemical flocculant to remove remaining impurities (Tickell, 2003). The
glycerol can be distilled to recover excess methanol and then further refined for other soap making,
stock feed or composting. Figure 21 and Figure 22 show examples of small scale settling process
biodiesel making equipment.
Figure 21. A small biodiesel production plant capable of producing 150 - 1000L/day (BioWorks, 2005).

RMIT Handbury Fellowship Program
Biofuels Feasibility Investigation
34 | P a g e
Figure 22. A small scale biodiesel production plant capable of producing 200L every eight hours (Biodiesel Logic Inc,2005).
Biodiesel processors capable of producing larger daily volumes of fuel (Figure 23) often utilise a
continuous process. In such a processor the feedstock and other chemical requirements are
automatically and continuously fed into the machine which then produces a continuous output of
biodiesel.
Figure 23. A 32,000 litre per day biodiesel production plant (BioWorks, 2005).

RMIT Handbury Fellowship Program
Biofuels Feasibility Investigation
35 | P a g e
Due to scalability of the process it is not essential that a very large scale plant (Figure 24) be
constructed at great expense in order to cope with variable demand. Instead, a series of smaller skip
mounted processors can be installed and run in parallel, with new units added as demand increases.
Such an arrangement provides a distinct advantage when considering the economics of establishing
local scale biodiesel production facilities.
Figure 24. Biodiesel Producers 60 ML/year Barnawatha production facility (Biodiesel Producers, 2008).
4.7.10. Biodiesel Production in Australia
The Australian Government Biofuels Taskforce (2005) notes that, “current government policy
settings should be sufficient to meet a target of 350 megalitres by 2010. A number of interrelated
commercial risks are seen to be impeding progress toward this target and these include (Biofuels
Taskforce, 2005):
Oil companies have no incentive to surrender market share to biofuels;
Consumer demand for biofuels is low, and
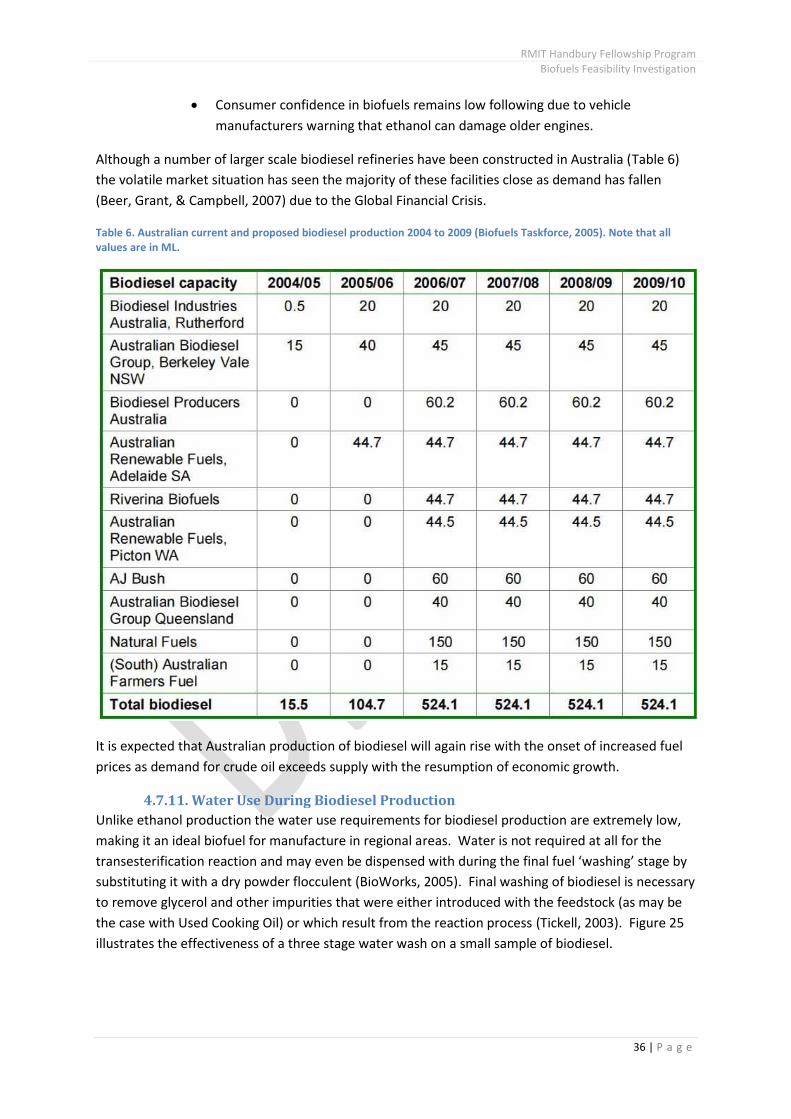
RMIT Handbury Fellowship Program
Biofuels Feasibility Investigation
36 | P a g e
Consumer confidence in biofuels remains low following due to vehicle
manufacturers warning that ethanol can damage older engines.
Although a number of larger scale biodiesel refineries have been constructed in Australia (Table 6)
the volatile market situation has seen the majority of these facilities close as demand has fallen
(Beer, Grant, & Campbell, 2007) due to the Global Financial Crisis.
Table 6. Australian current and proposed biodiesel production 2004 to 2009 (Biofuels Taskforce, 2005). Note that allvalues are in ML.
It is expected that Australian production of biodiesel will again rise with the onset of increased fuel
prices as demand for crude oil exceeds supply with the resumption of economic growth.
4.7.11. Water Use During Biodiesel Production
Unlike ethanol production the water use requirements for biodiesel production are extremely low,
making it an ideal biofuel for manufacture in regional areas. Water is not required at all for the
transesterification reaction and may even be dispensed with during the final fuel ‘washing’ stage by
substituting it with a dry powder flocculent (BioWorks, 2005). Final washing of biodiesel is necessary
to remove glycerol and other impurities that were either introduced with the feedstock (as may be
the case with Used Cooking Oil) or which result from the reaction process (Tickell, 2003). Figure 25
illustrates the effectiveness of a three stage water wash on a small sample of biodiesel.

RMIT Handbury Fellowship Program
Biofuels Feasibility Investigation
37 | P a g e
Figure 25. The 'washing' of a biodiesel sample. Note the change in colour of the biodiesel (top) and wash water(bottom), with each stage of the wash proceeding from left to right.
Water used during washing may be treated to remove contaminants and reused in further wash
operations or elsewhere in the production facility. Alternatively, with dilution it may be returned
harmlessly to a municipal wastewater treatment facility prior to release to the environment.
4.7.12. Engine Requirements for Biodiesel Use
One of the main advantages of using biodiesel as an agricultural transition fuel is its compatibility
with many existing diesel engines (Whittington, 2006). Care is required as biodiesel can soften and
degrade certain types of elastomer and natural rubber components found in older engines, over
time (Whittington, 2006). It is therefore essential that all seals and rubber components in the
engine fuel system are manufactured from flurorelastomers (FKMs) sometimes marketed as Viton
rubber (Wikipedia, 2009i). Many manufacturers now produce machinery specifically designed for
use with biodiesel and which are factory fitted with appropriate seals and rubber components.
Table 7 lists a number of these manufacturers and the biodiesel blends for which they are
compatible and covered under warranty. This table is provided as a guide only and is by no means
comprehensive. Machinery operators should at all times confirm compatibility and warranty
standing prior to the use of biodiesel in any of their equipment.
Table 7. Manufacturers producing biodiesel compatible farm machinery (Source: Manufacturer web sites).
Manufacturer Model Maximum Biodiesel Blend
Case IH All models B5
90% of models B20
JX, XU, Maxxum, Puma, Magnumand Steiger tractors excluding 480and 530 models
B100

RMIT Handbury Fellowship Program
Biofuels Feasibility Investigation
38 | P a g e
Manufacturer Model Maximum Biodiesel Blend
New Holland All engines other than common railfuel injected models
B20
Selected models, includingcommon rail fuel injection.
B100
Cummins Power Systems All models B5
Selected models B20
John Deere All models B5
All engines upt o Tier 3/Stage III A B20
Caterpillar All models B5
Compact and Mid-Range engines B20
C7 and larger engines, C18 marineengines
B30
Claas Warranties exist – Blend unknown B?
Fiatagri Warranties exist – Blend unknown B?
Ford Warranties exist – Blend unknown B?
Iseki Warranties exist – Blend unknown B?
Iveco Warranties exist – Blend unknown B?
Kubota All engines B5
Lamborghini R6 & R8 engines B100
Another know issue is that engine components containing brass, bronze, copper, lead, tin and zinc in
areas exposed to fuel can accelerate the oxidation of biodiesel, creating deposits in the engine (John
Deere, 2009). In some cases the use of biodiesel can also accelerate the degradation of crankcase oil
(John Deere, 2009). However, as a rule biodiesel blends up to B5 are considered safe to use in the
majority of existing diesel engines, and are in fact recommended since the introduction of low
sulphur diesel has raised concerns about additional engine wear due to its inherent low lubricity
(Whittington, 2006). Despite the concerns detailed above many examples can be found where
agricultural machinery, heavy and domestic transport vehicles have been successfully fuelled for
thousands of hours and hundreds of thousands of kilometres on biodiesel ranging from B5 through
to B100 blends (Whittington, 2006).
In many cases the only modification required is the fitting of a cheap (approximately A$2.50) in-line
fuel filter (Figure 26) to trap sludge stripped from the fuel system in the first one thousand hours (or
1000km in the case of a road transport vehicle) of operating on biodiesel. Using a relatively cheap
in-line filter negates the requirement to replace the more expensive primary fuel filter during the
changeover to biodiesel.

RMIT Handbury Fellowship Program
Biofuels Feasibility Investigation
39 | P a g e
Figure 26. A used in-line filter containing trapped sludge stripped from the fuel system in the first 1000km of operationof a vehicle using 100% biodiesel (Photo: Heinz de Chelard 2008).
4.7.13. Economics of Biodiesel Production
As for the energy balance, the economics of biodiesel production rely significantly on the source of
the feedstock.
TO BE COMPLETED – REFER TO REPORT BD – PRODUCTION & ECONOMICS
BIODIESEL FROM CANOLA IS NOT CURRENTLY ECONOMICALLY VIABLE. BIODIESEL FROM ALGAE IS
1ha = 1000L of oil. Average farm requires 30,000L to produce 20,000Ha of oil seed crop (source:
In The National Interest, ABC Radio National 2007-12-09). i.e
5. The FutureIt is difficult to determine the direction of technology and the human response to any future fuel
crisis. The only truly global experience of oil shortage occurred in 1973 and even then the event was
short lived. One possible scenario is that existing and emerging technologies will be rapidly brought
online to maintain economic growth. A period of disruption is likely to occur as little or no
preparation has been undertaken by any developed economy for a rapid and sustained increase in
oil prices. The length of disruption may be as short as five years, during which the demand for
alternative fuels is likely to rise. Following a period of rationing, restrictions will ease and economies
will again start to grow as very large scale Gas to Liquid (GTL) and Coal to Liquid (CTL) fuel plants
come on line. It is considered however, that the demand for biofuels will grow as there will also be
an urgent requirement to cut CO2 emissions which can only be achieved by GTL and CTL systems
with costly Carbon Capture and Storage techniques.
5.1. RationingDuring the oil crisis of 1973 (Wikipedia, 2009b) the Australian government implemented an odds and
even system of fuel rationing. Under this system drivers of vehicles with number plates ending in
odd numbers were restricted to purchasing fuel every second day, and vice versa for vehicles with
plates ending in even numbers (J. de Chelard pers comm., 2009). Rationing was implemented
globally with all modes of transport affected, including cargo ships which were forced to apply speed

RMIT Handbury Fellowship Program
Biofuels Feasibility Investigation
40 | P a g e
restrictions to save fuel (G. Penon pers comm., 2009). The 1973 oil crisis was short lived, lasting only
a few months (G. Penon pers comm., 2009), however some experts are warning that due to Peak Oil
mankind faces a much more significant medium term protracted oil shortage. Automotive
engineering expert Professor Laurie Sparke goes so far as to state that, “In coming years Australia
may not be able to buy oil at any price” (ABC, 2009b).
Should the second oil crises predicted by Sparke (2009), CSIRO (2008) and others eventuate it is
almost certain that fuel rationing will once again be implemented. A logical approach will be to
direct fuel toward maintaining agricultural productivity and associated supply line activities. Even
though fuel will therefore be available for farming, it is considered that extending supplies through
the use of biofuels will be encouraged.
5.2. Gas to Liquid FuelsA number of techniques, including the Fischer-Tropsch process and the Mobil process, are available
to convert natural gas to liquid fuels or synfuels (Wikipedia, 2009m). Australia is considered to have
an abundant supply of natural gas (CSIRO, 2009b), enabling the possibility of large scale gas to liquid
fuel conversion. Using Gas to Liquid technology the CSIRO (2009b) aims to:
Produce clean/low sulphur transport fuels;
Reduce the high energy demand required of existing GTL technologies;
Increase the conversion rate of gas to liquid synfuel products, thereby reducing
the production of undesirable by-products, and;
Improve the commercial viability of GTL processes by reducing the operating
and capital costs of plant and equipment.
The petroleum company Shell (Unknown) states that, “On a life cycle basis, carbon dioxide (CO2)
production from a GTL system is comparable with a refinery system. The additional CO2 produced
during production is roughly offset by the lower CO2 emissions when the GTL products are used”.
Information regarding the energy balance of the GTL process was not readily available at the time of
writing.
One advantage of GTL produced synfuel is that it can be readily blended with existing petroleum
diesel for use as a fuel extender (CSIRO, 2009b). Although the technology to produce synfuels from
natural gas is readily available and its development is proceeding at a rapid rate, it is unclear
whether the capacity will ever exist to completely replace the growing global demand for oil based
fuels. It may be the case that the widespread introduction of GTL processing leads to an
acceleration of natural gas consumption leading to a production peak earlier than 2020 (Romm,
2004) to 2030 (EIA, 2009).
5.3. Coal to Liquid FuelsAs is the case for natural gas, coal can be converted to liquid hydrocarbon fuels using processes
such as hydrogenation and carbonization (Wikipedia, 2009n). The Coal to Liquid process is known to
produce large volumes of CO2 and without the employment of carbon capture and storage
techniques (which are not yet developed on a commercial scale) the GHG footprint of the resulting
fuel is greater than that of fuels produced from crude oil (Wikipedia, 2009n). Australia has coal
reserves estimated to be in the order of 200 to 300 years for black coal and approximately 800 years
worth of brown coal (Hooke, 2009). As the price of oil rises the demand for CTL fuels will make large

RMIT Handbury Fellowship Program
Biofuels Feasibility Investigation
41 | P a g e
scale production economically feasible, and it may be the case that over time coal derived synfuels
will replace crude oil as humanities major energy source.
5.4. AlgaeThe micro-algae (herein referred to as algae) suitable for biofuels use are primitive organisms with a
simple cell structure and large surface to volume body ratio (Schulz, 2006). Algae are relatively easy
to grow due to their simple biological structure which requires a minimal number of basic inputs to
sustain (Figure 27).
Figure 27. The basic requirements necessary for algae to thrive (Utah State University, 2009).
Their large surface to volume body ratio enables algae to rapidly take up high volumes of water
borne CO2 and nutrients (Schulz, 2006), making possible the very high growth rates which make it
suitable for biofuel production.
Upon drying the algal biomass typically contains up to 46% carbon, 10% nitrogen and 1 percent
phosphorous, with one kilogram of dry algae sequestering up to 1.7kg of carbon dioxide (Schulz,
2006). It is important to note that carbon sequestration by algae used for biofuels is not permanent
as the stored carbon is released upon burning of the fuel (Campbell, Beer, & Batten, 2009). Overall
carbon emissions are however reduced because the equivalent volume of fossil fuel has been
replaced by the algae based biofuel (Campbell, Beer, & Batten, 2009).
The literature review undertaken for this report indicates that now and for the foreseeable future
algae is the most environmentally, socially and economically sustainable biofuel feedstock,
particularly as algae are among the fastest growing of all organisms that turn sunlight into chemical
energy and they can be grown on land that does not compete with food production (ISA, 2009).
The current direction of commercial algae biofuels production is toward very large scale facilities
such as that proposed by MBD Energy Limited. With plans to capture CO2 from coal fired power
stations and then use it to maximise the growth of algae, MBD’s process will require 300 – 400
hectares of relatively flat land adjacent to or near coal fired power stations (MBD Energy, 2009).
Figure 28 illustrates the proposed layout of MBD’s bioreactors.
Algae Energy
System Inputs
CO2
Nutrients
Surface
Area
Sunlight
Water

RMIT Handbury Fellowship Program
Biofuels Feasibility Investigation
42 | P a g e
Figure 28. The proposed configuration of the MBD Energy bioreactor field for algae production (MBD Energy, 2009).
Although MBDs proposal is sound, Campbell, Beer and Batten (2009) note that finding enough flat
land within an economic distance of coal fired power stations on which to build algae farms large
enough to sequester 100% of CO2 output is a problem. Campbell, Beer and Batten (2009) also show
that the increased infrastructure cost of building large scale facilities further than 50km from a
source of CO2 can substantially impact economic viability as well as emissions reduction potential
due to the increased power requirements of pumping flue gases the extra distance.
With questions surrounding the economic and GHG reduction viability of very large scale algae
production facilities, opportunities may exist for small to medium scale enterprises in regional areas.
In keeping with the philosophy of relocalisation, economic, social and environmental outcomes may
also be realised through increased employment, waste utilisation and local energy security.
5.4.1. Nutrient Requirements
To convert sunlight into chemical energy algae requires nutrients, carbon dioxide and water. The
elements required by algae, nitrogen, phosphorous, potassium and sulphur, are commonly found in
human, animal and organic waste, and examples already exist where algae is used in the treatment
of municipal, agricultural and mining waste (Schulz, 2006). Nutrient removal from municipal waste
water is one of the primary purposes of a waste water treatment plant as excessive amounts of
phosphorous and nitrogen released to the environment can lead to significant eutrophication in
waterways and water bodies (USQ, 1999). A significant percentage of the infrastructure and
operating costs of a wastewater treatment plant are consumed in the removal of excessive nitrogen
and phosphorous from the water being treated.
Normal plant growth requires C:TN:TP (Carbon:Total Nitrogen:Total Phosphorous) ratios in the order
of 100:15:1 while the C:TN:TP ratio in raw sewerage is usually in the order of 100:25:6 (USQ, 1999).
Raw sewerage released to the environment can lead to abnormal plant and algae growth in

RMIT Handbury Fellowship Program
Biofuels Feasibility Investigation
43 | P a g e
waterways (USQ, 1999), but is ideal for the controlled production of algae. Campbell, Beer and
Batten (2009) show that biofuel suitable algae growth can be optimised with the addition of NPKS
(Nitrogen:Phosphorous:Potassium:Sulfur) in the ratio of 32:10:0:0 which in the order of that found in
raw sewerage.
At the completion of the oil recovery stage of an algae biofuels feedstock operation these nutrients
can be retrieved for reuse in the algae growing process or for the production of fertilisers high in
nitrogen and phosphorous, thereby recycling the nutrients from fertiliser to food to waste and back
into fertiliser (Briggs, 2004).
5.4.2. CO2 Requirements
Providing a source of concentrated CO2 far from power stations or industrial facilities may pose a
problem for the maximisation of algae growth. As discussed in Section 4.4.3, certain strains of algae
can be fermented to produce ethanol (Algenol Biofuels, 2009) and a by-product of this process is
carbon dioxide that may be returned to the algae bioreactor. It may also be possible to recover
carbon dioxide when, following oil recovery, the remaining algal mass is used in an anaerobic
digester (Section 6.1) to produce methane which is used as fuel in a Combined Heat and Power
(CHP) plant (Campbell, Beer, & Batten, 2009), emitting CO2 as an exhaust gas.
In the south western region of Victoria the largest producer of carbon dioxide is Portland Aluminium
smelter. Aluminium production results in the emission of large volumes of CO2 as a result of anode
consumption during electrolysis in all prebake and Søderberg cells (USEPA, 2009). The Portland
Aluminium plant emits XXX tonnes of CO2 per year. If this CO2 can be captured it will be possible to
use it in a bioreactor to optimise algae growth. Another advantage of siting an algae based biofuel
production facility at the Portland Aluminium site is the ready access to a source of waste heat which
can also be used to maximise algae growth.
Commercial equipment capable of concentrating atmospheric carbon dioxide is also available,
although details of the purchase cost and operating energy requirements for this equipment were
not readily available at the time of writing.
For small scale plants following the process detailed in this report a promising alternative, under
development by Klaus Lackner of Columbia University, is a ‘Synthetic Tree’. These devices are
capable of scrubbing carbon dioxide from the atmosphere and storing it prior to further processing
(Figure 29).

RMIT Handbury Fellowship Program
Biofuels Feasibility Investigation
44 | P a g e
Figure 29. An artist conception of an 'Artificial Tree' used to concentrate and store atmospheric carbon dioxide(Flesher, 2009).
In an interview with the New York Times, Lackner noted that synthetic trees should be able to
produce one tonne of CO2 per day at a cost of approximately US$30 (Flesher, 2009). Although an
artificial tree will cost around US$30,000 (Flesher, 2009) the impending requirement for
communities to reduce carbon emissions may provide the incentive necessary to implement this
technology for local biofuels production.
Alternatively, if a source of concentrated CO2 proves not to be cost effective, algae will still thrive,
albeit with much decreased productivity. If local fuel volume requirements are low natural growth
rates may be acceptable.
5.4.3. Temperature Requirements
Among the 40,000 species identified worldwide though there is a wide variability in the range of
suitable growing temperatures at which algae can thrive (Utah State University, 2009). As is the case
for all plants, the optimal temperature requirements for growing individual species of biofuel algae
lie within a narrow range, and temperature fluctuations outside of this range can have a significant
impact on productivity (Utah State University, 2009). Trials are currently underway by MBD Energy
in eastern Victoria (MBD Energy, 2009) using a classified species of algae. The particular species in
use by MBD is proprietary knowledge and as such the temperature requirements are unavailable.
Without knowledge of the strain in use by MBD it is possible to generalise using the findings
reported by Utah State University (2009) in which they note that cyanobacterial strains of algae
obtain optimal productivity at 30C while green algae achieve optimum production at 26C.
Figure 30 shows that in the Hamilton area 26C (indicated by the horizontal green line) lies above
the average daily maximum temperature for the majority of the year. The use of average
temperature can be deceptive and to gain a more complete picture of climate conditions the
information provided in Figure 30 must be considered in conjunction with the number of days above
and below specific temperatures as shown in Table 8.

RMIT Handbury Fellowship Program
Biofuels Feasibility Investigation
45 | P a g e
Figure 30. Annual temperatures and rainfall for Hamilton airport (Weather Zone, 2009).
Table 8. Average number of days within different temperature ranges at the Hamilton airport (Elders, 2009).
Temperature Average Number ofDays per Year
≥40C 1.0
≥35C 8.9
≥30C 29.9
≤2C 32.0
≤0C 6.5
Combining this temperature data it can be concluded that to achieve optimum production rates in
the western districts of Victoria a means of controlling temperature will be required. For the
majority of the year some heat input will be necessary and for a small, but increasing (due to climate
change) number of days cooling may be required.
Algae biofuel trials around the world use one of two cultivation systems. In warmer more stable
climatic areas open cultivation systems are common (Figure 31). Open cultivation systems (OCS) or
open ponds resemble the algae’s natural environment and are relatively inexpensive to build and
operate (Utah State University, 2009).

RMIT Handbury Fellowship Program
Biofuels Feasibility Investigation
46 | P a g e
Figure 31. An example of an Open Cultivation System for biofuel algae production (Utah State University, 2009).
Although cheaper, the drawbacks of open pond systems include low production due to a lack of
temperature control, an inability to control movement of the algae, water evaporation and the risk
of contamination by predator strains of algae (Utah State University, 2009).
Closed Cultivation Systems (CCS) such as that shown in Figure 32, allow better control and regulation
of all of the growth parameters for algae, including temperature (Utah State University, 2009).
Conversely, the advantages of CCS bioreactors come at significantly higher costs. Biofouling of
system flow paths and deterioration of optical reactor vessel materials do occur over time, and cell
damage due to rigorous mixing also can be a significant issue (Utah State University, 2009).
Figure 32. An example of a Closed Cultivation System for algae production (Algbay, 2008).
To be economically viable in the Hamilton region climate zone it will most likely be found that Closed
Cultivation Systems are required. Bioreactors would require housing in glasshouses where
temperature can be closely controlled. To minimise energy inputs for temperature control energy
efficient glass houses will be necessary. The technology required to construct and operate these
types of greenhouses is already in use in Australia.
The Queensland Department of Primary Industries have constructed energy efficient greenhouses in
Toowoomba and Warwick (Figure 33) (Qld Department of Public Works, 2009), both places which

RMIT Handbury Fellowship Program
Biofuels Feasibility Investigation
47 | P a g e
have winter temperatures that are slightly warmer to those found in south western Victoria
(Weather Zone, 2009). Known as Solar Glasshouses these research facilities are able to maintain
optimum crop growing conditions all year round with no fossil fuel energy input. This is achieved by
the use of inexpensive design features including hail resistant polycarbonate double skins, thermal
mass and automated vents (Qld Department of Public Works, 2009). These glasshouses were
constructed for $70,000 each, a significant saving when compared to traditional glasshouses of the
same floor area located at the same facility, which cost $250,000 each to build (Qld Department of
Public Works, 2009).
Figure 33. The Queensland Department of Primary Industries solar glasshouse facility at Warwick (Qld Department ofPublic Works, 2009).
Installing algae bioreactors in energy efficient greenhouses would allow the optimum temperature
control necessary for the conditions found in the Hamilton climate region. If the production facility
was to include a Combined Heat and Power plant fuelled with methane from the anaerobic digestion
of algal mass by-product, optimum temperatures could be maintained using waste heat from the
production of electricity for sale back to the grid. Such systems are already in use with one example
from Denmark shown in Figure 34.
Figure 34. Masnedø power station in Denmark burns waste straw to produce electricity. Waste heat is used to optimisegrowth conditions in the glasshouses seen on the right of the photo (Wikipedia, 2006).
Glasshouse based facilities will also allow optimisation of the light conditions required for algae
growth.

RMIT Handbury Fellowship Program
Biofuels Feasibility Investigation
48 | P a g e
5.4.4. Light Requirements
As for temperature, different species of algae require different light inputs for optimum productivity.
Green algae, which are more likely to be suited to the south western Victorian region, achieve
optimal growth at 200 – 300 lux (Utah State University, 2009). Although this region experiences
relatively low average daily sunshine hours (Figure 35) when compared to the arid areas of Australia,
a light meter reveals that even on an overcast day ambient light levels are in the order of 1,700 lux.
Figure 35. Average daily sunshine hours at the Bureau of Meteorology's Hamilton Research Station .(BOM, 2009)
Should light levels fall below optimum, or if it is necessary to increase growing time through longer
periods of illumination, artificial lighting can be used. Fluorescent lights have been employed for
many decades to optimise plant growth and can be installed to shine directly onto bioreactors
installed inside greenhouses. Electricity can be provided to run lights from a number of sources
including standalone solar installations or from a CHP plant located on site. During the day
additional light can also be ‘piped’ into bioreactors through fibre optic wires as used in a system
developed by Greenshift Technologies (2008).
5.3.5. Water Requirements
Algae are able to grow in wide range of water qualities. Some species thrive in salt water while
others require fresh water. In each case algae found in both salt and fresh water, and which are also
suitable for biofuels production have been identified. This is an advantage when considering algae
cultivation in the western districts of Victoria as, depending on its source, water quality can range
from fresh to hyper saline.
Water availability is considered to be more of an issue with respect to the use of Open Cultivation
Systems (Utah State University, 2009). Under these conditions evaporation, salt concentration and

RMIT Handbury Fellowship Program
Biofuels Feasibility Investigation
49 | P a g e
the requirement to replace water consumed during algal respiration may all present significant
management problems.
Water used in Closed Cultivation Systems can be recovered and reused with minimal loss from the
system (Utah State University, 2009). Such a system may still have problems with salt concentration
and additional water inputs will be required to maintain salt levels within acceptable limits
(Campbell, Beer, & Batten, 2009). Wastewater treatment plants are one possible source of nutrient
rich water suitable for algae production in the Hamilton area, however further investigation into this
option is required. It is considered though that water is not likely to be a limiting factor for the
production of algae in this region.
5.3.6. Products & By-Products
Once a crop of algae has matured it is removed from the bioreactor for further processing. During
this stage 100% of the organism is recovered for use in a range of products. Table 9 summarises the
processing products of algae and their end uses.
Table 9. Algae products and end uses (MBD Energy, 2009).
Product Percentage of theAlgae Organism
End Use
Algae 100% Ethanol
Oil 10 – 35%
Biodiesel
Plastic Production
Jet and other fuels
Meal 65 – 90%
High protein livestock feed
Fertiliser
Plastic Production
Methane production for electricitygeneration
Algae harvesting can be achieved using a number of methods including micro screens,
centrifugation, flocculation and froth flotation (Oilgae, Unknown). The system assessed by the
CSIRO for use by MBD Energy used a chemical flocculant to concentrate the algae which is then
further concentrated using Dissolved Air Flotation (DAF) prior to feeding into a centrifuge to
separate the oil from the algal mass or ‘meal’ (Campbell, Beer, & Batten, 2009). Centrifuge systems
are expensive in terms of capital and ongoing maintenance costs and many companies are currently
testing cheaper alternatives (Campbell, Beer, & Batten, 2009).
Recovered algae oil in a small to medium regionally based facility would most likely be converted
into biodiesel using the standard methods discussed in Section 4.7.4. The remaining meal can either
be further processed into stock food, fertiliser or returned to the bioreactor to provide nutrients for
the next crop (Campbell, Beer, & Batten, 2009). An alternative and possibly more economically
sound use for the meal is to feed it into a digester to produce methane which itself can be used to
fuel a Combined Heat and Power plant. Campbell, Beer & Batten (2009) consider that electricity
generated from algal mass derived methane has the potential to provide more energy than the
facility will require and should therefore be considered to be a power plant producing biofuels as a

RMIT Handbury Fellowship Program
Biofuels Feasibility Investigation
50 | P a g e
by-product, not a biofuels plant producing power. Should this prove to be the case local scale algae
biofuels facilities warrant serious consideration.
6. Local Scale Biofuels ProductionBy combining all of the aspects of algae production discussed in depth in Section 5.4 it may be
possible to construct a self contained energy and biofuels production facility on any scale. Most
communities already have the basic requirement for algae production in the form of nutrients from
wastewater treatment plants. The construction of a Local Scale Biofuel Production (LSBP) facility at
or close to a municipal wastewater treatment plant allows the utilisation of an unused nutrient
source and also resolves a number of other waste and energy issues facing regional communities.
Steps in the proposed process are likely to include:
1. Methane Production: Algae meal and municipal green and food waste used as
feedstock for an anaerobic digester to produce methane which is used as fuel in a CHP
plant;
2. A Combined Heat and Power Plant (CHP): Provides electricity and heat to run the LSBP
facility. Excess electricity is sold to the grid;
3. A Closed Cultivation Algae Bioreactor: Algae is grown in a closed system that allows
total control of all growth parameters including light, heat, nutrients and carbon dioxide;
4. Carbon Dioxide Concentration: Optimisation of algae growth is achieved through the
provision of excess carbon dioxide. The use of a CO2 concentrator or ‘Synthetic Tree’ is
proposed for this operation;
5. Algae Processing: Algae recovered from the bioreactor is processed to produce algae
meal which is returned to the anaerobic digester to produce methane for the CHP, and
oil for biodiesel production, and;
6. Biodiesel Production: Oil recovered during the algae processing stage is chemically
converted to biodiesel for sale or use in agricultural production. Surplus canola oil and
used cooking oil collected from surrounding communities may also be converted into
biodiesel. Excess methanol used in the biodiesel reaction may be recovered from the
glycerol by-product for re-use. Glycerol can be further refined for pharmaceutical
purposes or soap making. Preliminary research investigation that it may also be feasible
to anaerobically digest glycerol to produce methane.
Inputs to the process will be:
Nutrient rich wastewater: Typically nutrients can be recovered by algae from municipal
wastewater. Another source may be animal wastes from intensive livestock operations
and dairy farms;
Municipal green waste and organics: Kerbside collection of municipal green waste and
organics/food scraps may be reduced to pulp prior to anaerobic digestion to produce
methane;
Carbon Dioxide: Concentrated by a Synthetic Tree or similar device, carbon dioxide will
be used to optimise the growth of algae in the bioreactor;
Methanol: Required for biodiesel production. A percentage of the methanol used in
the reaction can be recovered for re-use in following biodiesel batches;

RMIT Handbury Fellowship Program
Biofuels Feasibility Investigation
51 | P a g e
Used Cooking Oil and Surplus Canola Oil: UCO is currently sent to landfill or collected
for purification and soap making. Locally collected UCO is currently trucked to
Melbourne for further processing.
Outputs from the process will include:
Low nutrient wastewater: Nutrients from the wastewater will be consumed by the
algae. Low nutrient water can be returned to the environment or re-used in the
bioreactor;
Carbon Dioxide: Carbon dioxide emitted from the burning of methane in the CHP plant
and burning of the biodiesel in an ICE will be concentrated by the Synthetic Tree to be
re-used for algae production;
Heat: Heat produced by the CHP plant and not re-used in the process can be diverted to
other applications such as high value glasshouse based vegetable production;
Electricity: Excess electricity may be returned to the grid as green energy, to provide a
primary source of income from the facility;
Biodiesel: High quality biodiesel fuel suitable for use in most existing diesel engines;
Glycerol: If not consumed in an anaerobic digestion process glycerol recovered from the
biodiesel production process may be refined for pharmaceutical use, used in soap
production or as a food for live stock;
Digestate: Digestate is the solid remains of the original sludge used in the anaerobic
digester. Following dewatering and maturation or composting digestate can be used as
in agricultural operations as a soil improver.
Figure 36 diagrammatically illustrates the proposed Local Scale Biofuel Production process. Further
detail and a visual breakdown of each step in the process are provided in the following sections.

RMIT Handbury Fellowship Program
Biofuels Feasibility Investigation
52 | P a g e
Figure 36. The proposed Local Scale Biofuels Production process.

RMIT Handbury Fellowship Program
Biofuels Feasibility Investigation
53 | P a g e
6.1. Methane ProductionThe anaerobic digestion of organic materials is commonly undertaken at municipal wastewater
treatment plants as a means of stabilising highly putrescibles solid materials or sludges from primary
and secondary sedimentation tanks (USQ, 1999). Figure 37 shows the physical layout of a typical
single stage anaerobic digester used in wastewater treatment.
Figure 37. The basic layout of a typical anaerobic digester producing methane as an effluent gas (English 202C,Unknown).
Sludge is a logical feedstock for anaerobic digestion at a Local Scale Biofuel Production (LSBP) facility
as siting at or close to a wastewater treatment plant will also provide a valuable source of nutrients
for algae production. In order to maximise the economic return from the facility the volume of
methane produced can be further increased through the addition of algae meal from the algae
processing stage, municipal green waste and food organics.
Digesters can accept any biodegradable material as a feedstock with the more putrescible materials
producing higher biogas (methane and carbon dioxide) yields (Wikipedia, 2009l). Putrescible green
and kitchen waste, which makes up 43.2% of household waste (Figure 38) (SWRG, 2009). The
average household in the south western region of Victoria produces more than 200 kilograms of
organic waste per year (SWRG, 2009), posing a significant disposal problems for local councils,

RMIT Handbury Fellowship Program
Biofuels Feasibility Investigation
54 | P a g e
Figure 38. Kerbside waste profile for the south western region of Victoria (SWRG, 2009).
Disposal of this material via anaerobic digestion may go some way toward solving or even
eliminating the problem while producing valuable heat and electricity. The incorporation of
municipal green and food waste into the process creates are requirement for screening and sorting
to remove physical contaminants such as plastics and metals. Shredding, mincing and pulping prior
to introduction to the digester is also required (Wikipedia, 2009l). The addition of green waste
processing equipment to the methane production system adds to system complexity and increases
initial purchase and ongoing operation and maintenance costs (Wikipedia, 2009l). However, it may
be the case that increased income from electricity production warrants the incorporation of green
waste and food organics management within the facility.
There are three main products of anaerobic digestion; Biogas, Digestate and Water. Biogas, consists
primarily of methane and carbon dioxide, and as previously discussed, provides the energy source
for the CHP plant used to power the proposed facility. Digestate is the solid remnants of the
wastewater treatment sludge, green waste and food organics used in the anaerobic digestion
process (Wikipedia, 2009l). Further composting or maturation of the digestate is required prior to
reaching a stage where it is suitable for agricultural use as a soil improver (Wikipedia, 2009l), and as
such a suitable site for dewatering and composting/maturation is required.
Figure 39. Digestate recovered from an anaerobic digester, suitable for use as a soil conditioner (Wikipedia, 2009l).

Figure 40 illustrates the proposed inputs and outputs from methane
LSBP facility.
Figure 40. Inputs and outputs from the methane production stage of the proposed process.
6.2. Combined Heat and PowerA Combined Heat and Power Plant is an internal combustion engine o
produces useful heat energy as a by
most famous examples of the use of CHP plants
energy system supplying electricity to public and private consumers through a private wire network
has been installed (Jones, 2009).
warm commercial buildings, resulting in significant energy savings and emissions reductions
2009).
Fuelled with methane from the anaerobic digester, electricity produced by the CHP plant in the
proposed LSBP facility is likely to be
and used to maintain optimum temperatures for algae growth and chemical process in other
operations within the facility. A proportion of the electricity generated is required to power the
facility with the excess sold to the grid under the government’s Mandatory Renewable Energy Target
scheme. Campbell, Beer and Batten (2009) note that any proposal to connect a CHP plant to the grid
for the purpose of electricity supply will be subject to increased costs due
dedicated switching facility.
Carbon dioxide released during the burning of methane in the CHP plant may be recycled back to
through the bioreactor after concentration by the Synthetic Tree.
outputs required for the Combined Heat and Power plant.
RMIT Handbury Fellowship Program
Biofuels Feasibility
illustrates the proposed inputs and outputs from methane production stage of the the
. Inputs and outputs from the methane production stage of the proposed process.
Combined Heat and PowerA Combined Heat and Power Plant is an internal combustion engine or gas turbine generator that
produces useful heat energy as a by-product of electricity generation (Wikipedia, 2006)
most famous examples of the use of CHP plants is operating in the UK city of Woking where
gy system supplying electricity to public and private consumers through a private wire network
. Heat collected as a by-product of electricity generation is used to
sulting in significant energy savings and emissions reductions
Fuelled with methane from the anaerobic digester, electricity produced by the CHP plant in the
likely to be the primary source of income. Waste heat would be collected
and used to maintain optimum temperatures for algae growth and chemical process in other
operations within the facility. A proportion of the electricity generated is required to power the
xcess sold to the grid under the government’s Mandatory Renewable Energy Target
scheme. Campbell, Beer and Batten (2009) note that any proposal to connect a CHP plant to the grid
for the purpose of electricity supply will be subject to increased costs due to the requirement for a
Carbon dioxide released during the burning of methane in the CHP plant may be recycled back to
through the bioreactor after concentration by the Synthetic Tree. Figure 41 details the inputs and
outputs required for the Combined Heat and Power plant.
GLYCEROL
ALGAE
MEAL
RMIT Handbury Fellowship Program
Biofuels Feasibility Investigation
55 | P a g e
production stage of the the
. Inputs and outputs from the methane production stage of the proposed process.
r gas turbine generator that
(Wikipedia, 2006). One of the
in the UK city of Woking where an
gy system supplying electricity to public and private consumers through a private wire network
product of electricity generation is used to
sulting in significant energy savings and emissions reductions (Jones,
Fuelled with methane from the anaerobic digester, electricity produced by the CHP plant in the
ource of income. Waste heat would be collected
and used to maintain optimum temperatures for algae growth and chemical process in other
operations within the facility. A proportion of the electricity generated is required to power the
xcess sold to the grid under the government’s Mandatory Renewable Energy Target
scheme. Campbell, Beer and Batten (2009) note that any proposal to connect a CHP plant to the grid
to the requirement for a
Carbon dioxide released during the burning of methane in the CHP plant may be recycled back to
tails the inputs and
ALGAE
MEAL

Figure 41. Inputs and outputs from the Combined Heat and Power production process in the LSBP facility.
Further investigation is required to determine t
the CHP plant for biofuel production. Alternatively the electricity and heat may also be used in
greenhouse enclosed high value vegetable production or for other purposes that may prove to be
more economic than biofuel production.
6.3. Algae ProductionThe algae production process has been covered in some detail in Section
details the inputs and outputs required to sustai
Cultivation System bioreactor.
RMIT Handbury Fellowship Program
Biofuels Feasibility
. Inputs and outputs from the Combined Heat and Power production process in the LSBP facility.
Further investigation is required to determine the feasibility of using the electricity and heat from
the CHP plant for biofuel production. Alternatively the electricity and heat may also be used in
greenhouse enclosed high value vegetable production or for other purposes that may prove to be
omic than biofuel production.
Algae ProductionThe algae production process has been covered in some detail in Section 5.4 of this report.
details the inputs and outputs required to sustain optimum algae production in the Closed
RMIT Handbury Fellowship Program
Biofuels Feasibility Investigation
56 | P a g e
. Inputs and outputs from the Combined Heat and Power production process in the LSBP facility.
he feasibility of using the electricity and heat from
the CHP plant for biofuel production. Alternatively the electricity and heat may also be used in
greenhouse enclosed high value vegetable production or for other purposes that may prove to be
of this report. Figure 42
n optimum algae production in the Closed

Figure 42. The proposed inputs to and outputs from the Closed Cultivation System bioreactor.
6.4. Algae ProcessingProcessing of algae from the bioreactor may be carried out utilising a number of techniques including microflocculation, dissolved air flotation and centrifuging as detailed in Section
processing
Figure 43.
ATMOSPHERIC
CARBONDIOXIDE
CONCENTRATED BYSYNTHETIC TREE
HEAT &
POWER
ALGAE
MEAL
HEAT &
POWER
RMIT Handbury Fellowship Program
Biofuels Feasibility
. The proposed inputs to and outputs from the Closed Cultivation System bioreactor.
Algae Processinghe bioreactor may be carried out utilising a number of techniques including micro
flocculation, dissolved air flotation and centrifuging as detailed in Section 5.3.6. Inputs to and outputs from the algaeprocessing stage of the proposed facility are shown in
ENERGY EFFICIENTGLASSHOUSE
ENCLOSED
CCS ALGAEBIOREACTOR
NUTRIENT SUPPLY
FROM WASTEWATER
TREATMENTPLANT
NUTRIENT SUPPLYFROM
DAIRYEFFLUENT
ATMOSPHERIC
CARBONDIOXIDE
CONCENTRATED BYSYNTHETIC TREE
HEAT &
POWER
ALGAE
LIGHT
LOW NUTRIENT
WATER
ALGAE
PROCESSING
ALGAE
ALGAE
MEAL ALGAE OIL
LOW NUTRIENT
WATER
RMIT Handbury Fellowship Program
Biofuels Feasibility Investigation
57 | P a g e
. The proposed inputs to and outputs from the Closed Cultivation System bioreactor.
he bioreactor may be carried out utilising a number of techniques including micro-screening,. Inputs to and outputs from the algae
LOW NUTRIENT

RMIT Handbury Fellowship Program
Biofuels Feasibility Investigation
58 | P a g e
Figure 43. Inputs to and outputs from the algae processing stage of the proposed biofuels facility.
6.5. Biodiesel ProductionBiodiesel production is the ultimate goal of the facility as the intention is to use it to maintain
agricultural production in the south western region of Victoria during periods of oil shortage.
Discussed in depth in Section 4.7, a graphical illustration of the process inputs and outputs is
provided in Figure 44.
Figure 44. Inputs and outputs from the biodiesel processing stage of the proposed LSBP facility.
7. ConclusionRegional communities throughout Australia are particularly vulnerable to the significant risks posed
by population growth, Peak Oil and Climate Change. Food security is just one of a number of issues
predicted to impact Victorian regional communities as a result of these three problems. Expected
medium to long term shortages of oil, and the fuels produced from it, are likely to have severe social
and economic impacts. In order to sustain agriculture and food production, alternative fuels will be
required.
Diesel engines power most agricultural equipment and as such a diesel fuel alternative that is 100%
compatible with the existing machinery stock would provide the most economically sound solution.
Biodiesel is one alternative fuel that can fulfil this role. With a growing number of farm machinery
manufacturers now providing warranty coverage for the use of blends of biodiesel and petroleum
diesel ranging from 5% (B5) to 100% (B100) biodiesel, the establishment of a local scale biofuels
production facility may have many advantages. Local biofuel production provides economic value
through job creation, skills training and by helping maintain the agricultural production that employs
35% of the workforce in the western region of Victoria. Environmental and social outcomes can also
BIODIESEL
PRODUCTION
ALGAE
OIL
METHANOL
POTTASIUM
HYDROXIDE
BIODIESEL
GLYCEROL
HEAT &
POWER
USED
COOKING
OIL
SURPLUS
CANOLA
OIL

RMIT Handbury Fellowship Program
Biofuels Feasibility Investigation
59 | P a g e
be achieved as biodiesel burns cleaner and has lower Greenhouse Gas emissions than petroleum
diesel.
Although biodiesel can be made using canola and other crops now grown in south western Victoria,
it is unlikely to be economically viable to do so due to high prices typically paid for canola and other
crop oils. An algae based Local Scale Biofuel Production Facility, along the lines of the concept
detailed in this report, may go some way to providing a solution to this problem. By ‘closing the
loop’ through onsite power and heat generation utilising the by-products of algae processing as a
fuel, biofuel production may itself be viewed as a by-product of electricity generation. Electricity
production may be further increased through the anaerobic digestion of green waste and food
organics which are currently disposed at landfill sites. Using green waste and food organics also
provides local councils with a means of dealing with a major problem in municipal waste
management. Excess electricity not used in the algae and fuel production process will then provide
a further source of income through selling to the grid. Removing nutrients from wastewater during
the algae growth cycle, and the production of a soil conditioner from the anaerobic digestion of
waste products, along with high quality biodiesel are further advantages of this system.
As a concept the Local Scale Biofuel Production facility should be economically, socially and
environmentally sustainable. However, in order to determine its true feasibility further information
is required.
7.1. Project FeasibilityThe Local Scale Biofuel Production Facility concept detailed in this report is a concept only. Further
research is required to determine if the concept is operationally feasible, and it may be the case that
only certain components of the facility i.e. the CHP plant, are economically viable. The following is a
list of questions requiring answers in order to advance the concept to a small scale trial suitable for
location at a wastewater treatment plant servicing a medium sized community:
Local Scale Biofuel Production Facility Size:
o What is the optimum economic size for an LSBP facility
Combined Heat and Power Plant:
o How much electricity will be required to operate a Local Scale Biofuel Production
facility?
o How much heat will be required to operate an LSBP facility?
o How much biogas/methane will be required to fuel a Combined Heat and Power
plant capable of running a LSBP facility?
o Is the production of biofuels the most economic use of the electricity and heat
produced by the CHP plant?
Methane Production:
o How much biomass is required to produce one litre of methane?
o How effectively can methane be produced from the anaerobic digestion of green
waste and food organics?
o What is the cost of processing green waste and food organics to make them
suitable for introduction to a digester?
o Is it feasible to use glycerol as a feedstock for anaerobic digestion?
o How much electricity and heat input is required to maintain anaerobic digestion?

RMIT Handbury Fellowship Program
Biofuels Feasibility Investigation
60 | P a g e
o What are the storage requirements for maturation/composting of digestate in
terms of land area and infrastructure?
Algae Production:
o What species of algae are suitable for use in the western districts of Victoria?
o If electricity production is the primary economic output of the facility, is the scale of
algae production important?
o Is the nutrient supply from a wastewater treatment plant sufficient to optimise
algae growth, or will supplemental nutrient inputs be required?
o Is the concept of using a carbon dioxide concentrator or ‘Synthetic Tree’ feasible for
this application?
o What other sources of carbon dioxide are available to optimise algae production?
o If carbon dioxide must be transported to site, what is the energy requirement and
economic implication of transport and storage?
o What scale of bioreactor is required to produce say 10,000 litres of algae oil per
day?
o What are the heat and energy requirements to sustain a bioreactor of this size?
o What is the optimum layout of such a reactor?
o Is an energy efficient greenhouse required to house the bioreactor?
Algae Processing:
o What is the current state of technology with respect to algae processing for
biofuels?
o What is the optimum economic size of an algae processing facility?
Biodiesel Production:
o What scale of production is economically viable?
o What is the current market for biodiesel in the local area?

RMIT Handbury Fellowship Program
Biofuels Feasibility Investigation
61 | P a g e

RMIT Handbury Fellowship Program
Biofuels Feasibility Investigation
62 | P a g e
BibliographyABARE. (2006). Farm Costs and Returns - Statistics. Canberra: Australian Bureau of Agriculture and
Resource Economics.
ABC. (2009b, July 10). Australian Oil Warning. Retrieved October 1, 2009, from Radio National:
Breakfast: http://www.abc.net.au/rn/breakfast/stories/2009/2622047.htm
ABC. (2009a, September/October). The People Power Transition. Organic Gardener , pp. 70-72.
ABS. (2009, June 3). Australian Bureau of Statistics. Retrieved August 5, 2009, from Population Clock:
http://www.abs.gov.au/ausstats/[email protected]/94713ad445ff1425ca25682000192af2/1647509ef7e25fa
aca2568a900154b63?OpenDocument
AgMRC. (2009, August). Corn, Ethanol and crude oil price relationships - implications for the biofuels
industry. Retrieved August 20, 2009, from Agricultural Marketing Resource Centre:
http://www.agmrc.org/renewable_energy/ethanol/corn_ethanol_and_crude_oil_prices_relationshi
ps__implications_for_the_biofuels_industry.cfm
Alg Bio. (2008, July 17). Algae bioreactor at night. Retrieved September 22, 2009, from YouTube:
http://www.youtube.com/watch?v=oCXTzpVyVM0
Algbay. (2008). Home. Retrieved September 22, 2009, from Algbay.com:
http://images.google.com.au/imgres?imgurl=http://www.algbay.com/Images/pbr/biofuels3.gif&img
refurl=http://www.algbay.com/Grow/Methods.aspx&usg=__HX_kM1N-
vZqrBt9H3kZmRW9UiCo=&h=411&w=562&sz=201&hl=en&start=40&um=1&tbnid=pGk30w7f0_RPk
M:&tbnh=97&tbnw=133&pre
Algenol Biofuels. (2009, June). Algenol Biofuels Home. Retrieved August 19, 2009, from Algenol
Biofuels: http://www.algenolbiofuels.com/
ASPO. (2009). ASPO International. Retrieved August 17, 2009, from Association for the Study of Peak
Oil: http://www.peakoil.net/
Astyk, S. (2006, December 28). Ethics of Biofuels. Retrieved August 24, 2009, from Energy Bulletin:
http://www.energybulletin.net/node/24169
BAA. (2009). Ethanol Plants in Australia. Retrieved August 20, 2009, from Biofuels Association of
Australia: http://www.biofuelsassociation.com.au/the-industry/ethanol-plants-in-australia.html
Beer, T., Grant, T., & Campbell, P. K. (2007). The greenhouse and air quality emissions of biodiesel
blends in Australia. Aspendale, Victoria: CSIRO.
Beer, T., Grant, T., Brown, R., Edwards, J., Nelson, P., Watson, H., et al. (2000). Life-cycle Emissions
Analysis of Alternative Fuels for Heavy Vehicles. Aspendale, Victoria: CSIRO Atmospheric Research.
Bentley, R. W. (2002). Global oil & gas depletion: an overview. Energy Policy 30 , pp. 189-205.
Biodiesel Logic Inc. (2005). BDL-55-PPS. Retrieved September 21, 2009, from Biodiesel Logic Inc:
http://www.biodiesellogic.com/Web%20Page/BDL55PPS%20Biodiesel%20Processor.htm

RMIT Handbury Fellowship Program
Biofuels Feasibility Investigation
63 | P a g e
Biodiesel Producers. (2008). Why Biodiesel. Retrieved September 18, 2009, from Biodiesel
Producers:
http://www.biodieselproducers.com.au/index.php?option=com_content&task=view&id=26&Itemid
=47
Biofuels Taskforce. (2005). Report of the Biofuels Taskforce to the Prime Minister. Barton, ACT:
Australian Government Biofuels Taskforce.
BioWorks. (2005). Processing Equipment. Retrieved September 21, 2009, from BioWorks:
http://www.bioworks.com.au/quickinks/processequip.shtml
BOM. (2009, September 33). Climate Statistics for Australian Locations. Retrieved September 22,
2009, from Australian Goverment Bureau of Meteorology:
http://www.bom.gov.au/jsp/ncc/cdio/cvg/av?p_stn_num=090103&p_prim_element_index=30&p_d
isplay_type=statGraph&period_of_avg=ALL&normals_years=allYearOfData&staticPage=
Briggs, M. (2004, August). Widscale Biodiesel Production from Algae. Retrieved September 21, 2009,
from Uiversity of New Hampshire Biodiesel Group:
http://www.unh.edu/p2/biodiesel/article_alge.html
California Energy Commission. (2002, April 22). A Students Guide to Alternative Fuel Vehcles.
Retrieved August 18, 2009, from Transportation Energy:
http://www.energyquest.ca.gov/transportation/LNG.html
Campbell, P. K., Beer, T., & Batten, D. (2009). Greenhouse gas sequestration by algae-energy and
greenhouse gas life cycle studies. Proc. 6th Australian Life-Cycle Assessment Conference. Aspendale,
Victoria: CSIRO.
Church, N. (2005, April 1). Why Our Food is so Dependent on Oil. Retrieved August 19, 2009, from
Energy Bulletin: http://www.energybulletin.net/node/5045
Clark, C. (1962). Early Uses of Electricity in American Agriculture. Technology and Culture, Vol. 3, No.
2. , 143.
College of the Desert. (2001, December). Moduel 3: Hydrogen Use in Internal Combustion Engines.
Connor, S. (2009, August 3). Warning: Oil supplies are running out fast. The Independent .
Cornell, C. B. (2008, April 15). Scania's Ethanol Diesel-Engine, Runs Biodiesel Too. Retrieved August
25, 2009, from Gas2.0 biofuels, oil, a revolution: http://gas2.org/2008/04/15/scanias-ethanol-diesel-
engine-runs-on-biodiesel-too/
CSIRO. (2009, March 4). Algae Could Fuel Cars and Jobs. Retrieved August 31, 2009, from CSIRO:
http://www.csiro.au/news/Biodiesel-from-algae.html
CSIRO. (2008). Fuel for Thought, The Future of Transport Fuels: challenges and opportunities. Future
Fuels Forum. Canberra: CSIRO Corporate Centre.

RMIT Handbury Fellowship Program
Biofuels Feasibility Investigation
64 | P a g e
CSIRO. (2009b, January 14). Gas Conversion and Processing: fuel for Australia's future. Retrieved
October 1, 2009, from CSIRO: http://www.csiro.au/science/Gas-Conversion-Processing-Fuel-
Future.html
DAF. (2006). Ethanol Production from Grain. Perth: Department of Agriculture and Food,
Government of Western Australia.
DAFF, A. G. (2007). Australian Food Statistics. Canberra, ACT: Australian Government Department of
Agriculture, Fisheries and Forestry.
DBRL. (2009). The Process. Retrieved August 26, 2009, from Dalby Bio-Refinery Limited:
http://www.dbrl.com.au/process.htm
Deffeyes, K. (2005). Beyond Oil: The View from Hubbert's Peak. New York: Hill and Wang.
Department of Climate Change. (2009a, August 12). Department of Climate Change. Retrieved
September 1, 2009, from Australian Government Department of Climate Change:
http://www.climatechange.gov.au/index.html
Department of Climate Change. (2009b). Tracking to Kyoto and 2020, August 2009: Australia's
Greenhouse Emissions Trends 1990 to 2008-12 and 2020. Canberra, ACT: DCC.
DEWHA. (2009, May 8). Diesohol. Retrieved August 31, 2009, from Australian Government,
Department of Environment, Water, Heritage and the Arts:
http://www.environment.gov.au/atmosphere/fuelquality/publications/diesohol.html
Diesel Gas Technologies. (2005). LPG Injection System for all Diesel Engines. Retrieved August 19,
2009, from Diesel Gas Technologies: http://www.dieselgas.com.au/home.htm
DSE. (2008). Climate Change in the Glenelg Hopkins Region. Melbourne: Victorian Government
Department of Sustainability and Environment.
Eco Tech. (Unknown). The power to answer some of our planets most important questions. Retrieved
September 18, 2009, from Eco Tech Biodiesel: http://www.ecotechbiodiesel.com/questions.htm
ed. Ludowyk, F., & Moore, B. (1998). The Australian Oxford Paperback Dictionary. Melbourne:
Oxford University Press.
EIA. (2009). International Energy Outlook 2009. Washington: US Energy Information Administration .
Elders. (2009, September 22). Weather. Retrieved September 2009, 2009, from Elders:
http://www.eldersweather.com.au/climate.jsp?lt=site&lc=90173
Elgas. (2009). What is LPG. Retrieved August 19, 2009, from Elgas Australia Home:
http://www.elgas.com.au/index.php?option=com_content&view=article&id=7&Itemid=3
English 202C. (Unknown). What is Anaerobic Digestion? Retrieved September 25, 2009, from English
202C: Technical Writing:
http://www.personal.psu.edu/set5099/blogs/english_202c_technical_writing/technical-
description.html

RMIT Handbury Fellowship Program
Biofuels Feasibility Investigation
65 | P a g e
FCIA. (2003, September 4). What is a Fuel Cell and How Does It Work? Retrieved September 3, 2009,
from Fuel Cell Institute of Australia: http://www.fuelcells.org.au/introduction-to-fuel-cells.htm
Flannery, T. (2008, August 31). Climate Change Update. (R. National, Interviewer)
Flesher, J. (2009, July 1). Scrubbing CO2 with Synthetic Trees. New York Times .
Flinders University. (2008, October 24). Flinders Research Boosts Biofuels Potential. Retrieved August
31, 2009, from Flinders News - Latest news from Flinders University:
http://blogs.flinders.edu.au/flinders-news/2008/10/24/flinders-research-boosts-biofuels-potential/
Fortenbery, T. R., & Park, H. (2008). The Effect of Ethanol Production on the U.S. National Corn Price.
Wisconsin: University of Wisconsin-Madison Department of Agricultural & Applied Economics.
Grant, T., Beer, T., Campbell, P. K., & Batten, D. (2008). Life Cycle Assessment of Environmental
Outcomes and Greenhouse Gas Emissions from Biofuels Production in Western Australia. Melbourne,
Victoria: CSIRO .
GRDC. (2009, September 21). Regional Panels. Retrieved September 21, 2009, from Grain Research
and Development Corporation: http://www.grdc.com.au/director/about/aboutus/panels
Greenshift Technologies. (2008). Clean Technologies. Retrieved September 22, 2009, from
Greenshift: http://www.greenshift.com/product_desc.php?mode=3
Handmade Projects. (Unknown). Biofuels. Retrieved September 18, 2009, from Journey to Forever:
http://journeytoforever.org/biofuel.html
Hooke, M. (2009, July 21). ABC Four Corners: The Good Earth. (S. Ferguson, Interviewer)
ISA. (2009, May 20). Algae to biofuel: A regional cause. Retrieved September 21, 2009, from InTech:
http://www.isa.org/InTechTemplate.cfm?Section=Technology_Update1&template=/ContentManag
ement/ContentDisplay.cfm&ContentID=76702
John Deere. (2009). What Every Biodiesel User Needs to Know. Retrieved August 27, 2009, from John
Deere: http://www.deere.com/en_US/rg/infocenter/biodiesel/every_biodiesel_user/index.html
Jones, A. (2009, January 24). Power Generation in Woking. (G. Doogue, Interviewer) Melbourne.
Keady, C., Williams, H., & Marshall, M. (2008). Relocalisation: Urban case studies, trends and local
government role. Melbourne: RMIT University School of Global Studies, Social Science and Planning.
Keane, B. (2009, January 20). Ethanol: Not really all that green. Retrieved September 2, 2009, from
Crikey: http://www.crikey.com.au/2009/01/20/ethanol-not-really-all-that-green/
Kearney, R. (2006). Biofuels re Good for the Economy, the Environment and the People. Sydney,
New South Wales, Australia: Department of Infectious Diseases and Immunology, The University of
Sydney.
Keeney, D., & Muller, M. (2006). Water Use by Ethanol Plants: Potential Challenges. Minneapolis:
The Institute for Agriculture and Trade Policy.
RMIT Handbury Fellowship Program
Biofuels Feasibility Investigation
66 | P a g e
Kimble, D. (2009, March 28). peakoil.org.au. Retrieved August 17, 2009, from www.peakoil.org.au:
http://www.peakoil.org.au/
Korzeniewsk, J. (2009, February 21). Worlds first hydrogen fuel cell tractor debuts in Italy. Retrieved
August 18, 2009, from Autobloggreen: http://green.autoblog.com/2009/02/21/worlds-first-
hydrogen-fuel-cell-tractor-debuts-in-italy/
Larsen, K., Ryan, C., & Abraham, A. (2008). Sustainable and Secure Food Systems for Victoria, what
do we know? What do we need to know? Melbourne, Victoria: Victorian Eco-Innovation Lab,
University of Melbourne.
Machine Design. (2009). Electric Motors - Service factors. Retrieved August 18, 2009, from Electric
Motors Reference Centre:
http://www.electricmotors.machinedesign.com/guiEdits/Content/bdeee1/bdeee1_4.aspx
Maidment, P., Puell, T., & Reifman, S. (2009). Crude Oil Prices 161-2009. Retrieved August 17, 2009,
from Forbes.com: http://www.forbes.com/2005/11/01/oil-prices-1861-today-real-vs-
nominal_flash.html
MBD Energy. (2009). Home. Retrieved September 21, 2009, from MBD Energy Limited:
http://www.mbdenergy.com/
Mushalik, M. (2009). Submission to the Fuel Inquiry: Peak Oil (2005-2008) and the Financial Crisis.
National Biodiesel Board. (1998). Summary of results from NBB/USEPA tier 1 health and
environmental effects testing for biodiesel under the requirements for USEPA registration of fuels and
fuel additives. U.S.A: NBB.
Natural Gas Supply Association. (2004). Natural Gas Information Resource. Retrieved August 18,
2009, from Natural Gas.org: http://www.naturalgas.org/index.asp
NBB. (2007, April 26). Biodiesel Production and Quality. Washington DC, U.S.A: National Biodiesel
Board.
NFF. (2009, August 6). Agriculture and the Carbon Pollution Reduction Scheme. Retrieved September
1, 2009, from National Farmers Federation: http://www.nff.org.au/read/2470657460.html
NREL. (2007). The Potential for Biofuels from Algae. San Fancisco: National Renewable Energy
Laboratory.
Oilgae. (Unknown). Algae Harvestingq. Retrieved September 22, 2009, from Oilgae:
http://www.oilgae.com/algae/har/har.html
Pimental, D., & Patzek, T. W. (March 2005). Ethanol Production Using Corn, Switchgrass, and Wood;
Biodiesel Production Using Soybean and Sunflower. Natural Resources Research Vol. 14, No. 1 , 65-
76.
Qld Department of Public Works. (2009, March 27). Building Projects. Retrieved September 22, 2009,
from Queensland Government Works Division:
http://www.build.qld.gov.au/research/research05.asp

RMIT Handbury Fellowship Program
Biofuels Feasibility Investigation
67 | P a g e
Riddoch, D. M. (2004, August 12). Australia: Oil: Living with Less. Melbourne Indymedia , p. 1.
Romm, J. J. (2004). The Hype About Hydrogen: fact and fiction in the race to save the climate.
Washington: Island Press.
Saunders, M. (2009, February 27). Hydrogen powered New Holland. Retrieved August 18, 2009, from
Weekly Times Now: http://www.weeklytimesnow.com.au/article/2009/02/27/56371_machine.html
Sauser, B. (2007, February 13). Ethanol Demand Threatens Food Prices. Technology Review -
Published by MIT .
Schulz, T. (2006). The economics of micro-algae production and processing into biodiesel. Perth:
Farming Systems, Department of Agriculture Western Australia.
SEAC. (2007). Energy Descent Action Planning. Retrieved September 28, 2009, from Sunshine Coast
Energy Action Group:
http://www.seac.net.au/main/index.php?option=com_content&task=view&id=61&Itemid=46
Shell. (Unknown). Gas to Liquids Fuel. Retrieved October 1, 2009, from Shell:
http://www.shell.com/home/content/aboutshell/our_business/oil_products/fuels/gtl/gas_to_liquid
s.html
Steinman, J. (2005, January 12). Sustainable Energy From Vegetable Oil. Retrieved August 27, 2009,
from Energy Bulletin: http://www.energybulletin.net/node/3986#d
SWRG. (2009). Waste Profile for the South Western Region. Hamilton, Victoria: South West Waste
Reduction Group.
Tickell, J. (2003). From the Fryer to the Fuel Tank: The complet guide to using vegetable oil as an
alternative fuel. New Orleans: Joshua Tickell Media Productions.
Transition Katoomba. (Unknown). Transition Towns. Retrieved September 28, 2009, from Transition
Katoomba: http://www.transitionkatoomba.org.au/transition_towns.htm
U.S. Census Bureau, P. D. (2006, November 22). US Census Bureau. Retrieved August 5, 2009, from
U.S. and World Population Clocks - POPClocks: http://www.census.gov/main/www/popclock.html
Umbers, A. (2007). Carbon in Australian Cropping Soils: a background paper prepared for the Grains
Council of Australia. Kingston, ACT: Grains Council of Australia.
Updike, K. (2000). International Harverster Tractors 1955-1985. Greater Minneapolis: MBI.
USQ. (1999). Public Health Engineering. Toowoomba: Distance Education Centre, The University of
Southern Queensland.
Utah State University. (2009). Algae Biofuels & Carbon Recycling: A summary of opportunities,
challenges, and research needs. Utah: Utah State University.
Wang, M., Wu, M., & Huo, H. (2007). Life-Cycle Energy and Greenhouse Gas Emission Impacts of
Different Corn Ethanol Plant Types. Environmental Research Letters , Vol. 2, no. 2.

RMIT Handbury Fellowship Program
Biofuels Feasibility Investigation
68 | P a g e
Weather Zone. (2009). Hamilton Airport Climate Data. Retrieved September 22, 2009, from Weather
Zone: http://www.weatherzone.com.au/climate/station.jsp?lt=site&lc=90173
Whiting, I. (2009, September 19). Hamilton Matures as a Cropping Region. Hamilton Spectator , pp.
19,31.
Whittington, T. (2006). Biodiesel Production and Use by Farmers: Is it worth considering? Perth:
Department of Agriculture and Food, Government of Western Australia.
Wikipedia. (2009b, August 17). Retrieved August 17, 2009, from 1973 Oil Crisis:
http://en.wikipedia.org/wiki/1973_oil_crisis
Wikipedia. (2009l, September 21). Anaerobic Digestion. Retrieved September 28, 2009, from
Wikipedia: http://en.wikipedia.org/wiki/Anaerobic_digestion#Feedstock
Wikipedia. (2009i, August 26). Biodiesel. Retrieved August 27, 2009, from Wikepedia :
http://en.wikipedia.org/wiki/Biodiesel
Wikipedia. (2009d, August 18). Biomass. Retrieved August 18, 2009, from Wikipedia:
http://en.wikipedia.org/wiki/Biomass
Wikipedia. (2009n, September 30). Coal. Retrieved October 1, 2009, from Wikipedia:
http://en.wikipedia.org/wiki/Coal#Liquefaction
Wikipedia. (2009h, June 2). Corn Ethanol. Retrieved August 26, 2009, from Wikipedia:
http://en.wikipedia.org/wiki/Corn_ethanol#Problems_associated_with_corn-derived_ethanol
Wikipedia. (2009c, August 16). Electric Vehicle. Retrieved August 18, 2009, from Wikipedia:
http://en.wikipedia.org/wiki/Electric_vehicle
Wikipedia. (2009g, August 10). Energy Content of Biofuel. Retrieved August 25, 2009, from
Wikipedia: http://en.wikipedia.org/wiki/Energy_content_of_biofuel
Wikipedia. (2009e, August 16). Ethanol. Retrieved August 19, 2009, from Wikipedia:
http://en.wikipedia.org/wiki/Ethanol_fuel
Wikipedia. (2009f, August 18). Ethanol Fuel in Brazil. Retrieved August 25, 2009, from Wikipedia:
http://en.wikipedia.org/wiki/Ethanol_fuel_in_Brazil
Wikipedia. (2006, July 27). File: Masnedo power station. Retrieved September 25, 2009, from
Wikipedia: http://en.wikipedia.org/wiki/File:Masned%C3%B8_power_station.jpg
Wikipedia. (2009k, August 29). Fuel Cell. Retrieved September 3, 2009, from Wikipedia:
http://en.wikipedia.org/wiki/Fuel_cell
Wikipedia. (2009m, August 26). Gas to Liquids. Retrieved October 1, 2009, from Wikipedia:
http://en.wikipedia.org/wiki/Gas_to_liquid
Wikipedia. (2009j, August 18). Hydrogen Vehicle. Retrieved September 3, 2009, from Wikipedia:
http://en.wikipedia.org/wiki/Hydrogen_vehicle

RMIT Handbury Fellowship Program
Biofuels Feasibility Investigation
69 | P a g e
Wikipedia. (2009a, August 12). Wikipedia. Retrieved August 17, 2009, from Global Financial Crisis of
2008-2009: http://en.wikipedia.org/wiki/Global_financial_crisis_of_2008–2009
Zlotnik, H. (2005, February 24). UN News Centre. Retrieved August 5, 2009, from UN News Service :
http://www.un.org/apps/news/story.asp?NewsID=13451&Cr=population&Cr1
Recommended


