Sponsor-backed REITs 1
INTERNATIONAL REAL ESTATE REVIEW
Financing Patterns and Property Acquisitions
of Sponsor-backed REITs: Evidence from
J-REIT Markets
Mamoru Nagano Faculty of Economics, Seikei University, 3-3-1 Kichijoji-Kitamachi Musashino City, Tokyo 180-8633, Japan, Tel/fax: +81-422-37-3924, +81-422-37-3874, Email: [email protected]
By using data on 51 real estate investment trusts (REITs) and 755 real estate deals from 2003–2011 in Japan, this study presents evidence that the funding approach decisions of a sponsor-backed REIT differ from those of a REIT without a sponsor. The implications derived from the presented empirical analyses are threefold. First, with regard to the determinants of the choice of the funding approach, under a continuous high stock price trend or a rise in the stock price of a REIT, the probability of choosing stock issuance increases when the REIT and sponsor firm strike real estate deals. Second, the literature asserts that real estate asset liquidity and debt choice are positively related. However, our results suggest that under a high stock price trend, a REIT chooses stock issuance even when it purchases real estate assets that have a high degree of liquidity. Third, debt issuance is chosen when a REIT and its sponsor firm make numerous and large real estate deals when the stock price of the REIT falls.
Keywords
Real Estate Investment Trusts, Stock Price, Stock Issuance, Debt Issuance,
Sponsor Firm
2 Nagano
1. Introduction
In this study, we investigate how the real estate investment trust (hereafter
REIT)–sponsor firm relationship relates to REIT financing patterns by
analyzing REIT funding approaches. Hence, the main purpose of the study is
to examine the REIT–sponsor firm relationship, funding approach, and stock
price by using REIT samples. Since real estate deal partners and shareholders
often overlap as sponsor firms, the shared interests of REITs and sponsor
firms have been debated since the establishment of the Japanese market over a
decade ago. However, in the present study, we extend the works of previous
authors by defining the sponsor firm as not only the major shareholder but
also a real estate deal partner as declared by each REIT itself in the disclosed
financial report. We also assume that the sponsor firm appoints a chief
executive officer (CEO) for the REIT.
The motivation of our study is to confirm a common REIT market structure
across countries by examining J-REIT markets. Wong et al. (2013) claim that
major shareholders perform a significant role in stock public offerings. While
they assume that REIT sponsor firms are the major shareholders, however,
sponsor firms, although often minor shareholders in Japan, have a great
influence over REIT management, because they typically also serve as the real
estate deal partners and appoint CEOs for the REITs. Although the
relationship between REITs and commercial banks has been examined by
Hardin and Wu (2010) and Ooi et al. (2010), and that between REITs and
external advisors has been discussed by Striewe et al. (2013), few scholars
have studied the relationship between REITs and other non-financial firms. In
the case of REITs in Japan, most sponsor firms are real estate businesses,
urban development businesses, or other businesses except banks and advisory
firms. Given the absence of conclusive findings on this topic, we are
motivated to focus on the prevailing funding approaches in order to
investigate the benefits and costs of the REIT–sponsor firm relationship.
Hence, we bridge this gap in the literature by presenting evidence that the
REIT–sponsor firm relationship influences the funding approach. In addition,
our findings confirm those of recent works on the REIT funding approach that
report a significant relationship with stock price.
We define the “sponsor firm” based on the following information material.
The regulatory framework of the Japanese Financial Supervisory Agency
stipulates that all publicly listed REITs must submit annual securities reports
to the supervisory authority besides publicly disclosing them. This framework
also requests the reporting of the names of sponsor firms that have common
interests with the REIT. We use this information along with annual financial,
daily stock price and real estate deal data from 2003–2011 to examine our
hypotheses. This dataset enables us to identify the firm from which a REIT
purchased the real estate, and investigate whether it is same as the sponsor
firm and how stock price is influenced by the real estate investment deal,
controlling for other possible determinants.

Sponsor-backed REITs 3
Specifically, by using the above dataset, we examine our hypotheses and
derive the following evidence. First, we present evidence that a continuous
high stock price trend or a rise in stock price determines the stock issuance of
the REIT and that the probability of selecting stock issuance further increases
when the funding for the real estate deal is provided by the sponsor firm.
Second, our evidence lends support to the hypothesis that stock issuance is
primarily chosen even when a REIT deals in real estate assets that have a high
degree of liquidity in the secondary market under a high stock price trend.
Third, the presented empirical results demonstrate that a low stock price
promotes either debt issuance or bank borrowing. Whether debt issuance or
bank borrowing is chosen, however, depends on the funding size.
The remainder of the paper is organized as follows. We review the existing
literature in the next section and show how they relate to our study in Section
3, where we also present our hypotheses. In Section 4, we introduce our
empirical strategy and present the data used to examine our propositions. In
Section 5, we report the empirical results, and discuss the results and present
the conclusions in Sections 6 and 7, respectively.
2. Literature Review 2.1 Stock Price, Sponsor Relationship, and Stock Issuance
Previous studies have discussed the relationship between stock price and stock
issuance decision, the impact of real estate liquidity on the debt to equity ratio,
and the determinants of debt issuance based on REIT samples. On the
relationship between stock price and the stock issuance decision, Billett et al.
(2007) and Dittmar and Thakor (2007) assert that stock issuers need to
achieve a certain future project revenue that is consistent with the views of
concentrated blockholders when they choose stock issuance. This so-called
disagreement theory considers any conflicts of interest between external
stakeholders and stock issuers, and thus, it supports the finding of a positive
relationship between the stock price of a firm and its stock issuance decision
only when issuers and shareholders share the same views about the future
profitability of the project.
Ambrose and Bian (2010) assert that an increase in stock price volatility
encourages managers to enhance future earnings management, and stock price
and future earnings are positively related as a result. While Ambrose and Bian
(2010) do not mention the relationship between the stock price trend and
funding approach, Boudry et al. (2010) and Ooi et al. (2010) both find a
positive relationship between stock price and the probability of stock issuance.
Their empirical evidence supports the timing theory, which confirms the
positive relationship between stock price and the probability of stock issuance
without considering conflicts of interest between shareholders and stock
issuers.

4 Nagano
Hardin and Wu (2010) and Ooi et al. (2010) consider the relationship between
REITs and external financial firms with regard to the influence on funding
patterns and conclude that the REIT–bank relationship influences the funding
approach decision. Hardin and Wu (2010) show evidence that REITs that have
strong business relationships with more than one commercial bank frequently
issue debt securities. Ooi et al. (2010) state that REITs that conclude credit
line contracts with at least one commercial bank rarely become insolvent and
enjoy easy access to external funding resources. These studies commonly
assert that the relationship with banks influences the funding approach
decision.
2.2 Impact of Real Estate Liquidity on Funding
Shleifer and Vishny (1992) theoretically assert that highly liquid tangible
assets allow a firm to have a high debt to equity ratio. Giambona et al. (2008)
also find empirical support for this theory based on REIT sample
observations. In addition, Brown and Riddiough (2003) conclude that the real
estate liquidity and debt to equity ratio of REITs are positively related. In
summary, the findings in the existing literature indicate that a higher degree of
real estate liquidity means a higher debt to equity ratio.
The existing literature employs various definitions of real estate liquidity.
Geltner et al. (2001) use the length of the maturity period of the property
leasing contract that each REIT concludes with final users to represent the
degree of REIT real estate asset liquidity. They conclude that a short leasing
maturity period enables REITs to renovate leasing property and that this
improves future financial strength, which positively influences the debt to
equity ratio. Likewise, Benmelch et al. (2005) use the level of residential
property regulations as a proxy for the degree of residential real estate
liquidity, while Giambona et al. (2008) explore and integrate property
regulations, leasing maturity periods, and other factors to ascertain the degree
of real estate liquidity.
2.3 Determinants of Debt Issuance and Bank Borrowing
The literature also asserts that stock issuance and debt issuance are explained
by different theories. Boudry et al. (2010) and Ooi et al. (2010) state that the
trade-off theory can be used to explain the debt issuance decisions of a REIT.
The conclusions of Boudry et al. (2010) and Ooi et al. (2010) imply that debt
issuance is not explained by the timing theory, whereas the trade-off theory
implies that debt issuance and the various costs of debt are negatively related.
Meanwhile, Bondt (2005), who studies the determinants of debt security
issuance for non-financial firms, finds that the costs of debt do not directly
influence the debt issuance decision, because initial fixed costs are embedded
when the firm initially issues securities. Thus, marginal costs do not increase
when the firm additionally issues debt securities following the disbursement
of these initial fixed costs. In addition, Davis (2001) and Bolton and Freixas

Sponsor-backed REITs 5
(2006) suggest that limited growth in domestic bank lending induces the
development of the debt security market regardless of the cost of debt. A
conclusion of their theoretical models asserts that many firms depend on
commercial bank borrowings in the initial stage of direct financing market
development. However, this fast-growing bank borrowing demand rapidly
exceeds the required bank capital, and these borrowers are accordingly forced
to turn to the debt security market.
3. Background and Hypotheses
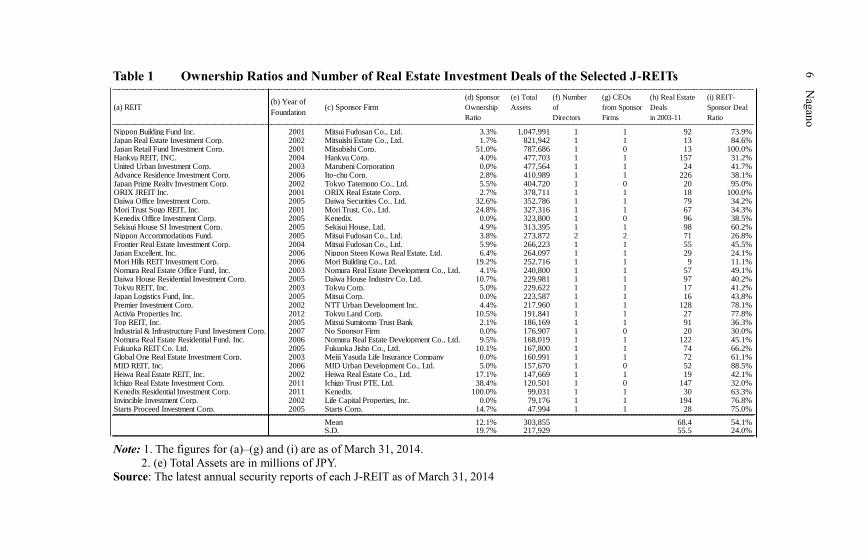
As shown in Table 1, the proportion of REIT–sponsor firm real estate deals is
54.1 percent, while 78.1 percent of REIT executive officers are sent by the
sponsor firms. This represents the uniqueness of the REIT market structure in
Japan. The average sponsor firm ownership ratio of REITs is 12.1 percent,
with the minimum ratios being 0.0 percent in the cases of the United Urban
Investment Corp. and Global One Real Estate Investment Corp. as of March
31, 2014. Table 1 suggests that while the sponsor firm ownership ratio alone
does not dominate the management of the subsidiary REIT, the opposite is
true when it is coupled with information that regard directors from sponsor
firms. This suggests that when the sponsor firm is a shareholder, however
minor, the firm might have an incentive to increase the REIT stock price
through the real estate deal. This is the background of our hypotheses in this
study.
Our first hypothesis concerns the relationships among stock price, REITs and
sponsor firms, and funding approaches. As mentioned in the previous section,
the literature on REIT funding approaches supports the timing theory. While
we share the view that stock price and the probability of stock issuance are
positively related, we also consider the degree to which the existence of
another determinant, namely, the REIT–sponsor firm relationship, influences
the stock issuance choice by including variables that represent this
relationship. Griffith et al. (2011) suggest that the REIT ownership structure
influences CEO compensation. By following the logic of Griffith et al. (2011),
we assume that the engagement with a deal partner influences the choice of
financial methodology of the REIT. Thus, we define the sponsor firm as a
shareholder and a real estate deal partner of the REIT that is explicitly
reported in the annual securities report as a stakeholder firm, which leads to
the following hypotheses.
Hypothesis 1: A REIT in which the real estate investment decision is made
under a continuous high stock price trend prefers stock issuance. The REIT is
more likely to choose it when the REIT and sponsor firm share interests in the
real estate investment deal.
6 Nagano
Note: 1. The figures for (a)–(g) and (i) are as of March 31, 2014.
2. (e) Total Assets are in millions of JPY.
Source: The latest annual security reports of each J-REIT as of March 31, 2014
(a) REIT(b) Year of
Foundation(c) Sponsor Firm
(e) Total
Assets
(f) Number
of
Directors
(g) CEOs
from Sponsor
Firms
(i) REIT-
Sponsor Deal
Ratio
Nippon Building Fund Inc. 2001 Mitsui Fudosan Co., Ltd. 3.3% 1,047,991 1 1 92 73.9%Japan Real Estate Investment Corp. 2002 Mitsuishi Estate Co., Ltd. 1.7% 821,942 1 1 13 84.6%Japan Retail Fund Investment Corp. 2001 Mitsubishi Corp. 51.0% 787,686 1 0 13 100.0%Hankyu REIT, INC. 2004 Hankyu Corp. 4.0% 477,703 1 1 157 31.2%United Urban Investment Corp. 2003 Marubeni Corporation 0.0% 477,564 1 1 24 41.7%Advance Residence Investment Corp. 2006 Ito-chu Corp. 2.8% 410,989 1 1 226 38.1%Japan Prime Realty Investment Corp. 2002 Tokyo Tatemono Co., Ltd. 5.5% 404,720 1 0 20 95.0%ORIX JREIT Inc. 2001 ORIX Real Estate Corp. 2.7% 378,711 1 1 18 100.0%Daiwa Office Investment Corp. 2005 Daiwa Securities Co., Ltd. 32.6% 352,786 1 1 79 34.2%Mori Trust Sogo REIT, Inc. 2001 Mori Trust, Co., Ltd. 24.8% 327,316 1 1 67 34.3%Kenedix Office Investment Corp. 2005 Kenedix. 0.0% 323,800 1 0 96 38.5%Sekisui House SI Investment Corp. 2005 Sekisui House, Ltd. 4.9% 313,395 1 1 98 60.2%Nippon Accommodations Fund. 2005 Mitsui Fudosan Co., Ltd. 3.8% 273,872 2 2 71 26.8%Frontier Real Estate Investment Corp. 2004 Mitsui Fudosan Co., Ltd. 5.9% 266,223 1 1 55 45.5%Japan Excellent, Inc. 2006 Nippon Steen Kowa Real Estate, Ltd. 6.4% 264,097 1 1 29 24.1%Mori Hills REIT Investment Corp. 2006 Mori Building Co., Ltd. 19.2% 252,716 1 1 9 11.1%Nomura Real Estate Office Fund, Inc. 2003 Nomura Real Estate Development Co., Ltd. 4.1% 240,800 1 1 57 49.1%Daiwa House Residential Investment Corp. 2005 Daiwa House Industry Co. Ltd. 10.7% 229,981 1 1 97 40.2%Tokyu REIT, Inc. 2003 Tokyu Corp. 5.0% 229,622 1 1 17 41.2%Japan Logistics Fund, Inc. 2005 Mitsui Corp. 0.0% 223,587 1 1 16 43.8%Premier Investment Corp. 2002 NTT Urban Development Inc. 4.4% 217,960 1 1 128 78.1%Activia Properties Inc. 2012 Tokyu Land Corp. 10.5% 191,841 1 1 27 77.8%Top REIT, Inc. 2005 Mitsui Sumitomo Trust Bank 2.1% 186,169 1 1 91 36.3%Industrial & Infrastructure Fund Investment Corp. 2007 No Sponsor Firm 0.0% 176,907 1 0 20 30.0%Nomura Real Estate Residential Fund, Inc. 2006 Nomura Real Estate Development Co., Ltd. 9.5% 168,019 1 1 122 45.1%Fukuoka REIT Co. Ltd. 2005 Fukuoka Jisho Co., Ltd. 10.1% 167,800 1 1 74 66.2%Global One Real Estate Investment Corp. 2003 Meiji Yasuda Life Insurance Company 0.0% 160,991 1 1 72 61.1%MID REIT, Inc. 2006 MID Urban Development Co., Ltd. 5.0% 157,670 1 0 52 88.5%Heiwa Real Estate REIT, Inc. 2002 Heiwa Real Estate Co., Ltd. 17.1% 147,669 1 1 19 42.1%Ichigo Real Estate Investment Corp. 2011 Ichigo Trust PTE, Ltd. 38.4% 120,501 1 0 147 32.0%Kenedix Residential Investment Corp. 2011 Kenedix. 100.0% 99,031 1 1 30 63.3%Invincible Investment Corp. 2002 Life Capital Properties, Inc. 0.0% 79,176 1 1 194 76.8%Starts Proceed Investment Corp. 2005 Starts Corp. 14.7% 47,994 1 1 28 75.0%
Mean 12.1% 303,855 68.4 54.1%S.D. 19.7% 217,929 55.5 24.0%
(d) Sponsor
Ownership
Ratio
(h) Real Estate
Deals
in 2003-11
Table 1 Ownership Ratios and Number of Real Estate Investment Deals of the Selected J-REITs
6 N
agan
o
Sponsor-backed REITs 7
Hypothesis 2: A REIT in which the real estate investment announcement
induces a stock price rise prefers stock issuance. The REIT is more likely to
choose it when the REIT and sponsor firm share interests in the real estate
investment deal.
Hypotheses 1 and 2 stand in direct opposition to the stylized facts presented in
the literature. According to Hypotheses 1 and 2, a REIT issues stock under a
high stock price trend and the REIT and sponsor firm share common interests,
even though the liquidity of the real estate asset is high. In this regard, the
consensus in the literature and Hypotheses 1 and 2 are conflicting. We follow
Shleifer and Vishny (1992), Brown and Riddiough (2003), and Giambona et
al. (2008) and use quantitative proxies in order to represent the degree of real
estate asset liquidity. Instead of adopting qualitative information on residential
property regulations and leasing maturity periods, we assume that the
frequency with which real estate assets are sold in the secondary market and
these transacted values can serve as an objective proxy of the degree of real
estate asset liquidity. Based on this quantitative information, we define the
real estate assets that have a high degree of real estate liquidity as office
buildings with the following two characteristics: they are located in the five
major wards of Tokyo, and they have trust beneficiary rights. It might be
better to employ a variable that represents the relationship between the sales
price of the real estate in the secondary market and the market value at that
time. However, due to data limitations, we proxy the real estate liquidity by
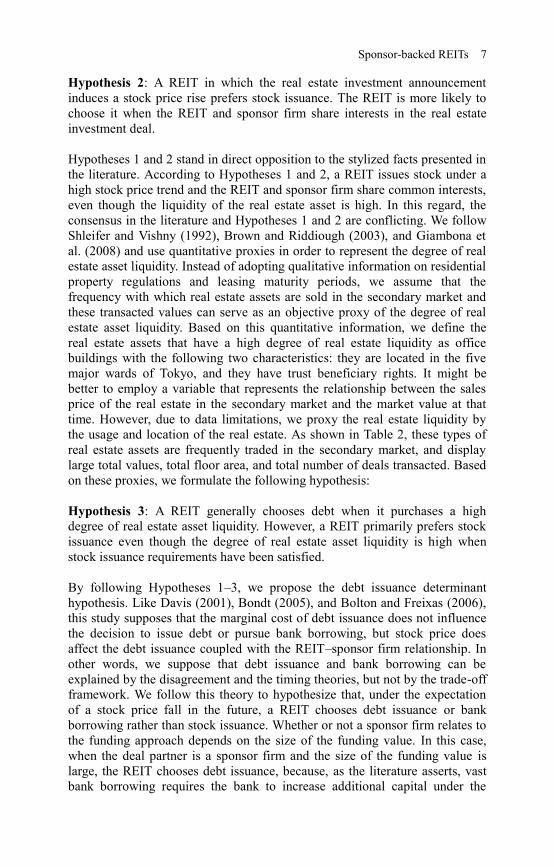
the usage and location of the real estate. As shown in Table 2, these types of
real estate assets are frequently traded in the secondary market, and display
large total values, total floor area, and total number of deals transacted. Based
on these proxies, we formulate the following hypothesis:
Hypothesis 3: A REIT generally chooses debt when it purchases a high
degree of real estate asset liquidity. However, a REIT primarily prefers stock
issuance even though the degree of real estate asset liquidity is high when
stock issuance requirements have been satisfied.
By following Hypotheses 1–3, we propose the debt issuance determinant
hypothesis. Like Davis (2001), Bondt (2005), and Bolton and Freixas (2006),
this study supposes that the marginal cost of debt issuance does not influence
the decision to issue debt or pursue bank borrowing, but stock price does
affect the debt issuance coupled with the REIT–sponsor firm relationship. In
other words, we suppose that debt issuance and bank borrowing can be
explained by the disagreement and the timing theories, but not by the trade-off
framework. We follow this theory to hypothesize that, under the expectation
of a stock price fall in the future, a REIT chooses debt issuance or bank
borrowing rather than stock issuance. Whether or not a sponsor firm relates to
the funding approach depends on the size of the funding value. In this case,
when the deal partner is a sponsor firm and the size of the funding value is
large, the REIT chooses debt issuance, because, as the literature asserts, vast
bank borrowing requires the bank to increase additional capital under the
8 Nagano
expectation of a stock price fall in the post-real estate deal period. This leads
to the fourth hypothesis.
Hypothesis 4: A REIT selects debt issuance under a stock price fall when the
current deal partner is the sponsor firm. Debt issuance is also preferred to
bank borrowing when the value of the real estate deal is large.
4. Empirical Strategy 4.1 Model
This study empirically investigates which factors influence stock and debt
issuance. To this end, we employ four independent variable groups, namely,
variables that relate to stock price (Xstock
), firm-specific (XREIT
), REIT real
estate asset type (Xtype
), and real estate deal (Xdeal
) factors. The following
empirical models are thus employed:
1 2 3 4 , 1, , 1, ( )stock REIT type deal
ij i i ij ij ijStock Issuance X β X β X β X β ε i N j K A
1 2 3 4 , 1, , 1, ( )stock REIT type deal
ij i i ij ij ijDebt Issuance X χ X χ X χ X χ μ i N j K B
Equations (A) and (B) are used to verify the determinants of stock issuance
(debt issuance). We do not estimate these two models simultaneously, because
the sequential estimation of (A) and (B) maximizes the observations of (A).
We employ Stock Issuance (Bond Issuance) as the dependent variable, which
equals one when the REIT finances the real estate investment by stock
issuance (debt issuance), and zero otherwise. Xstock
, XREIT
, Xtype
, and X
deal are
the independent variable groups.
For the variable group Xstock
, Stock Price is defined as the stock returns of
REIT i for 90 operating days prior to the announcement of the new real estate
investment j minus Tokyo Stock Exchange (TSE) REIT Index returns for
those 90 operating days. Stock Price is employed to verify Hypothesis 1.
Stock Issue Cost is defined as the inverse value of the price/earnings ratio of
REIT i in the financial year of real estate investment j minus 0.5 × the
averaged debt security interest rate of REITs that belong to the same credit
rating of REIT i in the year of real estate investment j minus 0.5 × long-term
bank borrowing contract interest rate of REIT i in the year of real estate
investment j. The definition of this variable is also explained in Table 3.
Tidwell et al. (2013) suggest that a credit rating change influences the trading
volume and price of securities, and borrowing interest rate of REITs. We thus
employ the averaged interest rates by credit rating. When the dependent
variable is Bond Issuance, we employ Bond Issue Cost instead of Stock Issue
Cost, which is defined as the averaged debt security interest rate of REITs that
belong to the same credit rating group of REIT i in the year of real estate
investment j minus 0.5 × the inverse value of the price/earnings ratio of REIT
i in the current financial year of real estate investment j minus 0.5 × long-term
bank borrowing contract interest rate of REIT i in the year of real estate
Sponsor-backed REITs 9
investment j. The definition of this variable is also explained in Table 3. The
distribution of the credit ratings of REITs that made real estate investments
from 2003–2011 is shown in Table 4.
Ooi et al. (2007) point out that the earnings of REITs are inversely related to
their stock prices when these prices are underpriced or overpriced.
Accordingly, Models (A) and (B) should employ various stock price proxies to
confirm robustness. Thus, to examine Hypothesis 2, we alternatively employ
the cumulative abnormal returns of REIT i when the REIT announces real
estate investment j. We employ the following event windows, because
cumulative abnormal returns reflect the deal announcement a few days before
the announcement. Two cumulative abnormal stock returns are employed. The
first is the 3-day cumulative abnormal returns CAR(-1,+1), which is defined
as the total value of the actual stock returns of REIT i minus its theoretical
stock returns on the day of, the day after, and the day before the
announcement of real estate investment j. The second is the 21-day
cumulative abnormal returns CAR(-10,+10), which is defined as the total
cumulative value of the actual stock returns of REIT i minus its theoretical
cumulative stock returns of 10 days on both sides of the day of the
announcement of real estate investment j, including the current day. The
theoretical stock returns of REIT i are predicted by estimating a linear
ordinary least squares (OLS) regression with REIT i and TSE REIT Index
returns for 250 operating day samples immediately before real estate
investment j.
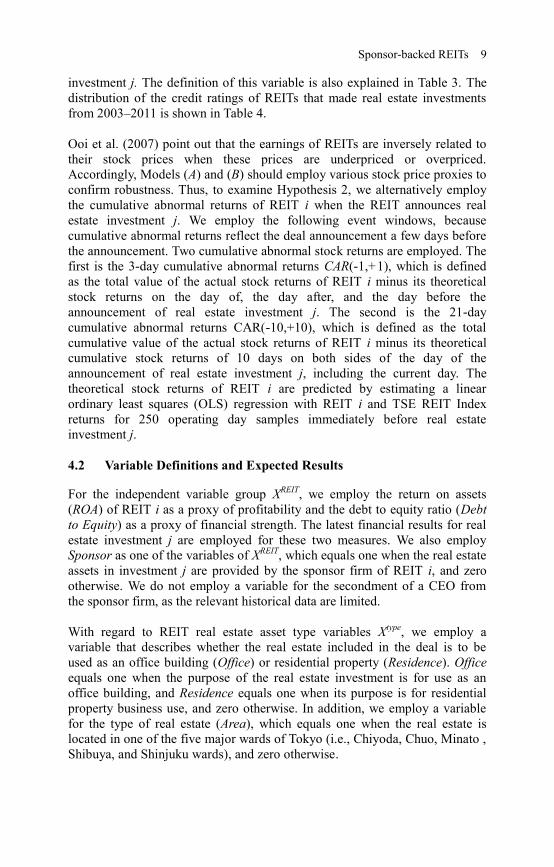
4.2 Variable Definitions and Expected Results
For the independent variable group XREIT
, we employ the return on assets
(ROA) of REIT i as a proxy of profitability and the debt to equity ratio (Debt
to Equity) as a proxy of financial strength. The latest financial results for real
estate investment j are employed for these two measures. We also employ
Sponsor as one of the variables of XREIT
, which equals one when the real estate
assets in investment j are provided by the sponsor firm of REIT i, and zero
otherwise. We do not employ a variable for the secondment of a CEO from
the sponsor firm, as the relevant historical data are limited.
With regard to REIT real estate asset type variables Xtype
, we employ a
variable that describes whether the real estate included in the deal is to be
used as an office building (Office) or residential property (Residence). Office
equals one when the purpose of the real estate investment is for use as an
office building, and Residence equals one when its purpose is for residential
property business use, and zero otherwise. In addition, we employ a variable
for the type of real estate (Area), which equals one when the real estate is
located in one of the five major wards of Tokyo (i.e., Chiyoda, Chuo, Minato ,
Shibuya, and Shinjuku wards), and zero otherwise.

10 Nagano
Purpose of Use Real Estate Type
A. Market Value Based 1 Office Building (64.5%) 1 Real Estate Trust Beneficiary Right (79.6%)
(Total: JPY 1.079 trillion) 2 Residential Property (24.3%) 2 Real Estate Asset (20.4%)
3 Commercial Facility (8.2%) 3 Others (0.0%)
B. Floor Area Based 1 Office Building (48.5%) 1 Real Estate Trust Beneficiary Right (78.7%)
(Total: 1,836 Thousands m2) 2 Residential Property (31.5%) 2 Real Estate Asset (21.2%)
3 Commercial Facility (11.9%) 3 Others (0.0%)
C. Number of Deals 1 Residential Property (41.3%) 1 Real Estate Trust Beneficiary Right (52.8%)
(Total: 305 Deals) 2 Office Building (20.7%) 2 Real Estate Asset (20.0%)
3 Commercial Facility (3.3%) 3 Others (27.2%)
Area Ownership Right
A. Market Value Based 1 Chiyoda, Chuo, and Minato Wards (47.3%) 1 100% Ownership for Both Land and Building (75.9%)
(Total: JPY 1.079 trillion) 2 Shibuya and Shinjuku Wards (10.3%) 2 100% Ownership Only for Land (19.5%)
3 Other 18 Tokyo Wards (11.9%) 3 Others (4.6%)
B. Floor Area Based 1 Chiyoda, Chuo, and Minato Wards (24.3%) 1 100% Ownership for Both Land and Building (88.6%)
(Total: 1,836 Thousands m2) 2 Shibuya and Shinjuku Wards (7.8%) 2 100% Ownership Only for Land (5.7%)
3 Other 18 Tokyo Wards (12.3%) 3 Others (5.7%)
C. Number of Deals 1 Chiyoda, Chuo, and Minato Wards (13.1%) 1 100% Ownership for Both Land and Building (56.1%)
(Total: 305 Deals) 2 Shibuya and Shinjuku Wards (14.4%) 2 100% Ownership Only for Land (9.2%)
3 Other 18 Tokyo Wards (8.5%) 3 Others (34.8%)
Source: Author’s calculations based on the TOREIT database provided by Tokyu Real Estate Inc.
Note:1. “Market Value Based” refers to the values of J-REIT real estate assets sold in a secondary market from 2001–2011 divided by total values of J-
REIT real estate assets sold. “Floor Area Based” denotes the floor areas of J-REIT real estate assets sold, and “Number Deals” denotes the
number deals J-REIT real estate assets sold.
2. The data on real estate deals for which the sales price fell by more than 20 percent compared with the purchased price are excluded from the
sample.
3. We employ the purpose of use and type of real estate assets traded in the secondary market as proxy variables of the degree of real estate
liquidity. This is because of our data limitation in calculating the degree of real estate liquidity.
Table 2 Ranking of J-REIT Real Estate Assets Sold in a Secondary Market by Type, Category, and Location from 2001–2011 10
Nag
ano
Sponsor-backed REITs 11
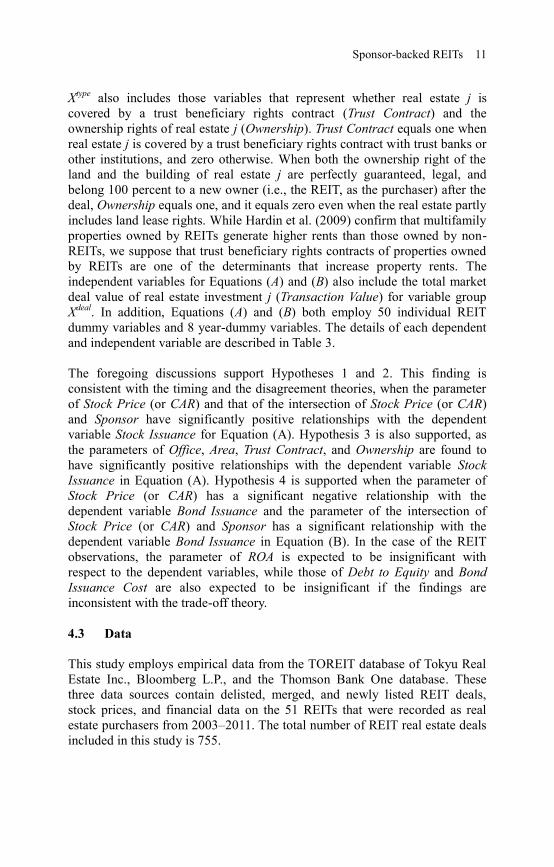
Xtype
also includes those variables that represent whether real estate j is
covered by a trust beneficiary rights contract (Trust Contract) and the
ownership rights of real estate j (Ownership). Trust Contract equals one when
real estate j is covered by a trust beneficiary rights contract with trust banks or
other institutions, and zero otherwise. When both the ownership right of the
land and the building of real estate j are perfectly guaranteed, legal, and
belong 100 percent to a new owner (i.e., the REIT, as the purchaser) after the
deal, Ownership equals one, and it equals zero even when the real estate partly
includes land lease rights. While Hardin et al. (2009) confirm that multifamily
properties owned by REITs generate higher rents than those owned by non-
REITs, we suppose that trust beneficiary rights contracts of properties owned
by REITs are one of the determinants that increase property rents. The
independent variables for Equations (A) and (B) also include the total market
deal value of real estate investment j (Transaction Value) for variable group
Xdeal
. In addition, Equations (A) and (B) both employ 50 individual REIT
dummy variables and 8 year-dummy variables. The details of each dependent
and independent variable are described in Table 3.
The foregoing discussions support Hypotheses 1 and 2. This finding is
consistent with the timing and the disagreement theories, when the parameter
of Stock Price (or CAR) and that of the intersection of Stock Price (or CAR)
and Sponsor have significantly positive relationships with the dependent
variable Stock Issuance for Equation (A). Hypothesis 3 is also supported, as
the parameters of Office, Area, Trust Contract, and Ownership are found to
have significantly positive relationships with the dependent variable Stock
Issuance in Equation (A). Hypothesis 4 is supported when the parameter of
Stock Price (or CAR) has a significant negative relationship with the
dependent variable Bond Issuance and the parameter of the intersection of
Stock Price (or CAR) and Sponsor has a significant relationship with the
dependent variable Bond Issuance in Equation (B). In the case of the REIT
observations, the parameter of ROA is expected to be insignificant with
respect to the dependent variables, while those of Debt to Equity and Bond
Issuance Cost are also expected to be insignificant if the findings are
inconsistent with the trade-off theory.
4.3 Data
This study employs empirical data from the TOREIT database of Tokyu Real
Estate Inc., Bloomberg L.P., and the Thomson Bank One database. These
three data sources contain delisted, merged, and newly listed REIT deals,
stock prices, and financial data on the 51 REITs that were recorded as real
estate purchasers from 2003–2011. The total number of REIT real estate deals
included in this study is 755.
12 Nagano
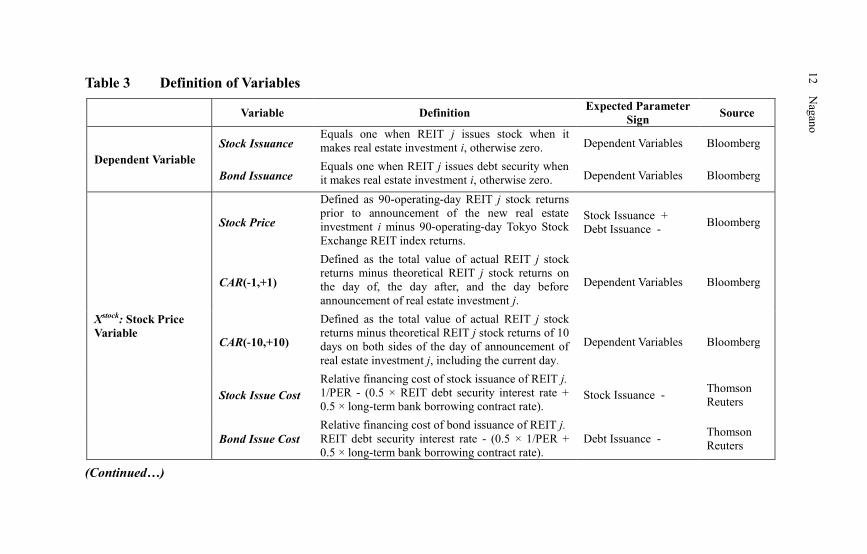
Table 3 Definition of Variables
Variable Definition Expected Parameter
Sign Source
Dependent Variable
Stock Issuance Equals one when REIT j issues stock when it
makes real estate investment i, otherwise zero. Dependent Variables Bloomberg
Bond Issuance Equals one when REIT j issues debt security when
it makes real estate investment i, otherwise zero. Dependent Variables Bloomberg
Xstock: Stock Price
Variable
Stock Price
Defined as 90-operating-day REIT j stock returns
prior to announcement of the new real estate
investment i minus 90-operating-day Tokyo Stock
Exchange REIT index returns.
Stock Issuance +
Debt Issuance - Bloomberg
CAR(-1,+1)
Defined as the total value of actual REIT j stock
returns minus theoretical REIT j stock returns on
the day of, the day after, and the day before
announcement of real estate investment j.
Dependent Variables Bloomberg
CAR(-10,+10)
Defined as the total value of actual REIT j stock
returns minus theoretical REIT j stock returns of 10
days on both sides of the day of announcement of
real estate investment j, including the current day.
Dependent Variables Bloomberg
Stock Issue Cost
Relative financing cost of stock issuance of REIT j.
1/PER - (0.5 × REIT debt security interest rate +
0.5 × long-term bank borrowing contract rate). Stock Issuance -
Thomson
Reuters
Bond Issue Cost
Relative financing cost of bond issuance of REIT j.
REIT debt security interest rate - (0.5 × 1/PER +
0.5 × long-term bank borrowing contract rate).
Debt Issuance - Thomson
Reuters
(Continued…)
12
Nag
ano
Sponsor-backed REITs 13
(Table 3 Continued)
Variable Definition Expected Parameter
Sign Source
XREIT: Firm-
specific Factor
Variable
ROA Return on assets of REIT j in the previous financial
year of real estate investment i. Security Issuance +/- Thomson
Reuters
Debt to Equity Debt to equity ratio of REIT j in the previous
financial year of real estate investment i
Stock Issuance +
Debt Issuance -
Thomson
Reuters
Sponsor Equals one when REIT j purchases real estate i
from sponsor firm of REIT j, otherwise zero. Stock Issuance +
Debt Issuance +/-
Tokyu Real
Estate Inc.
Xtype: Invested Real
Estate Type,
Category, and
Location Variable
Office Equals one when real estate i is for use as an office
building, otherwise zero. Stock Issuance +
Debt Issuance +/-
Tokyu Real
Estate Inc.
Residence Equals one when real estate i is for use as a
residential property, otherwise zero. Stock Issuance -
Debt Issuance +/-
Tokyu Real
Estate Inc.
Trust Contract Equals one when real estate i is covered by trust
beneficial rights, otherwise zero. Stock Issuance +/-
Debt Issuance +
Tokyu Real
Estate Inc.
Area
Equals one when real estate i is located in the five
major wards of Tokyo, i.e., Chiyoda, Chuo, Minato,
Shibuya, and Shinjuku wards; otherwise zero.
Stock Issuance +
Debt Issuance +/-
Tokyu Real
Estate Inc.
Ownership
Equals one when the ownership right of both the
land and the building of real estate i are perfectly
guaranteed and when it fully belongs to a new
owner, otherwise zero.
Stock Issuance +/-
Debt Issuance +
Tokyu Real
Estate Inc.
Xdeal: REIT Real
Estate Investment
i’s Deal Variables
Transaction
Value
Total Market Deal Value of Real Estate i
(thousands Japanese Yen) +
Tokyu Real
Estate Inc.
Note: “PER” denotes price earnings ratio of REIT i in year t and is defined as stock price of REIT i divided by earnings per share.
Sp
on
sor-b
acked
RE
ITs 1
3

14 Nagano
The TOREIT database covers all REIT real estate deal data from the period
2003–2011. The number of real estate deals dramatically increased from 32 in
2003 to 185 and 161 in 2006 and 2007, respectively. The number then
decreased to just 15 deals in 2009 and recovered to 30 and 32 deals in 2010
and 2011, respectively (Table 4). The TOREIT database includes deal data
along with information such as the announcement date, market value
(Transaction Value), type (Office or Residence), location (Area), relationship
with the sponsor firm (Sponsor), and other conditions (Trust Contract and
Ownership; Table 5).
Bloomberg data are used to ascertain security issuance information, daily
stock price, and TSE REIT index data. We obtain Stock Issuance and Bond
Issuance from this data source and also use it to calculate Stock Price, CAR(-
1,+1), and CAR(-10,+10) (Table 5). The Bloomberg data also provide the
credit ratings of Rating and Investment Information, Inc. (R&I), the Japan
Credit Rating Agency, Inc. (JCR), Standard and Poor’s Rating Services
(S&P), and Moody’s Investors Service (Moody’s) as well as interest rate data
on debt securities (Table 4). We obtain REIT financial data from the Thomson
One database. This database provides annual financial statement data on
REITs from 2003–2011, from which we calculate the stock issuance cost
(Stock Issue Cost), debt issuance cost (Bond Issue Cost), return on assets
(ROA), and debt to equity ratio (DER) (Table 5). We then match these various
data to empirically investigate our hypotheses.
Table 4 Annual Distribution of REIT Real Estate Deals by REIT
Credit Ratings
Note: We quote credit ratings from R&I, JCR, S&P, and Moody’s. The definitions of
the ratings provided by R&I, JCR, and S&P are consistent, while we redefine
that of Moody’s as Aa = AA, Baa = BBB, Ba = BB, and Caa = CCC. When a
REIT has ratings from more than two agencies, we count R&I as the first
priority, JCR as the second, and S&P as the third, according to the descending
order of the total number of credit ratings provided to REITs.
AA+ A+ BBB+ BB+ B+ CCC+
Total AA A BBB BB B CCC
AA- A- BBB- BB- B- CCC-
2003 32 5 12 0 1 0 0 14 2.011 1.855
2004 75 35 32 1 1 0 0 6 1.966 1.909
2005 128 43 56 18 5 0 0 6 1.994 1.906
2006 185 57 83 26 15 0 1 3 2.167 2.131
2007 161 42 72 29 14 0 1 3 1.993 1.997
2008 97 32 47 12 5 0 0 1 1.710 2.011
2009 15 6 5 2 1 0 0 1 1.923 1.903
2010 30 13 14 3 0 0 0 0 1.499 1.756
2011 32 9 19 3 0 0 0 1 1.271 1.333
Total 755 242 340 94 42 0 2 35 1.837 1.867
Average
Interest Rate
of Debt
Securities
Average
Interest Rate
of Bank
Borrowing
No
Credit
Ratings
Sponsor-backed REITs 15
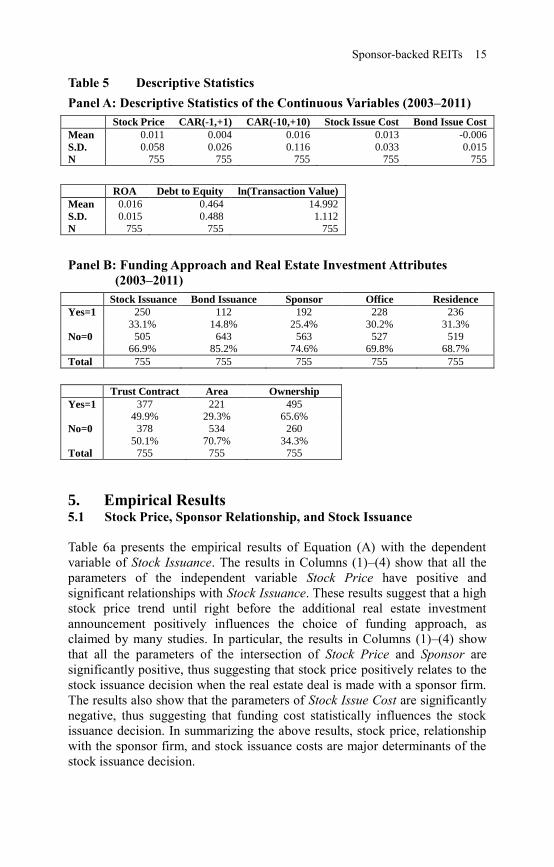
Table 5 Descriptive Statistics
Panel A: Descriptive Statistics of the Continuous Variables (2003–2011)
Stock Price CAR(-1,+1) CAR(-10,+10) Stock Issue Cost Bond Issue Cost
Mean 0.011 0.004 0.016 0.013 -0.006
S.D. 0.058 0.026 0.116 0.033 0.015
N 755 755 755 755 755
ROA Debt to Equity ln(Transaction Value)
Mean 0.016 0.464 14.992
S.D. 0.015 0.488 1.112
N 755 755 755
Panel B: Funding Approach and Real Estate Investment Attributes
(2003–2011)
Stock Issuance Bond Issuance Sponsor Office Residence
Yes=1 250 112 192 228 236
33.1% 14.8% 25.4% 30.2% 31.3%
No=0 505 643 563 527 519
66.9% 85.2% 74.6% 69.8% 68.7%
Total 755 755 755 755 755
Trust Contract Area Ownership
Yes=1 377 221 495
49.9% 29.3% 65.6%
No=0 378 534 260
50.1% 70.7% 34.3%
Total 755 755 755
5. Empirical Results 5.1 Stock Price, Sponsor Relationship, and Stock Issuance
Table 6a presents the empirical results of Equation (A) with the dependent
variable of Stock Issuance. The results in Columns (1)–(4) show that all the
parameters of the independent variable Stock Price have positive and
significant relationships with Stock Issuance. These results suggest that a high
stock price trend until right before the additional real estate investment
announcement positively influences the choice of funding approach, as
claimed by many studies. In particular, the results in Columns (1)–(4) show
that all the parameters of the intersection of Stock Price and Sponsor are
significantly positive, thus suggesting that stock price positively relates to the
stock issuance decision when the real estate deal is made with a sponsor firm.
The results also show that the parameters of Stock Issue Cost are significantly
negative, thus suggesting that funding cost statistically influences the stock
issuance decision. In summarizing the above results, stock price, relationship
with the sponsor firm, and stock issuance costs are major determinants of the
stock issuance decision.
16 Nagano
Moreover, the type of real estate Xtype
influences the funding decision as
follows. The results in Columns (1) and (3) of Table 6a indicate that Office
and Trust Contract significantly and positively influence stock issuance.
These variables solely influence the dependent variable of Stock Issuance,
while their parameters are also significant when these variables are intersected
with Sponsor. The average marginal effects of Stock Price on Stock Issuance
when Sponsor equals one also support the positive relationship among the
REIT–sponsor firm relationship, stock price, and stock issuance irrespective
of the value (zero or one) taken by Office and Trust Contract (see the lower
part of Table 6a). Neither the parameter of Residence nor that of the
intersection of Residence and Sponsor is significant in Column (2). The
parameter of Ownership is significantly negative, whereas that of the
intersection of Ownership and Sponsor is significantly positive in Column (4)
in Table 6a.
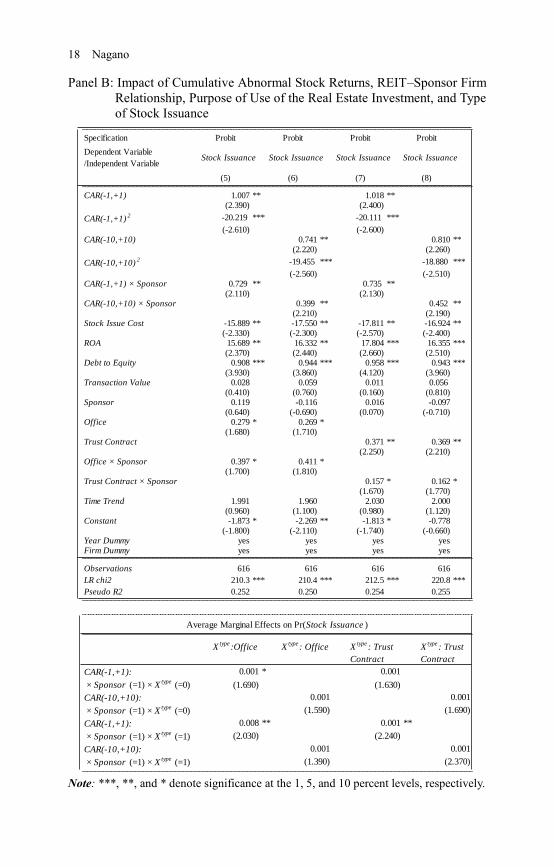
Table 6b presents the empirical results of Equation (A) with the independent
variables CAR(-1,+1) and CAR(-10,+10) instead of Stock Price. We did not
employ Residence, Ownership, Residence × Sponsor, and Ownership ×
Sponsor in this estimation, because the parameters of these variables are
reported as being insignificant in Columns (1)–(4). The results in Columns
(5)–(8) show that all the parameters of the independent variables of CAR(-
1,+1) or CAR(-10,+10) that represent a rise in stock price immediately before
and after the real estate investment announcement have a positive and
significant relationship with Stock Issuance. The results in Columns (5)–(8)
also show that all the parameters of the intersection of CAR(-1,+1) and
Sponsor as well as those of CAR(-10,+10) and Sponsor are both significantly
positive. These results suggest that the rise in stock price positively relates to
the stock issuance decision when the real estate deal is made with a sponsor
firm.
The results in Columns (5) and (6) also suggest that the intersection of Office
and Sponsor positively influences stock issuance, as does the intersection of
Trust Contract and Sponsor in Columns (7) and (8). The average marginal
effects of CAR(-1,+1) on Stock Issuance when Sponsor equals one also
indicate the positive relationship among the REIT–sponsor firm relationship,
rise in stock price, and stock issuance regardless of the value of Office shown
in the lower part of Table 6b. The average marginal effects of CAR(-10,+10)
on Stock Issuance when Sponsor equals one are also significantly positive
irrespective of the value (zero or one) that Trust Contract takes.

Sponsor-backed REITs 17
Table 6. Empirical Results: Stock Issuance Determinants
Panel A: Impact of Stock Price, REIT–Sponsor Firm Relationship, Purpose of
Use of the Real Estate Investment, and Type of Stock Issuance
Note: ***, **, and * denote significance at the 1, 5, and 10 percent levels, respectively.
Specification Probit Probit Probit Probit
Dependent Variable
/Independent VariableStock Issuance Stock Issuance Stock Issuance Stock Issuance
(1) (2) (3) (4)
Stock Price 4.662 *** 4.758 *** 4.288 ** 4.363 **(2.660) (2.710) (2.440) (2.490)
Stock Price2 61.676 *** 61.856 *** 62.312 *** 60.176 ***
(4.750) (4.750) (4.770) (4.630)Stock Price × Sponsor 9.897 *** 10.143 *** 11.787 *** 10.862 ***
(2.880) (2.970) (3.390) (3.170)Stock Issue Cost -11.762 * -13.093 * -13.115 * -13.373 *
(-1.660) (-1.710) (-1.700) (-1.740)ROA 17.611 *** 17.038 *** 20.379 *** 18.398 ***
(2.680) (2.560) (3.060) (2.810)Debt to Equity 0.840 *** 0.893 *** 0.861 *** 0.896 ***
(3.240) (3.450) (3.280) (3.440)Transaction Value 0.029 0.030 0.005 -0.003
(0.410) (0.420) (0.080) (-0.050)Sponsor 0.101 -0.086 -0.020 -0.463 *
(0.520) (-0.530) (-0.080) (-1.820)Office 0.376 **
(2.100)Residence -0.194
(-0.980)Trust Contract 0.508 ***
(3.160)Ownership -0.658 ***
(-3.600)Office × Sponsor 0.304 **
(2.090)Residence × Sponsor 0.146
(0.440)Trust Contract × Sponsor 0.010 **
(2.140)Ownership × Sponsor 0.524 *
(1.730)Time Trend 1.986 1.946 1.889 2.017
(0.970) (0.990) (1.040) (0.960)Constant -2.278 ** -2.097 * -2.190 ** -1.184 ***
(-2.190) (-1.880) (-2.110) (-1.090)Year Dummy yes yes yes yesFirm Dummy yes yes yes yes
Observations 755 755 755 755LR chi2 380.7 *** 377.3 *** 387.8 *** 389.5 ***Pseudo R2 0.394 0.391 0.402 0.403
Stock Price: X
type:Office X
type: Residence X
type: Trust
Contract
Xtype
: Ownership
× Sponsor (=0) × Xtype
(=0) 0.002 0.001 0.001 0.006
(1.410) (1.060) (0.500) (0.640)
× Sponsor (=1) × Xtype
(=0) 1.8E-04 * -0.001 1.6E-05 ** -0.002
(1.810) (-0.570) (2.010) (-1.120)
× Sponsor (=0) × Xtype
(=1) 0.001 0.001 4.2E-05 0.001
(1.360) (1.100) (0.040) (1.250)
× Sponsor (=1) × Xtype
(=1) 0.002 ** 0.000 0.002 * 0.001
(2.110) (-0.140) (1.930) (0.470)
Average Marginal Effects on Pr(Stock Issuance )
18 Nagano
Panel B: Impact of Cumulative Abnormal Stock Returns, REIT–Sponsor Firm
Relationship, Purpose of Use of the Real Estate Investment, and Type
of Stock Issuance
Note: ***, **, and * denote significance at the 1, 5, and 10 percent levels, respectively.
Specification Probit Probit Probit Probit
Dependent Variable
/Independent VariableStock Issuance Stock Issuance Stock Issuance Stock Issuance
(5) (6) (7) (8)
CAR(-1,+1) 1.007 ** 1.018 **(2.390) (2.400)
CAR(-1,+1)2 -20.219 *** -20.111 ***
(-2.610) (-2.600)CAR(-10,+10) 0.741 ** 0.810 **
(2.220) (2.260)
CAR(-10,+10)2 -19.455 *** -18.880 ***
(-2.560) (-2.510)CAR(-1,+1) × Sponsor 0.729 ** 0.735 **
(2.110) (2.130)CAR(-10,+10) × Sponsor 0.399 ** 0.452 **
(2.210) (2.190)Stock Issue Cost -15.889 ** -17.550 ** -17.811 ** -16.924 **
(-2.330) (-2.300) (-2.570) (-2.400)ROA 15.689 ** 16.332 ** 17.804 *** 16.355 ***
(2.370) (2.440) (2.660) (2.510)Debt to Equity 0.908 *** 0.944 *** 0.958 *** 0.943 ***
(3.930) (3.860) (4.120) (3.960)Transaction Value 0.028 0.059 0.011 0.056
(0.410) (0.760) (0.160) (0.810)Sponsor 0.119 -0.116 0.016 -0.097
(0.640) (-0.690) (0.070) (-0.710)Office 0.279 * 0.269 *
(1.680) (1.710)Trust Contract 0.371 ** 0.369 **
(2.250) (2.210)Office × Sponsor 0.397 * 0.411 *
(1.700) (1.810)Trust Contract × Sponsor 0.157 * 0.162 *
(1.670) (1.770)Time Trend 1.991 1.960 2.030 2.000
(0.960) (1.100) (0.980) (1.120)Constant -1.873 * -2.269 ** -1.813 * -0.778
(-1.800) (-2.110) (-1.740) (-0.660)Year Dummy yes yes yes yesFirm Dummy yes yes yes yes
Observations 616 616 616 616
LR chi2 210.3 *** 210.4 *** 212.5 *** 220.8 ***
Pseudo R2 0.252 0.250 0.254 0.255
Xtype
:Office Xtype
: Office Xtype
: Trust
Contract
Xtype
: Trust
Contract
CAR(-1,+1): 0.001 * 0.001
× Sponsor (=1) × Xtype
(=0) (1.690) (1.630)
CAR(-10,+10): 0.001 0.001
× Sponsor (=1) × Xtype
(=0) (1.590) (1.690)
CAR(-1,+1): 0.008 ** 0.001 **
× Sponsor (=1) × Xtype
(=1) (2.030) (2.240)
CAR(-10,+10): 0.001 0.001
× Sponsor (=1) × Xtype
(=1) (1.390) (2.370)
Average Marginal Effects on Pr(Stock Issuance )

Sponsor-backed REITs 19
3.2 Stock Price, Real Estate Asset Liquidity, and Debt Choice
Tables 7a and 7b present the empirical results of the determinants of debt
issuance. The major difference between Tables 6 and 7 is that the parameters
of Stock Price are all significantly negative for the results in Columns (9)–
(13) in Table 7a and (14)–(18) in Table 7b, whereas they are significantly
positive in Tables 6a and 6b. Meanwhile, none of the parameters of the
intersection of Stock Price and Sponsor is significant in Table 7a, but the
parameters of the intersection of CAR(-1,+1) and Sponsor are all negatively
significant in Table 7b, whereas they were positively significant in Tables 6a
and 6b. Stock Issue Cost negatively influences the choice of stock issuance
and the signs of the parameters are consistent with our expectations in Tables
6a and 6b; however, those of Bond Issue Cost are insignificant in Tables 7a
and 7b.
As for the relationship between debt and the type of real estate Xtype
, Column
(10) in Table 7a shows that Residence is negatively related to Bond Issuance,
which implies that debt issuance is avoided when the REIT invests in real
estate to be used as a residential property. The relationships between Bond
Issuance and all the other Xtype
variables are not significant, however, which
suggests that the type, area, and ownership right of real estate do not relate to
the choice of debt issuance as the funding approach. Meanwhile, the empirical
results presented in Columns (10) and (11) of Table 7a indicate that the
intersections of Residence and Sponsor and of Area and Sponsor positively
relate to Bond Issuance. Residence and Area are the only two variables that
influence debt issuance when the real estate deal is with the sponsor firm. The
remaining three empirical results in Table 7a suggest that none of the other
variables of Xtype
significantly influence the debt issuance decision.
Columns (9)–(13) in Table 7a and Columns (14)–(18) in Table 7b also
indicate that Debt to Equity has a positive relationship with Bond Issuance.
Thus, even a highly profitable REIT chooses debt issuance over stock
issuance, even under a high debt to equity ratio condition, for instance.
Moreover, while Tables 6a and 6b indicate that the relationship between
Transaction Value and Stock Issuance is not significant, that between
Transaction Value and Bond Issuance is positively related in Columns (9)–
(11) of Table 7a and Columns (14)–(15) and (17) of Table 7b. These results
suggest that a REIT tends to choose debt issuance when the deal value is
large.

20 Nagano
Table 7 Empirical Results: Debt Issuance Determinants
Panel A: Impact of Stock Price, REIT–Sponsor Firm Relationship, Purpose of
Use of the Real Estate Investment, and Type of Debt Issuance
Note: ***, **, and * denote significance at the 1, 5, and 10 percent levels, respectively.
Specification Probit Probit Probit Probit Probit
Dependent Variable
/Independent VariableBond Issuance Bond Issuance Bond Issuance Bond Issuance Bond Issuance
(9) (10) (11) (12) (13)
Stock Price -5.671 *** -5.331 *** -5.802 *** -5.939 *** -5.767 ***(-2.750) (-2.560) (-2.810) (-2.850) (-2.800)
Stock Price2 20.740 *** 20.839 *** 20.512 *** 20.614 *** 20.651 ***
(2.890) (2.870) (2.870) (2.850) (2.890)Stock Price × Sponsor -3.074 -3.508 -2.583 -1.909 -2.653
(-1.010) (-1.130) (-0.800) (-0.640) (-0.860)Bond Issue Cost 23.522 23.246 23.979 21.814 24.888
(1.560) (1.550) (1.540) (1.450) (1.610)ROA 18.580 * 15.315 17.225 19.994 * 17.127
(1.690) (1.330) (1.560) (1.840) (1.570)Debt to Equity 1.832 *** 1.920 *** 1.822 *** 1.803 *** 1.870 ***
(4.540) (4.610) (4.480) (4.470) (4.630)Transaction Value 0.119 ** 0.101 ** 0.077 * 0.114 0.097
(2.230) (2.020) (1.790) (1.180) (0.990)Sponsor 0.446 0.240 -0.056 -0.049 0.236
(1.550) (1.140) (-0.220) (-0.160) (0.730)Office 0.247
(0.880)Residence -0.581 *
(-1.680)Area 0.019
(0.090)Trust Contract 0.044
(0.180)Ownership -0.269
(-1.140)Office × Sponsor -0.259
(-0.700)Residence × Sponsor 0.310 ***
(2.630)Area × Sponsor 0.898 **
(2.350)Trust × Sponsor 0.551
(1.420)Ownership× Sponsor 0.051
(0.130)Time Trend 2.114 2.060 1.998 1.964 2.210
(1.160) (1.110) (1.190) (1.210) (1.150)Constant -5.632 *** -5.132 *** -4.891 *** -5.573 *** -4.964 ***
(-3.740) (-3.360) (-3.200) (-3.720) (-3.200)Year Dummy yes yes yes yes yesFirm Dummy yes yes yes yes yes
Observations 677 677 677 677 677LR chi2 297.9 *** 299.3 *** 305.2 *** 300.0 *** 298.6 ***Preudo R2 0.480 0.483 0.492 0.484 0.482
Stock Price: X
type:
Office
Xtype
:
Residence
Xtype
:
Area
Xtype
: Trust
Contract
Xtype
:
Ownership
× Sponsor (=0) × Xtype
(=0) -0.007 ** -0.010 ** -0.008 ** -0.008 ** -0.010 **
(-2.210) (-2.390) (-2.340) (-2.190) (-2.320)
× Sponsor (=1) × Xtype
(=0) -0.007 -0.017 -0.007 -0.010 -0.012
(-0.820) (-0.860) (-1.020) (-0.930) (-0.092)
× Sponsor (=0) × Xtype
(=1) -0.009 ** 0.004 ** 0.005 ** -0.008 ** -0.007 **
(-2.230) (2.380) (2.200) (-2.230) (-2.340)
× Sponsor (=1) × Xtype
(=1) -0.012 0.005 0.008 -0.011 -0.008
(-0.870) (0.520) (1.000) (-0.970) (-0.880)
Average Marginal Effects on Pr(Bond Issuance )

Sponsor-backed REITs 21
Panel B: Impact of Cumulative Abnormal Stock Returns, REIT–Sponsor Firm
Relationship, Purpose of Use of the Real Estate Investment, and Type
of Debt Issuance
Note: ***, **, and * denote significance at the 1, 5, and 10 percent levels, respectively.
Specification Probit Probit Probit Probit Probit
Dependent Variable
/Independent VariableBond Issuance Bond Issuance Bond Issuance Bond Issuance Bond Issuance
(14) (15) (16) (17) (18)
CAR(-1,+1) -6.800 * -6.284 *** -7.209 * -6.876 * -6.930 ***(-1.650) (-1.510) (-1.740) (-1.650) (-1.690)
CAR(-1,+1)2 78.863 81.815 * 80.812 82.474 * 83.981 *
(1.640) (1.680) (1.640) (1.700) (1.730)CAR(-1,+1) × Sponsor -20.339 *** -19.885 *** -20.895 *** -19.826 *** -21.287 ***
(-3.110) (-3.020) (-3.030) (-3.000) (-3.210)Bond Issue Cost 18.873 18.441 17.355 16.909 20.409
(1.180) (1.160) (1.050) (1.050) (1.270)ROA 9.980 6.853 8.626 12.107 8.253
(0.830) (0.560) (0.710) (1.010) (0.690)Debt to Equity 1.851 *** 1.966 *** 1.844 *** 1.782 *** 1.908 ***
(4.410) (4.560) (4.330) (4.230) (4.530)Transaction Value 0.127 ** 0.111 ** 0.093 0.127 ** 0.103
(2.330) (2.140) (0.950) (2.320) (1.060)Sponsor 0.374 0.233 -0.003 -0.113 0.386
(1.350) (1.100) (-0.010) (-0.380) (1.200)Office 0.160
(0.580)Residence -0.522
(-1.340)Area 0.158
(0.720)Trust Contract -0.051
(-0.210)Ownership -0.227
(-0.960)Office × Sponsor -0.158
(-0.430)Residence × Sponsor 0.213 **
(2.450)Area × Sponsor 0.717 *
(1.910)Trust × Sponsor 0.664
(1.520)Ownership× Sponsor -0.202
(-0.520)Time Trend 1.994 2.010 2.110 1.978 1.994
(1.130) (1.090) (0.994) (1.040) (1.160)Constant -5.752 *** -5.355 *** -5.271 *** -5.725 *** -5.156 ***
(-3.830) (-3.510) (-3.430) (-3.810) (-3.330)Year Dummy yes yes yes yes yesFirm Dummy yes yes yes yes yes
Observations 548 548 548 548 548LR chi2 241.8 *** 243.3 *** 249.5 *** 245.0 *** 244.0 ***Preudo R2 0.427 0.430 0.441 0.433 0.431
CAR(-1,+1): X
type:
Office
Xtype
:
Residence
Xtype
:
Area
Xtype
: Trust
Contract
Xtype
:
Ownership
× Sponsor (=0) × Xtype
(=0) -0.005 * -0.005 * -0.006 * -0.005 * -0.005 *
(-1.720) (-1.710) (-1.760) (-1.750) (-1.710)
× Sponsor (=1) × Xtype
(=0) -0.002 0.001 -0.001 -0.001 -0.001
(-0.570) (0.040) (-0.280) (-0.320) (-0.250)
× Sponsor (=0) × Xtype
(=1) 0.005 -0.005 0.006 -0.005 0.006
(1.490) (-1.220) (1.280) (-1.220) (1.500)
× Sponsor (=1) × Xtype
(=1) -0.001 0.002 2.1E-04 -0.001 -0.002
(-0.340) (0.600) (0.070) (-0.380) (-0.590)
Average Marginal Effects on Pr(Bond Issuance )

22 Nagano
6. Discussion
In terms of Hypotheses 1 and 2, our empirical results suggest that the
probability of stock issuance increases when the REIT continuously
experiences a high stock price trend or the investment announcement induces
a stock price rise. We interpret these results as supporting the timing theory
and being in agreement with the literature. In addition, the probability of stock
issuance further increases when the real estate deal partner is the sponsor firm
of the REIT. According to the disagreement theory, even with a high stock
price, a firm cannot choose stock issuance as its funding approach without
shareholder approval. While our empirical results lend some degree of support
to this case, we cannot conclude which explanatory power is larger, that of the
timing theory or that of the disagreement theory. By definition, the sponsor
firm of a REIT is not only the shareholder of the REIT but also its major real
estate deal partner. Moreover, the sponsor firm also sends its CEO to the
REIT, thus implying the existence of mutual interests. Our 755 REIT deal
observations statistically suggest that such stakeholder sponsors are involved
in real estate transactions, thereby influencing the stock issuance decision.
Our interpretation of these results is that the sponsor firm aims to maximize
shareholder value in this way. Accordingly, the commitment of the sponsor
firm is encouraged when the REIT chooses stock issuance as its funding
approach while purchasing real estate assets from the sponsor firm, because a
high stock price increases the shareholder value of the REIT, thus implying an
increase in the asset value of the sponsor firm. To achieve this goal, the REIT
sponsor firm provides not only real estate assets but also human resources and
other facilities in order to increase the shareholder value of the REIT. As of
March 31, 2014, the CEOs of 27 of the 33 REITs were appointed by their
respective sponsor firms (Table 1). In this regard, this REIT–sponsor firm
relationship is similar to the bank–firm relationship in Japan. Moreover, this
close-knit relationship influences the selection of stock issuance as the
funding approach.
Second, with regard to Hypothesis 3, our empirical evidence shows that a high
degree of real estate asset liquidity does not always promote debt issuance and
bank borrowing, but does often encourage stock issuance when the
requirements of Hypotheses 1 and 2 are satisfied. In this regard, we employ
various proxies of real estate asset liquidity (i.e., real estate type, area, and
legislative rights) based on the common characteristics of frequently traded
real estate in the secondary market, and we find that the degree of liquidity of
some types of real estate assets is positively related to those investment
returns. Consequently, contrary to the findings of Benmelch et al. (2005) and
Giambona et al. (2008), who assert a positive relationship between the degree
of real estate asset liquidity and the choice of the debt financing approach, our
empirical evidence suggests that a REIT chooses stock issuance when the real
estate investment is expected to increase stock returns even though it invests
in real estate with a high degree of real estate asset liquidity. Thus, our

Sponsor-backed REITs 23
empirical results suggest that this positive relationship influences the choice
of stock issuance and accordingly allow us to conclude that the degree of real
estate liquidity does not always dominate the funding approach, and stock
issuance is primarily preferred to debt issuance and bank borrowing even
when a REIT purchases liquid real estate assets.
Third, the empirical results for Hypothesis 4 suggest that the lower the stock
price, the higher the probability of selecting debt issuance as the preferred
funding approach. With regard to these empirical results, our interpretation is
as follows. Although bond issuance is not always chosen under the 90-
operating-day low stock price trend, even when dealing with the sponsor firm,
it is selected when the cumulative abnormal return immediately decreases
after the investment announcement and the real estate deal partner is the
sponsor firm. This finding implies that the funding approach decision of the
REIT and the sponsor firm is made immediately after the real estate
investment decision. Therefore, we conclude that Hypothesis 4 is partially
supported: bond issuance is explained by the timing and the disagreement
theories. In addition, the results also indicate that debt issuance costs
inconsistently influence the funding approach decision under the theoretical
framework, which suggests that a decrease in the costs of debt does not
always promote the debt issuance decision.
Fourth, our results implicitly suggest that most REITs unexceptionally choose
long-term bank borrowing when the requirements for stock issuance and debt
issuance are not satisfied (which is often the case). This is because REITs are
allowed to employ only three types of funding approaches: stock issuance,
bond issuance, and bank borrowing. REITs are requested to return internal
funds to investors for tax reasons. Therefore, the current real estate deal
partner and transaction value are the two main determinants of the choice of
long-term bank borrowing. The presented empirical results suggest that
transaction value size positively influences the choice of debt issuance,
whereas it does not significantly relate to stock issuance. Accordingly, it is
clear that long-term bank borrowing is consequently chosen when the deal
partner is not the sponsor firm and the transaction value is small. In other
words, commercial banks expect the REIT to make small real estate
investments when they conclude lending contracts with the REIT. Therefore,
the empirical results presented in Tables 6 and 7 suggest that long-term bank
borrowing is chosen under low stock price trends when the real estate
investment value is small and when it is used for generating low returns from
residential properties, for instance.
Therefore, in line with the findings presented by Billett et al. (2007) and
Dittmar and Thakor (2007), this study partially supports the disagreement
theory in the case of stock issuance and debt issuance. Moreover, we also
reconfirm the relevance of the timing theory in the cases of stock and debt
issuances in line with Asquith and Mullins (1986), Graham and Harvey
(2001), Baker and Wurgler (2002), and Gomes and Phillips (2012). We

24 Nagano
accordingly conclude that the choice of the funding approach for REITs in
Japan is explained by two existing theories, namely, the disagreement and the
timing theories. Our inference of these mixed findings is that previous studies
use REIT samples from the U.S., in which the sponsor–firm relationship is
unremarkable compared with the REIT market in Japan. We thus conclude
that the existence of the REIT–sponsor firm relationship causes different
funding behavior.
7. Conclusion
The REIT–sponsor firm relationship in the REIT market of Tokyo tends to be
negatively interpreted by practical investors. The major reasons for this
negative perception are explained by our conclusions. The REIT–sponsor firm
relationship influences the decision to favor stock issuance when stock price is
continuously high until immediately before the investment decision or an
announcement of a new real estate investment induces a stock price rise.
However, the relationship does not affect the bank borrowing decision.
Therefore, external investors tend to perceive that sponsor firms actively
perform and commit to the real estate transaction when highly profitable real
estate deals are made between the REIT and sponsor firm. However, they
commit passively as the REIT handles less profitable real estate assets with a
non-sponsor firm, and most external investors regard stock public offerings as
often being made in the latter case. Accordingly, this finding suggests that
REITs aim to maximize the profit of the sponsor firm. However, our
conclusions also imply that the REIT–sponsor firm relationship often
contributes to increasing the returns of external investors when the sponsor
aggressively provides real estate assets that maximize the corporate value of
REITs. Our remaining research interest therefore lies in understanding the
incentives of the sponsor and parent firms that provide highly profitable real
estate assets to be used as office buildings in the major wards of Tokyo, for
instance, to their REIT subsidiary. Understanding the incentives of these
sponsor firms would clarify the microstructures of the REIT market in Japan,
since most REIT sponsor firms are real estate agents, urban development
firms, and other firms involved in real estate businesses as well as the owners
of real estate assets.
Acknowledgement
The author thanks various seminar participants for their helpful comments and
suggestions. This research is financially supported by a grant-in-aid from the
Trust Companies Association of Japan.
Sponsor-backed REITs 25
References
Ambrose, B.W. and Bian, X. (2010), Stock Market Information and REIT
Earnings Management, Journal of Real Estate Research, 32, 1, 101-137.
Asquith, P., and Mullins, Jr. D.W. (1986), Signalling with Dividends, Stock
Repurchases, and Equity Issues, Financial Management, 15, 3, 27-44.
Baker, M.P., and Wurgler, J. (2002), Market Timing and Capital Structure, The
Journal of Finance, 57, 1, 1-32.
Benmelch, E., Garmaise, M.J. and Moskowitz, T.J. (2005). Do Liquidation
Values Affect Financial Contracts? Evidence from Commercial Loan
Contracts and Zoning Regulation, Quarterly Journal of Economics, 120, 10,
1121-1154.
Billett, M., King, T.D. and Mauer, D.C. (2007), Growth Opportunities and the
Choice of Leverage, Debt Maturity, and Covenants, The Journal of Finance,
62, 2, 697-730.
Bolton, P. and Freixas, X. (2006), Financial Architecture in Emerging Market
Economies, Working Paper 290, Inter-American Development Bank.
Bondt, G.D. (2005), Determinants of Corporate Debt Securities in the Euro
Area, The European Journal of Finance, 11, 6, 493-509.
Boudry, W.I., Kallberg, J.G. and Liu, C.H. (2010), An Analysis of REIT
Security Issuance Decisions, Real Estate Economics, 38, 1, 91-120.
Brown, D.T., and Timothy J.R. (2003), Financing Choice and Liability
Structure of Real Estate Investment Trusts, Real Estate Economics, 31, 3, 313-
346.
Davis, E.P. (2001), Multiple Avenues of Intermediation, Corporate Finance
and Financial Stability, IMF Working Paper, 01/115, International Monetary
Fund.
Dittmar, A.K., and Thakor, A.V. (2007), Why Do Firms Issue Equity, The
Journal of Finance, 62, 1, 1-54.
Geltner, D.M., Miller, N.G. and Clayton, J. (2001), Commercial Real Estate:
Analysis and Investments, Mason, OH: South-Western.
Giambona Erasmo, Harding, J.P. and Sirmans, C.F. (2008), Explaining the
Variation in REIT Capital Structure: The Role of Asset Liquidation Value,
Real Estate Economics, 36, 1, 111-137.
26 Nagano
Gomes, A. and Phillips, G. (2012), Why Do Public Firms Issue Private and
Public Securities? Journal of Financial Intermediation, 21, 4, 549-722.
Graham, J.R., and Harvey, C.R. (2001), The Theory and Practice of Corporate
Finance: Evidence from the Field, Journal of Financial Economics, 60, 2-3,
187-243.
Griffith, J.M., Najand, M. and Weeks, H.S. (2011), What Influences the
Changes in REIT CEO Compensation? Evidence from Panel Data, Journal of
Real Estate Research, 33, 2, 209-232.
Hardin III, W., Hill, M.D. and Hopper, J.J. (2009), Ownership Structure,
Property Performance, Multifamily Properties, and REITs, Journal of Real
Estate Research, 31, 3, 285-306.
Hardin III, W. and Wu, Z. (2010), Banking Relationships and REIT Capital
Structure, Real Estate Economics, 38, 2, 257-284.
Ooi, J.T.L., Webb, J.R. and Zhou, D. (2007), Extrapolation Theory and the
Pricing of REIT Stocks, Journal of Real Estate Research, 29, 1, 27-55.
Ooi, J.T.L., Ong, S. and Li, L. (2010), An Analysis of the Financing Decisions
of REITs: The Role of Market Timing and Target Leverage, The Journal of
Real Estate Finance and Economics, 40, 2, 130-160.
Shleifer, A. and Vishny, R.W. (1992), Liquidation Values and Debt Capacity:
A Market Equilibrium Approach, The Journal of Finance, 47, 4, 1343-1366.
Striewe, N.C., Rottke, N.B. and Zietz, J. (2013), Corporate Governance and
the Leverage of REITs: The Impact of the Advisor Structure, Journal of Real
Estate Research, 35, 1, 103-119.
Tidwell, A., Ziobrowski, A., Gallimore, P. and Ro, S. (2013), The Information
Content of REIT Credit Rating Actions and Transparency, Journal of Real
Estate Research, 35, 3, 365-391.
Wong, W., Ong, S. and Ooi, J.T.L. (2013), Sponsor Backing in Asian REIT
IPOs, Journal of Real Estate Finance and Economics, 46, 2, 299-320.
Recommended


![PLATINUM SPONSOR - Closte · LEVEL OF SPONSORSHIP [CHECK ONE]: q PLATINUM SPONSOR [$10000] q GOLD SPONSOR [$5000] q Breakfast Sponsor q Lunch Sponsor q Gift Sponsor q Auction Sponsor](https://img.dokumen.tips/doc/110x75/60014c66d50c102c412072c5/platinum-sponsor-closte-level-of-sponsorship-check-one-q-platinum-sponsor-10000.jpg)