1
Financial Ratios & Analysis - Accounting Play
www.AccountingPlay.com

2
Financial Ratios & Analysis - Accounting Play
www.AccountingPlay.com
Financial Ratios & Analysis
Accounting Play

3
Financial Ratios & Analysis - Accounting Play
www.AccountingPlay.com
Table of Content
Copyright and Legal ....................................................................................................................................... 7
Using Financial Ratios & Analysis ................................................................................................................... 8
Audio ......................................................................................................................................................... 8
Topics ........................................................................................................................................................ 8
Using Financial Ratios & Analysis ............................................................................................................... 8
About ............................................................................................................................................................. 9
Financial Ratios in Concept ............................................................................................................................ 9
Audio ......................................................................................................................................................... 9
Topics ........................................................................................................................................................ 9
Stakeholders .............................................................................................................................................. 9
Analysis .................................................................................................................................................... 10
Decision Making ...................................................................................................................................... 12
Why Use Financial Ratios ............................................................................................................................ 14
Audio ....................................................................................................................................................... 14
Topics ...................................................................................................................................................... 14
Initial Assessments .................................................................................................................................. 14
Entity Size ................................................................................................................................................ 16
Benefits and Limitations .............................................................................................................................. 18
Audio ....................................................................................................................................................... 18
Topics ...................................................................................................................................................... 18
Benefits ................................................................................................................................................... 18
Limitations ............................................................................................................................................... 19
Balance Sheet .......................................................................................................................................... 21
Income Statement ................................................................................................................................... 23
Industry Specific ...................................................................................................................................... 23
Users ........................................................................................................................................................... 24
Audio ....................................................................................................................................................... 24
Topics ...................................................................................................................................................... 24
Users of Financial Ratios .......................................................................................................................... 24
The Analyst .............................................................................................................................................. 25

4
Financial Ratios & Analysis - Accounting Play
www.AccountingPlay.com
Standard Financial Ratios by Category ........................................................................................................ 26
Audio ....................................................................................................................................................... 26
Topics ...................................................................................................................................................... 26
Introduction ............................................................................................................................................ 26
Liquidity ................................................................................................................................................... 26
Profitability .............................................................................................................................................. 26
Debt or Solvency ..................................................................................................................................... 27
Operating Performance ........................................................................................................................... 27
Cash Flow ................................................................................................................................................ 27
Valuation ................................................................................................................................................. 27
Industry Specific ...................................................................................................................................... 27
Summary ................................................................................................................................................. 27
Liquidity Ratios ............................................................................................................................................ 28
Audio ....................................................................................................................................................... 28
Topics ...................................................................................................................................................... 28
Introduction ............................................................................................................................................ 28
Current Ratio ........................................................................................................................................... 28
Quick Ratio .............................................................................................................................................. 30
Cash Ratio ................................................................................................................................................ 31
Times Interest Earned Ratio .................................................................................................................... 32
Profitability Ratios ....................................................................................................................................... 33
Audio ....................................................................................................................................................... 33
Topics ...................................................................................................................................................... 33
Introduction ............................................................................................................................................ 33
Profit Margin ........................................................................................................................................... 33
Gross Margin ........................................................................................................................................... 35
Effective Tax Rate .................................................................................................................................... 36
Return on Assets ..................................................................................................................................... 37
Return on Equity...................................................................................................................................... 38
DuPont Formula ...................................................................................................................................... 39
Return on Capital Employed .................................................................................................................... 40
Debt and Solvency Ratios ............................................................................................................................ 41
Audio ....................................................................................................................................................... 41
Topics ...................................................................................................................................................... 41

5
Financial Ratios & Analysis - Accounting Play
www.AccountingPlay.com
Introduction ............................................................................................................................................ 42
Debt Ratio ............................................................................................................................................... 42
Debt to Equity Ratio ................................................................................................................................ 43
Equity Ratio ............................................................................................................................................. 44
Capitalization Ratio .................................................................................................................................. 45
Cash Flow to Debt ................................................................................................................................... 46
Operating Performance Ratios .................................................................................................................... 48
Audio ....................................................................................................................................................... 48
Topics ...................................................................................................................................................... 48
Summary ................................................................................................................................................. 48
Fixed Assets Turnover Ratio .................................................................................................................... 49
Sales or Revenue per Employee .............................................................................................................. 50
Operating Cycle ....................................................................................................................................... 51
Cash Conversion Cycle ............................................................................................................................. 52
Account Receivable Turnover Ratio ........................................................................................................ 53
Accounts Payable Turnover Ratio ............................................................................................................ 54
Inventory Turnover Ratio ........................................................................................................................ 55
Cash Flow Ratios .......................................................................................................................................... 56
Audio ....................................................................................................................................................... 56
Topics ...................................................................................................................................................... 56
Summary ................................................................................................................................................. 56
Operating Cash Flow / Sales Ratio ........................................................................................................... 57
Free Cash-Flow / Operating Cash Ratio ................................................................................................... 58
Cashflow Coverage Ratio ......................................................................................................................... 59
Valuation Ratios .......................................................................................................................................... 60
Audio ....................................................................................................................................................... 60
Topics ...................................................................................................................................................... 60
Summary ................................................................................................................................................. 60
Price/Book Value Ratio ............................................................................................................................ 60
Earnings per Share .................................................................................................................................. 62
Price to Earnings per Share ..................................................................................................................... 63
Price/Earnings to Growth Ratio ............................................................................................................... 64
Price/Sales Ratio ...................................................................................................................................... 65
Dividend Yield Ratio ................................................................................................................................. 66

6
Financial Ratios & Analysis - Accounting Play
www.AccountingPlay.com
Dividend Payout Ratio ............................................................................................................................. 67
Enterprise Market Value ......................................................................................................................... 68
Financial Ratios in Closing ........................................................................................................................... 69
Audio ....................................................................................................................................................... 69
Topics ...................................................................................................................................................... 69
Summary ................................................................................................................................................. 69
Example Financial Statements ..................................................................................................................... 70
Balance Sheet .......................................................................................................................................... 70
Income Statement ................................................................................................................................... 71
Statement of Shareholders’ Equity .......................................................................................................... 72
Statement of Cash Flows ......................................................................................................................... 73
Accounting Glossary .................................................................................................................................... 74

7
Financial Ratios & Analysis - Accounting Play
www.AccountingPlay.com
Copyright and Legal
2015 John Gillingham, All Rights Reserved.

8
Financial Ratios & Analysis - Accounting Play
www.AccountingPlay.com
Using Financial Ratios & Analysis
Audio
Using Financial Ratios & Analysis
Topics
Using Financial Ratios & Analysis
Using Financial Ratios & Analysis
Financial Ratios & Analysis is a book based upon the App, Financial Ratio Flashcards. Both the book and
app covers the most important financial ratios using both flashcards along with written and audio
lessons that cover ratio analysis, calculation, and key points. Audio within the text links to streaming
online files (decent internet required). Get better functionality with the App or download files at
AccountingPlay.com.
The Accounting Play Guarantee: If this does not meet your expectation, email me subject title “Over It”
along with a receipt equivalent and I will refund you. Please let me know why and how we can do
better at [email protected]. Limit one product refund per household. Give us a week in case
we are off wifi at a silent meditation retreat (shhhhhh) in the distant mountains or surf.
Accounting, finance, general business, and MBA students can benefit from the illustrative formulas.
Examples draw from financial statements featured in the Accounting Flashcards module included in the
app. Other materials can be found on Kindle and PDF at AccountingPlay.com/Product. Be sure to
subscribe to gain access to free materials and stay posted on other resources such as the Accounting
Play Podcast.
This may be used as a standalone resource or coordinate with business related curriculums. Ratios
covered are often tested in standard exams such for becoming a CPA - Certified Public Accountant, CFA
– Chartered Financial Analysis, and Chartered Certified Accountants. Please feel free to reach out
personally to me at [email protected] and let us know how we are doing.

9
Financial Ratios & Analysis - Accounting Play
www.AccountingPlay.com
About
I took financial accounting three times as a history major and my grades were as follows: W, C, A. W
stands for withdrawn, if you don’t know. But after I received an A from an exceptionally clear instructor,
everything became easy, so long as I dedicated enough time and studied to learn. I drew pictures, read
financial statements of publically traded companies, sang songs, and listened to self-made recordings at
bedtime. I could not afford any more mistakes after graduating in history during a financial crisis. Three
years later I had worked in public accounting, passed all of my CPA exams on the first try, and nearly
completed a masters in accounting with a 3.9 GPA – all paid for with credit cards. Now I work for myself
and help students, life is good. With enough time and motivation there is nothing to stop you with this
particular profession, class, or topic. Please be sure to let me know how Accounting Play is helping you
learn on the App Store and ways we can do better by emailing. All illustrations are done by Courtney
Quirin.
Financial Ratios in Concept
Audio
Financial Ratios in Concept
Topics
Stakeholders
Analysis
Decision Making
Stakeholders
Financial ratios are designed to be useful to any stakeholders of a business. Broadly defined,
stakeholders may be anyone affected by the business: owners, employees, managers, creditors,
customers, government, and well, pretty much anyone or any entity. For business owners, efficiency
ratios may help analyze productivity by comparing important data such as the cost of goods sold and the
revenue of the company. Investors and creditors will look closely at ratios which measure financial
strength and profitability. Most ratios are created using financial statements prepared by accountants.
Audio

10
Financial Ratios & Analysis - Accounting Play
www.AccountingPlay.com
Financial ratios are relatively simple calculations if you have some experience with algebra. If not, the
formulas can be broken down step by step if the math appears intimidating. I may have taken the
beginning accounting class three times, but this was not due to any mathematical limitations.
The ratios covered use addition, subtraction, multiplication, and division.
Analysis
Ratios are used in the process known as analysis. Analysis has different forms or purposes including
financial, managerial, economic, market, and competitive. The most common ratios are covered, but
there are many other industry and investment specific ratios that exist. Some investors and analysts
(those that analyze financial data) may also create their own ratios not covered in standard textbooks.

11
Financial Ratios & Analysis - Accounting Play
www.AccountingPlay.com
Ratios are tools utilized by analysts as part of the analytical process to understand different aspects of a
business. Ratios are based on logical known relationships between financial statement line items such as
assets and liabilities or revenue and expense. Let’s take business assets versus liabilities, also known as
the acid test ratio (less exciting than it sounds). This ratio, also known as the debt to total assets ratio is
comparing two major categories. If a company has 10 Million in liabilities and 1 Million in assets, the
resulting ratio would be 10. An analyst could then compare this figure to other time periods or other
companies.

12
Financial Ratios & Analysis - Accounting Play
www.AccountingPlay.com
Decision Making
Financial ratios show the relationship between different data points in order to make decisions. A major
retail store for example, is constantly purchasing and selling inventory. The cost of this inventory, versus
how much they sell it for, is significant to both the business and outside investors. This relationship can
be expressed using gross profit margin.

13
Financial Ratios & Analysis - Accounting Play
www.AccountingPlay.com
Ratios should be useful to the end user. Small business owners can benefit from the use of a few basic
ratios such as debt to assets, accounts receivable turnover, and gross profit margin. Large publically
traded companies and related stakeholders will perform more in-depth analysis. Regardless of the
stakeholder, there will be some usefulness to financial ratios when used in the appropriate context.

14
Financial Ratios & Analysis - Accounting Play
www.AccountingPlay.com
Why Use Financial Ratios
Audio
Why Use Financial Ratios
Topics
Initial Assessments
Entity Size
Initial Assessments
Analysts and other users employ ratios to make initial assessments and to provide a starting point for
further analysis. Ratios can therefore play a supporting role in the decision making process. These initial
assessments provide insight into a company’s financial condition (balance sheet information) and
operating performance (income statement information), either for a single point in time or by comparing

15
Financial Ratios & Analysis - Accounting Play
www.AccountingPlay.com
multiple reporting periods. Examples of why external stakeholders (those outside the business) use
financial ratios could include investors looking for new attractive investment opportunities. Internal
stakeholders such as business managers can use analysis to compare actual to budgeted results. Product
or strategic planning can employ the use of these financial tools. Ratios may also be used to evaluate a
company relative to competitors (peer analysis). In other words, the results provide absolute and relative
information about a company.

16
Financial Ratios & Analysis - Accounting Play
www.AccountingPlay.com
Entity Size
Ratios and financial analysis is typically associated with large, publically traded companies, but other
entities can benefit as well. Other entities could include: small businesses, start-up businesses,
municipalities, nonprofit organizations, charitable organizations, non-governmental organizations, or
even a nightclub. In order to be useful, the ratios and analysis may be modified given the business size
and the purpose of the analysis. Inventory turnover for example, will be a useless ratio if the company
has no inventory and the times interest earned ratio won’t be relevant if a company has no debt.

17
Financial Ratios & Analysis - Accounting Play
www.AccountingPlay.com

18
Financial Ratios & Analysis - Accounting Play
www.AccountingPlay.com
Benefits and Limitations
Audio Benefits and Limitations
Topics Benefits
Limitations
Balance Sheet
Income Statement
Industry Specific
Benefits
Financial ratios are designed to provide users of information useful metrics to evaluate business activity
and health. The results provide a quick and consistent methodology for digging into somewhat complex
data and providing helpful insights to facilitate decisions. Projections (educated financial guesses about
the future) may also be made based upon historical results and the corresponding ratio. For example, a
stakeholder could use the current gross profit margin to project gross profit in the future based upon
revenue estimates.

19
Financial Ratios & Analysis - Accounting Play
www.AccountingPlay.com
Different stakeholders can benefit from different benefits of ratio analysis. The concepts apply to both
internal or intra-company analysis as well as inter-company or peer analysis. Comparing a company’s
financial ratios to a peer group is a standard analytical practice that helps give a basis for understanding
company-specific ratios. By using a relative comparison to a group of companies operating in similar
business lines, an analyst can form conclusions to help decision making. Comparisons are useful when in
the same peer group in terms of the products or services offered, size, and structure. A big publically
traded software company will be best compared against another big publically traded software
company, and so on.
Limitations
Ratios are based on historical information and history is never guaranteed to repeat itself. Historical
data can sometimes also include unusual or nonrecurring activities that may not be present going
forward. Ratios without context generally have limited value to stakeholders. A video cassette rental
company, for example could have strong financial ratios, but be put out of business almost overnight
with the release of DVDs and internet streaming. Financial ratios by themselves may not indicate such
an abrupt change and therefore must be interpreted along with other circumstances.
Ratios should be combined with other outside data points. Using gross profit margin to predict future
cost of goods sold based on revenue, for example, is logical but dangerous if other circumstances are
not considered. The ratio itself will not tell the analyst that current prices may have doubled due to

20
Financial Ratios & Analysis - Accounting Play
www.AccountingPlay.com
supply chain issues or political problems, for example. There have been many companies with strong
financial ratios that subsequently failed due to internal and external circumstances.
Ratios provide insights into business metrics, but typically require further analysis to be valuable. A
competent financial analyst understands that ratios often create more questions than answers and will
increase the scope of research and analysis where appropriate. Financial analysis starts are the
numbers, but takes into account other factors outside the balance sheet and income statement. The
notes to the financial statements for example can be a very important area of analytical information
that provide clues to the accounting methodology, lawsuits, plans, and other required disclosures. Micro
and macro political and economic trends will also factor into analysis, such as new law or interest rate
changes.

21
Financial Ratios & Analysis - Accounting Play
www.AccountingPlay.com
Balance Sheet
Ratios provide information at a single point in time or time period. Ratios that use balance sheet
accounts will be at a single point in time, because the balance sheet accumulates transactions up to a
point in time. For example, cash is a balance sheet account that is specified at a given date. An analyst
must pick a point in time that is relevant for the given analysis, such as December 31, a typical calendar
year end. If only one point in time was analyzed the results might not be useful unless compared to
several other time periods. Cash, for example, at a given date could fluctuate due to many
circumstances such as: financing, investing, or operating changes. Financial analysts will therefore draw
on different time periods for testing and use average balances for specific ratios, such as when
calculating accounts payable turnover.

22
Financial Ratios & Analysis - Accounting Play
www.AccountingPlay.com

23
Financial Ratios & Analysis - Accounting Play
www.AccountingPlay.com
Income Statement
Income statement ratios are based on a period of time and the resulting calculations will be heavily
dependent on the time period selected. Seasonal businesses such as resorts or gift based businesses will
have large fluctuations depending on the time of year. A ski resort may have losses in summer and
booming profits in winter. Analysts must therefore understand limitations of ratios based upon the
given time period and adjust their conclusions. Several different points in time and time periods for
analysis may be used to see how a business is changing over time. Comparing ratios over a number of
reporting periods, such as 3-5 years is a standard practice. This is known as trend analysis and may be
both represented in numeric and graphical formats. Users will look for standard trends to see whether a
business is improving or declining over several different areas of performance.
Industry Specific
The same ratio calculations can have a different meaning or interpretation depending on the target
company’s industry. It is therefore important for the user to properly understand specific details about
that industry. For example, an accounting firm is not the same as an office furniture manufacturer. The
distinctions need to be understood when applying ratios. Ratios are a tool for analysis and likely have
limited value unless all facts and circumstances are considered.

24
Financial Ratios & Analysis - Accounting Play
www.AccountingPlay.com
Users
Audio Users
Topics Users of Financial Ratios
The Analyst
Users of Financial Ratios
Stakeholders are users of financial information with an interest in better understanding a company or
organization. Internal users can include division managers and executive officers. External users such as
bankers and other lenders rely heavily on financial ratios when making loan and other credit decisions.
Investors employ financial ratios when reviewing existing investment positions or evaluating new
opportunities. Less obvious parties could include a raw material supplier who may want to gauge the
quality of a new client. Ratios can be applied to charitable organization to evaluate their operating
efficiency. The type and extent of financial analysis with ratios will be dependent upon the end goals of
the users.

25
Financial Ratios & Analysis - Accounting Play
www.AccountingPlay.com
The Analyst
Financial analysts serve the role of analyzing financial data in a variety of different capacities. An analyst
may specialize in some or more of the following: investment, securities, research, equity, rating, and
others. Analysts may work within a company providing internal analytics or outside, using publically
available information. Generally they are charged with finding value in their research so that decisions
may be made. Internally, analysts may conclude, for example, that revenue is projected to increase and
that staffing must be adjusted. An outside analyst may conclude that a particular stock is undervalued
and therefore be purchased. Analysts typically, but not always, hold an economics, finance, or business
related degree. The Chartered Financial Analyst (CFA) designation may also be obtained when certain
testing and work experience requirements are made.

26
Financial Ratios & Analysis - Accounting Play
www.AccountingPlay.com
Standard Financial Ratios by Category
Audio
Standard Financial Ratios by Category
Topics
Introduction
Liquidity
Profitability
Debt or Solvency
Operating Performance
Cash Flow
Valuation
Industry Specific
Summary
Introduction
For the purposes of this presentation, ratios will be grouped into main categories. They all serve to use
quantitative data to make qualitative assessments.
Liquidity
Liquidity ratios are used to evaluate how well a company is able to meet its short-term financial
obligations.
Profitability
Profitability ratios are used to identify the level and quality of earnings.

27
Financial Ratios & Analysis - Accounting Play
www.AccountingPlay.com
Debt or Solvency
Debt or Solvency ratios give insight into financial leverage and ability to meet long-term debt
obligations.
Operating Performance
Operating Performance ratios identify aspects of operations and efficiency, and insight into the timing of
cash inflows and outflows.
Cash Flow
Cash Flow ratios identify relative cash positions.
Valuation
Valuation ratios are concerned with identifying company valuation mostly from an investment
perspective.
Industry Specific
Ratios that provide information specific to certain industries that may not apply to all businesses.
Summary
The groupings are designed to be useful, but should not limit the use of a ratio that may provide
information across two categories, such as both solvency and operating performance.

28
Financial Ratios & Analysis - Accounting Play
www.AccountingPlay.com
Liquidity Ratios
Audio
Liquidity Ratios
Topics
Introduction
Current Ratio
Quick Ratio
Cash Ratio
Times Interest Earned Ratio
Introduction
Liquidity ratios measure company’s ability to meet its short-term obligations (liquidity). Understanding
liquidity is important because it shows the degree to which a company can be expected to pay creditors
(or suppliers, via accounts payable), and to do so per agreed terms. This can influence a company’s
ability to maintain operations going forward. Liquidity directly impacts the ability to service debt
payments. Problems with liquidity are a warning sign, often a first indication of significant operational
problems. This is especially relevant to lenders and creditors who are concerned mostly with being paid
back.
Current Ratio
The current ratio (also known as the working capital ratio) is the broadest measure of short-term
liquidity because it takes into consideration all available liquid assets, including inventory and accounts
receivable. It is helpful in estimating liquidity over the production cycle or an annual period, but
arguably less helpful in the more immediate short-term. Users such as lenders or creditors are less
focused on this measure because of its broader scope.
In healthy companies, this ratio result should be in excess of 1.5x; if not, then there is reason for concern
and the analyst will investigate matters to determine the issues behind the low result. A ratio value of
less than 1.0x is a warning sign that indicates the company could have difficulty meeting its short-term
obligations.

29
Financial Ratios & Analysis - Accounting Play
www.AccountingPlay.com
The user should make an effort to understand the composition of this ratio’s numerator. For example, it
may be possible that receivables or inventory comprise too large of a portion of working capital. In other
words, it is important to understand if less liquid components comprise the bulk of liquid assets,
particularly when the ratio result is strong.
Measure of short-term liquidity using all available liquid assets (inventory and receivables
included)
Generally favorable: higher result
Result of 1.5x-3.0x is generally considered optimal by stakeholders such as: bankers and lenders
concerned about loan repayments
Also known as the working capital ratio

30
Financial Ratios & Analysis - Accounting Play
www.AccountingPlay.com
Quick Ratio
The quick ratio is a more conservative liquidity indicator because it excludes inventory from the
numerator. Inventory is generally less liquid than accounts receivable. A result of 1.0x would be
considered breakeven but any concerned party will want to see results in excess of 1.2x at a minimum.
Measure of short-term liquidity
Generally favorable: higher result
More conservative (errors on side of caution) compared to other liquidity measures, because it
does not include inventory
Result of 1.2x is generally considered safe by stakeholders, particularly bankers and lenders who
are concerned about loan repayments
Also known as the acid test ratio

31
Financial Ratios & Analysis - Accounting Play
www.AccountingPlay.com
Cash Ratio
The cash ratio measures cash and cash equivalent balances relative to current liabilities. It is an extreme
liquidity ratio because other generally liquid assets like accounts receivable and inventory are excluded
from the numerator. It measures the ability of a business to repay its current liabilities by only using its
cash and cash equivalents.
Cash equivalents are assets which can be converted into cash quickly, whereas current liabilities are
liabilities which are to be settled within 12 months or the business cycle. A cash ratio of 1.0x is
breakeven, meaning the company could satisfy its current liabilities in full using only cash and
equivalents. The ratio is usually below 1.0x because cash is tied up in some degree in components that
make up the process of production. A result close to 0.5x is considered normal.
Measure of short-term liquidity
More conservative (errors on side of caution) compared to other liquidity measures (current
ratio, quick ratio) because it only includes cash and equivalents in the numerator
Result generally well under 1.0x

32
Financial Ratios & Analysis - Accounting Play
www.AccountingPlay.com
Times Interest Earned Ratio
The times interest earned ratio a basic measure of the ability to cover interest payments. The ratio is
especially relevant for bankers and other lenders, all of whom will have minimum repayment standards.
For such users, a minimum coverage ratio result might be 1.25x, and in general somewhere around 2.0x
would be considered optimal. If the ratio is too high it might indicate that a company is not taking
advantage of financing or leverage.
Times interest earned does not include principal payments, so using this ratio only for situations where a
company has contractual principal reduction payments would serve to overstate the “debt coverage.”
Additionally, if trend analysis shows increased borrowings in the most recent period, along with a
decline in the ratio result, one can give thought to whether or not the potential earnings impact
resulting from the new borrowings has yet been fully realized or not.
Measures a company’s ability to use earnings to cover interest expense obligations
Generally favorable: higher result
Preferred result generally a minimum of 1.25x by lenders and bankers

33
Financial Ratios & Analysis - Accounting Play
www.AccountingPlay.com
Profitability Ratios
Audio
Profitability Ratios
Topics
Introduction
Profit Margin
Gross Margin
Effective Tax Rate
Return on Assets
Return on Equity
DuPont Formula
Return on Capital Employed
Introduction
Profitability is a measure of net earnings, relative to components used to generate earnings. Profitability
is also a measure of efficiency, providing evidence for how well a company utilizes things like assets or
equity in order to generate both revenue and profit.
Measuring or evaluating profitability is important for gauging the quality of a company, as well as
providing a basis for valuation as an enterprise or investment. Investors are especially concerned with
profitability measures.
Despite being influenced by accounting conventions, earnings are still the most relevant and popular
indication of a company’s ability to make money. Profitability ratios are important for defining the
quality of a company’s earnings stream, and shed light on a company’s ability to generate cash.
Profit Margin
The profit margin ratio is an important measure and point of consideration for any user. It measures the
total profit of a company relative to total sales. Expected ratio results can vary widely by industry type (for
example, banks have very low profit margins). A negative result means the company reported a net
operating loss for the period being analyzed.

34
Financial Ratios & Analysis - Accounting Play
www.AccountingPlay.com
This ratio is often expressed on a “net” basis, and referred to as “net profit margin”, and the denominator
is generally expressed as “net sales” which rightly adjust total sales for any returns, allowances and
discounts. There is no absolute benchmark and it is best to compare the ratio result to a relevant peer
group in order to make a proper determination.
The main drawback to this ratio is that it does not explain the quality of the result. For example, if the
result is low, the user does not know if the problem lies in high cost of goods sold, or high overhead or
low sales volume, or other factor. Additional research is usually required to fully understand a ratio result.
Measures the degree of profitability after all direct or operational expenses
Usually calculated after the impact of net interest income / expense Also known as pre-tax margin

35
Financial Ratios & Analysis - Accounting Play
www.AccountingPlay.com
Gross Margin
Gross margin measures the relationship between sales and cost of goods sold. It is the first available
measure of profitability on the income statement, specifically measuring the profitability inherent in a
business before applicable overhead costs. A high gross margin is a welcome sign, indicating that
production revenue is well in excess of total direct production costs. A low gross margin is cause for
concern and further investigation. Peer group analysis will shed important perspective on this result.
The ratio can often be expressed in terms of “net revenue” as well, meaning gross sales less returns,
Allowances or Discounts. This ratio should always result in a significantly positive number. If looking at
interim statements, keep in mind that the gross margin can be affected by seasonality. Using annual
statements will mitigate this possibility. The ratio is mostly relevant for companies with significant
manufacturing activities such as an equipment producer or re-seller. This would not apply to service
sector companies such as accounting or law firms that have no significant cost of goods.
Measure of cost of goods sold (COGS) relative to revenue
Most relevant for inventory based businesses (manufacturing / retail sales)
Best evaluated relative to similar companies / peer group

36
Financial Ratios & Analysis - Accounting Play
www.AccountingPlay.com
Effective Tax Rate
The effective tax rate shows the overall relationship between income earned and taxes paid. It does not
reflect or demonstrate effects of tiered taxation rates. A potential limitation of this ratio can be the
composition of the numerator. For example, the analyst should (or can) investigate further to determine
the impact of any non-recurring tax loss carryforward that could serve to reduce actual taxes paid. This is
important if one is using historical results as a basis for building financial projections, or simply looking to
estimate cash flows using a forward perspective.
Effective tax rate can be applied differently depending on user needs. If the user is charged with
evaluating a new potential line of business and its net earnings impact for example, it may likely be more
accurate to use marginal tax rates. Use of the marginal rates may best determine tax implications
resulting from the anticipated marginal earnings increase. To interpret this variation, compare the result
to applicable standardized tax schedules and compare to peer groups.
Measure of income tax paid relative to net income
Calculation of tax rate at a given time period

37
Financial Ratios & Analysis - Accounting Play
www.AccountingPlay.com
Return on Assets
The return on assets (ROA) ratio measures relationship between net earnings and assets. The result varies
greatly between industry types, generally because of balance sheet composition. Capital intensive
industries such as utilities or automobile manufacturers generally will report lower ROA numbers
compared to service firms such as law offices or software developers. Manufacturing industries require
expensive equipment which appears as an asset on the balance sheet and therefore not comparable to
service based businesses. Peer analysis is therefore important when drawing conclusions.
Capital structure can have a significant impact on ROA and therefore analysts may add back interest
expense to net income, especially when conducting peer analysis. This measure can also be calculated on
a pre-tax basis, and often is, especially when comparing a company to a peer group. Many analysts
consider this less of a measure of profitability than a measure of operating efficiency because it also
indicates how well a company is employing its assets to generate profits.
Measures relationship between net earnings and assets
Indication of operating efficiency
Favorable: higher result

38
Financial Ratios & Analysis - Accounting Play
www.AccountingPlay.com
Return on Equity
Return on equity (ROE) measures profitability relative to shareholder investment, or equity. This ratio is
generally considered the best measure of profitability and is strongly favored by investors. While always
important, users such as lenders or creditors are less concerned with this ratio given their focus on risk of
being paid back. As with return on assets, it is best to use average equity in the denominator for the
period being analyzed because equity levels can change during the period.
Capital structure and financial leverage heavily influence ROE results, both within and between industry
groups. Companies that use higher levels of long-term debt will generate have higher ROEs (all things
equal). Higher leverage can also indicate a higher degree of risk associated with generating earnings.
Measures relationship between net earnings and business equity
Indication of operating efficiency
Favorable: higher result

39
Financial Ratios & Analysis - Accounting Play
www.AccountingPlay.com
DuPont Formula
The DuPont formula is an alternative approach to evaluating return on equity, effectively splitting the
traditional ROE ratio into three significant components: profit margin, asset turnover and financial
leverage, to better understand changes in ROE over time using trend analysis.
The purpose is to isolate or breakout these three drivers to get a better idea of which component has had
more impact on the change in ROE from the prior period. For example, learning that profit margin was
the reason for the increase in ROE over the prior reporting period is a positive sign. Conversely, if the
increase was attributable solely to an increase in financial leverage (increased long-term debt) then that
could be considered negative.
Generally there is no standard benchmark for this metric. In terms of the calculation result, the higher is
better, just like with the conventional ROE Ratio. More importantly is the ability of this ratio to look
beyond conventional ROE. Comparability between similar industries, timeframe, and other context is
particularly important when employing this formula.
An alternative approach to evaluating return on equity (ROE) to provide further insight than just
the standard ROE measure
Splits the traditional ROE ratio into three components: profit margin, asset turnover, and
financial leverage
Favorable: higher result

40
Financial Ratios & Analysis - Accounting Play
www.AccountingPlay.com
Return on Capital Employed
Return on capital employed, or “ROCE” is a similar measure to return on equity, but gives more
consideration to the effects of debt and leverage relative to earnings. It is therefore especially helpful
when evaluating highly-leveraged or capital-intensive companies. ROCE is potentially better and more
accurate than standard ROE because it attempts to indicate how well a company is generating earnings in
relation to both debt and equity.
An important consideration is that the ROCE ratio should be greater than the company’s weighted-
average cost of capital; if it is not, then this is a signal that over time earnings from operations may be
steadily declining, resulting in less earnings available to shareholders.
One general drawback is the total assets in the denominator which includes the effects of depreciation
and amortization. This can serve to reduce the denominator and artificially increase the ratio result. This
scenario could skew results between new and older companies, so one should consider this potential
issue.
Trend analysis is beneficial when using most ratios, but especially so for ROCE. The analyst should hope to
find year to year increases in ROCE which would indicate the company is in fact benefiting over time from
its efficient employment of capital. This cannot be determined from looking at a single reporting period.
Measures the relationship between earnings before interest and taxes (EBIT) and shareholders’
investment
Indicates profitability and efficiency
Favorable: higher result
Higher results indicate more efficient use of capital

41
Financial Ratios & Analysis - Accounting Play
www.AccountingPlay.com
Debt and Solvency Ratios
Audio
Debt and Solvency Ratios
Topics
Introduction
Debt Ratio
Debt to Equity Ratio
Equity Ratio
Capitalization Ratio
Cash Flow to Debt

42
Financial Ratios & Analysis - Accounting Play
www.AccountingPlay.com
Introduction
Solvency is the ability of a company to meet its long-term financial obligations. This ratio group is
concerned with identifying absolute and relative levels of debt, financial leverage, and capital structure.
These ratios allow users to gauge the degree of inherent financial risk, as well as the potential of
insolvency. Financial risk is a relative measure; the absolute amount of debt used to finance assets and
operations is by itself not that meaningful. In other words, there is no right or wrong amount of debt.
The company may be evaluating in context of ability to carry or service liabilities.
Debt Ratio
The debt ratio is the most basic indicator of solvency which identifies the percentage of assets that are
funded by liabilities. There is no set rule for the result but one could expect to see a rough range of
results between 60%-80% across a broad spectrum of most industries. Financial institutions conversely
are highly leveraged and ratios with results of 90%+ are common. Ratios below 50% are infrequent, with
the possible exception of small family owned businesses.
This ratio by itself is not especially important. It tells the level of debt or leverage, but the result needs to
be considered in relation to the enterprise as a whole. High leverage can be positive if the company is
able to support and take advantage of it. This ratio is therefore a starting point to solvency analysis.
Analysts will quickly move on from this point by focusing attention to the composition of liabilities,
earnings, cash flow, and coverage.
Measures the relationship between total liabilities and total assets
Basic indicator of risk, leverage, and solvency
Favorable: lower result
Lower results indicate a higher percentage of equity employed to fund or support operations

43
Financial Ratios & Analysis - Accounting Play
www.AccountingPlay.com
Debt to Equity Ratio
The debt to equity ratio provides a different perspective on the manner in which a company funds its
assets. It is a measure of leverage and a preliminary indicator of solvency. As with the debt ratio, there is
no standard generic benchmark from which to judge all companies. This metric should be considered in
large part by the industry type being analyzed while performing quality peer group analysis.
Trend analysis (comparing company results over a number of years) is also helpful in understanding debt
to equity ratio. Should the ratio results rise over time, for example, this trend would likely suggest
increased use of bank financing or worse, signal operational issues. Such a trend would require further
attention and investigation.
Measures the relationship of total liabilities to shareholders’ equity
Indicator of financial leverage
Favorable: lower result
Lower results indicate less risk in operations

44
Financial Ratios & Analysis - Accounting Play
www.AccountingPlay.com
Equity Ratio
In almost all cases, a strong equity to assets ratio is a positive sign, especially from a risk or solvency
perspective. A high equity ratio is generally a common trait of quality, well performing companies. The
equity ratio by itself, however, does not explain how the level of equity was achieved. A high degree of
equity can be present for a variety of reasons, from seed funded startups to long-running, historically
successful companies with significant retained earnings. Another possible event that could distort the
usefulness of this measure could be a large secondary common stock offering.
Lower relative amounts of equity can occur simply for industry-specific reasons such as the case with
commercial banks or investment brokerages. This result could be also driven by an over-leveraged capital
structure (too much debt) or net operating losses. As is often the case, it’s important for the analyst to
get to work in order to understand the “how and why” behind the ratio result.
Measures % of total assets financed by shareholders’ investment and retained earnings
Indicator of leverage and solvency
Favorable: higher result
Peer analysis helps to qualify this measure because different industries can employ different
capital structures

45
Financial Ratios & Analysis - Accounting Play
www.AccountingPlay.com
Capitalization Ratio
The capitalization ratio is a key identifier of financial leverage, or operational leverage which can be
broadly thought of as financial or investment risk. In general, higher results indicate higher risk; lower
results equal less risk. At the same time, however, higher results can equal higher returns, and vice versa.
It is difficult to assign a normal or expected range of results for the capitalization ratio. There is really no
hard or fast rule because capital composition decisions are influenced by many factors including industry
type, development stage, management philosophy, prevailing economic and monetary conditions, and
other factors. Key to evaluating this ratio is to simultaneously understand how well the company can
manage leverage.
Leverage has both risks and rewards. High leverage allows for greater returns on shareholder’ equity
investment and is therefore beneficial, especially in good economic times. Conversely, when a company
with high leverage is struggling, whether because of operational, competitive or general economic
reasons, leverage can become a problem because required debt payments can be more difficult or even
impossible to meet. Inability to service debt requirements could potentially lead to serious problems such
as cessation of operations, bankruptcy, insolvency, liquidation, and restructure.
Industry type will generally influence the result. Capital intensive industries typically finance their long-
lived property, plant, and equipment (PP&E) which thus increases the relationship of debt to capital. This
metric will have little use for industries with little or no physical infrastructure.

46
Financial Ratios & Analysis - Accounting Play
www.AccountingPlay.com
Measures the relationship of long-term debt to capital structure
Indicator of financial leverage
Evaluation depends on industry and perspective; generally, the lower the better
Lower results indicate less risk in operations
Strongly influenced by industry type
Cash Flow to Debt
Cash flow to debt is a broad, top level indicator of solvency. Cash flow to debt compares the relationship
of operating cash flow to total debt outstanding. This ratio is technically different from the debt service
coverage ratio because it demonstrates a company’s implied capacity to retire debt principal, or, in other
words, to make payments above and beyond contractual minimums. Higher resulting ratios are generally
better. However, one point to consider is that if the ratio is very high, it may indicate that management
has not been employing cash in the most effective manner.
Cash flow to debt may be a slightly overstated measure because the numerator includes total cash flow
from operations. In some cases, not all operating cash would be available for debt retirement. To combat
this, some analysts will take this ratio a step further by adjusting the numerator to remove known
anticipated cash expenditures. For example, upcoming capital equipment purchases may be removed.
Further adjustments to this or other ratios are the hallmark of a competent analyst or ratio user.

47
Financial Ratios & Analysis - Accounting Play
www.AccountingPlay.com
Important to note is that all relevant or related categories of total debt may be adjusted for a variety of
things, such as: mandatory principal reductions on interest-only financing, redeemable preferred stock or
applicable portions of the principal on non-cancelable operating leases, and anything that is industry
specific.
Measures relationship of cash flow to total debt
An indicator of solvency
Favorable: the higher the better, within reason
Generally less than 1:1
Lower results indicate less risk in operations
Not a direct indicator of debt service capacity

48
Financial Ratios & Analysis - Accounting Play
www.AccountingPlay.com
Operating Performance Ratios
Audio
Operating Performance Ratios
Topics
Summary
Fixed Assets Turnover Ratio
Sales or Revenue per Employee
Operating Cycle
Cash Conversion Cycle
Account Receivable Turnover Ratio
Accounts Payable Turnover Ratio
Inventory Turnover Ratio
Summary
Operating performance is defined as measuring results relative to the assets used to achieve those
results. Efficiently for the purposes of this presentation could be defined as the ratio of output
performed by a process or activity relative to the total required energy spent. This category is subjective
in nature. Often measurements are viewed not only in relation to factors within a company but without
it as well, which is done by making comparisons of company results to industry standards or
benchmarks. Most often, making relative comparisons is the best way to fully understand results in this
ratio category. In general this measurement tool is most often applied in a monetary or financial sense,
though it also has applications in other areas such as regulatory compliance, ethics, and managing risk.
Understanding operating performance is critical in gauging the condition of a company. Consistently
top-performing companies are always efficient operators, while poorly performing companies often
have underlying issues which are creating poor results. Results will vary depending on the time period
selected, but overtime should provide valuable performance insight.

49
Financial Ratios & Analysis - Accounting Play
www.AccountingPlay.com
Fixed Assets Turnover Ratio
The fixed assets turnover ratio measures how efficiently or effectively a company employees its fixed
assets to generate sales. Trend analysis is beneficial in making sense of this ratio. Ideally the user would
like to see a rising trend which could indicate efficiency or less required investment for a given sales
volume. Conversely, a ratio result in a declining trend could indicate overspending or issues on the
revenue side. Factors such as book value, age of equipment or, less often, different capital structures or
strategic differences in methods of production may make industry comparison difficult.
Measures relationship between sales and fixed assets
Generally favorable: higher result
Measure of: activity and efficiency
Indicates how well a company utilizes property, plant & equipment to generate revenue

50
Financial Ratios & Analysis - Accounting Play
www.AccountingPlay.com
Sales or Revenue per Employee
Sales or revenue per employee uses average employee figures for the reporting period analyzed
compared to sales. Ratio results are highly divergent and are driven by industry and strategic
management choices. Trend analysis is helpful to gain insight into any operational or efficiency changes,
or impacts from changes in strategy within a given company. Peer comparison is particularly important, as
business type and size will substantially affect the ratio.
Indicates revenue generated per employee
Generally favorable: higher result
Measure of: activity and efficiency
Heavily influenced by: industry type, production, and operating strategy
Best used with: trend analysis

51
Financial Ratios & Analysis - Accounting Play
www.AccountingPlay.com
Operating Cycle
The operating cycle is a concept that estimates the average the number of days a company takes to
convert inventory to cash by combining the impacts of both the time taken to sell inventory and the
time taken to collect cash from accounts receivable. It represents the completed production process.
Generally speaking, at least with regard to this and other conversion ratios, companies purchase
inventory or raw materials on credit and later sell products on credit. These actions result in accounts
payable and accounts receivable. Therefore, the actual transfer of cash, in either direction, does not
come into play until the company pays payables and collects receivables. The ratio is a measure of
operating efficiency and working capital management. The shorter the time required to complete the
cycle, the better.
Measures time in days to convert inventory to cash
Generally favorable: shorter result
Includes impact of receivables collection
Measure of: operating efficiency and working capital management
Best used with: peer comparison

52
Financial Ratios & Analysis - Accounting Play
www.AccountingPlay.com
Cash Conversion Cycle
The cash conversion cycle measures the time between cash outflows and cash inflows resulting from the
primary business line, or production process. In other words, it illustrates how quickly a company can
convert its products into cash through sales. The shorter the cycle, the less time capital is tied up in the
business process, and thus the better for earnings.
Measures the time to convert resources into cash
Generally favorable: shorter result
Indicator of working capital efficiency
Best used with: peer comparison

53
Financial Ratios & Analysis - Accounting Play
www.AccountingPlay.com
Account Receivable Turnover Ratio
Accounts receivable turnover gives an average for the number of times (expressed in days) that a
company takes to collect its outstanding receivables. Similar turnover ratios can be expressed in either
number of times per year or days.
The AR turnover ratio is an indicator of operating efficiency. It measures the efficiency in money
collection. Only sales made on credit are used in this evaluation because sales made on a cash basis are
collected immediately. A high result indicates a company is collecting on receivables quickly. A low result
indicates the opposite, and could be a sign the company needs to review slow paying customers.
Calculates the average number of days required to collect receivables
Generally favorable: shorter result
Measure of: operating efficiency and working capital management
Heavily influenced by: industry type

54
Financial Ratios & Analysis - Accounting Play
www.AccountingPlay.com
Accounts Payable Turnover Ratio
The principles underlying the accounts payable turnover ratio are the same as for the accounts receivable
turnover ratio, with the exception that accounts payable (liability account) is being addressed. It also is an
indicator of operating efficiency, demonstrating the degree to which a company can pay its short-term
obligations in a timely manner.
This ratio is of primary interest to both suppliers and lenders. Lower numbers are almost always better.
Companies that pay quickly can often benefit by better terms or receive discounts. However, if the
turnover result is exceptionally low it might indicate a company is paying too quickly. Paying too fast can
be a loss of opportunity for a company to make money on existing savings. Paying too quick may also
force a company to use more high interest credit lines which increase interest expense.
Calculates the average rate at which payables are paid
Generally favorable: shorter result
Measure of: operating efficiency and working capital management
+/- 45 Days considered reasonable
Heavily influenced by: industry type

55
Financial Ratios & Analysis - Accounting Play
www.AccountingPlay.com
Inventory Turnover Ratio
Inventory turnover provides the average number of times inventory is sold during a reporting period. The
ratio can be expressed either by the number of times during the period, or by the number of days. As
with every turnover ratio, this is a measure of efficiency in operations. The quicker a company can sell its
inventory, the better. Quicker turnover allows for more opportunities to generate profit, indicates that
the company is selling a desired product, and reduces the chance of spoilage, obsolescence or the need
to offer discounts. The ratio result is significantly influenced by industry type. For example, you should
expect a local bakery to have a higher turnover compared to manufacturer of cruise ships.
Calculates frequency of inventory sold on average, during a reporting period
Generally favorable: shorter result
Measure of: operating efficiency and working capital management
Heavily influenced by: industry type

56
Financial Ratios & Analysis - Accounting Play
www.AccountingPlay.com
Cash Flow Ratios
Audio
Cash Flow Ratios
Topics
Summary
Operating Cash Flow / Sales Ratio
Free Cash-Flow / Operating Cash Ratio
Cashflow Coverage Ratio
Summary
Cash flow is the actual amount of cash generated or lost by an entity during the course of operations.
Cash and cash flow are important mainly because it is perhaps the ultimate indicator of a company’s
attractiveness, success or health. As they say, “Cash is King.”
The main reason for pursuing any business activity is ultimately to make money. Successful well-
performing businesses have enough cash to comfortably make timely payments to creditors and
lenders, meet operating expenses and pursue growth and expansion initiatives. Companies that are
short on cash are in just the opposite position and can over time be at risk of insolvency.
Cash is a factor in evaluating solvency, liquidity, growth potential, efficiency and the quality of
management overall. Understanding cash flow is so significant that financial statements usually include
the statement of cash flows which is devoted entirely to this one factor. The statement is divided into
three parts: operating, financing and investing.

57
Financial Ratios & Analysis - Accounting Play
www.AccountingPlay.com
Operating Cash Flow / Sales Ratio
The operating cash flow / sales ratio is limited by its very nature. This ratio just gives a very broad or
general idea about how well a company can convert sales into cash. Without a real standard benchmark
to rely upon to evaluate the result, using trend analysis and peer analysis is important.
When evaluating this ratio over multiple time periods, an analyst should expect to see a reasonably
consistent relationship between cash flow and sales. When sales increase, so should cash flow. If this
consistency is not present, further analysis should be pursued. Some factors to look for in such a situation
might include changes in sale terms, potential credit issues with buyers or issues with managing trade
receivables.
Measures the relationship of cash flow to sales
Generally favorable: higher result
Measure of: efficiency
Best used with: trend analysis and peer comparison
A broad measure only, providing no meaningful detail by itself

58
Financial Ratios & Analysis - Accounting Play
www.AccountingPlay.com
Free Cash-Flow / Operating Cash Ratio
Free cash-flow / operating cash flow is a significant ratio for users interested in understanding cash that
may be available for additional activities. When evaluating this measure, the higher resulting ratio is
better. Most credit analysts and many investment analysts consider free cash flow the most important
factor to consider when making recommendations.
Good results give comfort to creditors and investors alike. High levels of free cash flow are evidence of a
well performing operation and enable financial flexibility in decision making, strategic planning and the
overall company management process. Peer analysis is helpful in identifying comparable standards and
evaluations.
Measures actual free cash flow in relation to total cash flow
Generally favorable: higher result
Measure of: liquidity, financial flexibility, and operating efficiency

59
Financial Ratios & Analysis - Accounting Play
www.AccountingPlay.com
Cashflow Coverage Ratio
In its base application, the cash flow coverage ratio estimates a company’s ability to meet its interest
expense with available free cash flow. The ratio is included in the cash flow group but is also a measure of
liquidity or solvency. A higher result is almost always better and a comfortable minimum standard should
be at least 1.5x given that other payments, not simply interest expense, can be present.
Many users place high value on this ratio, in particular lenders. It is an important indication of financial
condition and company quality. Correctly evaluating the quality of cash flow coverage is critical for many
reasons. Some other coverage examples include loan principal repayment, preferred stock coverage,
capital expenditure coverage, dividend coverage, and other similar uses. Analysts that understand their
target company, its industry and the purpose behind the analysis being conducted will find ways to best
apply the concept of coverage in the course of their work.
Measures capacity to make debt payments
Generally favorable: higher result
Measure of: solvency
1.0x is considered “break even”, 1.2x is generally considered minimally acceptable

60
Financial Ratios & Analysis - Accounting Play
www.AccountingPlay.com
Valuation Ratios
Audio
Valuation Ratios
Topics
Summary
Price/Book Value Ratio
Earnings per Share
Price to Earnings per Share
Price/Earnings to Growth Ratio
Price / Sales Ratio
Dividend Yield Ratio
Dividend Payout Ratio
Enterprise Market Value
Summary
Valuation ratios in this sense are concerned with identifying the value component of securities
investment vehicles behind companies. These are most often used by people who participate in the
securities markets (stock market and equity sales). From this perspective, a range of users would include
those employed in the industry such as portfolio managers or investment analysts, down to smaller
participants like individual investors. In general, these users are looking to make either investment
decisions or recommendations. Valuation is an important concept mostly because its serves as a
foundational component for determining the actual cost or price of an investment. It provides a way to
measure the relative value of an investment against alternative options.
Price/Book Value Ratio
Price/book value ratio (price to book or P/B ratio) compares current market value to current book value.
Market value is the current value of the company in the stock market, while book value is the difference
between reported assets and reported liabilities for a given period. This is most often expressed in terms
of per share values. The P/B ratio is an indication of the inherent value of a company. Note that some
formula calculations will exclude intangible assets when calculating book value, which is referred to as
the price to tangible book ratio.

61
Financial Ratios & Analysis - Accounting Play
www.AccountingPlay.com
Price to book is a very simplistic method of identifying attractive investment opportunities. A lower P/B
ratio can mean either the stock is undervalued or something is fundamentally wrong with the company.
In other words, the ratio by itself does not explain the “why” behind the result. This ratio gives you an
idea if you're paying too much for what would be left if the company declared bankruptcy.
P/B ratio is particularly useful for value investors, who are always on the hunt for low price stocks that
the market has neglected. A P/B result of less than 1.0x generally means either the market believes the
asset value is overstated, or the company is underperforming from an earnings perspective.
The ratio has several different limitations. It is mostly relevant for capital-intensive companies, financial
institutions or other asset heavy companies. Book value does not account meaningfully for
considerations such as goodwill, brand identity, new potential innovations, intellectual properties and
any potential capital appreciation of certain assets. High leverage can also artificially distort the ratio
because of the level of liabilities. Additionally, a newer company with historical reported losses and
negative equity will have negative book value, but could be poised for profitability going forward.
Compares market price of stock relative to book value
Limited valuation measure that does not take into account several other possible valuation
factors: appreciation of book value assets, market environment, income growth
A value > 1.0x indicates favorable investor sentiment, a value < 1.0 indicates the opposite

62
Financial Ratios & Analysis - Accounting Play
www.AccountingPlay.com
Earnings per Share
Earnings per share (EPS), is the most commonly expressed, and most important, measure of company
valuation. EPS is generally regarded as the single most significant factor for influencing a company’s stock
price, either upward or downward. A higher ratio result is always better. From an investment perspective,
this ratio is highly significant and less important from a lender perspective.
EPS is also often calculated on a fully diluted basis, which accounts for the potential of additional shares
from sources such as options, warrants and convertible securities. This calculation is generally considered
the more accurate method. This metric is best evaluated in comparison to other companies in the same
industry as well as over time using trend analysis.
Presents earnings (net income) per single share of common stock
Generally favorable: higher result
Measure of: profitability and valuation

63
Financial Ratios & Analysis - Accounting Play
www.AccountingPlay.com
Price to Earnings per Share
Also known as the P/E Ratio, this metric is extremely popular among investors. The calculation shows the
relation between the market price of a stock and the underlying earnings on a per share basis. The
measure shows how expensive a stock is in relative terms to the market price. The ratio effectively shows
how much investors are willing to pay per dollar of company earnings. It is useful for comparing
investment opportunities between companies within an industry segment, and even between different
industries. The P/E Ratio is traditionally calculated using the previous 12 month historical earnings and
can also be calculated using 12 month projected earnings. If using forward earnings, the ratio is then
known as forward P/E.
If there is a drawback to this ratio it would be that the denominator is based (usually) on historical
reported earnings, which can be manipulated or skewed either by proper accounting convention or even
fraudulent reporting. Thus, it is important for the user to understand the quality of the earnings reported.
Compares common stock price per share to its earnings per share
The higher the ratio, the more “expensive” the stock
Higher results can indicate greater market demand
Measure of: valuation

64
Financial Ratios & Analysis - Accounting Play
www.AccountingPlay.com
Price/Earnings to Growth Ratio
Price/earnings to growth ratio (PEG) takes into account company earnings growth in evaluating potential
investment opportunities. Because the metric adds a growth component, it is considered more complete
than the standard price/earnings ratio. Investors may look to see if a stock is under or overvalued and
make decisions accordingly.
Determines the value of common stock by taking earnings growth into account
Measure of: valuation
General guideline: if the resulting value < 1.0x a company is potentially undervalued

65
Financial Ratios & Analysis - Accounting Play
www.AccountingPlay.com
Price/Sales Ratio
The price to sales ratio (P/S) relates the company price per share to sales. The benefit to the approach is
that it provides a method for evaluating potential investment opportunities among companies that are
operational but not yet profitable. Such a company could be newer and still operating at a loss. The
drawback is the highly limited nature of the calculation, in particular the exclusion of earnings quality or
cash flow generation. It is useful for comparing similar stage companies within the same industry sector.
Compares the value of common stock relative to sales volume
Generally favorable: lower result
Measure of: valuation
Useful for evaluating newer companies with sales, but no earnings to date

66
Financial Ratios & Analysis - Accounting Play
www.AccountingPlay.com
Dividend Yield Ratio
The dividend yield ratio calculates the ratio between dividends received relative to a company’s stock
price. The objective is to illustrate what relative percentage an investor can expect to receive from
dividends, compared to the stock’s purchase price. This metric is important to equity investors that prefer
income producing stocks (as opposed to growth-oriented equity investors).
Comparison of dividends paid relative to stock price
Measure of: valuation and income (for investors)
Less valuable for growth investors

67
Financial Ratios & Analysis - Accounting Play
www.AccountingPlay.com
Dividend Payout Ratio
The dividend payout ratio simply shows the relationship between dividends paid and net income for a
given reporting period. The ratio can be evaluated relative to historical dividend payout rates,
management’s stated goals regarding dividends, peer results, and dividend related decisions.
A positive result indicates earnings are sufficient to cover dividends paid. That is the expected scenario if
a company is paying dividends. A negative result means that current earnings are not sufficient to support
the current level of dividend payout. This is not ideal and indicates adjustments in dividend policy or
operations (or both) are necessary.
Trend analysis is helpful in determining the consistency of the ratio over time, which can be compared to
actual payouts as well as management’s philosophy regarding dividends. This metric is relevant to
dividend paying companies. New companies are less likely to pay dividends, generally choosing instead to
reinvest earnings back into the company to support future growth.
Measures dividends paid relative to net income
An indicator of profitability, but not exclusively
Result is highly company-specific
If too high, it may indicate the payout rate is unsustainable or management is having issues
employing capital

68
Financial Ratios & Analysis - Accounting Play
www.AccountingPlay.com
Enterprise Market Value
Enterprise market value is a simple method for making quick valuation assessments of a company,
viewing it as an entire economic entity or enterprise and doing so from an acquisition perspective. Other
standard metrics may include market capitalization which is simply the aggregate value of its common
stock shares outstanding. Generally speaking, many adjustments are made during an acquisition process
but this ratio simplifies the issue using a “quick and dirty” methodology, only adjusting for outstanding
debt and cash. In an acquisition, acquiring debt would increase the cost of acquisition but cash holdings
would reduce the cost of acquisition. This ratio accounts for these two factors. The ratio can only be
considered as a quick estimate of acquisition cost at best and the user should never expect to rely solely
on this approach when seriously pursuing acquisition targets. This is only one metric in the analysis, due
diligence, and negotiation required of a business sale.
Represents the entire economic value of a company
Measure of: valuation
Gives a theoretical “takeover price”
Highly dependent on company fundamentals

69
Financial Ratios & Analysis - Accounting Play
www.AccountingPlay.com
Financial Ratios in Closing
Audio
Financial Ratios in Closing
Topics
Summary
Summary
Financial ratios are only indications and not conclusions. They provide a tool for further financial analysis
and must be taken in context. Context can be framed as the five Ws: Who, what, when, where, and why.
Who is producing the data you are using and is it legitimate? What kind of business are you analyzing
and comparing with? When or what time period are you using? Where is the business? And why are you
doing this? Context is everything when drawing valid conclusions and making comparisons.
Ratios will help support conclusions and decision making. They provide standardized metrics for
comparison across several different areas covered: Liquidity, profitability, solvency, operations, cash
flow, valuation, and more. They provide business insights, lead to further investigation beyond ratios,
and create useful benchmarks.
If you have found Financial Ratio Flashcards useful, please tell a friend or consider getting the resource
in Kindle Format. Please email me with any questions or concerns personally at
[email protected]. Thanks.

70
Financial Ratios & Analysis - Accounting Play
www.AccountingPlay.com
Example Financial Statements
Balance Sheet

71
Financial Ratios & Analysis - Accounting Play
www.AccountingPlay.com
Income Statement

72
Financial Ratios & Analysis - Accounting Play
www.AccountingPlay.com
Statement of Shareholders’ Equity

73
Financial Ratios & Analysis - Accounting Play
www.AccountingPlay.com
Statement of Cash Flows

74
Financial Ratios & Analysis - Accounting Play
www.AccountingPlay.com
Accounting Glossary
Accounting equation The double-entry accounting framework expressed as: Assets = Liabilities +
Equity
May be expressed as Equity = Assets – Liabilities
Assets, liabilities, and equity represent balance sheet accounts
Revenue and expenses are income statement accounts that combine to create net income or
net loss
Net income or loss gets added or subtracted to retained earnings at the end of the accounting
period
Return to Dictionary Index

75
Financial Ratios & Analysis - Accounting Play
www.AccountingPlay.com
Accounts payable (AP) Money owed to creditors and vendors
Increased when expense incurred
Decreased when expense paid in cash
Considered a liability because it represents amounts owed to vendors
Return to Dictionary Index

76
Financial Ratios & Analysis - Accounting Play
www.AccountingPlay.com
Accounts receivable (AR) Cash due from customers who have purchased merchandise or received
services not yet paid for
Increased when sale is made
Decreased when sale is collected
Converted to cash by collection, discounting, or factoring customer accounts
Return to Dictionary Index

77
Financial Ratios & Analysis - Accounting Play
www.AccountingPlay.com
Accounts receivable turnover Measures the frequency of the revenue collection cycle
Helps monitor the rate of collection for credit sales
A low ratio implies that collection of credit sales is slow
365 / accounts receivable turnover ratio = Average collection period
Return to Dictionary Index

78
Financial Ratios & Analysis - Accounting Play
www.AccountingPlay.com
Accrued expenses Expenses incurred before the end of the accounting period, but not yet paid for
Examples
Wages earned by employees not paid at year-end
Employee benefits not yet paid, such as vacation
Return to Dictionary Index

79
Financial Ratios & Analysis - Accounting Play
www.AccountingPlay.com
Accumulated amortization The sum of prior amortization expense
Contra account presented as a negative number (credit) in the asset section of the balance
sheet
Offsets intangible asset value recorded at cost, such as: patents, trademarks, copyrights,
franchise licenses, and goodwill
Return to Dictionary Index

80
Financial Ratios & Analysis - Accounting Play
www.AccountingPlay.com
Accumulated depreciation The sum of prior depreciation expense
Contra account presented as a negative number (credit) in the asset section of the balance
sheet
Offsets tangible asset value recorded at cost, such as property, plant, and equipment
Return to Dictionary Index

81
Financial Ratios & Analysis - Accounting Play
www.AccountingPlay.com
Additional paid-in capital Investment received by corporation, in excess of par value per share
Par value typically set low, such as $.01 per share
Classified as equity on the balance sheet
Return to Dictionary Index

82
Financial Ratios & Analysis - Accounting Play
www.AccountingPlay.com
Adjusting journal entries Adjusts records directly by increasing or decreasing accounts
Directly adjusts the books and records without changing individual transactions
Common adjustments: depreciation, amortization, capitalization of assets purchased, accrued expense
liabilities, prepaid assets, investment performance adjustments, and unearned revenue
Return to Dictionary Index

83
Financial Ratios & Analysis - Accounting Play
www.AccountingPlay.com
Allowance for doubtful accounts Used to estimate uncollectible credit sales
Contra account presented as a negative number (credit) in the asset section of the balance
sheet
Allowance is increased along with bad debt expense if more customers are expected to not pay
amounts due
Return to Dictionary Index

84
Financial Ratios & Analysis - Accounting Play
www.AccountingPlay.com
Amortization expense Represents the cost of an intangible asset over time
Represents decline in intangible assets such as patents, trademarks, and copyrights
Tax law and Generally Accepted Accounting Principles (GAAP) differ on amortization
methodologies
Return to Dictionary Index

85
Financial Ratios & Analysis - Accounting Play
www.AccountingPlay.com
Assets Economic resources with probable future benefits
Examples: cash and cash equivalents, accounts receivable, inventory, prepaid expenses, investments,
property, plant, and equipment, and intangible assets
Financial statement: balance sheet
Return to Dictionary Index

86
Financial Ratios & Analysis - Accounting Play
www.AccountingPlay.com
Asset life Estimated length of time an asset is expected to be useful
Typically asset life will be in years
Under units-of-production depreciation method, useful life is estimated by machine output or
hours
Return to Dictionary Index

87
Financial Ratios & Analysis - Accounting Play
www.AccountingPlay.com
Asset retirement Point at which asset is no longer useful and is disposed of
Asset cost and accumulated depreciation for the asset are removed from the books
Gain or loss on disposition whether sold or scrapped, will likely be classified as extraordinary
income
Return to Dictionary Index

88
Financial Ratios & Analysis - Accounting Play
www.AccountingPlay.com
Asset T-account transactions Increase assets with a debit and decrease with a credit
Basic entries
Receive outside investment: debit cash, credit equity
Receive a loan: debit cash, credit liability
Receive refund of expense: debit cash, credit expense
Pay bills: debit accounts payable, credit cash
Repay loan: debit liability, credit cash
Return to Dictionary Index

89
Financial Ratios & Analysis - Accounting Play
www.AccountingPlay.com
Average cost method Inventory accounting system which assigns cost based upon an average
purchase price to determine ending inventory and the cost of goods sold
Works well for homogenous inventory items, such as bulk cotton used in manufacturing
Return to Dictionary Index

90
Financial Ratios & Analysis - Accounting Play
www.AccountingPlay.com
Balance sheet Statement that reports the financial position of a company by presenting assets,
liabilities, and equity
At a fixed date in time
Presents accumulation of financial activity
Balance sheet format similar to the accounting equation: Assets = Liabilities + Equity
Assets are presented in order of liquidity, classified as current or long-term
Liabilities are presented in the order of date due
Return to Dictionary Index

91
Financial Ratios & Analysis - Accounting Play
www.AccountingPlay.com
Bank CD Certificate of deposit promises a rate of return to the investor and allows the bank use of
funds for the investment period
Considered a cash equivalent if CD has an original maturity date of 90 days or less
Redeemable in cash
Typically a penalty due for early redemption
Return to Dictionary Index

92
Financial Ratios & Analysis - Accounting Play
www.AccountingPlay.com
Bank reconciliation Proves the differences between cash per books and cash per bank
Balance per books = bank balance – outstanding checks + outstanding deposits
Balance per bank = balance per books + outstanding checks – outstanding deposits
Reconciliation shows the differences between the bank statement and accounting record
Return to Dictionary Index

93
Financial Ratios & Analysis - Accounting Play
www.AccountingPlay.com
Capital improvement Existing assets made to last longer, increase productivity, or extend use value
Added to asset value and depreciated
Depreciation expense recognizes the cost of the improvement over time
Return to Dictionary Index

94
Financial Ratios & Analysis - Accounting Play
www.AccountingPlay.com
Capitalized interest Interest payments treated as an asset, instead of an expense, in certain
circumstances
Interest payments related to construction are capitalized until a structure is complete
Interest payments following the completion of an asset are expensed
Capitalized interest increases the basis of an asset
Return to Dictionary Index

95
Financial Ratios & Analysis - Accounting Play
www.AccountingPlay.com
Cash & cash equivalents The most liquid asset on the balance sheet
Easily converted to cash, original maturity 90 days or less
Examples: negotiable paper, bank CDs, money market accounts, petty cash, savings accounts, and checks
not mailed
Return to Dictionary Index

96
Financial Ratios & Analysis - Accounting Play
www.AccountingPlay.com
Cash basis v. Accrual The cash basis method of accounting recognizes transactions only when cash or
equivalents have been exchanged, while accrual basis follows the matching principle and recognizes
transactions as they occur
Cash basis accounting records revenue and expenses only when cash or equivalents have been
exchanged
Only accrual basis accounting is an acceptable method under US Generally Accepted Accounting
Principles (US-GAAP)
Accrual basis accounting records revenue when earned and realizable and expenses as incurred,
even if cash has not been paid
Return to Dictionary Index

97
Financial Ratios & Analysis - Accounting Play
www.AccountingPlay.com
Closing retained earnings Net income or loss on the income statement is added or subtracted to
retained earnings on the shareholders’ equity section of the balance sheet, at the end of the accounting
period
Income summary accounts are used to record income statement profit or loss to retained
earnings
Recording income statement activity to retained earnings is also referred to as closing retained
earnings
Return to Dictionary Index

98
Financial Ratios & Analysis - Accounting Play
www.AccountingPlay.com
Commercial loan Borrowed money, typically from a bank, to finance company operations
Appears as a liability on the balance sheet as a note payable
Amounts payable within a year appear as a current liability
Accrued interest at year-end becomes an accrued expense
Return to Dictionary Index

99
Financial Ratios & Analysis - Accounting Play
www.AccountingPlay.com
Common stock Represents ownership of a corporation
Shareholders own stock
Common shareholders influence the company by electing the board of directors
Stocks may pay dividends to shareholders
Return to Dictionary Index

100
Financial Ratios & Analysis - Accounting Play
www.AccountingPlay.com
Conservatism Reporting income and expenses in an accurate manner and erring towards
understatement of net income and asset values
Error on the side of understating revenue
Error on the side of overstating expense
Example: inventory reported at historical cost or lower
Return to Dictionary Index

101
Financial Ratios & Analysis - Accounting Play
www.AccountingPlay.com
Controller Head accountant for a company
Duties may include: general accounting, bank reconciliations, and journal entries
A controller works for one company, also referred to as private accounting
Return to Dictionary Index

102
Financial Ratios & Analysis - Accounting Play
www.AccountingPlay.com
Corporate characteristics Provides owners limited liability
Liability limited to amount invested
Corporation may continue in perpetuity
Shareholders (owners) may still be liable if they commit crimes
Return to Dictionary Index

103
Financial Ratios & Analysis - Accounting Play
www.AccountingPlay.com
Cost of goods sold (COGS) Price of goods sold during the accounting period
Deduction from revenue to calculate gross profit or loss
May include: raw materials cost, machine costs, labor, and other overhead costs for a
manufacturing entity
Revenue - Cost of goods sold = Gross profit
Return to Dictionary Index

104
Financial Ratios & Analysis - Accounting Play
www.AccountingPlay.com
Current assets Resources expected to be used or converted into cash within one year of the balance
sheet date or longer, if the operating cycle is greater than a year
Examples
Cash and cash equivalents: currency and cash accounts with an original maturity 90 days or less
Accounts receivable: cash customers owe a business
Inventory: materials used to make products
Prepaid expenses: expenses paid in advance
Investments: purchased for financial gain
Return to Dictionary Index

105
Financial Ratios & Analysis - Accounting Play
www.AccountingPlay.com
Current liabilities Obligations due in one year or less
Examples
Accounts payable: cash owed to others
Income tax payable: tax owed to government
Dividends payable: dividends owed to shareholders
Accrued expense: expenses incurred, not yet paid for
Current portion of long-term debt: portion of debt due in a year or less
Return to Dictionary Index

106
Financial Ratios & Analysis - Accounting Play
www.AccountingPlay.com
Customers Purchase goods and services from a company
Credit sales to customers involve shipping goods or performing services prior to getting paid
Accounts receivable department typically sends invoices and collects cash
External stakeholders
Return to Dictionary Index

107
Financial Ratios & Analysis - Accounting Play
www.AccountingPlay.com
Debits and credits system The accounting system increases and decreases account balances with a
debit or credit (also known as double-entry accounting)
The system helps users understand the significance of the transaction
Sum of debits always equals the sum of credits
Debits and credits combined form a trial balance
Transactions are all accounted for
Return to Dictionary Index

108
Financial Ratios & Analysis - Accounting Play
www.AccountingPlay.com
Debt to total assets Measures the amount of debt there is relative to assets
The lower the ratio, the more assets a company has relative to debt
A low debt to asset ratio is generally viewed favorably by investors
Return to Dictionary Index

109
Financial Ratios & Analysis - Accounting Play
www.AccountingPlay.com
Debt to total equity Proportion of financing that is debt related
Generally a high debt to equity ratio indicates a company has utilized a significant amount of
financing to grow
Return to Dictionary Index

110
Financial Ratios & Analysis - Accounting Play
www.AccountingPlay.com
Declining-balance depreciation Accelerated depreciation method, generates more expense in
earlier years
No salvage value taken into account
Logical if best use of asset is in earlier years of life
Often used for tax purposes
Return to Dictionary Index

111
Financial Ratios & Analysis - Accounting Play
www.AccountingPlay.com
Deferred revenue Cash received in advance, but not yet earned
Examples: subscriptions, maintenance contracts, retainers, and cash received for future insurance
coverage
Return to Dictionary Index

112
Financial Ratios & Analysis - Accounting Play
www.AccountingPlay.com
Depreciation expense Represents the cost of fixed assets over time
Recorded to capture the decline in business asset use-value over time
Matches the expense of the asset as it is being used up
Depreciation method examples: straight-line, accelerated depreciation, sum-of-the-years-digits’, and units
of production
Return to Dictionary Index

113
Financial Ratios & Analysis - Accounting Play
www.AccountingPlay.com
Depreciation methods compared Different methods result in different timing of expense
Accelerated methods result in more expense earlier in the asset life
Different methods of depreciation result in timing differences for depreciation expense
Return to Dictionary Index

114
Financial Ratios & Analysis - Accounting Play
www.AccountingPlay.com
Derivatives Financial contracts to buy or sell assets based upon specified conditions
Characteristics:
Zero net investment
Equivalent to cash or cash settlement
Notional and underlying amount
Return to Dictionary Index

115
Financial Ratios & Analysis - Accounting Play
www.AccountingPlay.com
Dividends Corporate profits paid to shareholders
Reduce retained earnings
Authorized by the board of directors
Typically paid when company is performing well
Cash paid to shareholders in excess of retained earnings is a return of capital, not a dividend
Return to Dictionary Index

116
Financial Ratios & Analysis - Accounting Play
www.AccountingPlay.com
Equity T-account transactions Equity decreases with a debit and increases with a credit
Basic entries
Increase equity from stock issue: debit cash and credit equity
Increase equity from net income: debit income summary and credit retained earnings
Decrease equity from net loss: debit retained earnings and credit income summary
Decrease equity from declared dividend: debit retained earnings and credit dividend payable
Return to Dictionary Index

117
Financial Ratios & Analysis - Accounting Play
www.AccountingPlay.com
Expense recognition Expenses are recognized when incurred, as goods are used and services received
Inventory items will not be an expense until sold
Matching principle dictates that expenses be matched with related revenue in the same period
Payments for rent and insurance are prepaid assets if paid in advance and are recognized as
expenses as they are used over time
Property, plant, and equipment are capitalized assets, not expenses
Return to Dictionary Index

118
Financial Ratios & Analysis - Accounting Play
www.AccountingPlay.com
First in first out Inventory accounting system in which items purchased earliest are the first to be used
to determine ending inventory and the cost of goods sold
Costs are similar to the physical flow of inventory
Results in higher net income in a period of rising prices when compared to the LIFO method
Inventory value is overstated in period of rising prices
Acceptable method under both US-GAAP & IFRS
Return to Dictionary Index

119
Financial Ratios & Analysis - Accounting Play
www.AccountingPlay.com
Financial statement relationships Financial statements are dependent on each other for financial
reporting
The income statement reports net income or loss
Net income is added or a net loss is deducted from retained earnings on the balance sheet at
end of accounting period
The statement of cash flows uses net income and changes in balance sheet accounts to present
the cash ins and outs
The statement of shareholders’ equity reports the balance sheet equity detail
Return to Dictionary Index

120
Financial Ratios & Analysis - Accounting Play
www.AccountingPlay.com
Finished goods Product ready for sale that includes raw material, manufacturing labor, and overhead
costs
Raw material examples: wood, steel, parts, stuffing, cloth, oil, and plastic
Manufacturing labor includes machine operators
Overhead costs include electricity and water to power machines
Return to Dictionary Index

121
Financial Ratios & Analysis - Accounting Play
www.AccountingPlay.com
FOB shipping point v. FOB destination FOB shipping point recognizes the sale of an item when the
seller ships it, while FOB destination recognizes the sale of an item when the buyer receives the item
Defines terms of sale and accounting treatment
FOB: Free On Board
Item included in books of buyer at year-end under FOB shipping point
Item included in books of seller at year-end under FOB destination
Return to Dictionary Index

122
Financial Ratios & Analysis - Accounting Play
www.AccountingPlay.com
General ledger Record of all accounting transactions
May be summarized in a trial balance for financial statement preparation
Presented in order of the balance sheet, then income statement accounts: assets, liabilities,
equity, revenue, and expenses
Debits presented as positive numbers and credits as negative
Return to Dictionary Index

123
Financial Ratios & Analysis - Accounting Play
www.AccountingPlay.com
Generally Accepted Accounting Principles (US-GAAP) Accounting system established by FASB
(Financial Accounting Standards Board) that governs financial reporting
Rule based system
Extraordinary income items presented separately
LIFO inventory permissible
Development costs expensed
Return to Dictionary Index
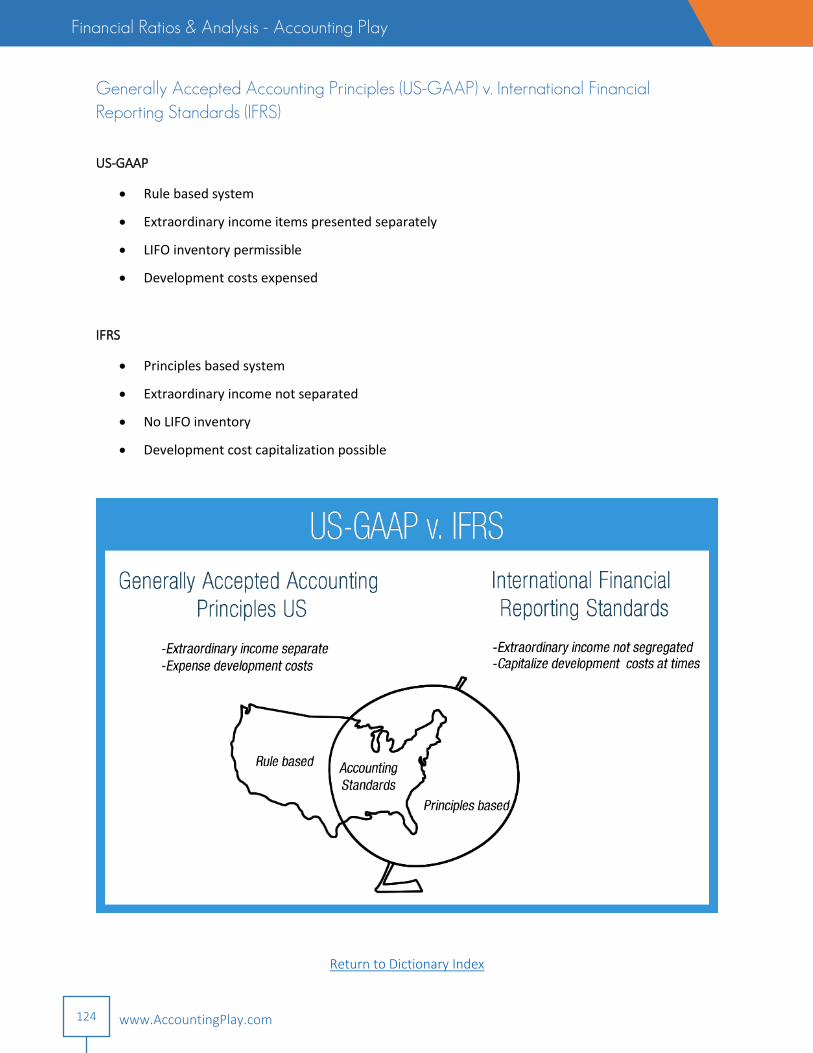
124
Financial Ratios & Analysis - Accounting Play
www.AccountingPlay.com
Generally Accepted Accounting Principles (US-GAAP) v. International Financial Reporting Standards (IFRS)
US-GAAP
Rule based system
Extraordinary income items presented separately
LIFO inventory permissible
Development costs expensed
IFRS
Principles based system
Extraordinary income not separated
No LIFO inventory
Development cost capitalization possible
Return to Dictionary Index

125
Financial Ratios & Analysis - Accounting Play
www.AccountingPlay.com
Generally Accepted Accounting Principles hierarchy The rank of authority for accounting
standards
AICPA Accounting Research Bulletins
APB Opinions
FASB Statements on Financial Accounting Standards
FASB Interpretations
FASB Staff Positions
FASB Statement 133 Implementation Issues
Return to Dictionary Index

126
Financial Ratios & Analysis - Accounting Play
www.AccountingPlay.com
Gross profit Initial profit on sales after cost of goods is deducted
Appears on income statement after revenue and cost of goods sold
High gross profit would indicate that goods sold do not cost much relative to the revenue
generated from sales
Return to Dictionary Index

127
Financial Ratios & Analysis - Accounting Play
www.AccountingPlay.com
Gross profit margin Measure of remaining revenue after deducting the cost of goods sold
High gross profit margin indicates that the cost of goods sold is low relative to the selling price
High profit margins may generally be favorable, but do not account for other operating
expenses
Return to Dictionary Index

128
Financial Ratios & Analysis - Accounting Play
www.AccountingPlay.com
International Financial Reporting Standards (IFRS) Financial reporting standard adopted widely
outside of the US
US companies primarily report under Generally Accepted Accounting Principles (US-GAAP);
however, IFRS is an optional reporting method in some instances
Principles based system
Extraordinary income not segregated on income statement
No last in first out (LIFO) inventory permissible
Development costs may be capitalized under certain criteria
Return to Dictionary Index

129
Financial Ratios & Analysis - Accounting Play
www.AccountingPlay.com
Income statement Statement that reports the financial performance of a company for a specified
period of time
Expenses are deducted from income to arrive at net income or net loss (profit or loss) for a
period of time
Net income or loss at the end of the accounting period flows to retained earnings on balance
sheet
Income - expenses = Net income or loss
Operating income is from normal business activity
Return to Dictionary Index

130
Financial Ratios & Analysis - Accounting Play
www.AccountingPlay.com
Intangible assets Non-physical assets, unlike property, plant, and equipment
Purchased and internally developed in some cases
Amortized (expensed) over the life of the asset
Examples: patents, trademarks, copyrights, franchise licenses, and goodwill
Return to Dictionary Index

131
Financial Ratios & Analysis - Accounting Play
www.AccountingPlay.com
Interest expense Cash paid to lenders for the use of borrowed money
Most interest is a financing expense used for general operations
Some interest, such as interest in connection with construction, is capitalized and becomes a
part of the overall cost of the asset
Interest expense is generated from debt, notes payable, and other company borrowings
Return to Dictionary Index

132
Financial Ratios & Analysis - Accounting Play
www.AccountingPlay.com
Inventory Cost of products ready to be sold or used in the manufacturing process
Manufacturing inventory starts as raw material, moves to work-in-process, and finally a finished
good
Recorded at cost or lower, if the value has declined using a lower of cost or market valuation
Return to Dictionary Index

133
Financial Ratios & Analysis - Accounting Play
www.AccountingPlay.com
Inventory turnover Measures the frequency that inventory is used and replaced
Used to monitor inventory management
Low turnover may indicate company is not selling enough or has over purchased inventory
Turnover ratio should be used in context of the prior year performance or as a comparison to
other competitors
Return to Dictionary Index

134
Financial Ratios & Analysis - Accounting Play
www.AccountingPlay.com
Investments Assets purchased for financial gain
Investment classification affects reporting on the financial statements
Examples: stocks, bonds, and partnership interests as well as physical assets such as land and gold
Return to Dictionary Index

135
Financial Ratios & Analysis - Accounting Play
www.AccountingPlay.com
Invoice 2/10, net/30 Payment terms for items sold
If paid in 10 days, the customer may have a 2% discount
If paid in 30 days, the invoice must be paid in full
Generally terms used to encourage customers to pay faster
Return to Dictionary Index

136
Financial Ratios & Analysis - Accounting Play
www.AccountingPlay.com
Liabilities Debts owed by a business, typically paid in cash when due
Examples: accounts payable, income tax payable, dividends payable, accrued liabilities, and long-term
debt payable
Financial statement: balance sheet
Return to Dictionary Index

137
Financial Ratios & Analysis - Accounting Play
www.AccountingPlay.com
Liability T-account transactions Decrease liabilities with a debit and increase with a credit
Basic entries
Increase liability from a loan: debit cash, credit liability
Increase liability for expense: debit expense, credit liability
Decrease liability from a loan repayment: debit liability, credit cash
Return to Dictionary Index

138
Financial Ratios & Analysis - Accounting Play
www.AccountingPlay.com
Last in first out Inventory accounting system in which last purchases are the first to be used to
determine ending inventory and the cost of goods sold
Oldest costs tend to remain in the inventory account
Results in lower net income in a period of rising prices when compared to the FIFO method
Inventory value is understated in period of rising prices
Acceptable method only under US-GAAP
Return to Dictionary Index

139
Financial Ratios & Analysis - Accounting Play
www.AccountingPlay.com
Long-term assets Expected benefit greater than one year
Examples
Depreciable assets: physical assets used in ordinary operations (property, plant, and equipment)
Intangible assets: non-physical assets used in ordinary operations (copyrights, trademarks,
goodwill)
Return to Dictionary Index

140
Financial Ratios & Analysis - Accounting Play
www.AccountingPlay.com
Long-term bonds payable Represents money borrowed to finance company operations, due in more
than one year
Issued to investors to raise funding
Form of debt financing
Return to Dictionary Index

141
Financial Ratios & Analysis - Accounting Play
www.AccountingPlay.com
Long-term liabilities Debts owed to creditors, due in more than one year from the balance sheet date
Examples: bonds payable, notes payable, and mortgage loans payable
Return to Dictionary Index

142
Financial Ratios & Analysis - Accounting Play
www.AccountingPlay.com
Lower of cost or market Inventory valuation methodology based on price paid or a lower value
calculated following US-GAAP
Inventory cost is never greater than cost
Cost is the price paid for the item
Market value determined by calculating three different values: replacement cost, net realizable
value (NRV), and NRV less normal profit margin
Return to Dictionary Index

143
Financial Ratios & Analysis - Accounting Play
www.AccountingPlay.com
Materiality Defines the level to which certain accounting principles do not apply
Financial statement rounding to the nearest dollar or greater, depending on the size of the
company
Any violation of accounting principles do not change the overall interpretation by the end user
Return to Dictionary Index

144
Financial Ratios & Analysis - Accounting Play
www.AccountingPlay.com
Net profit on sales Measures profitability on sales
Useful for comparison across similar companies and trend analysis
Ratio may not be very useful alone because a company may have low total profit with a high net
profit on sales ratio
Return to Dictionary Index

145
Financial Ratios & Analysis - Accounting Play
www.AccountingPlay.com
Notes payable Debts owed to banks or other creditors based on written agreements
Split on balance sheet as a short-term liability (owed in one year or less) and long-term (due in
more than one year)
Rate of interest and terms specified in lending document
Return to Dictionary Index

146
Financial Ratios & Analysis - Accounting Play
www.AccountingPlay.com
Notes to financial statements Detailed financial information issued with the financial statements
Topics that may be covered: basis of financial presentation, business changes, risks, uncertainties,
accounting developments, business combinations, risk exposure, fair value measurement, investments,
asset summaries, income taxes, related party transactions, debt detail, and other disclosures
Return to Dictionary Index

147
Financial Ratios & Analysis - Accounting Play
www.AccountingPlay.com
Partnerships v. limited partnerships Members of a general partnership have personal liability for
their own actions and actions of partners, while limited partners of a limited partnership have liability
protection, but the general partner does not
General partnership may be formed if any two people are in business together absent any
agreements
Limited partnerships are formal and granted limited liability by the state
Return to Dictionary Index

148
Financial Ratios & Analysis - Accounting Play
www.AccountingPlay.com
Prepaid expense Expenses paid, but not entirely used in the accounting period
Asset until used
Asset becomes an expense once benefit has been received
Examples: insurance, advertising, rent, and subscription services
Return to Dictionary Index

149
Financial Ratios & Analysis - Accounting Play
www.AccountingPlay.com
Pronouncements Financial Accounting Standards Board (FASB) guidance that comprises Generally
Accepted Accounting Principles in the US (US-GAAP)
Comprised of: Statements of Financial Accounting Standards (FAS), Statements of Financial
Accounting Concepts, Interpretations, Technical Bulletins, and Staff Positions
Return to Dictionary Index

150
Financial Ratios & Analysis - Accounting Play
www.AccountingPlay.com
Property, plant, and equipment (PP&E) Long-term assets used in the course of business
Reported on the balance sheet at cost
Depreciated to represent decline in asset value over time
Examples: land, buildings, leasehold improvements, office equipment, furniture, fixtures, and vehicles
Return to Dictionary Index

151
Financial Ratios & Analysis - Accounting Play
www.AccountingPlay.com
Raw material Components used in the manufacturing process that are part of direct costs
Examples: wood, steel, parts, stuffing, cloth, and oil
Does not include indirect costs such as factory utilities or manufacturing labor
Return to Dictionary Index

152
Financial Ratios & Analysis - Accounting Play
www.AccountingPlay.com
Repairs expense Costs of maintaining assets
Expensed costs recognized on the income statement
Ordinary maintenance that does not improve an asset
Return to Dictionary Index

153
Financial Ratios & Analysis - Accounting Play
www.AccountingPlay.com
Retained earnings Sum of all previous profit and losses, less dividends
Net income or loss is recorded to retained earnings at the end of the accounting period
Dividends declared reduce retained earnings
Return to Dictionary Index

154
Financial Ratios & Analysis - Accounting Play
www.AccountingPlay.com
Return on assets Measures asset utilization compared to net income
Useful for comparison across similar companies and trend analysis
Less useful for companies that do not utilize assets much in the production of revenue, such as
consulting firms
Return to Dictionary Index

155
Financial Ratios & Analysis - Accounting Play
www.AccountingPlay.com
Return on equity Measure of profit compared to amounts invested into the company
Useful for comparison across similar companies and trend analysis
High ratio indicates strong profitability relative to the investment
Return to Dictionary Index

156
Financial Ratios & Analysis - Accounting Play
www.AccountingPlay.com
Revenue Income earned from the sale of goods and services
Accrual basis accounting: revenue recognized when goods are delivered or services performed
Cash basis accounting: revenue is recognized when cash is received for goods delivered or services
performed
Return to Dictionary Index

157
Financial Ratios & Analysis - Accounting Play
www.AccountingPlay.com
Revenue recognition Recognize revenue when it is earned and realizable
Goods shipped or services rendered
Revenue recorded before cash is collected
Realize revenue: When cash is received
Customer pays for goods delivered or services rendered
Return to Dictionary Index

158
Financial Ratios & Analysis - Accounting Play
www.AccountingPlay.com
Salvage value Estimated value of a fixed asset at the end of its useful life
Used in depreciation methods: straight-line method, units of production method, and sum-of-
the-years-digits’ method
Return to Dictionary Index

159
Financial Ratios & Analysis - Accounting Play
www.AccountingPlay.com
Selling, general, and administrative expense Costs expensed as they occur
Costs expensed on the income statement in the period in which they occur
Not added to inventory or fixed assets
Selling: costs not in cost of goods sold, such as commissions
General: expenses such as taxes and miscellaneous costs
Administrative: general support and salaries not directly related to manufacturing
Return to Dictionary Index

160
Financial Ratios & Analysis - Accounting Play
www.AccountingPlay.com
Shareholders Owners of a corporation
Influence the company by electing the board of directors
Board of directors elects chief executive officer (CEO) of company
Corporate shareholders limit losses to their original investment and are not personally liable for
corporate actions
Shareholders may be rewarded with stock appreciation, dividends, and sales
Return to Dictionary Index

161
Financial Ratios & Analysis - Accounting Play
www.AccountingPlay.com
Shareholders’ equity Represents value retained by the company
Equity on the balance sheet is defined as: Equity = Assets – Liabilities
Generally comprised of stock, additional paid-in capital, and retained earnings
Represents a value per book which does not take into account certain changes in fair market
value
Financial statement: balance sheet
Return to Dictionary Index

162
Financial Ratios & Analysis - Accounting Play
www.AccountingPlay.com
Sole proprietorship Owned by one person with unlimited liability, because there is no legal separation
from the business and the owner
Most common form of doing business
No shareholders
Owner is personally liable for business and employee actions
Return to Dictionary Index

163
Financial Ratios & Analysis - Accounting Play
www.AccountingPlay.com
Stakeholders Those affected by the outcome of the business
Users of financial information
Return to Dictionary Index

164
Financial Ratios & Analysis - Accounting Play
www.AccountingPlay.com
Statement of cash flows Reports cash in and out of a company for a given period of time
Reconciles beginning period cash to ending cash in three categories: operating, investing, and
financing
Indirect method of preparation uses net income or loss from the income statement to reconcile
beginning cash to ending cash for the period
Return to Dictionary Index

165
Financial Ratios & Analysis - Accounting Play
www.AccountingPlay.com
Statement of cash flows example Statement reporting cash flow activity for a specified period of
time
Statement reconciles net income or loss to ending cash
Changes in cash categorized: operating, investing, and financing
Return to Dictionary Index

166
Financial Ratios & Analysis - Accounting Play
www.AccountingPlay.com
Statement of shareholders’ equity Reports changes in equity during a specified time period due to
earnings and financing activity
Items which may change shareholders’ equity: net income or loss, dividends, other changes in equity,
common stock issuance, additional paid-in-capital, other comprehensive income, and treasury stock
transactions
Equity accounts presented: common stock, additional-paid-in-capital, retained earnings, accumulated
other comprehensive income, and treasury stock
Return to Dictionary Index

167
Financial Ratios & Analysis - Accounting Play
www.AccountingPlay.com
Stock split More shares issued, but overall share value stays the same
Increases outstanding shares and reduces par value per share proportionately
Similar to exchanging a dollar bill for 4 quarters because value is the same, only further divided
Return to Dictionary Index

168
Financial Ratios & Analysis - Accounting Play
www.AccountingPlay.com
Straight-line depreciation Depreciation method, generates same expense each year until asset has
reached the estimated end of its useful life
Takes into account salvage value
Return to Dictionary Index

169
Financial Ratios & Analysis - Accounting Play
www.AccountingPlay.com
Sum-of-the-years-digits' depreciation Accelerated depreciation method, generates more expense in
earlier years
Takes into account salvage value
Return to Dictionary Index

170
Financial Ratios & Analysis - Accounting Play
www.AccountingPlay.com
Times interest earned Measures ability to meet interest obligations
Useful for comparison across similar companies and trend analysis
A higher ratio indicates a better ability to repay interest obligations
Return to Dictionary Index

171
Financial Ratios & Analysis - Accounting Play
www.AccountingPlay.com
Treasury stock Stock repurchased by company
Reduces outstanding shares
Recorded at cost
Contra account presented as a negative number on financial statements
Return to Dictionary Index

172
Financial Ratios & Analysis - Accounting Play
www.AccountingPlay.com
Trial balance Summarizes all general ledger accounts in a consolidated format
Used to form the financial statements
Summarizes debit and credit balances by account
Can be adjusted with journal entries
Return to Dictionary Index

173
Financial Ratios & Analysis - Accounting Play
www.AccountingPlay.com
Units-of-production depreciation Depreciation method, matches expense with machine output
Takes into account salvage value
Return to Dictionary Index

174
Financial Ratios & Analysis - Accounting Play
www.AccountingPlay.com
Unrealized gain (loss) Change in value of an asset still owned
A gain or loss is unrealized until the asset is sold or otherwise disposed of
Depending on financial reporting, may or may not appear in financial statements
Stock will have an unrealized gain if the current value is greater than the basis (purchase price)
Stock will have unrealized loss if the current value is less than the basis (purchase price)
Return to Dictionary Index

175
Financial Ratios & Analysis - Accounting Play
www.AccountingPlay.com
Vendor Sells goods and services to customers
Credit purchases become a part of accounts payable
Return to Dictionary Index

176
Financial Ratios & Analysis - Accounting Play
www.AccountingPlay.com
Work-in-process (WIP) Asset account that accumulates manufacturing costs until the good is finished
Raw materials, manufacturing labor, and manufacturing overhead added to WIP
Costs such as raw material and manufacturing labor accumulate in a WIP account until the item
is finished, at which point they move to finished goods (FG)
Return to Dictionary Index
Recommended