CHAPTER-III
72
3.0.0 INTRODUCTION
This chapter consisted of the procedure, which has been followed by the
researcher in her investigation. The procedure is an important phase of research
and the design of the study. A research design is the arrangement of conditions
for collection and analysis of data in a manner that aims to combine the
relevance to the research purpose with economy in procedure. In fact the
research design is the conceptual structure within which research is conducted. It
constitutes the blueprint for the collection, measurement and analysis of data. It
has the great bearing on the reliability of results arrived and as such constitutes
the firm foundation of the entire edifice of research work. The quality of
research depends not only on the adequacy of the research design, but also on
the fruitfulness of the measurement procedure employed. Thus procedure of the
study is of prime importance in attacking any research problem in a scientific
manner.
Remenyi et al (2003)1 described methodology as the “overall approach to
a problem which could be put into practice in a research process, from the
theoretical underpinning to the collection and analysis of data”. On a similar
note, Collis and Hussey (2009)2 identified methodology as the “overall
approach to the entire process of the research study”. Research methodology, as
per the above definitions, is focused around the problems to be investigated in a
research study and hence is varied according to the problems to be investigated.
Saunders et al (2009)3 presented the overall research methodology in the form
of an “onion”, in which the thoughts with regard to the research problem lie in
the centre and thus several layers have to be “peeled away” before coming to this
central position. These layers are the important aspects to be considered in
determining the research methodology for a particular research study.
1- Remenyi, D., Williams, B., Money, A. & Swartz, E. Doing research in business and
management: An introduction to process and method, London, SAGE Publications. (2003)
2- Collis, J. & Hussey, R. Business Research: A practical guide for undergraduate and
postgraduate students, 3rd edition, New York, Palgrave Macmillan. (2009)
3- Saunders, M., Lewis, P. & Thornhill, A. Research methods for business students, 5th ed.,
Harlow, Pearson Education. (2009)

CHAPTER-III
73
Research design is the overall plan for connecting the conceptual research
problem to the pertinent research. In other words the research design articulates
what data is required, what methods are going to be used to collect and analyze
this data, and how all of this is going to answer the research question. Both data
and methods and the way in which these will be configured in the research
project, need to be the most effective in producing the answers to the research
question. The function of the research design is to ensure that the evidence
obtained enables the researcher to effectively address the research problem as
unambiguously as possible. In social science research, obtaining evidence
relevant to the research problem generally entails specifying the type of evidence
needed to test a theory, to evaluate the program or to accurately describe a
phenomenon. However, researchers can often begin their investigations far too
early because they have thought critically about what information is required to
answer the study‟s research question. Without attending to these design issues
beforehand, the conclusions drawn risk being weak and unconvincing and
consequently will fail to adequate address the overall research problem.
The length and complexity of research designs can vary considerably, but
any sound design must at least contain the following things:
a) A clear statement of the research problem.
b) Procedures and techniques to be used to gathering information.
c) The population to be studied.
d) Methods to be used in processing and analyzing data.

CHAPTER-III
74
Figure 3.0.0: Exhibiting the Hierarchy of Research Procedure
The procedure of the research followed by the researcher has been classified into
following heads:
The method of the study
Selection of the subject sample
Construction of the tools
Selection of the tools
Description of the tools
Collection of data
Administration of various tools
Statistical techniques used
Statistical Techniques
Scoring of the Tools
Administration of the Tools
Construction of the Tools
Selection of the Standerdised Tools
Sampling Procedure
Method of the Study

CHAPTER-III
75
Selection of Tools
Collection of data
Data Processing
Editing and Coding Data
Interpretation of data
Findings and Conclusion
Report with Educational implications
Defining the Problem and formulating the objective
Selection of Research Method
Selection of Research Techniques
Selection of Sample Design
Non-Probability
Statement of the Problem
Tools related to Mental aspect
ntelligence
Creativity
Academic achievement Motivation
Study Habit
Tools related to Emotional aspect
Adjustment
Frustration
Temperament
Aspiration level
Self efficacy
I
Tools related to Social aspect
Social Maturity
Pear acceptance
Parent child relationship
Home environment
School environment
Descriptive Survey Method
Case Study Method
Observation Schedule
Interview Schedule
Questionnaire
Purposive Method
Field Work
Figure 3.1.0: Showing Research Procedure of the Study
The figure 3.1.0 indicates that the research process consists of a number
of closely related activities as shown through, but such activities overlap rather
than following a strictly prescribed sequence. At times the first step determines
the nature of the last step to be undertaken. If subsequent procedures have not
been taken into account in the early stages, serious difficulties may arise which
may even prevent the completion of the study. One should remember that the
CHAPTER-III
76
various steps involved in a research process are neither mutually exclusive, nor
separate and distinct.
3.1.0. METHOD OF THE STUDY
According to the nature of the problem the researcher carried out the
present study on the lines of survey method and case study method which are
kind of descriptive research studies. Descriptive research studies are designed to
obtain pertinent and precise information concerning the current status of
phenomenon and wherever possible, to draw valid general conclusions from the
facts discovered. The main goal of this type of research is to describe the data
and characteristics about what is being studied. The idea behind this type of
research is to study frequencies, averages and other statistical calculations.
Although this research is highly accurate, it does not gather the cause behind a
situation. Descriptive research is mainly done when the researcher wants to gain
a better understanding of a specific topic. Descriptive research is the exploration
of the certain existing phenomena, the details of which would not be known.
According to George. J. Mouly (1995), “no category of educational
research is more widely used than the type known variously as the „survey‟ the
normative survey, status and descriptive researches. This broad classification
comprises a variety of specific techniques and procedures all similar from the
standard point of its purpose that is to establish the phenomena under
investigation.”
The main objective of the present study was to perform a
multidimensional study of learning disabled children or adolescents. For finding
the learning disabled subject sample from the population „Survey Method‟ was
used. Survey studies are conducted to collect detailed description of existing
phenomena with the intent of employing data to justify current conditions and
practices or to make more intelligent plans for improving them. After getting the
required sample of learning disabled children case study of each subject was
done. A case study is an in depth study of a particular research problem rather
Mouly, G.J. The Science of Educational research, Sage Publications, New Delhi. (1963)

CHAPTER-III
77
than a sweeping statistical survey. It is often used to narrow down a very broad
field of research in to one or a few easily researchable examples. The case study
method is also useful for testing whether a specific theory or model actually
applies to phenomena in the real world. It is useful design when not much is
known about a phenomenon.
3.2.0 SELECTION OF THE SUBJECT SAMPLE
Selection of the sample is an integral part of every research project and its
success depends upon the right selection of the sample. The study of entire
population is neither possible nor advisable due to changeability. So, the use of
sampling technique is must to determine the representative sample of the
problem. In the present study the sample was selected according to the following
aspects:
3.2.1 DESCRIPTION OF THE POPULATION
Population of the present study consisted of all the children studying in
class IX and X in C.B.S.E, I.C.S.E., and U.P. board schools of Agra city (U.P.).
3.2.2 SELECTION OF SAMPLE
In the process of sample selection the first step was to survey the schools,
(six each of the CBSE, ICSE and UP board) and to identify the learning disabled
children of class IX and X by applying the learning disability identification
questionnaire. By using purposive sampling method, units were selected from
different schools surveyed, where the cases were identified.

CHAPTER-III
78
Fig. 3.2.1: Exhibiting the Method of Sample Selection
S a m p le
S e le c t io n o f In s ti tu tio n (S im p le R a n d o m S a m p lin g )
I .C .S .E . B o a rd C .B .S .E . B o a rd U .P. B o a rd
S t . P a u l 's C h u rc h
C o ll e g e , A g ra
R a g e n d r a S w a ru p
P u b l i c S c h o o l, A g ra
H o ly P u b l ic S c h o o l , A g r a
S t. A n d re w 's P u b li c
S c h o o l , A g r a
R a d h a b a l la b h In te r
C o ll e g e , A g ra
S o a m ib a g h H ig h e r
S e c o n d a ry S c h o o l , A g r a
S e le c tio n o f C la s s IX a n d X
A d m in is tra tio n o f L e a rn i n g d is a b l e d Q u e s ti o n n a ir e
L e a r n in g d is a b le d c h ild re n
5 0 B o y s 5 0 G ir ls

CHAPTER-III
79
3.2.3 SIZE OF THE SAMPLE
The main consideration in the selection of the sample was its adequacy
and representativeness. In this study representativeness was ensured by adopting
purposive sampling technique and adequacy by its size. School wise numbers of
sample units on whom tests were administered and the number of usable returns
has been presented in the table 3.2.1.
Table 3.2.1 Showing School Wise Selection of Units
S.No. Name of The School No. of I.D. Children found in Class IX and
X
Total Number of
Students
Selected Students
Girls Boys Total
1 Radha Krishna Sanatan
Dharma Inter College
87 10 00 10
2 Sant Ram Krishna Kanya Inter
College
65 11 01 12
3 Ratan Muni Jain Inter College 185 07 09 16
4 Fatehchand Inter College 74 04 08 12
5 Radha Ballabh Inter College 68 00 04 04
6 M.D. Jain Inter College 182 00 06 06
7 University Model School 176 05 06 11
8 Holy Public School 140 02 03 05
9 Agra Public School 150 02 03 05
10 Ess Ess Convent 125 04 07 11
11 Ess Ess Public School 51 01 02 03
12 St. Andrew's Public School 135 03 03 06
13 Holeman Institute 120 02 03 05
14 Ragendra Swaroop Public
School
140 04 02 06
15 St. Conrad's Inter College 143 03 01 04
16 St. Paul's Church College 160 01 01 02
17 St. Peter's College 130 00 01 01
18 St. Patrick School 110 01 00 01
Total 2241 60 60 120

CHAPTER-III
80
3.2.4 JUSTIFICATION OF THE SAMPLE
Some children, despite having an average or above Average level of
intelligence have real difficulty acquiring basic academic skills and these
difficulties go with the growing age of these children from childhood to
adolescence. In the present study a sample of class IX and X students is taken
which will give a comprehensive and comparative account of the developmental
changes in the learning disabled boys and girls.
3.3.0 CONSTRUCTION OF THE QUESTIONNAIRE FOR THE
IDENTIFICATION OF LEARNING DISABLED CHILDREN
A meaningful and applicable research needs reliable, suitable,
interpretive, economic and usable tests to meet the requirement of the study.
Most educational researches lead to the gathering of data by means of some
standardized tests or self constructed tool. Tool serves as important purpose in
empirical research by providing a good base to the researches for collecting data.
As there was no readymade tool available to identify the learning disabled
children the researcher has developed learning disabled identification
questionnaire. The scale consisted of 77 statements which have nine subscales
with five point scale items. These are related to learning skills such as listening,
Reading, Writing, Speaking, Mathematical Reasoning, Thinking, Gross and
Fine Motor Skills, Social Emotional Domain and Spelling.
3.3.1 PROCEDURE OF THE TOOL DEVELOPMENT
1. IDENTIFICATION OF THE DIMENSIONS OF TOOL
After consultation with supervisor and the literature available on learning
disabled children, researcher has identified the dimensions of the tool.
Dimensions of learning disabled identification questionnaire are Listening,
Reading, Writing, Speaking, mathematical Reasoning, Gross and Fine Motor
Skills, Social Emotional domain and Spelling.

CHAPTER-III
81
2. DEFINING THE OBJECTIVES OF CONSTRUCTED TOOLS
The objective of the development of learning disabled children questionnaire is
to identify the learning disabled children in order to make the multi-dimensional
study of the identified learning disabled children.
3. POOLING THE ITEMS
After the intensive study about the learning disabled children and by the
responses of the experts and the teachers, the investigator got engaged in pooling
the items. The investigator examined the pooled list and categorized the items.
Repetition were removed and made all the statements brief and easy to
understand. The investigator selected relevant items related with the objective of
the study.
4. PREPARATION OF THE FIRST DRAFT
Equipped with various suggestions the researcher selected and wrote the items.
Some of the items were modified and some dropped after comparing their level
of difficulty. Reshuffling among the sequencing of items was also done to
provide a draft following precautions were taken:
a) Easy and clear language
b) Objective centered questions
5. TRYOUT OF THE FIRST DRAFT OF THE TOOL
The main purpose of the tryout was to note down the difficulty encountered by
the respondent answering various items and to exclude the irrelevant items in the
tool. The researcher assessed the tool considering all the features of a good tool
and pattern of questions. Also the judgmental rating of the expert related to the
field of learning disability, psychology and education was done.
6. FINAL DRAFT
After removing the defects and on the basis of experts suggestions final modified
draft was prepared.

CHAPTER-III
82
3.3.2 VALIDITY OF THE TOOL
The validity of the test means the degree to which the test actually
measures which it proposed to measure. The validity provides a direct check on
how well it tells us more than the degree to which the test is fulfilling his
functions. As the tool developed using the proper steps of tool development and
in consultation with subject‟s experts, the tool consists of face validity.
FACE VALIDITY
Validity of the questionnaire was determined on the basis of face validity. The
validity was determined as:
“Expert opinion that was requested to examine the questionnaire according to
the set objectives and ability of the students to answer every item of
questionnaire.”
3.3.3 RELIABILITY OF THE QUESTIONNAIRE
Reliability refers to the consistency of the scores or measurement which is
reflected in the reproducibility of the scores. The researcher has developed tool
for identification of learning disabled children according to the objectives of the
study. As the tool has adhered to its technical testing of reliability and validity,
the researcher has calculated different correlations as represented in the
following table:
Table 3.3.1: Showing Reliability of Learning Disability Identification
Questionnaire
TOOL NAME
RELIABILITY
Test-retest Method Split-half Method
Learning Disability Questionnaire 0.76 0.67

CHAPTER-III
83
3.4.0 SELECTION AND DESCRIPTION OF THE TOOLS
A researcher requires many data gathering tools and techniques which may vary
in their complexity, design, administration and interpretation. Each tool or
technique is appropriate for the collection of certain type of evidence or
information. The researcher has to select from the available tools, which will
provide data, helps in the testing of hypotheses. Following figure shows the
criteria of selection of the tools:
Figure 3.4.0: Criteria for Selection of Tools
3.4.1 SELECTION OF TOOLS TO MEASURE BEHAVIORAL
PROBLEMS
3.4.1.1 Survey of the Various Tools to Measure Behavioral Problem
A search for suitable tool to assess the problem behavior of the children brought
only three standardized tools to the notice of the researcher:

CHAPTER-III
84
Table 3.4.1.1.1: Tools available for measuring the Behavioral Problems
S. N. Test Name Author Language Age-Group
1. Youth Problem
Inventory
M. Verma Hindi/English 16 – 20 Yrs.
2. Problem Checklist M.C. Joshi and
Jagdish Pandey
Hindi/English High School
3. Problem Behavior
Checklist
Vinita
Veeraraghavan
and
Archana Dogra
English Married
Couples
The researcher found only three inventories to measure problem behavior
of the children and finally problem behavior checklist developed by Vimla
Veera Raghavan and Archana Dogra was selected. Though it is in English, the
researcher ;preferred it because youth problem inventory by M. Verma is only
for 16 – 20 years age group. Problem checklist by M.S. Joshi and Jagdish
Pandey is applicable exclusively for high school students which exactly fulfills
out purpose but the parents are the one who can directly observe the behavior of
their children so the researcher preferred the inventory by Vimla Veeraraghavan
and Archana Dogra.
Problem Behavior Checklist
Description and administration
The checklist was devised to identify the emotional and conduct problems
of children. There are 58 items in the scale. These items were to be tick-marked
by the parents as to whether the symptoms occurred „most often‟, „occasionally‟
or „never‟ where the response occur „most often‟ it is indicative of high problem
behavior, and „occasionally‟ and „never‟ were indicative of „average‟ and „no
problem behavior‟ respectively.

CHAPTER-III
85
Scoring
Items indicative of high problem behavior will be given 3; „average‟ and
„no problem behavior‟ will be assigned a score of 2 and 1 respectively. Total
scores obtained ranges between 58 –174, thus indicates that the higher the score,
the higher the problem behavior of the child, and the lower the score, the lower
the problem behavior of the child. The categories of problem behavior are given
below:
Low Problem Behavior - 58-96
Moderate Problem Behavior - 97-135
High Problem Behavior - 136-174
Tool Profile
Name
of the
test
Constru
-ctor
Lang
uage
Na
tur
e
Filled
by
Group/
Individ
ual
Dura
tion
Reliability Validity
Proble
m
Behavi
our
Checkli
st
V.
Veera-
raghvan
and
Archana
Dogra
Eng-
lish
Ch
ec
k-
list
Marri
ed
Coupl
es
Both No
Time
Limit
Split half – 0.81
Test retest 0.85
Fairly
High
3.4.2 SELECTION, ADMINISTRATION AND SCORING OF THE
TOOLS FOR MENTAL ASPECTS
3.4.2.1 Survey of the Various Tools to Measure Intelligence
To assess the intelligence of the children, a search for the suitable tool was made
and the following tools were found available:

CHAPTER-III
86
Table 3.4.2.1.1 Showing Availability of Tools to Measure Intelligence
S. N. Test Name Author Language Age-Group
1. Group test of
Intelligence
Pramila Ahuja English 9 – 13 Years
2. Verbal Intelligence
Test
R.K. Ojha and
Raychoudhary
Hindi 13 – 20 Years
3. Group test of
Intelligence
S. Jalota English College educated
adults
The researcher found these three inventories to measure the intelligence
of learning disabled children and finally verbal intelligence test by R.K. Ojha
and Ray Choudhary was selected because this test is an individual test and for 13
– 20 years age. But the other two tests were for 9-13 years and for college adults
respectively.
Verbal Test of Intelligence
Description
This test is an objective intelligence test to measure the general mental
ability or general intelligence. There are eight parts in the test. The number of
questions in each part is different. The description of every part is given below:
1. Classification: In this sub-test fifteen parts are given in each of them five
words are there out of which on word is dissimilar to other. The student has to
underline that word.
2. Analogies: In this sub-test also fifteen parts are given. There are four
options in each part. There is a relationship between the pair of first two words.
For third word student has to underline one word out of the four given options.
3. Synonyms: Twenty words are given in this sub-test. In each part one
word and four options are given the bracket. That word has to be underlined, the
meaning of which is similar to the main word.
CHAPTER-III
87
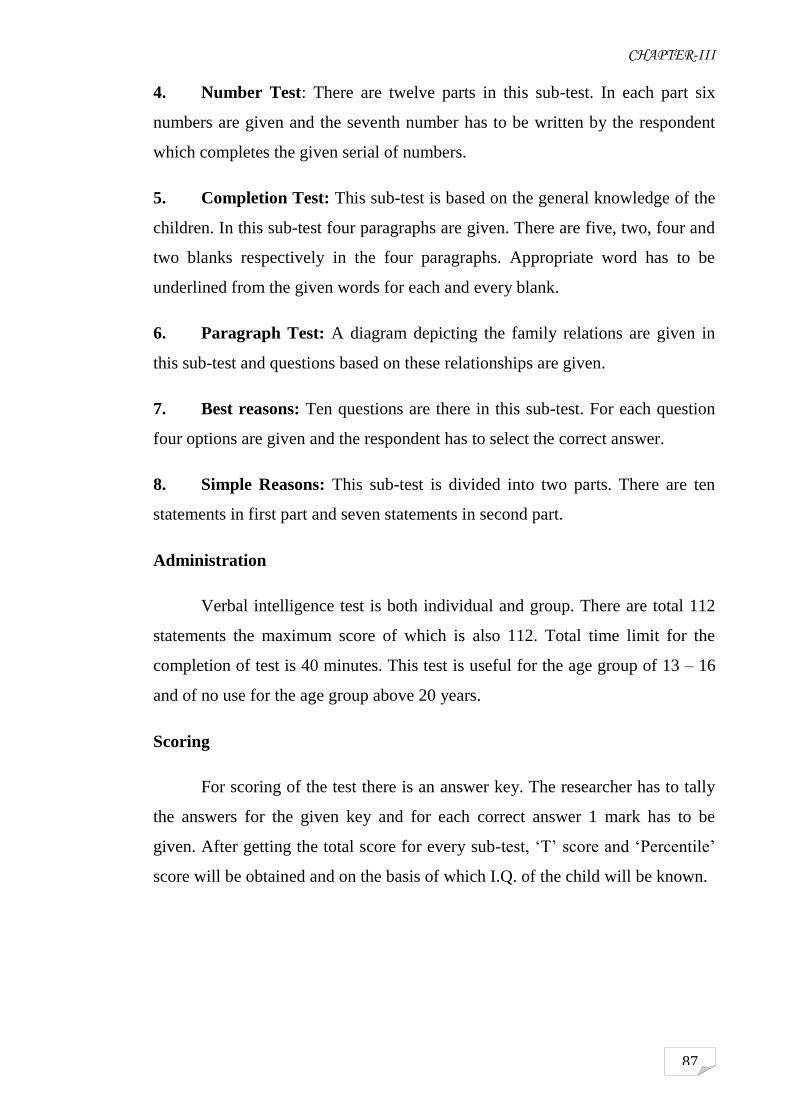
4. Number Test: There are twelve parts in this sub-test. In each part six
numbers are given and the seventh number has to be written by the respondent
which completes the given serial of numbers.
5. Completion Test: This sub-test is based on the general knowledge of the
children. In this sub-test four paragraphs are given. There are five, two, four and
two blanks respectively in the four paragraphs. Appropriate word has to be
underlined from the given words for each and every blank.
6. Paragraph Test: A diagram depicting the family relations are given in
this sub-test and questions based on these relationships are given.
7. Best reasons: Ten questions are there in this sub-test. For each question
four options are given and the respondent has to select the correct answer.
8. Simple Reasons: This sub-test is divided into two parts. There are ten
statements in first part and seven statements in second part.
Administration
Verbal intelligence test is both individual and group. There are total 112
statements the maximum score of which is also 112. Total time limit for the
completion of test is 40 minutes. This test is useful for the age group of 13 – 16
and of no use for the age group above 20 years.
Scoring
For scoring of the test there is an answer key. The researcher has to tally
the answers for the given key and for each correct answer 1 mark has to be
given. After getting the total score for every sub-test, „T‟ score and „Percentile‟
score will be obtained and on the basis of which I.Q. of the child will be known.

CHAPTER-III
88
Tool Profile
Name of
the test
Constr
-uctor
Lang
uage
Nat-
ure
Filled
by
Group/
Individ
ual
Durati
-on
Reliability Validity
Verbal
Intellige
nce Test
R.K.
Ojha
and
Ray
Choud
hary
Hindi Ver
bal
Intel
lige
nce
Test
13 –
16
Years
Childr
en
Both 40
Min. Split-half
0.81
Test retest 0.91
Fairly
High
3.4.2.2 Survey of the Various Tools to Measure Academic Achievement
Motivation
To assess the Academic Achievement motivation of the students, a search
for the suitable tool was made and the following tools were found available:
Table 3.4.2.2.1: Showing Available Tools to Measure Academic achievement
Motivation
S.No. Tool Name Author Name Language Age
Group
1. Achievement Motive
Test
V.P. Bhargava Hindi/English 16-22
Years
2. Achievement
Motivation Scale
Pratibha Deo and
Asha Mohan
English 13-20
Years
3. Achievement Motive
Scale
P.S.N. Tiwari Hindi Any
4. Academic Achievement
Motivation Test
T.R.Sharma Hindi 14 Years
The researcher found three inventories for achievement motivation but
only single test for academic achievement Motivation. So, researcher has

CHAPTER-III
89
selected the Academic Achievement Motivation Test by T.R. Sharma for the
present study.
Description, Administration and Scoring of the Academic Achievement
Motivation Test:
This test is an objective questionnaire with 38 items of two response
alternatives. It is meant for 14+
age and for school going children. There are 38
items and the maximum score is also 38. It can be administrated on a group or
individual easily. There are two options yes and no and the respondents have to
tick on one of them.
For scoring of the test an answer key is attached. The researcher has to
tally the answers from the given key and for each correct answer one mark has to
be given.
Tool Profile
Name of
the test
Constr
-uctor
Lang
uage
Nat-
ure
Filled
by
Group/
Individ
ual
Durat
-ion
Reliability Validit
y
Academi
c
Achieve
ment
Motivati
on test
T.R.
Sharm
a
Hindi Ver
bal
Test
14
Years
Childr
en
Both 30
Min.
High Fairly
High
3.4.2.3 Survey of the Various Tools to Measure Creativity
To measure the creativity of learning disabled children only three
standardized tools of creativity were found relevant to researcher. These are:

CHAPTER-III
90
Table 3.4.2.3.1: Showing Available Tools to Measure Creativity
S. No. Test Name Author Language Age-Group
1. Passi Test of
Creativity
B.K. Passi Hindi/English X – XI
grades
2. Verbal test of
Creative Thinking
Baqer Mehndi Hindi/English VII and VIII
class
3. Verbal test of
Scientific Creativity
V.P. Sharma
and J.P.
Shukla
Hindi/English VII and VIII
class
The researcher found only three standardized tools to measure the
creativity of children and the selected tool was verbal test of creative thinking by
Baqer Mehndi. The idea behind the selection of tool is that it is a verbal test
whereas the Passi Test of creativity is a Performance Test. Another point is that
it is for VII and VIII grade students which can be used to IX and X grade
students but Passi test is only for X & XI grade student which cannot be used for
the children of lower classes. The third tool that is verbal test of scientific
creativity is made to assess only scientific creativity whereas the researcher
needs to measure creativity in all the areas. So, this tool also got rejected by the
researcher and finally the verbal test of creative thinking by Baqer Mehndi was
selected as the most appropriate tool.
Verbal Test of Creativity
Description
The verbal test of creativity includes four sub-tests, namely, consequences test,
unusual uses test, similarity test and product improvement test.
(i) Consequences test: The consequences test consists of three hypothetical
situations:
a) What would happen if man could fly like birds?
b) What would happen if our schools had wheels?

CHAPTER-III
91
c) What would happen if man does not have any need for food?
The subject is required to think as many consequences of these situations
as he can, and write them under each situation in the space provided. The time
allowed for the three problems is 4 minutes each.
(ii) Unusual Uses Test: This test presents the subject with the names of three
common objects – a piece of stone, a wooden stick, water and requires
him to write as many novel, interesting and unusual uses of these objects
as he may think of. This test measures the subject‟s ability to retrieve
items of information from his personal information in storage. Evidently,
it measures also the subject‟s ability to shift frames of reference to use the
environment in an original manner. The time allowed for the three tasks is
5 minutes each.
(iii) New Relationships Test: This test presents the subject with there pairs of
words apparently different-tree and house, chair and ladder, air and water,
and requires him to think and write as many novel relationships as
possible between the two objects of each pair in the space provided. The
test provides an opportunity for the free play of imagination and
originality. The time allowed for each pair of words is 5 minutes.
(iv) Product Improvement Test: In this test the subject is asked to think of a
simple wooden toy of a horse and suggest addition of new things to it to
make it more interesting for the children to play. The time allowed is 6
minutes.
Administration
The total time required for administering the test is 48 minutes in addition
to time necessary for giving instructions, passing out test booklets to children
and collecting them back.

CHAPTER-III
92
Scoring
There is no right or wrong responses for the test. Each item is to be scored
for fluency, flexibility and originality. The definitions of these terms are given
below:
1) Fluency: Fluency is represented by number of relevant and unrepeated
ideas which the testee produces. Relevance is judged on the basis of the
appropriateness of the response when considered in relation to the test problem.
An unrepeated idea is one which has been expressed only once under a given
problem.
2) Flexibility: Flexibility is represented by a person‟s ability to produce
ideas which differ in approach or thought trend. All ideas which fall under one
category of approach or thought trend are treated as one for purposes of
flexibility scoring. There could be intermediate scores for flexibility depending
on the number of categories of thought trends to which the responses belong.
3) Originality: Originality is represented by uncommonness of a given
response. Responses given by less the 5% of the group are treated as original.
Tool Profile
Name
of the
test
Constr-
uctor
Lan
gua
ge
Nat-
ure
Filled
by
Group/
Individual
Dura-
tion
Relia-
bility
Validity
Verbal
test of
Creativ
e
Thinkin
g
Baqer
Mehndi
Hin
di/
Engl
ish
Test
of
Crea
tivit
y
VII
and
VIII
class
Both 48 Min. Test
retest 0.939
0.39
3.4.2.4 Survey of the Various Tools of Study Habit
To find out the study habit of children researcher has made a refined
search and got these tests available:

CHAPTER-III
93
Table 3.4.2.4.1: Showing Availability of Tools for Study Habit
S.
No.
Test Name Author Language Age-Group
1. Test of study habits
and attitudes
C.P.G. Mathur Hindi/English 13 – 16 +
Years
2. Study habit inventory M.
Mukhopadhay
aya and D.N.
Sansanwal
Hindi/English Post
Secondary
Level
Students
3. Study habit inventory M.N. Palsane
and S. Sharma
Hindi/English College
students
The study habit inventory by M.N. Palsane and S. Sharma was for college
students and the test of study habits and attitudes by C.P.G. Mathur was for the
children of 13 – 16 years but this test measures both study habit and attitudes
whereas, the researcher is interested in measuring the study habit only so, the
researcher has decided to use the study habit inventory by M. Mukhopadhayaya
and D.N. Sansanwal to fulfill the objective of the research.
Study Habit Inventory
Description
The inventory comprises 70 items pertaining to nine sub-components namely:
1. Comprehension (12 items)
2. Concentration (10 items)
3. Task orientation (9 items)
4. Study sets (7 items)
5. Interaction (3 items)
6. Drilling (4 items)
7. Supports (22 items)
8. Recording (2 items)
9. Language (1 item)

CHAPTER-III
94
These components characterize the basis of study habits. The items have
been drafted in affirmative (52 items) and negative (18 items) forms.
Table 3.4.2.2: Items of Study Habit Inventory
Affirmative (+)
items
+
1, 2, 3, 4, 5, 6, 7, 8, 9, 11, 12, 13, 14, 15,
22, 23, 24, 25, 27, 29, 30, 31, 32, 34, 38,
39, 41, 43, 44, 46, 49, 50, 51, 52, 53, 54,
55, 56, 57, 58, 59, 60, 61, 62, 63, 64, 65,
66, 67, 68, 69, 70
52
Negative (-) items
–
10, 16, 17, 18, 19, 20, 21, 26, 28, 33, 35,
36, 37, 40, 42, 45, 47, 48 18
Total Items 70
Administration
The test booklet with 70 items will be provided to each candidate and
they have given instructions to put a (x) sign in one column out of five response
columns. These five responses are:
1. Always
2. Frequently
3. Sometimes
4. Rarely
5. Never
Scoring and Interpretation
Scoring and interpretation forms have been provided separately on the
last page of consumable test booklet. In it, Area-wise serial number of items
have been provided to facilitate area-wise scoring and finding out the area-wise
raw scores as per scoring procedure i.e. for positive items – 4, 3, 2, 1, 0 and for
negative items – 0, 1, 2, 3, 4.

CHAPTER-III
95
Table 3.4.2.3: Scoring Procedure of Study Habit Inventory
Items Always Frequently Sometimes Rarely Never
Positive
Items
4 3 2 1 0
Negative
Items
0 1 2 3 4
After scoring and finding out the raw scores for each area, they be totalled for
getting the raw scores for total inventory.
Tool Profile
Name
of the
test
Constructor Langu
age
Natu
re
Group/
Individ
ual
Durati
on
Reliabili
ty
Validi
ty
Study
Habit
Invent
ory
M.
Mukhopadhya
ya and D.N.
Sansanwal
Hindi/
Englis
h
Inven
tory
Both No
Time
Limit
0.91
(Split
half
method)
Fairly
High
3.4.3 SELECTION, ADMINISTRATION AND SCORING OF THE
TOOLS FOR EMOTIONAL ASPECTS
3.4.3.1 Survey of the Various Tools to Assess Adjustment
To assess Adjustment of children researcher has searched various tools and
found these tools available:

CHAPTER-III
96
Table: 3.4.3.1.1: Availability of Tools to Assess Adjustment
S.
No.
Test Name Author Language Age-Group
1. Bell Adjustment
Inventory
S.M. Mohsin,
Shamshad
Hussain and
Khursheed Jehan
Hindi Intermediate
2. Adjustment Inventory P. Kumar Hindi College going
students
3. High School
Adjustment Inventory
A.K. Singh and
A. Sen Gupta
Hindi High school
students
4. Adjustment Inventory
for school students
A.K.P. Sinha
and R.P. Singh
Hindi/Eng
lish
14 – 18 years
In these available tools bell adjustment inventory is for intermediate
students and adjustment inventory by P. Kumar in for college students so both
are not suitable for the research. High school adjustment inventory by A.K.
Singh and A. Sen Gupta and adjustment inventory for school students by A.K.P.
Sinha and R.P. Singh both inventories fulfill the objective of research but
researcher has preferred adjustment inventory by A.K.P. Sinha and R.P. Singh
because this is in both Hindi and English language whereas high school
adjustment inventory is only in Hindi language.
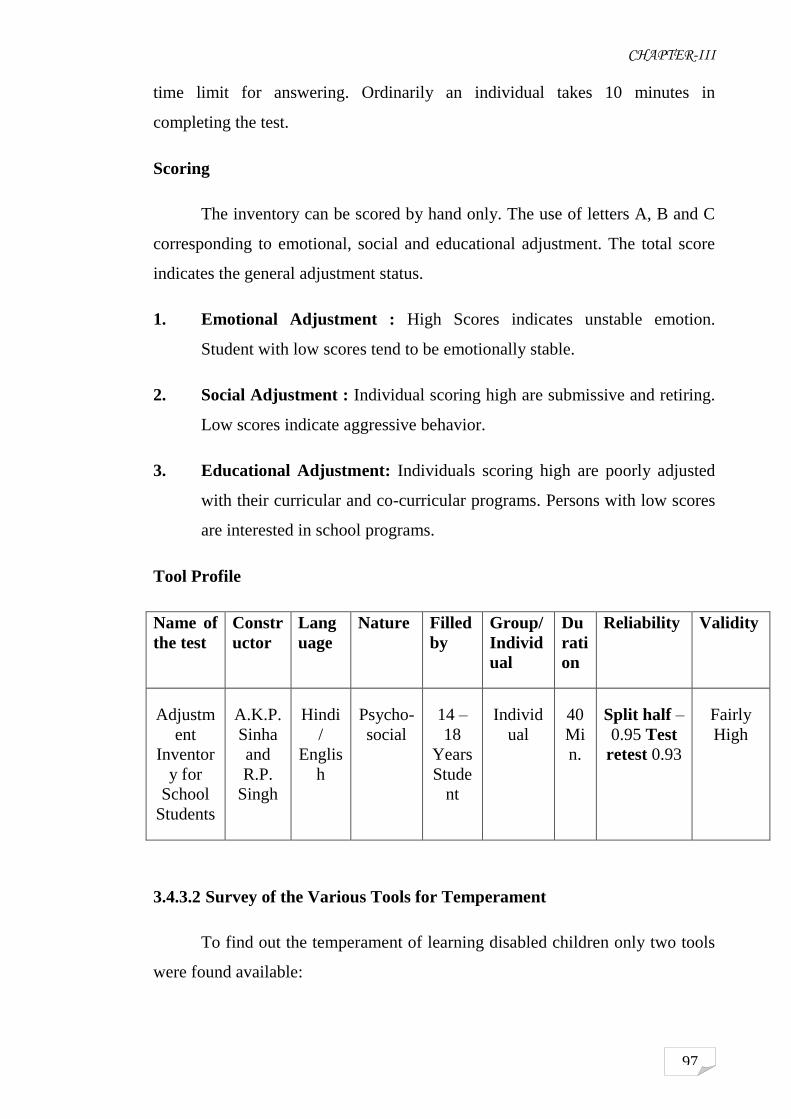
Adjustment Inventory for School Students
Description and Administration
The Adjustment Inventory has been designed for use with Hindi knowing
school students of India. The Inventory seeks to segregate well adjusted
secondary school students (age group 14 – 18 years) from poorly adjusted
students in the three areas of adjustment : Emotional, Social and Educational.
There are 60 questions in the test showing the problem of school students in the
three areas. The questions were to be answered in „Yes‟ or „No‟. There is no
CHAPTER-III
97
time limit for answering. Ordinarily an individual takes 10 minutes in
completing the test.
Scoring
The inventory can be scored by hand only. The use of letters A, B and C
corresponding to emotional, social and educational adjustment. The total score
indicates the general adjustment status.
1. Emotional Adjustment : High Scores indicates unstable emotion.
Student with low scores tend to be emotionally stable.
2. Social Adjustment : Individual scoring high are submissive and retiring.
Low scores indicate aggressive behavior.
3. Educational Adjustment: Individuals scoring high are poorly adjusted
with their curricular and co-curricular programs. Persons with low scores
are interested in school programs.
Tool Profile
Name of
the test
Constr
uctor
Lang
uage
Nature Filled
by
Group/
Individ
ual
Du
rati
on
Reliability Validity
Adjustm
ent
Inventor
y for
School
Students
A.K.P.
Sinha
and
R.P.
Singh
Hindi
/
Englis
h
Psycho-
social
14 –
18
Years
Stude
nt
Individ
ual
40
Mi
n.
Split half –
0.95 Test
retest 0.93
Fairly
High
3.4.3.2 Survey of the Various Tools for Temperament
To find out the temperament of learning disabled children only two tools
were found available:

CHAPTER-III
98
Table 3.4.3.2.1: Exhibiting Available Tools for Temperament
S.
No.
Test Name Author Language Age-Group
1. Dimensions of
Temperament Scale
N.K. Chadha
and
S. Chandna
Hindi /
English
14 – 18 Years
2. Temperament
Schedule
S.Malhotra
and Anil
Malhotra
Hindi /
English
4 – 14 Years
Dimensions of Temperament Scale by N.K. Chadha and S. Chandna is
preferred over the Dimension schedule by S. Malhotra and Anil Malhotra for the
research work because dimensions of temperament scale measure 15 dimensions
whereas the other one measures only 5 dimensions.
Dimensions of Temperament Scale
Description
„Dimensions of temperament scale‟ is an individual test for 14 – 18 years age
group. It includes 15 dimensions of temperament:
1. Sociability 9. Vigorous
2. Ascendance 10. Co-operative
3. Secretiveness 11. Persistence
4. Reflective 12. Warmth
5. Impulsivity 13. Aggressiveness
6. Placid 14. Tolerance
7. Accepting 15. Tough Minded
8. Responsible
Administration
There are 152 items in the scale and students have to answer in Yes or No.

CHAPTER-III
99
Scoring
For scoring of the test an answer key is given. There are 119 questions
with the response Yes and 33 with the response no. if the answers are matching
to the key one marks will be given if not than zero mark will be given.
Tool Profile
Name of
the test
Constru
ctor
Lang
uage
Na
tu
re
Filled
by
Group/
Indi-
vidual
Dur-
ation
Reliability Vali-
dity
Dimension
s of
Tempera-
ment Scale
N.K.
chadha
and S.
Chandna
Hindi
/
Engli
sh
Ps
yc
ho
lo
gic
al
14 –
18
Years
Studen
t
Indi-
vidual
40
Min. Split half
0.94
Test- retest 0.79
Cross
Valida
tion
0.01
3.4.3.3 Survey of the various tools for the measurement of Aspiration level
A relevant search is made by the researcher to measure the aspiration level of
children and following tools are found:
Table 3.4.3.3.1 Showing Availability of Tools to Measure Aspiration Level
S. No. Test Name Author Language Age-Group
1. Level of Aspiration
measure
Mahesh
Bhargava and
M.A. Shah
Hindi /
English
Higher
Secondary
Students
2. Educational
Aspiration Scale
V.P. Sharma
and A. Gupta
Hindi Class X
3. Educational
Aspiration Inventory
T. Pradeep
Kumar
English 12 – 15 Years
4. Level of Educational
Aspiration Test
Yashmin
Ghauri Khan
English Class VI to X

CHAPTER-III
100
From all these inventories available researcher has found the inventory by
Mahesh Bhargava and M.A. Shah, “Level of Aspiration Measure” Because it
measures the general Aspiration level of children whereas all the other tools
measure only Educational Aspiration level. So, the researcher has selected level
of Aspiration measure for the research.
Level of Aspiration Measure
Description
The first page of the level of aspiration booklet contains general
information of the testee; instructions to the respondent and the scoring table
while remaining eleven pages contains the performance sheet of this measure
which are arranged in order of trial numbers.
The performance sheet has 50 circles (each of 1 cm in diameter) which
are arranged in five rows – ten in each row. Above and below of these rows,
there are two boxes on the right side – the upper box is for writing the number of
expected score (except in practice trail) whereas lower box is for putting the
number of actual score or completed performance. Thus, ten trials are needed for
each subject except practice trial. Stop watch or stop clock is also required for
the test.
Administration
Students will be instructed to draw four lines in the circles given, so that
they may appear like a human face. For each trial 30 seconds are allotted for
work and at the end of this time the students will be asked to stop the marking
and count the number of completed faces and enter it in lower box. This trial will
be treated as practice trial. In the following trials the students have to do the
same thing along with to put the number of faces in the upper box which
intended to complete within 30 second time. Total 10 trials are to be completed
by the students.

CHAPTER-III
101
Scoring
The procedure of scoring is simple. It provides three types of scores :
1. Goal discrepancy Score (GDS)
2. Attainment discrepancy Score (ADS)
3. The number of times the Goal Reach Score (NTRS)
1. Goal Discrepancy Score (GDS):
The extent and direction of the difference between actual on the previous
trial and goal set up of the next trial is known as goal discrepancy or G.D. score,
which is obtained by subtracting the actual score on a trial from the aspiration
score (Goal set up score) for the next trial. A positive goal discrepancy suggests
that one‟s goal is higher, in relation to one‟s previous performance and a
negative goal discrepancy indicates that one‟s goal is lower than one‟s previous
performance.
2. Attainment Discrepancy Score (ADS):
Attainment Discrepancy score is the difference between aspiration
(expected score) and the achievement (actual score on the same trial). Thus in
order to obtain ADS expected performance is subtracted from the actual
performance. Therefore, ADS is positive when actual performance is more than
expected performance and negative when expected performance is higher than
the actual performance. The size of the discrepancy shows the extent to which
one surpasses or fails to reach his goal.
3. Number of Times the Goal Reach Score (NTRS):
This is obtained by the number of times where his actual score is equal or
more than the expected score. It provides an index of subject‟s actual probability
of reaching his scaled goal.

CHAPTER-III
102
Tool Profile
Name of
the test
Constr-
uctor
Lan
gua
ge
Natu
-re
Filled
by
Grou
p/
Indivi
dual
Dura
tion
Reliability Validi
ty
Level of
aspiration
measure
Mahesh
Bharga
va and
M.A.
Shah
Hin
di /
Engl
ish
Perfo
rman
ce
Test
Higher
Second
ary
Studen
ts
Both No
time
limit
Test-
retest .85(1
month
gap), .73 (3
month gap)
Split-half .75
Satisf
actory
3.4.3.4 Survey of Various Tools to Measure Frustration of Children
To measure the frustration level of children, researcher has made a
serious search and found some tools which can be useful in the present research.
These tools are:
Table 3.4.3.4.1: Exhibiting Two Tools Available for Measuring Frustration
S.
N.
Test Name Author Language Age-Group
1. Rosenzweig Picture
Frustration Test for
Children
Udai Pareek Hindi 4 – 13 Years
2. Test of Reactions of
frustrations
S.N. Dubey Hindi 18 – 50 years
Out of these two tests available the researcher has preferred Rosenzweig
Picture Frustration Test for children by Udai Pareek because this test is specially
designed for children whereas the other tool that is „Test of Reactions to
Frustration‟ by S.N. Dubey is for 18 to 50 year age which do not fulfill the

CHAPTER-III
103
objective of the research that‟s‟ why the researcher has picked up the tool
„Rosenzweig Picture Frustration Test‟ by Udai Pareek.
Rosenzweig Picture Frustration Test
Description
The Rosenzweig Picture – Frustration study may be said to be a
controlled projective technique, primarily intended to measure reactions to
frustrating situations. Originally the Adult form was introduced in 1996, which
was later revised in 1997, and then was followed by the children‟s form in 1998.
The method was considered to be particularly suitable for use with children. To
them such an approach could be expected to appeal as a game in much the same
way as they are intrigued by the numerous comic strips designed for their
enjoyment. Moreover, one could reasonably anticipate that they would “project”
more naively than do adults.
Each form of the P-F Study consist 24 cartoons like drawings
representing frustrating situations. One character in the drawing is shown saying
something that causes frustration to the other person depicted. The subject is
required to say or write what the other person would say in that situation. In the
children‟s form the frustrated individual is always the child. The study can be
administered individually as well as in groups.
In both the forms of the study samples everyday situations of life has
been included. A variety of needs have been covered in the study the needs of
approval, affiliation, inviolacy, freedom, nurturance etc. and at the same time
various types of frustrating situations have been involved, e.g. deprivation,
conflict and accusation. In both forms there are “ego blocking” as well as
“Superego blocking” situations. The former are those in which some obstacle,
personal or impersonal, interrupts, disappoints, derives or otherwise directly
frustrates the subject, while the latter represent some accusation, charge or
incrimination of the subject by someone else.

CHAPTER-III
104
The original children‟s form of the Rosenzweig P-F study was adapted
for use with Indian children. While preparing the Indian adaptation, care was
taken to retain the original situations with as little modification as necessary to
make the situations acceptable to the Indian Child. As such, slight changes were
needed in the paraphernalia of the pictures, clothing and furniture. Some changes
were also made in the captions of the pictures.
Administration
The Indian Adaptation of Rosenzweig‟s P-F study is intended to use with
children of 4 through 13 years of age. The study can be administered in about 20
minutes either individually or in groups. In administration the subject should
write his own answers on the standard examination blank and the total time
should be recorded. Subjects should be told to raise their hands on completing
the answers; the examiner then collects the examination blanks. After giving
instructions to the subjects, he is asked to open the blank, examine the first
situation and think of the first reply that the character in the picture night give.
He is instructed to write down this response. He is then told to proceed with the
other pictures similarly and is left on his own.
Scoring
It is assumed as a basis for the P – F study that the subject unconsciously
or consciously identifies himself with the frustrated individual in each pictured
situation and projects his own bias in the replies given. To determine this bias
scores are assigned to each response as to direction of aggression and reaction
type. Under direction are included:
(i) Extrapunitiveness – In which aggression is turned on to the
environment.
(ii) Intropunitiveness – In which it is turned by the subject upon himself.
(iii) Impunitiveness – In which aggression is evaded in an attempt to gloss
over the frustration.

CHAPTER-III
105
(iv) Obstacle dominance – In which the barrier occasioning the frustration
stands out in the responses.
(v) Ego-defense – In which the ego of the subject predominates.
(vi) Need Persistence – In which the solution of the frustrating problem is
emphasized.
From the combination of these six categories there result for each item
nine possible scoring factors and two variants – E and I. The letters E, I and M
and employed to signify the extrapunitive, intropunitive directions of aggression
in whatever combination with type of reaction. To indicate obstacle dominance
an apostrophe (‟) is written after the capital letter E, I or M. The ego-defensive
types of extrapunitiveness, intropunitiveness and impunitiveness are signified by
the capital letters E, I and M, used alone. To indicate need persistence small e, I
and m are employed. The convention has been adopted of writing obstacle
dominance first, ego-defense second, and need persistence third in a three
columnar arrangement: O-D/E-D/N-P.
Scoring Factors
Definitions of the 11 scoring factors, including the two variants, are as follows:-
E’ The presence of the frustrating obstacle is insistently pointed out.
I’ The frustrating obstacle is constructed as not frustrating or as in some
way beneficial or in some instances, the subject emphasizes the extent of
his embarrassment at being involved in instigating another‟s frustration.
M’ The obstacle in the frustrating situation is minimized almost to the point
of denying its presence.
E Blame, hostility, etc. are turned against some person or thing in the
environment.

CHAPTER-III
106
E In this variant of E the subject aggressively denies that he is responsible
for some offense with which he is charged (most often applicable to
superego situations).
I Blame, censure, etc. are directed by the subject upon himself.
I A variant of I in which the subject admits his guilt but denies any
essential fault by referring to unavoidable circumstances. (Most often
employed in superego situations)
M Blame for the frustration is evaded altogether, the situation being
regarded as unavoidable; in particular the “frustrating” individual is
absolved.
e A solution for the frustrating situation is emphatically expected of
someone else.
i Amends are offered by the subject, usually from a sense of guilt, to solve
the problem.
m Expression is given to the hope that time or normally expected
circumstances will bring about a solution of the problem; patience and
conformity are characteristic.
Tool Profile
Test Name Const
ructo
r
La
ng
uag
e
Natur
e
Fille
d by
Group/
Individ
ual
Dura
tion
Reliability Validity
Rosenzwei
g Picture
Frustration
Test
Udai
Paree
k
Hin
di
Project
ive
Test
3 –
14
years
child
ren
Both 20
minut
es
Quite High High
3.4.3.5 Survey of Tools to Measure Self Efficacy
The researcher has searched tools to measure self-efficacy and found
single tool available:

CHAPTER-III
107
Table 3.4.3.5.1: Showing Tool for Self Efficacy
S.
No.
Tool Name Author Language Age-Group
1. Self Efficacy Scale G.P. Mathur
and R.K.
Bhatnagar
Hindi 14 + Childen
Because of the availability of single tool available, there is no choice of
other tool on self efficacy and this tool fulfills the requirement of research.
Hence, researcher has chosen self efficacy scale by G.P. Mathur and R.K.
Bhatnagar.
Self Efficacy Scale
Description
Self efficacy scale intends to assess the level of self – efficacy in any age
group above 14 years. In consists of 22 items, dealing with following eight
factors:-
Table 3.4.3.5.2: Showing Eight factors of Self Efficacy Tool
S.No. Factors S.N. of Items Total Items
1. Self regulatory skills 15, 21 2
2. Self influence 09, 14, 18 3
3. Self confidence 01, 04, 12 3
4. Social achievement 03, 08, 10 3
5. Self 05, 17, 22 3
6. Self Evaluation 02, 07, 19 3
7. Self-Esteem 13, 20 2
8. Self-Cognition 06, 11, 16 3
Total 22

CHAPTER-III
108
Each item describes human self-efficacy in different situations in the
society. The scale presents belief items to denote self-efficacy on the scale. This
scale was standardized and administered on a large sample of 800 (400 male and
400 female). For the cause of simplicity and clarity in application and analysis of
the scale, Likert type 5 point was constructed. In this scale items are in two
forms i.e. positive and negative.
Administration
1. It is a self-administrating scale. It is administered to a group as well as an
individual. The instructions printed on the test form should be read by test
administrator as well as testee.
2. No time limit is fixed for completing the scale. However an individual
takes 20 – 25 minutes in completing the scale.
3. Each item has to be responded.
4. No item is right or wrong, it‟s only to know the reaction of individual in
different situations.
5. They should be assured that their answers will be kept confidential.
Scoring
Scoring of the self efficacy scale is very easy. For the convenience purpose of
scoring the scale, in the scale before the serial number of the ten items, means
negative items and remaining items as positive items has been given there are 15
positive and 07 negative items which are as follows :
Table 3.4.3.5.3: Types of Items in Self Efficacy Scale
S.No. Types of Items Item wise serial numbers Total Items
1. Positive 1, 4, 5, 6, 7, 9, 10, 11, 14,
16, 17, 18, 19, 21, 22
15
2. Negative 2 3, 8, 12, 13, 15, 20 07
Total 22
CHAPTER-III
109
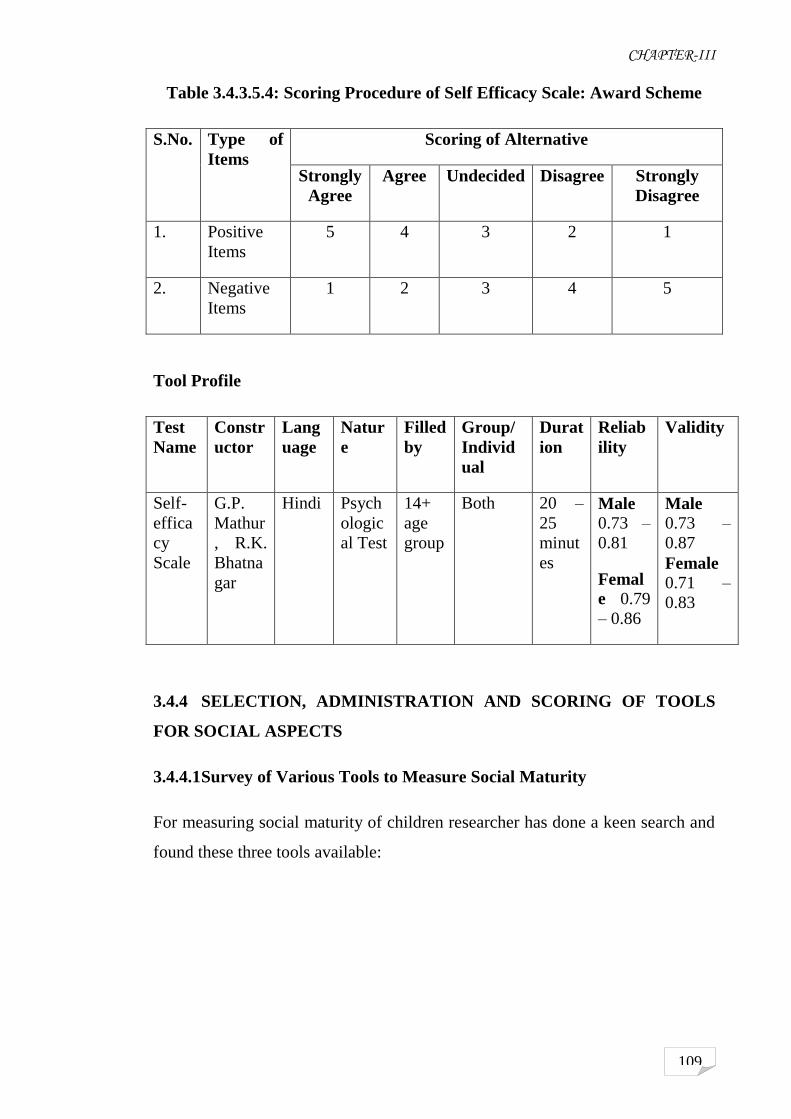
Table 3.4.3.5.4: Scoring Procedure of Self Efficacy Scale: Award Scheme
S.No. Type of
Items
Scoring of Alternative
Strongly
Agree
Agree Undecided Disagree Strongly
Disagree
1. Positive
Items
5 4 3 2 1
2. Negative
Items
1 2 3 4 5
Tool Profile
Test
Name
Constr
uctor
Lang
uage
Natur
e
Filled
by
Group/
Individ
ual
Durat
ion
Reliab
ility
Validity
Self-
effica
cy
Scale
G.P.
Mathur
, R.K.
Bhatna
gar
Hindi Psych
ologic
al Test
14+
age
group
Both 20 –
25
minut
es
Male 0.73 –
0.81
Femal
e 0.79
– 0.86
Male
0.73 –
0.87
Female
0.71 –
0.83
3.4.4 SELECTION, ADMINISTRATION AND SCORING OF TOOLS
FOR SOCIAL ASPECTS
3.4.4.1 Survey of Various Tools to Measure Social Maturity
For measuring social maturity of children researcher has done a keen search and
found these three tools available:

CHAPTER-III
110
Table 3.4.4.1.1: Tools Available to Measure Social Maturity
S.No. Tool Name Author Language Age Group
1. Social Maturity J. Bharath
Raj
English 0 – 15 years
2. Social Maturity
Scale
R.P.
Srivastava
Hindi 25 Years
3. Social Maturity Nalini Rao Hindi/English Class VIII, IX and
X
Social maturity scale by R.P. Srivastava is in Hindi language and for 25
years age group, which is worthless for the research. In between social maturity
scale by J. Bharath Raj and Social Maturity Scale by Nalini Rao; investigator
chosen Social Maturity Scale by Nalini Rao because it is specifically for class
VIII, IX and X whereas the social maturity scale by J. Bharath Raj is for 0 – 15
years. Scale by Nalini Rao hence fulfills the research objectives more
specifically.
Description
This scale consists of 90 items. There are three dimensions of social maturity
and its components are as follows:
1. Personal Adequacy
(i) Work Orientation: It manifests in the perception of work related skills
and development of proper attitudes towards work in terms of knowledge
of standards of competence in performing tasks, capacity for experiencing
pleasure in work leading to self sufficiency.
(ii) Self-direction: Manifests in one‟s capacity to independently act and
exercise control over one‟s actions. This also involves the initiative an
individual takes in directing himself and his actions with a feeling of
security and full faith in one‟s efforts.

CHAPTER-III
111
(iii) Ability to take stress: It is an ability to exhibit appropriate emotional
stability and react without embarrassing either himself or the group he is
in. It also involves ability to undertake challenging tasks with assurance.
2. Interpersonal Adequacy
(i) Communication: It involves an ability to understand, write to
communicate and make clear meaningful speech and gestures. The ability
also involves empathy which sensitizes the individual to the affective
domain and demands effective communication.
(ii) Enlightened trust: This component includes a general belief that it is
acceptable to rely or depend or others when need arises. It involves clear
functioning of enlightened decision about whom, when and how much to
trust.
(iii) Co-operation: An altruistic tendency to join others in their efforts in
order to reach a mutually desirable goal. It involves ability to regard rules
and practices more as reciprocal social agreement rather than a rigid,
unchangeable law.
3. Social Adequacy
(i) Social commitments: It involves a feeling of oneness with others,
willingness to modify or relinquish personal goals in the interest of
societal goals and also a readiness to invest in long term social goals.
(ii) Social Tolerance: Social tolerance involves a person‟s willingness to
interact with individuals and groups, who differ from him. Sensitivity to
the rights of individuals and groups who differ from him, thus accepting
the difference as a means of building up the out group loyalities.
(iii) Openness to change: Involves willingness to accept changes in the social
setting and adapt oneself to the demands of these changes.
CHAPTER-III
112
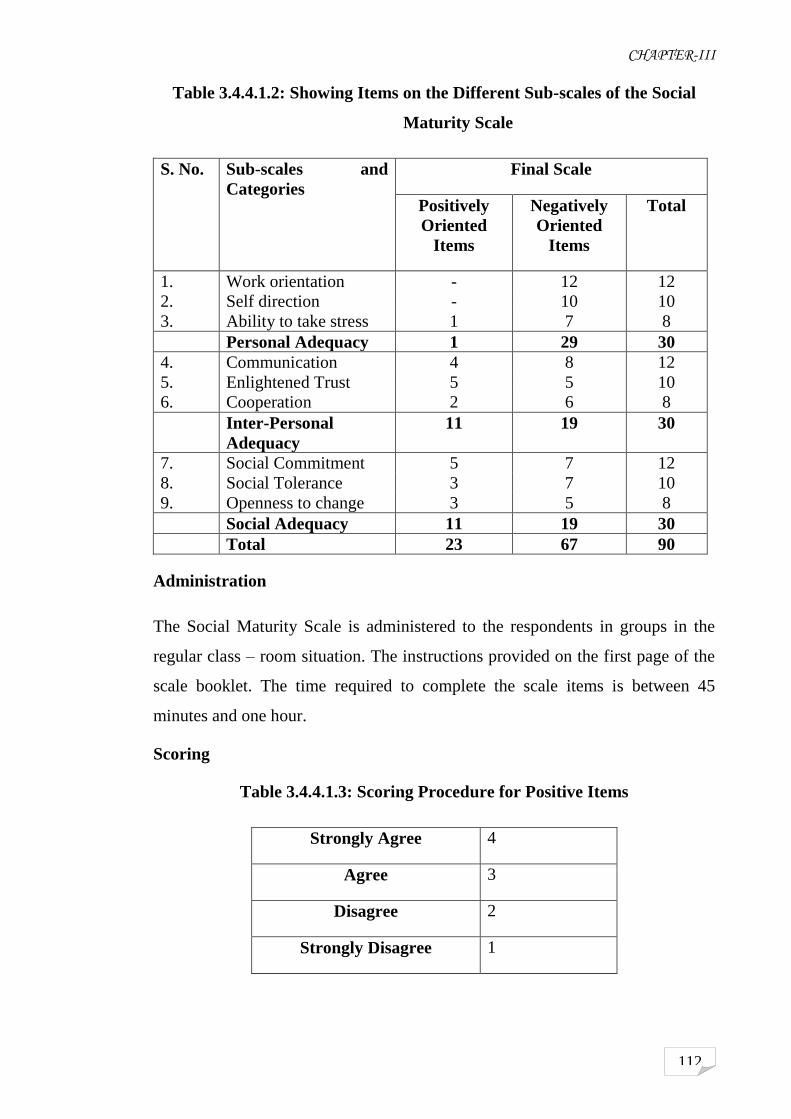
Table 3.4.4.1.2: Showing Items on the Different Sub-scales of the Social
Maturity Scale
S. No. Sub-scales and
Categories
Final Scale
Positively
Oriented
Items
Negatively
Oriented
Items
Total
1. Work orientation - 12 12
2. Self direction - 10 10
3. Ability to take stress 1 7 8
Personal Adequacy 1 29 30
4. Communication 4 8 12
5. Enlightened Trust 5 5 10
6. Cooperation 2 6 8
Inter-Personal
Adequacy
11 19 30
7. Social Commitment 5 7 12
8. Social Tolerance 3 7 10
9. Openness to change 3 5 8
Social Adequacy 11 19 30
Total 23 67 90
Administration
The Social Maturity Scale is administered to the respondents in groups in the
regular class – room situation. The instructions provided on the first page of the
scale booklet. The time required to complete the scale items is between 45
minutes and one hour.
Scoring
Table 3.4.4.1.3: Scoring Procedure for Positive Items
Strongly Agree 4
Agree 3
Disagree 2
Strongly Disagree 1

CHAPTER-III
113
Table 3.4.4.1.4: Scoring Procedure for Negative Items
Strongly Agree 1
Agree 2
Disagree 3
Strongly Disagree 4
High score represent the most mature response.
Maximum Mature Score – 360
Minimum Mature Score – 90
Tool Profile
Name
of the
test
Cons-
tructor
Langua
ge
Nat
ure
Fille
d by
Group
/
Indivi
dual
Durat
ion
Reliab
ility
Validity
Social
Matur
ity
Scale
Nalini
Rao
Hindi/E
nglish
Soci
al
Scal
e
Stude
nts of
class
VIII,
IX
and
X
Both 45
minut
es to 1
hour
0.79 Based on
teacher
rating
3.4.4.2 Survey of the Tools to find out Parent Child Relationship
To find out the extent of parent-child relationship, the standardized tools
available are as follows:
Table 3.4.4.2.1: Exhibiting Available Tools for Parent Child Relationship
S.No. Tool Name Author Language Age Group
1. Parent child
Relationship Scale
N.S.
Chauhan and
Harish
Sharma
Hindi Parents
2. Parent Child
Relationship Scale
Nalini Rao Hindi /
English
13 – 16 years
children

CHAPTER-III
114
The investigator found only two standardized tools to measure parent
child relationship. Parent Child Relationship scale by Nalini Rao is for 13 – 16
years adolescents whereas, Parent Child Relationship scale by N.S. Chauhan and
Harish Sharma is for parents. The Investigator has chosen the scale by N.S.
Chauhan and Harish Sharma because the questionnaire will be filled by parents,
they have to express their attitude towards the child which will fufill the research
objective.
Parent Child Relationship Scale
Description
The scale through the „Self Anchoring Technique‟ makes measurement
possible on eleven points for eight dichotomous dimensions of basic parent –
child relationship. The technique employed remains simple and pointed in
getting to natural responses and the placement relations on a dichotomous
dimension makes the instrument highly sensitive and differentiating in the
context. The details for the dichotomous dimensions are:-
Table 3.4.4.2.2: Showing Various Dichotomous Dimensions of Parent Child
Relationship Scale
1. RJCT (–) Rejection
Parental negative attitude towards
children, feeling them worthless,
refusing to admit them, criticism
comparisons, parental signs of
hostility, crossness, refusal to pay
attention.
Vs (+) ACPT (Acceptance)
Parental positive attitude towards
children, accepting their idea and
judgment. Loving, affectionate,
joyful, cheering, sing and
attentive behavior of parents
towards children.
2. CRLN (–) (Carelessness)
Unconcerned, thoughtless,
negligent, inaccurate behavior of
parents towards their children.
Vs (+) OPTCT (Over Protection)
Parental uncared, pampering
indulgence, excessive physical
contact, prevention of
independence, over-solicitude,
shielding behavior towards
children.

CHAPTER-III
115
3. NGLC (–) (Negligence)
Least-attentive, non-cooperative,
avoiding, leave uncared for :
behavior of parents.
Vs (+) OIND (Over-indulgence)
Parental behavior of endeavour
even on the whims of children,
failure to exercise needed
constraint.
4. STRL (–) (Strong-realism)
Adapting to outside relations,
tolerating, objective realities or
non- fantastic oriented behavior of
parents towards their children.
Vs (+) UPECT (Utopian –
expectation)
Parental demands of higher
quality performance than is
permitted or higher expectation
from their children even on their
limitations. Parental demand of
imaginary perfection from their
children.
5. LNST (–) (Lenient Standards)
Parental weak superego,
permitting, lesser restrictions for
moral deviation, attitude of
indifference against such
inhibitions in the name of freedom
and individuality.
Vs (+) SEMOR (Severe Moralism)
Parental severity of superego,
attitude of condemning even
mild types of sexuality or sexual
inclination, negating feelings and
always pleading a dry
mechanically operated life.
6. TOFE (–) (Total freedom)
Hyper-permissiveness, hypo
punishments, children as their
own decision maker.
Vs (+) SEDIS (Severe discipline)
Hypopermissiveness, hyper
punishment decision making
resting with parents.
7. MCON (–) (Marital conflict)
Conflicts between the father and
the mother usually witnessed by
children with a non-palatable taste
and damaging temperament.
Vs (+) MADJ (Marital
adjustment)
Mutual understanding, solidarity
and congenital atmosphere
between the father and the
mother providing an atmosphere
of peace and propriety to
children.
8. FAROEX (–) (Faulty role
expectation)
Emotional instability and ego
weakness among parents leading
them to unexpected deviant roles
and appearing always a problem
for their children to follow suit.
Vs (+) REROEX (Realistic role
expectation)
Emotional stability, consistency
in thought and action of parents.
Present them as sufficiently
effective, inspiring model for
their children to follow.

CHAPTER-III
116
Administration
This scale consist 8 items. This dimensional scale is filled up by parents.
The Researcher will give the instructions to parents how to fill the questionnaire
as instructed on the first page of the booklet.
Scoring
The scores for the eight dichotomous dimensions are usually indicated by
the specific numbers of the rings of the ladder. Every score on a dichotomous
dimension needs it‟s placement with reference to the dichotomous ends in view.
As such it is highly important to place it on the following table which separates
the dichotomous ends of all dimensions at the score of 5 – 5.
1 2 3 4 5 6 7 8 9 1 0
R e je c t io n A c c e p ta n c e
C a r e le s s n e s s O v e r -p r o te c t io n
N e g li g e n c e O v e r - in d u lg e n c e
S tr o n g R e a lis m U to p ia n -e x p e c ta t io n
L in i e n t S ta r n d a r d s S e v e r e -M o r a lis m
To ta l F re e d o m S e v e r e d i s c ip lin e
M a r ita l c o n f lic t M a r ita l a d ju s tm e n t
F a u lty r o le e x p ta t io n R e a l is t ic r o le e x p e c ta t io n
M e an S c o r e S c o r e M ea n
M
Figure 3.4.4.2: Scoring of Parent Child Relationship Scale

CHAPTER-III
117
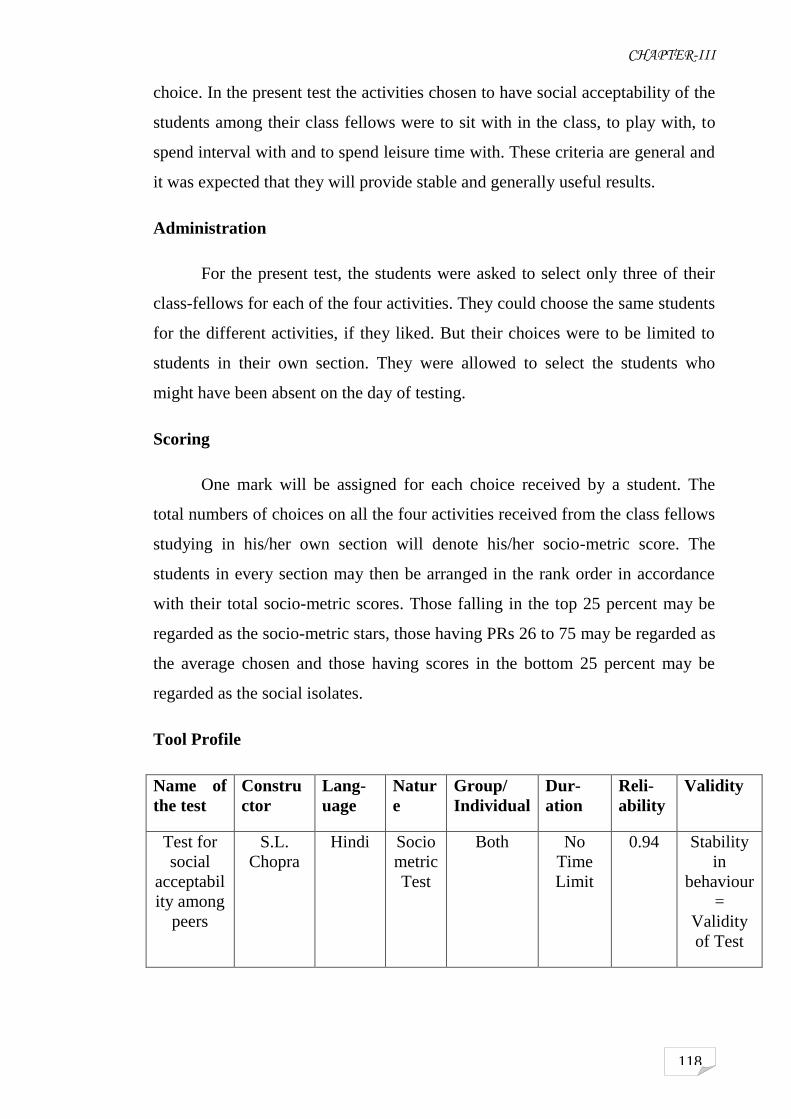
Tool Profile
Name of
the test
Construct
or
Lan-
guage
Nat-
ure
Group/
Individual
Dur-
ation
Relia-
bility
Validity
Parent
child
relationsh
ip scale
N.S.
Chauhan
and
Manish
Sharma
Hindi Socio
-
metic
Parents No
Time
Limit
0.79 –
3.4.4.3 Survey of Various Tools to Assess Social Acceptability among Peers
There are only two tools available to assess the social acceptability among peers.
These are:
Table 3.4.4.3.1: Showing Availability of Tools of Social Acceptability
among Peers
S.No. Test Name Author Language Age-Group
1. Test for Social
Acceptability
S.L. Chopra Hindi College
students
2. Parasparik Sambandh
Prashnawali
Guru Pyari
Mathur
Hindi/
English
Any age group
From the above two sociometric tests the researcher has decided to use
test for social acceptability among peers by SL. Chopra because this test is easier
to administer than Parasparik Sambandh Prashnawali by Guru Pyari Mathur.
Test for Social Acceptability among Peers
Description
Sociometric tests consist of questionnaire in which each member of the
group is asked to name the members of the group with whom he will like to
associate for different activities. The firm of the questions, therefore, depends
upon the social setting of the group and the questions indicate the scope of the
CHAPTER-III
118
choice. In the present test the activities chosen to have social acceptability of the
students among their class fellows were to sit with in the class, to play with, to
spend interval with and to spend leisure time with. These criteria are general and
it was expected that they will provide stable and generally useful results.
Administration
For the present test, the students were asked to select only three of their
class-fellows for each of the four activities. They could choose the same students
for the different activities, if they liked. But their choices were to be limited to
students in their own section. They were allowed to select the students who
might have been absent on the day of testing.
Scoring
One mark will be assigned for each choice received by a student. The
total numbers of choices on all the four activities received from the class fellows
studying in his/her own section will denote his/her socio-metric score. The
students in every section may then be arranged in the rank order in accordance
with their total socio-metric scores. Those falling in the top 25 percent may be
regarded as the socio-metric stars, those having PRs 26 to 75 may be regarded as
the average chosen and those having scores in the bottom 25 percent may be
regarded as the social isolates.
Tool Profile
Name of
the test
Constru
ctor
Lang-
uage
Natur
e
Group/
Individual
Dur-
ation
Reli-
ability
Validity
Test for
social
acceptabil
ity among
peers
S.L.
Chopra
Hindi Socio
metric
Test
Both No
Time
Limit
0.94 Stability
in
behaviour
=
Validity
of Test

CHAPTER-III
119
3.4.4.4 Survey of Various Tools to Measure Children’s Home Environment
For measuring home environment of children the researcher has made a
genuine search and got these tests available:
Table 3.4.4.4.1: Available Tools of Home Environment
S.
No.
Test Name Author Language Age-Group
1. Home Environment
Inventory
Prerna
Mohite
English I to IV class
Intermediate class
2. Home Environment
Inventory
K.S. Mishra Hindi/English Intermediate
3. Family Environment
Scale
Harpreet
Bhatia and
N.K.
Chadha
Hindi /
English
17 – 50 Years
4. Home Environment
Scale
Reena
Sharma and
Vibha
Nigam
Hindi/English 20 to 50 Years
The Home Environment Inventory by Prerana Mohite is in English only
and just for primary classes. Family Environment scale by Harpreet Bhatia and
N.K. Chadha and Home Environment Scale by Reena Sharma and Vibha Nigam
are for age group 20 – 50 years which do not fulfils the research objective. Home
Environment Inventory by K.S. Mishra is for Intermediate classes which can be
applied for High School Children. Hence, the researcher has chosen the Home
Environment Inventory by K.S. Mishra for the research.
Home Environment Inventory
Description
The present Home Environment Inventory (HEI) is an instrument
designed to measure the Psycho-social climate of home as perceived by children.
It provides a measure of the quality and quantity of the cognitive, emotional and

CHAPTER-III
120
social support that has been available to the child within the home, HEI has 100
items belonging to ten dimensions of home environment. The ten dimensions
are:-
(a) Control
(b) Protectiveness
(c) Punishment
(d) Confirmity
(e) Social Isolation
(f) Reward
(g) Deprivation of Privileges
(h) Nurturance
(i) Rejection
(j) Permissiveness
Each dimension has 10 items belonging to it. The instrument requires
pupils to tell the frequency with which a particular parent-child interaction
behavior has been observed by them in their homes, i.e. he/she is requested to
tell whether, a particular parental behavior occurs – „Mostly‟, „Often‟,
„Sometimes‟, „Least‟ and „Never‟. There is no time limit for this tool.
Administration
Home Environment Inventory can be administered in individual or group
settings. To start with, students should be made familiar with the nature and
purpose of measurement of home environment. Later, the procedure for marking
the responses on the booklet should be explained to them. They should be asked
to put „X‟ mark on any cell indicating their perception of the frequency with
which a particular behavior has been exhibited by their parents.
Scoring
The responses are to be given on the booklet itself. There are five cells
against every item of the inventory. Each cell indicates the frequency of
occurrence of a particular behavior. The five cells belong to five responses

CHAPTER-III
121
namely, „Mostly‟, „Often‟, „Sometimes‟, „Least‟ and „Never‟. The dimension to
which a particular item belongs has been indicated by alphabets near the serial
number of the items. 4 marks will be assigned to „Mostly‟, 3 marks to „often‟, 2
marks to „Sometimes‟, 1 mark to least and 0 marks to „Never‟ responses. The
mark assigned to A, B, C, D, E, F, G, H, I and J dimension – statements are to be
counted on every page and then added the dimension – scores awarded to
statements given on the five pages so as to get scores for the ten dimension of
HEI.
Tool Profile
Name of
the test
Constr
uctor
Lang-
uage
Nature Filled
by
Group
/
Indivi
dual
Dur-
ation
Reliabil
ity
Vali
dity
Home
Enviro-
nment
Inventory
Dr. K.S.
Mishra
Hindi/
English
Psycho-
Social
Inter-
mediate
Both No
time
limit
0.850 Cont
ent
Vali
dity
3.4.4.5 Survey of the various tools to Measure School Environment
Researcher has searched tools to measure school environment and found just one
test of school environment.
Table 3.4.4.5.1: Exhibiting Tool Available for School Environment
S.
No.
Test Name Author Language Age-Group
1. School
Environment
Inventory
K.S.
Mishra
Hindi/English High School and
Intermediate
Students

CHAPTER-III
122
School Environment Inventory
Description
SEI contains 70 items related to the six dimensions of school environment i.e.
concepts intuitively judged relevant to the social psychology of the classroom.
The six dimensions are –
A) Creative Stimulations (CRS)
B) Cognitive Encouragement (COE)
C) Acceptance (ACC)
D) Permissiveness (PER)
E) Rejection (REJ)
F) Control (CON)
Twenty items belong to the (CRS) dimension while each of the remaining
five dimensions has the item belonging to it.
The instrument requires pupils to tell the frequency with which a particular
teacher pupil interaction behavior is expressed in his or her school i.e. he / she is
requested to tell whether a particular teacher – behavior (as mentioned in an
item) occurs – „Always‟, „Often‟, „Sometimes‟, „Rarely‟ and „Never‟. There is
no time limit for this tool.
Administration
School Environment Inventory can be administered in individual or group
setting to start with, students should be made familiar with the nature and
purpose of measurement of school environmental. Later, the procedure to be
followed while marking responses on the booklet should be explained to them.
They should be told to put „X‟ mark on any cell indicating the five responses,
whichever expresses their perception about the frequency with which a particular
behavior is exhibited by their teachers.

CHAPTER-III
123
Scoring
The responses are to be given on the booklet itself, against each item of
the inventory five alternatives are given in forms of cells indicating the intensity
of the responses. Marks to be assigned are 4 marks to „Always‟, 3 marks to
„Often‟, 2 marks to „Sometimes‟, 1 mark to „Rarely‟ and zero to no responses.
The particular items belong to which area is indicated by alphabets near the
serial number.
Table 3.4.4.5.2: Showing the Scoring of Responses of SEI
S.No. Responses Marks
1. Always 4
2. Often 3
3. Sometimes 2
4. Rarely 1
5. No Responses 0
Tool Profile
Name
of the
test
Constr
uctor
Lang-
uage
Nat-
ure
Filled
by
Group/
Individ
ual
Dur-
ation
Relia-
bility
Vali-
dity
School
Environ
ment
Invento
ry
Dr.
K.S.
Mishra
Hindi/
English
Psycho
-Social
High
Schoo
l and
Interm
ediate
Both No
time
limit
0.792 Conte
nt
Validi
ty
3.4.5 Designing of the Questionnaire Related to Awareness of Parents and
Interview for Teachers about Learning Disability or other Learning
Disorder of Children
3.4.5.1 Description Administration and Scoring of the learning Disability
Awareness Questionnaire
A questionnaire for parents and an interview schedule for teachers were
constructed by researcher to know their awareness about learning disability. The
questionnaire consisted of 40 statements and interview schedule consisted of 10

CHAPTER-III
124
statements which were listed according to 3 areas of awareness. The details are
as follows:
1. Knowledge of Learning Disability
2. Symptoms of Learning Disability
3. Parental involvement/ teacher‟s involvement
Administration of Inventory
Necessary Instructions were given to parents about the questionnaire.
There was no specific time limit but sufficient time required for completing the
inventory was 30 minutes. After distributing the booklets, the parents were asked
to read the instructions carefully and complete the preliminary entries. Then they
were asked to start the work. When the time was over, the booklets were
collected. The interview of the randomly selected teachers was taken
individually.
Scoring of the Inventory
In scoring, credit of one point was given for each correct answer and zero
for incorrect answer. There was no negative marking. The number of the correct
responses was counted which served as the raw score of a subject.
3.4.6 Assessment of Academic Achievement
The report cards of previous classes were considered as a tool for
assessment of academic achievement percentage obtained in the final
examination of previous class was taken in to account.
3.5.0 COLLECTION OF DATA
Initially rapport was established and learning disabled children were
identified from the Class IX and X of each and every school by using self made
questionnaire for identification of learning disabled children. After identifying
those children the requisite data was collected with the help of tools which were
employed during field work. Data was collected from different sources eg.
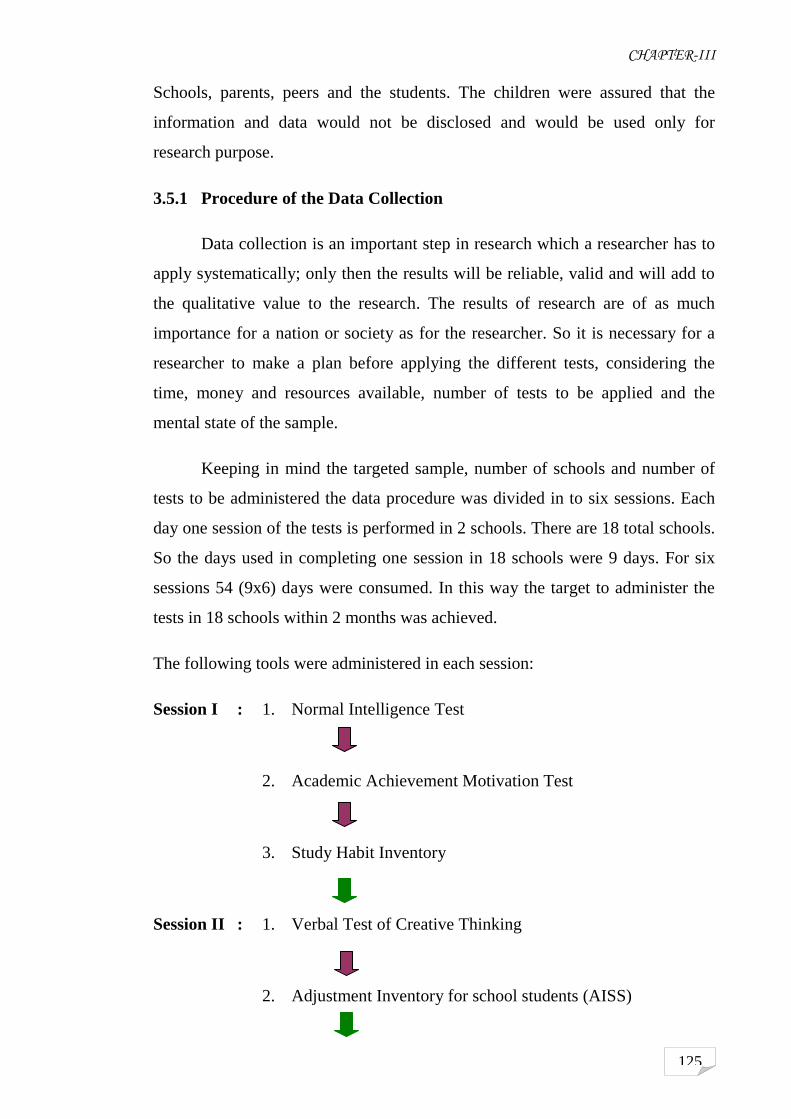
CHAPTER-III
125
Schools, parents, peers and the students. The children were assured that the
information and data would not be disclosed and would be used only for
research purpose.
3.5.1 Procedure of the Data Collection
Data collection is an important step in research which a researcher has to
apply systematically; only then the results will be reliable, valid and will add to
the qualitative value to the research. The results of research are of as much
importance for a nation or society as for the researcher. So it is necessary for a
researcher to make a plan before applying the different tests, considering the
time, money and resources available, number of tests to be applied and the
mental state of the sample.
Keeping in mind the targeted sample, number of schools and number of
tests to be administered the data procedure was divided in to six sessions. Each
day one session of the tests is performed in 2 schools. There are 18 total schools.
So the days used in completing one session in 18 schools were 9 days. For six
sessions 54 (9x6) days were consumed. In this way the target to administer the
tests in 18 schools within 2 months was achieved.
The following tools were administered in each session:
Session I : 1. Normal Intelligence Test
2. Academic Achievement Motivation Test
3. Study Habit Inventory
Session II : 1. Verbal Test of Creative Thinking
2. Adjustment Inventory for school students (AISS)

CHAPTER-III
126
Session III : 1. Dimension of Temperament Scale
2. Level of Aspiration Test
Session IV : 1. Rosenzweig Picture Frustration Test
2. Rao's Social Maturity Scale
Session V : 1. Home Environment Inventory
2. School Environment Inventory
3. Test for Social acceptability among Peers (TSAAP)
Session VI : 1. Problem Behavior Checklist (PBCL)
2. Parent Child relationship Scale
3. Questionnaire Related to Awareness of Parents about
Learning disability
3.6.0 ADMINISTRATION OF THE TOOLS
For the administration of various tools in different institutions, principals
of the respective institutions were approach. All the principals granted
permission. The date and time on which students of these institutions were to be
contacted in their respective classrooms was then fixed.
In order to ensure proper testing conditions during administration of
different tests, the following precautions were strictly observed by the
investigator:

CHAPTER-III
127
1. Number of many tests was not simultaneously administered on the same
group of subjects and on the same day. This was considered necessary to
minimize fatigue, monitory and anti reaction towards the next test among
examiners.
2. Enough spacing between the seat of examines was kept to minimize
mutual discussion among them as well as to prevent copying.
3. An adequate arrangement for light, air and drinking water was also made
during the test period.
4. Each subject was given a pencil for responding to the items of the test.
5. After supplying the test booklets, the subjects were asked to complete
their personal information such as name, father's name, college name and
the date on which the test was administered, which was present on each
test booklet.
6. After supplying test booklet, subjects were instructed to start the actual
work after furnishing personal data.
7. The subjects started attending the test items only after, the specific
instructions related to the test were read aloud.
8. Doubts and confusions raised by any of examine concerning the test were
immediately clarified and removed.
9. Examines are asked to begin from the first page and continue till last page
in a sequential order.
10. If any test has practice examples as in case of picpture frustration test
examines were asked to silently read these practice examples carefully
and start attempting items similar to them.
11. If any test had a time limit for its completion, as in case of verbal
intelligence and level of aspiration test time limit was strictly adhered to.

CHAPTER-III
128
However in tests without any time limit, the subjects were allowed to take
their own time.
3.7.0 STATISTICAL TECHNIQUES USED
The collected data was processed and analyzed in accordance with the
outline laid down for the purpose at the time of developing the research plan.
This is essential for a scientific study to ensure that all the collected data are
relevant for making comparison and analysis. Technically speaking, processing
implies editing, coding, classification and tabulation of collected data so that
they are amenable to analysis. This study was based on the case study method.
Hence tools were administered, analyzed and interpreted individually. No
statistical technique was required in dealing with the individual case but to have
composite view of the personality and problem of the Learning Disabled
Children some statistical technique were used. The uses of statistics are
illustrated below:
Figure 3.7.0: Showing the Uses of Statistical Techniques
In order to thrash out the essence from the collected data and to make the
data meaningful the following statistical techniques were used:
Descriptive Statistics
Graphical Representation
To find out Mathematical relationship of Different Groups
To Compare Different Groups of Sample
To Give a Concise Picture of Large Areas
To Draw Inferences and to make Generalizations
USE OF STATISTICAL TECHNIQUES

CHAPTER-III
129
Descriptive Statistics
Certain descriptive statistics were employed to analyze data, obtained on the
group through these were:-
1. Mean
The mean value was computed as a measure of central tendency of the
distribution of variation
Fx
MeanN
Where,
N = Number of score
F = Total sum of Frequencies
x = Mid point
2. Percentage
Percentage was used in order to do comparative study of the conclusions drawn
in different cases and to show the different quality of various aspects.
No.of Student
Percentage(%) x100TotalStudents
3. Graphical Representation
Graphical represent of data often facilitates understanding a set of data. It makes
it easier to read and interpret. Thus the following graphs were drawn up by the
researcher:
Charts
As it was a case study bar and line charts were used to present various
different aspects related to each case as well as on the group.
Recommended