
VT
T T
EC
HN
OL
OG
Y 8
4
Feasib
ilities fo
r po
wer q
uality p
rob
lem
mitig
atio
n in
mic
rog
rid
ISBN 978-951-38-7924-2 (URL: http://www.vtt.fi/publications/index.jsp)ISSN-L 2242-1211ISSN 2242-122X (Online)
Feasibilities for power quality problem mitigation in microgrid
Feasibilities for power quality problem mitigation in microgridRiku Pasonen
•VISIONS•S
CIE
NC
E•T
ECHNOLOGY•R
ES
EA
RC
HHIGHLIGHTS
84


VTT TECHNOLOGY 84
Feasibilities for power quality problem mitigation in microgrid
Riku Pasonen

ISBN 978-951-38-7924-2 (URL: http://www.vtt.fi/publications/index.jsp)
VTT Technology 84
ISSN-L 2242-1211 ISSN 2242-122X (Online)
Copyright © VTT 2013
JULKAISIJA – UTGIVARE – PUBLISHER
VTT PL 1000 (Tekniikantie 4 A, Espoo) 02044 VTT Puh. 020 722 111, faksi 020 722 7001
VTT PB 1000 (Teknikvägen 4 A, Esbo) FI-02044 VTT Tfn +358 20 722 111, telefax +358 20 722 7001
VTT Technical Research Centre of Finland P.O. Box 1000 (Tekniikantie 4 A, Espoo) FI-02044 VTT, Finland Tel. +358 20 722 111, fax + 358 20 722 7001

3
Feasibilities for power quality problem mitigation in microgrid
Sähkön laadun hallinta mikroverkossa. Riku Pasonen. Espoo 2013. VTT Technology 84. 37 p.
Abstract Different electric loads can be problematic for power quality in microgrids but also microgrid can offer more options for power quality management. Type of problems can be divided to either voltage level problems or harmonic problems. Devices emitting harmonics can be usually filtered to comply with power quality norms but more active approach might have to be taken if the load just draws too much current.
This research report investigates how different load types affect the power quality in microgrid. Transient electric simulation software, PSCAD and microgrid simula-tion model was used for the research. Load types in the microgrid simulation were compact fluorescent lamp (CFL), single phase rectifier load, three phase thyristor load, and single phase motor load. Also 20 kW static three phase load was used for base case.
A good filtering solution was found for the CFL using LC-filter configuration and values for components were found using simplex optimization algorithm. There was a small resonance with CFL and inverter without filter in CFL. Three phase thyristor load was more difficult because it had high RMS value of current and high harmonic distortion. Selected filtering solution was to use a LCL-filter and a cut-off switch. Simplex algorithm did not work in this case for finding inductor and capacitor values. Values were set so that adequate current filtering and reactive power compensation were achieved. Problem for the single phase motor load was that it draws high current at start and also that there is very limited capacity of power per phase in inverter driven microgrid. Solution for to problem was a device which selects a phase for the single phase load so that single phase loads are spread evenly among all three phases. The device was named a phase jumper. Also virtual impedance method was used to compensate voltage sag from isolation transformer; raising the voltage reference of the feeding inverter respect to current.
Keywords power quality, microgrid, simulation

4
Sähkön laadun hallinta mikroverkossa
Feasibilities for power quality problem mitigation in microgrid. Riku Pasonen. Espoo 2013. VTT Technology 84. 37 s.
Tiivistelmä Eri kuormatyypit voivat olla haasteellisia mikroverkon kannalta, mutta mikroverkko antaa myös enemmän vaihtoehtoja ongelmien ratkaisemiseksi. Tyypilliset ongel-mat johtuvat joko harmonisesta säröstä tai liian suuresta virrasta. Harmonisesta säröstä johtuvat ongelmat voidaan yleensä ratkaista suodattimilla, mutta suuresta virrasta johtuviin ongelmiin tarvitaan yleensä kuorman ohjausta.
Tässä tutkimusraportissa tarkastellaan eri kuormatyyppien vaikutuksia sähkön laatuun mikroverkossa. Työkaluna tarkasteluissa käytetään sähkömagneettisien transienttien laskentaohjelmistoa, PSCADia ja kyseiseen ohjelmistoon kehitettyä mikroverkkomallia. Tarkastellut kuormat simuloinnissa olivat energiansäästölamp-pu, yksivaiheinen tasasuuntaajakuorma, kolmivaiheinen tyristorikuorma ja yksivai-heinen oikosulkumoottorikuorma. Lisäksi kolmivaiheinen 20 kW:n kuorma oli ase-tettu peruskuormaksi kuhunkin tarkasteluun.
LC-tyypin suodatin todettiin soveltuvaksi energiansäästölampun kanssa käytet-täväksi. Suodattimen komponenttien arvot haettiin Simplex-optimointialgoritmilla ja tehtävään kehitetyllä funktiolla. Energiansäästölampun mallin huomattiin aiheutta-van pientä resonointia vaihtosuuntaajan kanssa, kun suuntaaja ohjattiin suoralla jännitteensäätöalgoritmilla, mutta ongelma poistui suodattimen kanssa. Kolmivai-heinen tyristorikuorma oli hankalampi suodatuksen kannalta, koska sekä virran tehollisarvo että harmoninen särö olivat suuria. Suodattimeksi tälle valittiin LCL-tyypin suodatin katkaisukytkimellä varustettuna. Algoritmipohjainen parametrien haku ei tuottanut toivottua tulosta, joten suodattimen komponenttien arvot valittiin siten, että virran suodatus on riittävä ja että sopiva loistehon kompensointi saatiin aikaan. Suuri käynnistysvirta oli ongelmana yksivaiheisen moottorikuorman kans-sa ja vaihekohtainen virtakapasiteetti on varsin rajallinen vaihtosuuntaajalla toteu-tetussa mikroverkossa. Ongelman ratkaisemiseksi kehitettiin liitäntälaite moottorin ja verkon väliin, joka kytkee kuorman siihen vaiheeseen, jossa on vähiten kuor-maa. Suotuisimman vaiheen valintaa käytettiin virtamittaustietoa syöttävältä muuntajalta. Laitteen avulla yksivaiheiset kuormat kytkeytyvät tasaisesti kaikille kolmelle vaiheelle. Lisäksi erotusmuuntajasta johtuvan jännitteen aleneman kor-jaamiseen käytettiin virtuaalisen impedanssin lisäämistä syöttävän vaihtosuuntaa-jan ohjaukseen; vaihtosuuntaajan jänniteohjetta säädettiin virran funktiona.
Avainsanat power quality, microgrid, simulation

5
Preface This work was carried out in the Smart Grids and Energy Markets (SGEM) re-search program work package 6.6 coordinated by CLEEN Ltd with funding from Tekes – the Finnish Funding Agency for Technology and Innovation. The purpose of this work is to investigate what possible problems might arise with some electric load types in microgrid environment. Work is continuation of the work which led to development of microgrid simulation model earlier in the project.

6
Contents Abstract ........................................................................................................... 3
Tiivistelmä ....................................................................................................... 4
Preface ............................................................................................................. 5
1. Introduction ............................................................................................... 7
2. Energy centre microgrid model as test bed ............................................... 8 2.1 Energy centre microgrid concept ......................................................... 8 2.2 Implementation of the concept as PSCAD model ................................. 9
3. Inspected load types ............................................................................... 11 3.1 Base simulation setup ....................................................................... 11
3.1.1 Voltage drop related to base load ............................................. 13 3.2 Motor loads ...................................................................................... 14
3.2.1 Single phase motor load ........................................................... 15 3.3 Rectifier DC-loads ............................................................................ 17
3.3.1 Single phase rectifier load ........................................................ 17 3.3.2 Three phase rectifier load ......................................................... 19
4. Power quality problem mitigation ........................................................... 23
5. Conclusions and discussion .................................................................. 35
References ..................................................................................................... 37

1. Introduction
7
1. Introduction
Devices with high peak current characteristics can create power quality problems especially rural distribution grids and other electrically weaker grids. Fluctuating voltage level is called flicker and can literally cause flicker in lights and can gener-ate problems for certain types of loads. Voltage unbalance is a situation where phase voltages are not equal, which is a result from higher loads on some of the phases of three phase electrical system. Effects of different high current loads to distribution grids have been investigated in [1] and [2]. Loads with power electronic components can cause harmonic distortion to voltage and therefore generate problems in other loads and devices.
A microgrid is a small autonomous electric system which can operate inde-pendently from other systems. Microgrids usually are electrically weaker grids and some electric loads can generate power quality problems more easily than in regular distribution systems. This study investigates how different single and three phase loads affect power quality of microgrid system and possible ways mitigate the problems. Tool chosen for the study is PSCAD® electromagnetic transient simulation software.

2. Energy centre microgrid model as test bed
8
2. Energy centre microgrid model as test bed
Energy centre microgrid concept was developed in previous phase of the project [5] as a solution to integrate microgrid concept on existing low voltage distribution system in Finland. The concept was a result from issues that rose up survey held for distribution system operators and of other considerations discussed in Master’s thesis ”Community Microgrid – A Building Block of Finnish Microgrid”. [3]
2.1 Energy centre microgrid concept
Energy centre microgrid concept for microgrids focuses on fast integration to cur-rent urban distribution system, and use of existing technology. Figure 1 displays layout of the concept.
Figure 1. Energy centre microgrid concept. Red represents Energy centre and green low voltage distribution clients.

2. Energy centre microgrid model as test bed
9
Concept concentrates production and possible storage devices on clusters of units which connect to grid from a single point located on distribution transformer. Cen-tralised concept has many advantages. Because the concept has only one-directional power flow in customer LV lines, regular protection equipment can be used. Of course proper loss-of-mains protection, overcurrent protection and a synchronising system is needed with the concept. However most of the usual protection problems can be avoided this way. Due the fact that production is in one place, safety of service personnel is improved because microgrid can be made voltage free just from one place. Also because 2/3 of grid faults are located in medium voltage lines, proposed LV microgrid concept is isolated from most of the faults in common distribution system [4].
Microgrid can provide backup power for important services for the community. Important services can be for example to supply electricity for hospitals, gas sta-tions and communication networks. Power generators of the proposed concept can be running also when there are no disturbances in MV supply and power is sold to markets. Due continuous operation, the risk of backup power not starting is smaller as devices are constantly used and serviced.
Profitability of microgrid system has to be always inspected case by case and it depends heavily on environmental resources and value that it can generate to the community providing more reliable and better quality power. Of course in the end it always depends on how much money is needed for the investment and how the costs are divided. [3]
2.2 Implementation of the concept as PSCAD model
The concept described in previous chapter was built as simulation model in [5] as test bed for load simulations in microgrid environment. PSCAD is electromagnetic transient simulation software developed by Manitoba HCDC Research Center. Calculations in PSCAD are made in instantaneous values and resulted differential equations are solved numerically. PSCAD can also be used for power flow calcu-lations although large networks could be more easily solved with software that can use state vectors for finding the solution. Figure 2 displays the overall layout of the simulation model.

2. Energy centre microgrid model as test bed
10
Figure 2. Overall layout of the simulation model.
On the far left is the DC side of the system where production and storages are concentrated. Next component from left to right is the DC/DC boost converter which is used to covert 50V DC to 1000V DC. There is passive surge protector modelled by diodes with 0.505 kV forward voltage drops. Next on right from the boost converter there is an inverter operating with space vector modulation and an isolation transformer with 0.4/0.4 turns ratio.
Inverter feeds the load component which is called demand side in the figure. A 3-phase switch is located between inverter and loads. Overcurrent protection is done with VTT’s gG fuse model. Grid connection is located between inverter and transformer and modelled using VTT’s voltage source model with adjustable fault level. More comprehensive description of the Energy Centre Microgrid model can be found in [5]. Version of microgrid model in [5] was made with earlier version of PSCAD and simulations in this document are made with newer version. Some small adjustments are also made to control systems of the model and there are some differences on performance because of this.
A
B
C
EdcVA
A
B
C
A
B
C
abc
neut
Demand side
A
B
C
A
B
C
udc_p
udc_m
a
b
c
Island inverter
u_grid
BRK1
Qload
Power comm and
Eab
Ebc
Eca
50 to 1000V boost converter"m irror output voltages"SOC 0.85
DC_in
DC_I_inu1p
u1m
u2p
u2m
Ia
Ib
Ic
A
B
C
A
B
C
#2#1
0.4 [kV]0.4 [kV]
0.2 [MVA]um ec
Uminus
Uplus
InD
D
0.001 [ohm]
0.001 [ohm]
Un
Passive surge protector
EaEb
Ec
Initial state of charge for batteries ( 0-1.0)
100 A
A
B
C
OFAA gG 690 V
0.4e-3 [MW]
Load to take account own use of the energy centre
RL
Vpu
Sk = 3500.0 [kVA] Vr = 0.400[kV]
1.0
Fault
BR
K1
V A
uabc ok
BRK1
rest
ore
VA
Q
Grid connection
BRK1
cb
soc_sta
up
um
SOC
DC generation and storageGrid state
Power command

3. Inspected load types
11
3. Inspected load types
Power quality effects of motor loads and high peak current rectifier loads were inspected in research report of “Grid interference caused by electric devices” (orig-inal title in Finnish) with common Finnish distribution system [2]. Single phase wood chopping machine and welding load had relatively the worst effect on power quality and especially to flicker. Occurrence of problems was directly related to fault level in installed location; how strong the grid is, and also of course how high currents devices draw.
Research topic with microgrid model is to investigate whether microgrid is more likely to have these problems or not. And also how control options of smart grid infrastructure and other methods can be used to reduce the possible prob-lems. Division can be made to active methods like load control and phase balanc-ing and to passive methods like limiting start-up currents and using filters (alt-hough active filtering is also a possibility).
3.1 Base simulation setup
Base setup for simulation is an islanded operation of microgrid and total of 20 kW of symmetric base load distributed to 100, 200 and 300m distances from the root of the supply line. The Modelled microgrid is designed to handle maximum load of 100 kW. A model of star connected adjustable load was built for this task. Figure 3 displays simulation block of the load model and control logic is presented in figure 4.
Figure 3. Star connected adjustable resistive load.
Adjustable resistive loadwith neutral connectionabc
pcommand
neutral
Pc

3. Inspected load types
12
Figure 4. Logic of controllable load.
A power command in kilowatts is given to a load which adjusts resistances according to voltage level of 230 V. Parameters of the low voltage line are presented in fig-ure 5. Figure 6 displays the actual distribution line and load components along it.
Figure 5. Line parameters.
abc
pcommand
+
R1p
+
R1p
+
R1p
A
B
C neutral
Calculation resistance value from power command,note that voltage is not measured value, so load is voltage dependent P=U 2̂/R
230.0 N
D
N/D
0.23
N
D
N/D
3.0
N
D
N/D
R1p
Resistive adjustable load component

3. Inspected load types
13
Figure 6. Distribution line and loads.
3.1.1 Voltage drop related to base load
As mentioned previously, base load of 20 kW is distributed along the line. Figure 7 displays how voltage at end and at bus of the line drops when symmetric 20 kW load is added evenly to the line and figure 8 displays measured total power con-sumption of loads.
abcVA
V A
ABC
neut
NO
MIN
AL
PIS
ECTIO
N
AXMK185100m
NO
MIN
AL
PI
SEC
TION
AXMK185100m
NO
MIN
AL
PISEC
TION
AXMK185100m
Adjustable resistive loadwith neutral connectionabc
pcommand
neutral
Adjustable resistive loadwith neutral connectionabc
pcommand
neutral
PcP
c
Adjustable resistive loadwith neutral connectionabc
pcommand
neutral
Pc

3. Inspected load types
14
Figure 7. Line to line voltages at LV bus and end of the line in per unit values.
Figure 8. Power consumption of the base load. Active power in kW in blue and reactive power in kVar in green (losses included).
3.2 Motor loads
Typical electric motor loads found in homes are washing machines, heat pumps and pressure washers. Also a wide range of more rare motor loads like drilling machines might in use at some locations. Usually most of the motors are single phase but three phase motors are more common in heat pumps and other larger devices. The popularity of single phase device is understandable as those devices can be connected to normal sockets and do not require an electrician. Following two chapters describe how single phase motor load were modelled to PSCAD, and what the effects were on selected microgrid environment.
deman_side : Graphs
x 1.0 2.0 3.0 4.0 5.0 6.0 7.0 8.0 9.0
0.980
0.990
1.000
1.010
1.020
1.030
1.040 Ubus Uend
deman_side : Graphs
x 0.0 2.0 4.0 6.0 8.0 10.0
-2.5 0.0 2.5 5.0 7.5
10.0 12.5 15.0 17.5 20.0 22.5
Pload Qload
3. Inspected load types
15
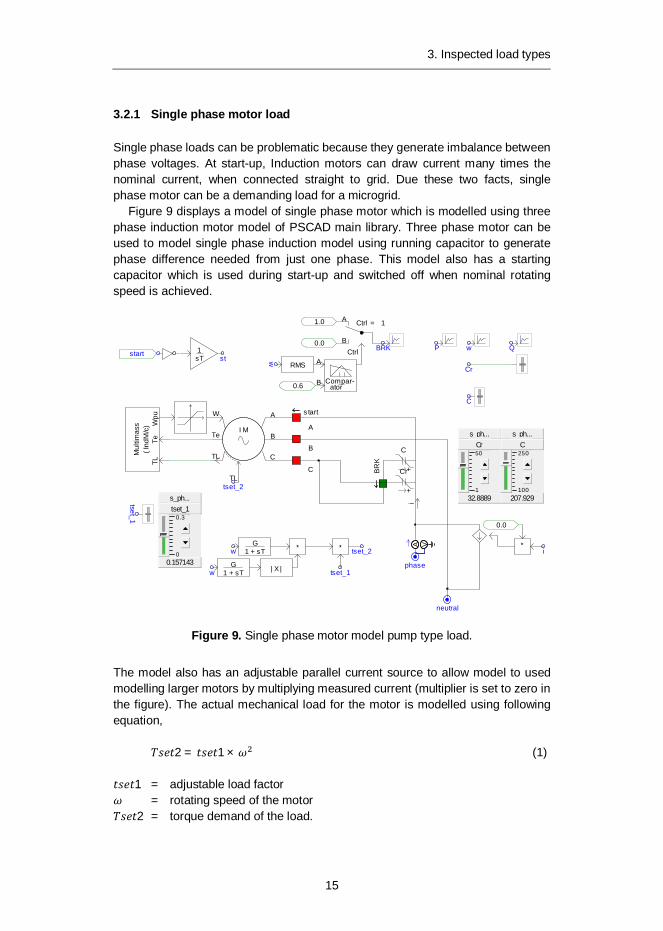
3.2.1 Single phase motor load
Single phase loads can be problematic because they generate imbalance between phase voltages. At start-up, Induction motors can draw current many times the nominal current, when connected straight to grid. Due these two facts, single phase motor can be a demanding load for a microgrid.
Figure 9 displays a model of single phase motor which is modelled using three phase induction motor model of PSCAD main library. Three phase motor can be used to model single phase induction model using running capacitor to generate phase difference needed from just one phase. This model also has a starting capacitor which is used during start-up and switched off when nominal rotating speed is achieved.
Figure 9. Single phase motor model pump type load.
The model also has an adjustable parallel current source to allow model to used modelling larger motors by multiplying measured current (multiplier is set to zero in the figure). The actual mechanical load for the motor is modelled using following equation,
2 = 1 × (1)
1 = adjustable load factor = rotating speed of the motor
2 = torque demand of the load.
tset_1
tset_2s_ph...
0.3
0
tset_1
0.157143
Mul
timas
s
TeW
pu( I
ndM
/c)
TL
i
0.0
*i
VA
C
P Qw
+
C
A
C
I M
TL
B
W
Te
TL
+
CrBR
KCr
A
B Compar-ator
A
BCtrl
Ctrl = 1
0.6w
0.0
1.0
BRK
C
B
A
start
s_ph...
50
1
Cr
32.8889
RMSstart
neutral
phase
st1sT
w *
tset_1
tset_2
| X |
*
w
G1 + sT
G1 + sT
s_ph...
250
100
C
207.929

3. Inspected load types
16
Multimass component included in the base library of PSCAD is used to model this interaction between load and motor. Figure 10 displays active and reactive power demand of one single phase motor.
Figure 10. Power demand Single phase motor in start-up.
Figure 11 displays three phase voltages when three single phase motors starting at the same time in single phase.
Figure 11. RMS values of phase voltage when three motors start at same time in one phase.
Inverter is trying to compensate and therefore one phase voltage is higher than other two. Power demand in start of three motors starting is presented in figure 12.
s_phase_motor : Graphs
x 2.950 3.000 3.050 3.100 3.150 3.200 3.250 3.300 3.350 3.400
-1.0
0.0
1.0
2.0
3.0
4.0
5.0
6.0
kW /
kVAr
Q P
deman_side : Graphs
x 2.10 2.20 2.30 2.40 2.50 2.60 2.70 2.80
0.2150
0.2175
0.2200 0.2225
0.2250
0.2275
0.2300
0.2325
0.2350
0.2375
y
uc1_a uc1_b uc1_c

3. Inspected load types
17
Figure 12. Active (kW) and reactive power (kVar) demand of the three motors at start-up.
3.3 Rectifier DC-loads
3.3.1 Single phase rectifier load
Single phase rectifier load selected for modelling is a compact fluorescent lamp, CFL, which are commonly also referred as energy saving lamps. Modelling princi-ples for CFLs presented in [6] were used for creating model to PSCAD. Figure 13 displays simulation diagram of single lamp.
Figure 13. CFL simulation diagram.
Simulation diagram of multiple lamps is displayed in figure 14. Electrical line pa-rameters in multiple lamp connection are 8.0214e-5 H and 0.0075 to simulate distance between the lamps. The shape of the current is displayed in figure 15.
deman_side : Graphs
sec 2.20 2.30 2.40 2.50 2.60 2.70 2.80 2.90 3.00
-2.0
0.0
2.0 4.0
6.0
8.0
10.0
12.0
14.0
16.0 kW
/ k
Var
Pload Qload
phase
neutral
Ia
Ea
D
D
D
D
4 [kohm]
Udc
1.2 [ohm]
3 [uF]
0.2 [uH]

3. Inspected load types
18
Figure 14. Connection arrangement of three CFLs.
Figure 15. Shape of the current of three CFLs in microgrid. Blue current is at connection point, green is one length away, and red is two lengths away.
On grid connection with high fault level (high short circuit power), current has higher peak resulting from interaction with line inductance. Figure 16 displays CFL model in grid with high fault level.
VA
I3I2I1
E3E2E1 0.0075 [ohm]0.0075 [ohm]
Icfl
Com
pact
flur
ecen
t lam
bph
ase
neut
ral
Com
pact
flur
ecen
t lam
bph
ase
neut
ral
Com
pact
flur
ecen
t lam
bph
ase
neut
ral
8.0214e-5 [H] 8.0214e-5 [H]
deman_side : Graphs
x 2.0330 2.0340 2.0350 2.0360 2.0370
-0.10
0.00
0.10
0.20
0.30
0.40
0.50
0.60
A
I1 I2 I3

3. Inspected load types
19
Figure 16. CFL current in gird with high fault level. Blue current is at connection point, green is one length away, and red two lengths away.
Interestingly current resonance profile in high fault level grid is somewhat opposite to the one in microgrid. The resonance of the lamp in the connection point is low-est opposed to highest in microgrid and resonances dampen. This indicates that at least in this specific case, control method of straight voltage control generates resonances with proposed compact fluorescent lamp model. Suitable solution to get rid of resonances would be to introduce filtering or try to find inverter control method with would reduce the effect.
3.3.2 Three phase rectifier load
Three phase rectifier loads can also introduce power quality problems which are mostly related to harmonics. In this case melting or cutting type of load was se-lected for modelling. Figure 17 displays simulation diagrams of the model.
Main : Graphs
x 0.1800 0.1810 0.1820 0.1830 0.1840 0.1850 0.1860
-100
0
100
200
300
400
500
600 I1 I2 I3

3. Inspected load types
20
Figure 17. Three phase rectifier load model simulation diagrams.
Load consists of firing angle controlled three phase AC/DC converter and dynami-cally adjusted load resistor. The resistor is adjusted so that desired load profile is achieved. Figure 18 displays the active and reactive power demand during opera-tion of the load.
abc
Udc
m
Udcp
uc
ub
ua
c2
c1
b2
b1
a2
a1
D
2
D
2
D
2
D
2
D
2
D
2DC_l...
180
0
angle
37.1429VA
mel
t
start TIMES / H
inhold
out alku
D +
F
-
alku
TIME
R
+
R
D +
F
+
30.0
X2
startA
BCtrl
Ctrl = 1
0.0 start

3. Inspected load types
21
Figure 18. Three phase rectifier load active and reactive power demand.
At first power demand is high to model initial load on cutting blade or welding machine during the start-up. After that power demand stabilizes to a nominal level. Phase currents during starting are displayed in figure 19.
Figure 19. Current demand of the three phase rectifier load in amperes.
The shape of the current waveform is displayed in figure 20.
DC_load : Graphs
x 2.50 3.00 3.50 4.00 4.50 5.00 5.50 6.00
-1.0 0.0 1.0 2.0 3.0 4.0 5.0 6.0 7.0 8.0 9.0
(kW
,kVa
r)P Q
DC_load : Graphs
x 4.00 4.20 4.40 4.60 4.80 5.00
-25.0 -20.0 -15.0 -10.0 -5.0 0.0 5.0
10.0 15.0 20.0 25.0
i

3. Inspected load types
22
Figure 20. A closer look at the shape of the current from the previous image in amperes.
This current profile generates high total harmonic distortion to voltages and proper filtering would be needed to dampen the effects.
DC_load : Graphs
x 4.0000 4.0050 4.0100 4.0150 4.0200 4.0250 4.0300 4.0350
-25.0 -20.0 -15.0 -10.0 -5.0 0.0 5.0
10.0 15.0 20.0 25.0
i

4. Power quality problem mitigation
23
4. Power quality problem mitigation
4.1 Voltage reference control with virtual impedance
Voltage sag compensation in islanded single line fed power system can be done by controlling voltage reference of the inverter to compensate losses in lines and transformers in symmetric high load. This is done by measuring current its phase angle respect to voltage and calculating drop in voltage using knowledge on line and transformer parameters. This method is called virtual impedance method.
Voltage sag can be approximated by following equation,
= ( ) + ( ) (2)
Therefore compensated voltage reference can be given as,
_ = 0.3253 + ( ) + ( ) kV (3)
where,
= resistance = Impedance = RMS value of the current = Phase angle between current and voltage.
Calculation of 50Hz current component and phase angle can be implemented using simulation blocks found in PSCAD master library and displayed in figure 21.

4. Power quality problem mitigation
24
Figure 21. Simulation blocks to calculate 50Hz components and current angle from voltages and currents.
Virtual impedance method was tested with symmetric 60 kW active power load and 20 kVar reactive power load. Figure 22 displays power profile for the test.
Figure 22. Power demand profile for voltage sag test.
(7)
(7)
(7)(7)
(7)
(7)XA
XB
XC
Ph+
Ph-
Ph0
Mag+ Mag- Mag0
dcA dcB dcC
F F T
F = 50.0 [Hz]
VPM VNM VZM
VPP
VNP
VZP
IPM INM IZM
IPP
INP
IZP
SinD +
F
-1
VPM1
VPP1
VPM
1
IPM1IPM
1
VPP1VPP
1
IPP1IPP
Extract Fundamental fromVector of Harmonics
IPP1
SINANG
CosCOSANG
ANG
(7)
(7)
(7)(7)
(7)
(7)XA
XB
XC
Ph+
Ph-
Ph0
Mag+ Mag- Mag0
dcA dcB dcC
F F T
F = 50.0 [Hz]
Ea
Eb
Ec
ia
ib
ic
deman_side : Graphs
x 0.00 0.50 1.00 1.50 2.00 2.50
-10
0
10
20
30
40
50
60
70
kW/ k
Var
Pload Qload

4. Power quality problem mitigation
25
Test results for per unit values of voltages at both ends of the line without virtual impedance compensation are presented in figure 23.
Figure 23. Voltage sag in high three phase load. End of the line is green and blue is at bus of the transformer.
When virtual impedance method is taken into use voltage sag can be corrected. Results are displayed in figure 24.
Figure 24. Voltage sag corrected with virtual impedance method. End of the line is green and blue is at bus of the transformer.
deman_side : Graphs
x 1.00 1.20 1.40 1.60 1.80 2.00 2.20
0.9700
0.9750
0.9800
0.9850
0.9900
0.9950
1.0000
1.0050
1.0100 Ubus Uend
deman_side : Graphs
x 1.0 2.0 3.0 4.0 5.0 6.0 7.0
0.970
0.980
0.990
1.000
1.010
1.020
1.030
1.040 Ubus Uend

4. Power quality problem mitigation
26
4.2 Filtering
Passive filtering tuning in PSCAD can be done with optimum run component by generating function which is minimised for desired result. LC filter, a filter consist-ing of inductance and capacitance, can be used to limit harmonic resonances and improve power quality in rectifier loads. For this multi criteria filter selection, total harmonic distortion of current, apparent power, and voltage level at DC side of rectifier were selected to be variables in this function. Function was written as follows,
= |245 | + 5 × + (4)
= rectifier DC-voltage in V = total harmonic distortion of currents in %
= apparent power in Var.
In ideal case total harmonic distortion (THD) and voltage difference are close to zero and the value of the function is close to the nominal apparent power.
Function (F) was connected to input of the optimum run component in simula-tion, which had two output variables, values for inductor and capacitor. Simplex algorithm was selected from optimum run component for the task.
4.2.1 Filtering for CFL-lamp
For compact fluorescent model, result values were 10 H for the inductor and 0.35 uF for the capacitor. Of course inductor of that size can cost as much as the whole lamp and practical sizing would be different. In any case, adding the filter with these parameters improved the power quality significantly. Figure 25 displays LC-filter connected to CFL-model.
Figure 25. LC-filter connected to CFL-model.
Without filter, current looks as presented in figure 26 and with filter results are presented in figure 27.
phase
neutral
Ia
Ea
D
D
D
D
3.0 [uF]
0.2 [uH]
4 [kohm]
Udc
VA Ib
+
C
+
L Ic
1.2 [ohm]

4. Power quality problem mitigation
27
Figure 26. Current of three CFLs without filtering.
Figure 27. CFL current with filtering installed.
Voltage and current between grid and filter compared to current drawn from the grid is presented in figure 28.
deman_side : Graphs
x 3.3690 3.3700 3.3710 3.3720 3.3730 3.3740 3.3750 3.3760 3.3770 3.3780
-0.10
0.00
0.10
0.20
0.30
0.40
0.50
0.60 A
I1 I2 I3
deman_side : Graphs
x 2.040 2.050 2.060 2.070 2.080 2.090 2.100
-0.150
-0.100
-0.050
0.000
0.050
0.100
0.150
A
I1 I2 I3

4. Power quality problem mitigation
28
Figure 28. Voltage and current between grid an filter compared to current drawn from the grid.
The form of the voltage is a bit altered after the filter but RMS value is still close to normal phase voltage. This does not matter as shape of the DC voltage is similar.
4.2.2 Three phase thyristor load
Equation based filter tuning did not give desired results when trying to apply same formula as with filter for CFL for three phase thyristor load. Rather than trying to find working formula and algorithm, more traditional approach was used. Also filter type was changed to variation of LCL filter. Figure 29 displays total harmonic dis-tortion of voltage with three phase thyristor load without filter. First spike in the figure is system going to islanded mode and not related to load.
CFL_1 : Graphs
x 2.0500 2.0550 2.0600 2.0650 2.0700 2.0750 2.0800 2.0850 2.0900 2.0950 2.1000
-300
-200
-100
0
100
200
300 (V
,mA)
U_rect I_grid I_rect

4. Power quality problem mitigation
29
Figure 29. Total harmonic distortion of voltage (respect to base frequency) without filtering in three phase thyristor load.
The shape of the current without filter of three phase thyristor load is displayed in figure 30.
Figure 30. Shape of the current of three phase thyristor load without filter in am-peres.
Proposed filter for thyristor load is presented in figure 31.
Main : Graphs
x 0.0 2.0 4.0 6.0 8.0 10.0
0.0
2.0
4.0
6.0
8.0
10.0
12.0
14.0 y
THD %
DC_load : Graphs
x 4.0000 4.0050 4.0100 4.0150 4.0200 4.0250 4.0300 4.0350
-25.0 -20.0 -15.0 -10.0 -5.0 0.0 5.0
10.0 15.0 20.0 25.0
i

4. Power quality problem mitigation
30
Figure 31. LCL filter for three phase thyristor load.
In addition to traditional style LCL filter, a cut-off switch is added so that reactive power compensation of LCL filter does not operate when device is not actively used. Reactive power comes from 80 uF capacitors to shape current demand of the device. Inductors on grid side are 30 mH and on bridge side 3 mH. Parameters where adjusted so that distortion of the current is much lower and voltage level at the bridge remains adequate. Figure 32 displays total harmonic distortion of the voltage with LCL filter on thyristor load. First high spike in the figure is system going to islanded mode and not related to load.
Figure 32. Total harmonic distortion of the voltage (respect to base frequency) with LCL filter on three phase thyristor load.
Figure 33 displays the shape of the current with filter.
abc
Udc
m
Udcp
uc
ub
ua
c2
c1
b2
b1
a2
a1
D
2
D
2
D
2
D
2
D
2
D
2
VA
mel
t
+
R
A
B
C
A
B
C
30e-3 [H]
80 [uF]
30e-3 [H]
30e-3 [H]
3e-3 [H]
3e-3 [H]
3e-3 [H]
80 [uF]
80 [uF]
melt50 [uF]
Main : Graphs
x 0.50 1.00 1.50 2.00 2.50 3.00 3.50 4.00 4.50
0.0
1.0
2.0
3.0
4.0
5.0
6.0
7.0
8.0
y
THD %

4. Power quality problem mitigation
31
Figure 33. Current shape of the three phase thyristor load with LCL filter in A.
There is a short spike and a phase shift at start before filter energizes but after that current is much closer to sin signal.
4.3 Load control
Load control is an option when there are problems with high currents and particu-larly suitable when high load currents are temporary. Single phase motor heat pumps suit well to load control as start of the pump can be shifted couple of sec-onds, or even minute, with no noticeable changes in temperatures. However there might be problems with internal control logic if there is no communication between load controller and motor controller.
Here load control is implemented to situation of three single phase heat pumps starting. Heat pumps send starting signal to ask starting and load control has individual response speeds for connecting the pumps, the same way that genera-tors have different droop controls to respond to power demand. Also load control-ler gives information to which phase single phase load is allowed to be connected. Heat pump is connected to grid via component called “phase jumper”. Phase jumper physically connects load to one of the three phases. Figure 34 displays simulation block for phase jumper.
DC_load : Graphs
x 1.500 1.520 1.540 1.560 1.580
-30
-20
-10
0
10
20
30 i

4. Power quality problem mitigation
32
Figure 34. Simulation block for phase jumper.
Phase jumper takes information from load controller what phase phases are ok for loads to be connected. This is input is named LCi in the figure. Also signal to request starting, named reg2 in the figure is connected to phase jumper. Rest connection points are phase and neutral inputs and outputs. Figure 35 displays wire model of the phase jumper. Model consists only from single phase circuit breakers and priori-tised control logic. Control logic of the phase jumper is displayed in figure 36.
Figure 35. Wire model of the phase jumper.
[ LCi ]
req2
Phase jumperfor 1-phase loads
input_e
phase_s
out_e
hold
input_n out_n
input_e out_e
A
B
C
a1
a2
a3
aninput_n out_n

4. Power quality problem mitigation
33
Figure 36. Control logic inside phase jumper.
Control logic works so that it connects load to phase a if it is allowed by the load controller. If that is not allowed, it tries phase b and then phase c. Neutral is only connected when also one phase is connected. Figure 37 displays power demand when three single phase motor loads are ran using the system.
[ ps ]1 2 3in1 in2 in3
s1
s2s3
a1
A
BCtrl
Ctrl = 1
in1
a2
in1
in2
1.0
A
BCtrl
Ctrl = 1
in1a3
1.0
a3
in2
in3
A
BCtrl
Ctrl = 01.0
[ hold ]
A
BCtrl
Ctrl = 01.0
[ hold ]
A
BCtrl
Ctrl = 01.0
[ hold ]
an
[ hold ]
1.0 A
BCtrl
Ctrl = 0
0.0
S / Hinhold
out
[ hold ]
S / Hinhold
out
[ hold ]
S / Hinhold
out
[ hold ]

4. Power quality problem mitigation
34
Figure 37. Power demand when three heat pumps are connected on top of 20 kW base load.
All pumps run same time but start and stop times are different. Figure 38 displays phase currents of the heat pumps on top of 20 kW base load.
Figure 38. Phase currents when three single phase heat pumps are connected.
deman_side : Graphs
x 1.0 2.0 3.0 4.0 5.0 6.0 7.0 8.0
19.0
20.0
21.0
22.0
23.0
24.0
25.0
26.0
27.0 kW
/ kVa
rPload Qload
Main : Graphs
x 2.0 3.0 4.0 5.0 6.0 7.0 8.0
25.0
30.0
35.0
40.0
45.0
50.0
55.0
(A)
Ia Ib Ic

5. Conclusions and discussion
35
5. Conclusions and discussion
Aim of this research was to investigate how different type electric loads affect power quality in microgrid. The approach selected was to use electromagnetic transient simulation software, PSCAD and purpose built microgrid model. Type of problems can be divided to either voltage level problems or harmonic problems. Devices emitting harmonics can be usually filtered to comply with power quality norms but more active approach might have to be taken if the load just draws too much current. Load types in the microgrid simulation were compact fluorescent lamp CFL, single phase rectifier load, three phase thyristor load, and single phase motor load. Also 20 kW static three phase load was used for base case.
A good filtering solution was found for the CFL using LC-filter configuration and values for components were found using simplex optimization algorithm. Without a filter there was small resonance with CFL and inverter when inverter was in straight voltage control mode. Three phase thyristor load was more difficult because it had high RMS value of current and high harmonic distortion. Selected filtering solution was to use a LCL filter and a cut-off switch. Simplex algorithm did not work in this case for finding inductor and capacitor values. Values were set so that adequate current filtering and reactive power compensation were achieved. Problem for the single phase motor load was that it draws high current at start and also that there is very limited capacity of power per phase in inverter driven mi-crogrid. Solution for to problem was a device which selects a phase for the single phase load so that single phase loads are spread evenly among all three phases. The device was named a phase jumper.
Also method of virtual impedance was used with success in the model to elim-inate voltage sag caused by the isolation transformer. Virtual impedance method means that in this case voltage level reference for the inverter was adjusted so that it compensated the decrease of voltage over the isolation transformer respect to the current. Virtual impedance method can also be used to compensate part of the distribution lines but still taking into account that voltage level is not too high or low in any part of the system.
Although selected environment for simulation was a microgrid, found problems and solutions largely also apply to normal distribution grids. One interesting area to continue the work would be to investigate how different inverter control algo-rithms affect possible resonance between inverter and load. One resonance was found in the simulations with compact fluorescent lamp. Also only one type of

5. Conclusions and discussion
36
microgrid model (single point fed) was used in this report and more problems might arise with other types. Also as an alternative for controlling how single phase loads connect to the system, control of individual phase voltages of the inverter could be investigated. However this does not solve the problem totally because there is usually not much excess power capacity per phase in inverter driven systems. As a solution to this some previous studies have suggested single phase distribution with parallel inverters feeding a single phase. This gets rid of phase unbalance problems and reduces stand-by losses when inverters can be started on demand and shuttled down load is light. With single phase distribution, three to single phase frequency converters would be needed so that phase bal-ancing problems won’t just be moved to rest of the grid.

37
References
[1] Pikkarainen, M. Power quality problems caused by changed electrical loads and evaluation and measurement of those problems. Master of Science thesis. Tampere University of Technology. 2009. 93 p.
[2] Pakonen, P., Pikkarainen, M. Sähkölaitteiden aiheuttamien verkkohäiriöiden arviointi – loppuraportti. Tampere University of Technology. 2010. (In Finnish.)
[3] Pasonen, R. Community Microgrid. A Building block of Finnish Smart Grid. Master of Science thesis. Tampere University of Technology. 2010.
[4] Mäkinen, A. Disturbances in electric grids and power quality, lecture notes, Tampere University of Technology. 2007.
[5] Pasonen, R. Energy centre microgrid model. VTT Technical Research Centre of Finland. 2011. VTT Working Papers 182. 34 p. http://www.vtt.fi/inf/pdf/ workingpapers/2011/W182.pdf.
[6] Wei, Z., Watson, N.R., Frater, L.P. Modelling of Compact Fluorescent Lamps. 2008 13th International Conference on Harmonics and Quality of Power. Wol-longong, Australia. 2008.


Series title and number VTT Technology 84
Title Feasibilities for power quality problem mitigation in microgrid
Author(s) Riku Pasonen
Abstract Different electric loads can be problematic for power quality in microgrids but also microgrid can offer more options for power quality management. Type of problems can be divided to either voltage level problems or harmonic problems. Devices emitting harmonics can be usually filtered to comply with power quality norms but more active approach might have to be taken if the load just draws too much cur-rent.
This research report investigates how different load types affect the power quality in microgrid. Transient electric simulation software, PSCAD and microgrid simulation model was used for the research. Load types in the microgrid simulation were compact fluorescent lamp CFL, single phase rectifier load, three phase thyris-tor load, and single phase motor load. Also 20 kW static three phase load was used for base case.
A good filtering solution was found for CFL using LC-filter configuration and val-ues for components were found using simplex optimization algorithm. There was a small resonance with CFL and inverter without filter in CFL. Three phase thyristor load was more difficult because it had high RMS value of current and high harmon-ic distortion. Selected filtering solution was to use LCL filter and cut off switch. Simplex algorithm did not work in this case for finding inductor and capacitor val-ues. Values were set so that adequate current filtering and reactive power com-pensation were achieved. Problem for the single phase motor load was that it draws high current at start and also that there is very limited capacity of power per phase in inverter driven microgrid. Solution for to problem was a device which selects a phase for the single phase load so that single phase loads are spread evenly among all three phases. The device was named a phase jumper. Also virtual impedance method was used to compensate voltage sag from isolation transformer; raising the voltage reference of the feeding inverter respect to current.
ISBN, ISSN ISBN 978-951-38-7924-2 (URL: http://www.vtt.fi/publications/index.jsp) ISSN-L 2242-1211 ISSN 2242-122X (Online)
Date March 2013
Language English, Finnish abstract
Pages 38 p.
Name of the project Smart Grids and Energy Markets
Commissioned by VTT Technical Research Centre of Finland, Cleen Ltd
Keywords power quality, microgrid, simulation
Publisher VTT Technical Research Centre of Finland P.O. Box 1000, FI-02044 VTT, Finland, Tel. 020 722 111


Julkaisun sarja ja numero VTT Technology 84
Nimeke Mahdollisuudet sähkön laadun hallintaan mikroverkossa
Tekijä(t) Riku Pasonen
Tiivistelmä Eri kuormatyypit voivat olla haasteellisia mikroverkon kannalta, mutta mikroverkko antaa myös enemmän vaihtoehtoja ongelmien ratkaisemiseksi. Tyypilliset ongel-mat voidaan jakaa joko harmonisesta säröstä johtuviin tai liian suuresta virrasta johtuviin. Suodattimet ovat yleensä ratkaisu harmonisiin liittyviin ongelmiin, mutta suuresta virrasta johtuviin ongelmiin ratkaisuun tarvitaan yleensä kuorman ohjausta.
Tässä tutkimusraportissa tarkastellaan eri kuormatyyppien vaikutuksia sähkön laatuun mikroverkossa. Työkaluna tarkasteluissa käytetään sähkömagneettisien transienttien laskentaohjelmistoa, PSCADia ja kyseiseen ohjelmistoon kehitettyä mikroverkkomallia. Tarkastellut kuormat simuloinnissa olivat energiansäästölamp-pu, yksivaiheinen tasasuuntaajakuorma, kolmivaiheinen tyristorikuorma ja yksivai-heinen oikosulkumoottorikuorma. Lisäksi kolmivaiheinen 20 kW kuorma oli asetettu peruskuormaksi kuhunkin tarkasteluun.
LC-tyypin suodatin todettiin soveltuvaksi energiansäästölampun kanssa käytet-täväksi. Suodattimen komponenttien arvot haettiin Simplex-optimointialgoritmilla ja tehtävään kehitetyllä funktiolla. Energiansäästölampun mallin huomattiin aiheutta-van pientä resonointia vaihtosuuntaajan kanssa kun suuntaaja ohjattiin suoralla jännitteensäätöalgoritmilla, mutta ongelma poistui suodattimen kanssa. Kolmivai-heinen tyristorikuorma oli hankalampi tapaus suodatuksen kannalta, koska sekä virran tehollisarvo ja harmoninen särö oli suuri. Suodattimeksi tälle valittiin LCL tyypin suodatin katkaisukytkimellä varustettuna. Algoritmipohjainen parametrien haku ei tuottanut toivottua tulosta, joten suodattimen komponenttien arvot valittiin siten, että virran suodatus on riittävä ja että sopiva loistehon kompensointi saatiin aikaan. Suuri käynnistysvirta oli ongelmana yksivaiheisen moottorikuorman kanssa ja vaihekohtainen virtakapasiteetti on varsin rajallinen vaihtosuuntaajalla toteute-tussa mikroverkossa. Ongelman ratkaisemiseksi kehitettiin liitäntälaite moottorin ja verkon väliin, joka kytkee kuorman siihen vaiheeseen, jossa on vähiten kuormaa. Suotuisimman vaiheen valintaa käytettiin virtamittaustietoa syöttävältä muuntajalta. Laitteen avulla yksivaiheiset kuormat kytkeytyvät tasaisesti kaikille kolmelle vai-heelle. Lisäksi erotusmuuntajasta johtuvan jännitteen aleneman korjaamiseen käytettiin virtuaalisen impedanssin lisäämistä syöttävän vaihtosuuntaajan ohjauk-seen; vaihtosuuntaajan jänniteohjetta säädettiin virran funktiona.
ISBN, ISSN ISBN 978-951-38-7924-2 (URL: http://www.vtt.fi/publications/index.jsp) ISSN-L 2242-1211 ISSN 2242-122X (verkkojulkaisu)
Julkaisuaika Maaliskuu 2013
Kieli Englanti, suomenkielinen tiivistelmä.
Sivumäärä 38 s.
Projektin nimi Smart Grids and Energy Markets
Toimeksiantajat VTT Technical Research Centre of Finland, Cleen Ltd
Avainsanat power quality, microgrid, simulation
Julkaisija VTT PL 1000, 02044 VTT, Puh. 020 722 111


VTT on puolueeton, moniteknologinen tutkimusorganisaatio. VTT tuottaa yhdessä kotimaisten ja kansainvälisten asiakkaidensa ja yhteistyökumppaneidensa kanssa tieteelliseen tutkimukseen pohjautuvia innovaatioita ja luo näin edellytyksiä yhteiskunnan kestävälle kehitykselle ja hyvinvoinnille.
Liikevaihto: 300 milj. euroa Henkilöstö: 3 200
VTT:n julkaisut
VTT:läiset julkaisevat tutkimustuloksia ulkomaisissa ja kotimaisissa tieteellisissä lehdissä, ammattilehdissä ja julkaisusarjoissa, kirjoina, konferenssiesitelminä, patentteina sekä VTT:n omissa sarjoissa. VTT:n julkaisusarjat ovat VTT Visions, VTT Science, VTT Technology ja VTT Research Highlights. Sarjoissa ilmestyy vuosittain noin sata korkeatasoista tiede ja ammattijulkaisua. Julkaisut ilmestyvät verkossa ja suurin osa myös painettuna.
VTT VisionsSarja sisältää tulevaisuudennäkymiä ja ennakointeja VTT:n näkemyksen mukaan merkittävistä teknologisista, yhteiskunnallisista ja liiketoiminnallisista teemoista. Sarja on suunnattu erityisesti yritysten ja julkishallinnon päättäjille ja asiantuntijoille.
VTT ScienceSarja tuo esille VTT:n tieteellistä osaamista. Siinä ilmestyy väitöskirjoja ja muita vertaisarvioituja julkaisuja. Sarja on suunnattu erityisesti tutkijoille ja tiedeyhteisölle.
VTT TechnologySarja sisältää julkisten tutkimusprojektien tuloksia, teknologia ja markkinakatsauksia, kirjallisuustutkimuksia, oppaita ja VTT:n järjestämien konferenssien esitelmiä. Sarja on suunnattu ammattipiireille, kehittäjille ja soveltajille.
VTT Research HighlightsSarjassa esitellään tiiviissä muodossa VTT:n valittujen tutkimusalueiden uusimpia tuloksia, ratkaisuja ja vaikuttavuutta. Kohderyhmänä ovat asiakkaat, päättäjät ja yhteistyökumppanit.

VT
T T
EC
HN
OL
OG
Y 8
4
Feasib
ilities fo
r po
wer q
uality p
rob
lem
mitig
atio
n in
mic
rog
rid
ISBN 978-951-38-7924-2 (URL: http://www.vtt.fi/publications/index.jsp)ISSN-L 2242-1211ISSN 2242-122X (Online)
Feasibilities for power quality problem mitigation in microgridRiku Pasonen
•VISIONS•S
CIE
NC
E•T
ECHNOLOGY•R
ES
EA
RC
HHIGHLIGHTS
84
Recommended


![A Facet‐Specific Quantum Dot Passivation Strategy for Colloid Management … · 2019-03-18 · a PbS(100) surface using density functional theory (DFT) calcu-lations.[42,43] The](https://img.dokumen.tips/doc/110x75/5eb1ecef7cf416399f1880ee/a-facetaspecific-quantum-dot-passivation-strategy-for-colloid-management-2019-03-18.jpg)

![x arXiv:1704.06557v2 [cond-mat.supr-con] 2 Oct 2017 · 1 + xvolume, in agreement with band structure calcu-lations [28,29]. It is also reminiscent of earlier trans-port measurements](https://img.dokumen.tips/doc/110x75/5bfaaaf109d3f23e788ba71b/x-arxiv170406557v2-cond-matsupr-con-2-oct-2017-1-xvolume-in-agreement.jpg)