HAL Id: hal-01816329https://hal.archives-ouvertes.fr/hal-01816329
Submitted on 15 Jun 2018
HAL is a multi-disciplinary open accessarchive for the deposit and dissemination of sci-entific research documents, whether they are pub-lished or not. The documents may come fromteaching and research institutions in France orabroad, or from public or private research centers.
L’archive ouverte pluridisciplinaire HAL, estdestinée au dépôt et à la diffusion de documentsscientifiques de niveau recherche, publiés ou non,émanant des établissements d’enseignement et derecherche français ou étrangers, des laboratoirespublics ou privés.
Experimental optimization of an innovative biogasupgrading process adapted to the agricultural context
Valentin Fougerit, Julien Lemaire, Marc-André Theoleyre, Moncef Stambouli
To cite this version:Valentin Fougerit, Julien Lemaire, Marc-André Theoleyre, Moncef Stambouli. Experimental optimiza-tion of an innovative biogas upgrading process adapted to the agricultural context. 25th EuropeanBiomass Conference & Exhibition, Jun 2017, Stockholm, Sweden. �hal-01816329�

EXPERIMENTAL OPTIMIZATION OF AN INNOVATIVE BIOGAS UPGRADING PROCESS ADAPTED TO
THE AGRICULTURAL CONTEXT
Fougerit V., Lemaire J., Théoleyre M.-A., Stambouli M.
Department of Chemical Engineering and Materials, CentraleSupélec, Université de Paris-Saclay
SFR Condorcet FR CNRS 3417
Centre Européen de Biotechnologie et de Bioéconomie (CEBB), 3 rue des Rouges-Terres, 51110 Pomacle, France
+33 6 81 92 84 22
ABSTRACT: The development of the large European biomethane potential is facing the challenge of the biogas
upgrading technologies adaptation to the agricultural context (small and medium size anaerobic digestion units, rural
environment). Membrane contactors are an opportunity to adapt the robust Water Scrubbing (WS) process and to
decrease the high specific investment costs reported for available technologies. Microporous polypropylene (PP)
hollow fiber membrane contactors were combined in an absorption/desorption closed-loop using water as the absorbent.
A Design of Experiments methodology highlighted the gas and liquid flowrates, the inlet biogas composition and the
absorption gas pressure to be the most significant parameters impacting biomethane quality with a low level of
interactions. From the subsequent optimization, gas-grid quality biomethane (𝑦𝐶𝐻4
𝑜𝑢𝑡 = 97.6%) was produced with a
moderate recovery rate (𝑅𝐶𝐻4= 83.7%). The limited mass transfer efficiency may be compensated by a larger
membrane area. Alternatively, the addition of a methane recycling loop, similarly to the conventional WS process,
significantly improved the methane recovery rate (𝑦𝐶𝐻4
𝑜𝑢𝑡 = 95.9% / 𝑅𝐶𝐻4= 93.5%). These experimental results were
confirmed by on-site upgrading of raw farm biogas.
Keywords: upgrading, methane, absorption, membrane contactor, process intensification.
1 INTRODUCTION
In the last decades, biogas has been considered as an
energy source to build a sustainable energy mix and
substitute fossil fuels. The Anaerobic Digestion (AD) of
organic matter (agricultural waste, industrial waste, bio-
waste, sewage sludge, energy crops…) produces biogas
essentially composed of methane and carbon dioxide [1].
Its calorific content can be converted through several
pathways: heat production, electricity production or
conversion to biomethane [2]. The latter offers a substitute
to fossil natural gas: it can be stored and transported in the
gas-grid infrastructure and/or utilized as vehicle fuel [3].
Several processes are available for biogas upgrading
and relies on different separation principles [4], [5]: gas-
liquid absorption (physical such as water or organic
scrubbing, chemical such as amine scrubbing), adsorption
(PSA), gas membrane permeation or cryogeny. Among
them, Water Scrubbing (WS) offers the advantages of a
chemical-free process with a limited energy consumption
0.212 𝑘𝑊ℎ. 𝑁𝑚𝑏𝑖𝑜𝑔𝑎𝑠−3 [6]. Its robustness is well-adapted
to the agricultural context with non-technician operators
[7], [8]. These technologies aim at producing a gas-grid
quality biomethane (𝑦𝐶𝐻4
𝑜𝑢𝑡 > 97% for H gas in France)
with the highest methane recovery rate 𝑅𝐶𝐻4 (generally
above 97%).
Europe and France specifically hold a massive
potential for biomethane production [9], [10]. Within it,
agricultural waste from small and medium size farms
represent a significant share [11]. Though, the
development of biogas upgrading technologies is limited
due to their rising specific investment costs as the size of
the AD unit decreases [5]. Gas permeation and WS are the
leading technologies on this specific market. WS is
particularly adapted to a rural context due to its tolerance
to biogas impurities (such as volatile organic compounds
or hydrogen sulfide).
Hollow fiber membranes, a technology derived from
the artificial lung technology, is a gas-liquid contacting
device which offers several advantages [12], [13]. Its
modular nature offers an easy process design while its
compactness makes it visually more attractive than
conventional packed columns. The hydrophobic
membrane confines both gas and liquid phases to their
respective compartments and provides an operational
flexibility (no flooding or channeling issues).
As another advantage, the use of membrane contactors
in both absorption and desorption steps avoids the
depressurization of the solvent generally needed for air
stripping desorption occuring in packed columns; this
represents a significant energy saving as the solvent
recompression is considered to account for 20-30% of the
process energy requirement [14].
These advantages make it an attractive solution for
gas-liquid absorption processes. Most of the studies
focused on post-combustion carbon capture [12]–[16] but
a few of them experimentally explored its potential for
biogas [17]–[21] or natural gas upgrading [21]–[24]. The
largest membrane areas reported were tested with PP
hollow fibers (highly available for processability and cost
considerations).
The mass transfer resistance is typically described by
a resistance in serie model divided into the gas, membrane
and liquid phases [25]. In the case of pure CO2 absorption,
the limiting mass transfer resistance was demonstrated to
be located in the liquid phase [25], [26]. Similarly, in the
case of biogas upgrading, McLeod proved that the carbon
dioxide absorbed flow 𝑄𝐶𝑂2
𝑎𝑏𝑠 in water was driven by the
liquid velocity when a physical absorbent was used [17].
Considering only absorption, 85% biomethane was
produced but the methane slip was already significant
(𝑅𝐶𝐻4= 94.78 %). Using a 1M NaCl solution instead of
pure water, 𝑅𝐶𝐻4 was increased to 96.00 % thanks to the
salting out effect. In a process development perspective,
only one recent study carried out experimental work to
implement an absorption/desorption cycle applied to
biogas upgrading, as presented by Teplyakov [27]. With
water as the absorbent, Kim produced a gas-grid quality
biomethane (𝑦𝐶𝐻4
𝑜𝑢𝑡 = 98%) though with a lower recovery
rate (𝑅𝐶𝐻4= 85 %) [18]. Coupling absorption and
desorption steps, 𝑅𝐶𝐻4 was further decreased to 75%.
Despite biogas upgrading standards were not reached, the
process potential was confirmed by a stability over 50h.
The main concern regarding the industrial application
of hollow fiber membrane modules to gas-liquid
absorption processes is the membrane wetting
phenomenon [28]. Pores of the hydrophobic membrane are
partially filled with solvent, thus increasing the membrane
mass transfer resistance. Absorbed CO2 flux was divided
by 2 after 800 hours of operation with 30%wt
monoethanolamine (MEA) solution [15]. The overall mass
transfer resistance was increased by 21-53 % in the case of
pure CO2 absorption in water after some hours of operation
[29]. The compatibility of the solvent with the membrane
material is an essential selection criterion to limit this
phenomenon [30]. Current research on membrane
materials is addressing this wetting issue. The deposition
of a thin dense layer or the development of liquid-filled
membrane are potential solutions [13], [31]. Another
strategy consists in increasing the membrane
hydrophobicity by membrane surface treatment [32], [33].
The results from these previous studies indicate the
potentialities of hollow fiber membrane modules for
biogas upgrading using water as the absorbent. This paper
aims at experimentally optimizing the coupled
absorption/desorption process using a liquid closed-loop.
Experiments were run in a partial wet mode to account for
the membrane wetting limitation. The effects of operating
parameters (flowrates, pressure, inlet biogas composition)
have been studied through a Design of Experiments. From
these initial results, the influence of the membrane area at
the absorption step was tested in an open-loop
configuration. At last, a new process configuration
mimicking the intermediate flash tank from the WS
process with a methane recycling loop was suggested and
assessed.
Table I: Geometric features of the 2.5”x8” Extra-Flow
module
Parameter Value Source
External membrane surface 1.4 𝑚2 [34]
Inner radius of
the fiber bundle 𝑅𝑖
1.10× 10⁻² 𝑚
[34], [35]
Outer radius of
the fiber bundle 𝑅𝑜
2.32× 10⁻² 𝑚
[34]
Fiber length 0.203 𝑚 [34], [35]
Fiber effective length 𝑙𝑒𝑓𝑓 0.146 𝑚 [34]
Number of fibers 𝑁𝑓 10 200 [35]
Specific area 𝑎 4 089
𝑚2/𝑚3
Calculated
2 EXPERIMENTAL APPARATUS
2.1 Hollow fiber membranes and modules
The membrane module was selected from a range of
available industrial modules (Liqui-Cel® Extra-Flow) in
order to easier the foreseen process upscaling step. The
geometric features of the modules and the data on both
membrane types used in this study are respectively
presented in Table I and Table II. This module range is
built with a diverting baffle at its center to enhance the
mass transfer efficiency. As the liquid flows in the
shellside, the flow pattern is in between the counter-
current parallel flow and the cross-flow configurations.
The fiber bundle of the 2.5”x8” module is estimated at
10 200 fibers.
The X-50 fiber shows a higher porosity compared to
the X-40 type (40-45% against 20-25%) and a lower
thickness (80 µm against 100). These features are likely to
enhance the gas-liquid mass transfer. Thus, a X-50 module
is used for the absorption step. The X-40 type is selected
at the desorption step for its higher mechanical resistance:
it indeed faces a 13-fold higher transmembrane pressure.
Table II: Hollow fiber membrane data from manufacturer
Parameter X-40 X-50
Applications Degassing of
other gases
CO2
degassing
Material PP PP
Inner fiber diameter 200 µ𝑚 220 µ𝑚
External fiber
diameter 300 µ𝑚 300 µ𝑚
Porosity 20 − 25% 40 − 45%
Tortuosity 2 − 3 2 − 3
Average pore
diameter 0.03 µ𝑚 0.03 µ𝑚
Maximum liquid
operating pressure
(for 𝑇 < 40 °𝐶)
7.2 𝑏𝑎𝑟 𝑔 7.2 𝑏𝑎𝑟 𝑔
2.2 Experimental set-up for biogas upgrading
A modular set-up was designed to evaluate the biogas
upgrading process with different configurations. The
reference configuration used in the Design of Experiments
(DoE) is detailed in Figure I. Carbon dioxide from biogas
is dissolved into reverse osmosis water in the absorption
module. The CO2-rich liquid is then degassed by applying
a vacuum in the desorption module. Vacuum is preferred
to air stripping firstly to avoid air traces in the outlet
biomethane but also to produce a non-diluted offgas
stream. The vacuum pump (Vacuubrand MZ 2C NT
VARIO) establishes a pressure level in the range 50-500
mbar a.
The inlet gas flowrate and its composition are
controlled by a 2-way mixer equipped with mass flow
controllers (FC 41 and FC 42, Bronkhorst In-Flow CTA,
± (1 %RD + 1 %FS)). Pure gases (CO2, CH4 - Air Liquid
AlphaGaz 1 standard) were used to produce synthetic
mixtures. After CO2 removal, the outlet gas flowrate is
measured in another mass flow controller (FC 43,
Bronkhorst Low-ΔP-Flow, ± 1 %FS). The process gas
pressure is regulated with a PID controller connected to
the solenoid valve of the outlet mass flow controller. The
degassed gas flow, named offgas, is measured in a mass
flowmeter (Bronkhorst In-Flow CTA, ± (1 %RD + 1
%FS)). It takes about 5 minutes for the gas flows and
pressure to stabilize at their setpoints. As mass flowmeters
were calibrated using air, they require the use of corrective
factors depending on gas composition analysis which
induce an additional uncertainty ±2%.

Figure I: Process flow diagram for the reference process architecture
Gas composition are analysed at the inlet, biomethane
outlet and offgas outlet with an Agilent 490 micro Gas
Chromatography (micro-GC) equipped with a thermal
conductivity detector (TCD) detector. 𝑂2, 𝑁2 and 𝐶𝐻4 are
separated on a 10m Molsieve 5Å column while 𝐶𝑂2 is
separated on 10m PoraPLOT U. The micro-GC equipment
was combined with a flow-through selection valve (VICI
6-streams selector valve). The pressure of the biogas inlet
and biomethane outlet samples are regulated below 1 bar
g to comply with micro-GC specifications. 4 standard
gases are used for calibration. Due to the combination of
the error from the gas sampling system, the calibation
error, the analytical repeatability and the analytical
precision, the analytical error is estimated to ±0.3% 𝑣𝑜𝑙.. The liquid flow was operated in a closed-loop
configuration during DoE. Two pumps are respectively
regulating the pressure and the flowrate. They are
controlled by a pressure transmitter PT 11 and a vortex
flowmeter FI (Liqui-View) through frequency converters.
Liquid pH is measured in a flow-through fitting positioned
after CO2 absorption step (Mettler-Toledo InPro 4262i).
The DoE investigated the available operating
conditions range presented in Table III.
Table III: Range of the operating conditions
Operating
parameter Range Unit
𝐏𝐠 0 – 7 𝑏𝑎𝑟 𝑔
𝐐𝐂𝐎𝟐 74 – 739 𝑁𝐿. ℎ−1
𝐐𝐂𝐇𝟒 76 – 530 𝑁𝐿. ℎ−1
𝐏𝐥 0 – 8 𝑏𝑎𝑟 𝑔
Water flowrate 𝑸𝒍 30 – 240 𝐿. ℎ−1
2.3 Data treatment
Experimental results are compared according to two
key performance indicators: the biomethane quality 𝑦𝐶𝐻4
𝑜𝑢𝑡
and the methane recovery rate 𝑅𝐶𝐻4. The process is
evaluated in its steady state regime. Gas composition
analyses were performed 20 minutes after the process
parameters reached their setpoints. Similar stabilization
times are reported in the literature [17], [18]. A second gas
composition analysis was performed 15 minutes after the
first one to confirm the steady state regime had been
reached.
The methane recovery rate 𝑅𝐶𝐻4 can be derived from
inlet and outlet gas flowrates and compositions (Eq. 1).
𝑅𝐶𝐻4=
𝑄𝐶𝐻4
𝑜𝑢𝑡
𝑄𝐶𝐻4
𝑖𝑛=
𝑦𝐶𝐻4
𝑜𝑢𝑡𝑄𝑜𝑢𝑡
𝑦𝐶𝐻4
𝑖𝑛 𝑄𝑖𝑛 Eq. 1
Though, the uncertainties are stronger on the gas
flowrates than on the gas composition analysis. Therefore,
a method based on the composition of the three gas flows
was preferred. The combination of two mass balances
(total gas and methane only) leads to:
𝑅𝐶𝐻4=
𝑦𝐶𝐻4
𝑜𝑢𝑡
𝑦𝐶𝐻4
𝑖𝑛 (𝑦𝐶𝐻4
𝑖𝑛 − 𝑦𝐶𝐻4
𝑜𝑓𝑓)
(𝑦𝐶𝐻4
𝑜𝑢𝑡 − 𝑦𝐶𝐻4
𝑜𝑓𝑓) Eq. 2
The efficiency of the CO2 mass transfer is assessed for
the open-loop experiments. First, the logarithmic mean of
the transfer potential ∆𝑥𝑀𝐿 is calculated.
∆𝑥𝑀𝐿 =(𝑥𝑜𝑢𝑡,∗ − 𝑥𝑜𝑢𝑡) − (𝑥𝑖𝑛,∗ − 𝑥𝑖𝑛)
ln(𝑥𝑜𝑢𝑡,∗ − 𝑥𝑜𝑢𝑡) − ln(𝑥𝑖𝑛,∗ − 𝑥𝑖𝑛) Eq. 3
𝑥𝑜𝑢𝑡,∗ and 𝑥𝑖𝑛,∗ are derived from gas composition analysis
and values from Henry coefficients [36]. 𝑥𝑜𝑢𝑡 is calculated
by a CO2 mass balance over the absorption unit (Eq. 4).
𝑥𝑖𝑛 is reasonably assumed to be zero in the open-loop
configuration (initially gas-free inlet absorbent).
𝑥𝑜𝑢𝑡 =𝐺𝑖𝑛
𝐿𝑦𝐶𝑂2
𝑖𝑛 −𝐺𝑜𝑢𝑡
𝐿𝑦𝐶𝑂2
𝑜𝑢𝑡 Eq. 4
A constant liquid overall mass transfer coefficient 𝐾𝐿0
is then derived from experimental data. It is related to 𝐾𝐿
coefficient expressed in 𝑚. 𝑠−1 by Eq. 6.
𝐾𝐿0 =
𝐿(𝑥𝑜𝑢𝑡 − 𝑥𝑖𝑛)
𝑎 ∆𝑥𝑀𝐿 𝑆𝑍 Eq. 5
𝐾𝐿 =𝐾𝐿
0
𝑐𝑡𝑜𝑡𝑙
≅𝐾𝐿
0
𝑐𝐻2𝑂𝑙
Eq. 6
3 DESIGN OF EXPERIMENTS
3.1 Influence of process parameters
In a first approach, the process parameters and their
expected influence on the performances have been
summarized in Table IV. The flows 𝑄𝑔 and 𝑄𝑙 are the main
parameters of the gas-liquid absorption processes,
typically described by their ratio 𝑄𝑔 𝑄𝑙⁄ . The gas pressure

Table IV: Expected influence of process parameters
Parameter Influence 𝐲𝐂𝐇𝟒
𝐨𝐮𝐭 𝐑𝐂𝐇𝟒
𝑸𝒈 Increase the CO2 flow to be removed - +
𝑸𝒍 Increase the potential gas removal both for CO2 and CH4 + -
𝑷𝒈 Decrease the partition coefficient m, thus the liquid potential gas removal is increased + -
𝑷𝒍 Increase the membrane wetting and consequently the mass transfer resistance [37] - +
𝑷𝒗𝒂𝒄 The lower the pressure at desorption, the higher the mass transfer potential to
regenerate the absorbent
- +
𝑻𝒈 Influence of gas temperature is not known but likely not to be significant ? ?
𝑻𝒍 A lower temperature enhances the absorption capacity [36] + -
𝒚𝑪𝑯𝟒
𝒊𝒏 Lower the CO2 flow to be removed
Decrease the CO2 mass transfer potential (𝑥∗ − 𝑥)
+ -
at absorption 𝑃𝑔 and the liquid temperature Tl impact the
gas-liquid equilibrium (i.e. the partition coefficient m).
According to Henry’s law, the liquid pressure 𝑃l has no
impact on this equilibrium. Its impact on the gas
absorption process is found through the increase of
transmembrane pressure. Indeed, membrane wetting is a
limitation to mass transfer which is enhanced by a high
transmembrane pressure. A low vacuum level
𝑃𝑣𝑎𝑐 applied at the desorption step increases the mass
transfer potential. Therefore, a more efficient solvent
regeneration is expected.
The inlet gas composition 𝑦𝐶𝐻4
𝑖𝑛 necessarily impacts the
process performances. At industrial scale, the biogas
quality is an input parameter which depends on the
substrates and on the AD process.
Among the listed parameters, five are selected for
further investigation for their supposed influenced on the
biogas upgrading process: both gas and liquid flowrates
𝑄𝑔 and 𝑄𝑙, gas absorption and vacuum pressures 𝑃𝑔 and
𝑃𝑣𝑎𝑐, and inlet biogas composition 𝑦𝐶𝐻4
𝑖𝑛 .
3.2 Design of Experiments
The DoE methodology was adopted to compare the
relative influence of the process parameters and their
interactions in a range of operating conditions. Five
parameters were selected and three levels were defined to
investigate the quadratic influences and interactions
(Table V). The temperature of the absorbent was measured
but not regulated (Tl = 25°𝐶 ± 3°𝐶). Biomethane quality
𝑦𝐶𝐻4
𝑜𝑢𝑡 was the selected process response for its low
uncertainty (±0.3% 𝑣𝑜𝑙.). A central composite design was used to reduce the
number of experiments (243 tests initially). The central
composite design is divided in 3 matrix:
- A factorial design with 2 levels (-1 and +1): 32 tests;
- A series of tests at the center of the domain: 𝑁0
tests;
- A series of tests on the axis of the domain (-θ and +θ
for each parameter): 10 tests.
The value of θ=2.378 is chosen from tabulated values
to satisfy the optimality criteria: rotability, orthogonality
and uniform precision. The criteria of orthogonality and
uniform precision cannot be satisfied at the same time.
Therefore, the design is qualified of quasi-orthogonal.
For a given number of parameters (here k = 5), the
number of tests 𝑁0 at the center of the domain is defined
according to the criterion that must be satisfied (17 and 10
respectively for orthogonality and uniform precision
criteria). In practice, 15 tests were performed at the center
of the domain.
3.3 Statistical processing
A quadratic model with interactions was used to
interpret the experimental data. Three models are
successively constructed in a MATLAB program:
- Model1 which is the raw model with all the
coefficients considered;
- Model2 which is model1 with only the same
significant coefficients conserved;
- Model3 which is an optimization of the coefficients
with the significant parameters only.
To determine whether the effect of the parameter is
significant, the ratio of its effect 𝑎𝑃𝑖 against the model
standard error 𝑠𝑚𝑜𝑑𝑒𝑙 is compared to a Student law
coefficient with 𝑁 – 𝐶 degrees of freedom (N number of
experiments, C number of coefficients in the model).
|𝑎𝑃𝑖
𝑠𝑚𝑜𝑑𝑒𝑙| > 𝑡1−𝛼 2⁄ ,(𝑁 – 𝐶)
𝑠𝑡𝑢𝑑𝑒𝑛𝑡 Eq. 7
The value of α determines the confidence interval.
𝛼 = 0.05 is a typical choice which describes the
confidence interval at 95 %.
The same student coefficient and the mean squared
error 𝜎𝑚𝑜𝑑𝑒𝑙 determines the precision of the model 𝑃𝑚𝑜𝑑𝑒𝑙
by:
𝑃𝑚𝑜𝑑𝑒𝑙 = 𝑡1−𝛼 2⁄ ,(𝑁 – 𝐶)𝑠𝑡𝑢𝑑𝑒𝑛𝑡 . √𝜎𝑚𝑜𝑑𝑒𝑙 Eq. 8
3.4 Data rejection
The tests have been performed at different time
periods by two different operators, with membranes
subject to degradation. To perform an efficient statistical
analysis, systematic mass balances (total gas, methane and
carbon dioxide) have tested the result consistency. The
mass balance errors were calculated according to:
𝜀𝑡𝑜𝑡 =𝑄𝑜𝑢𝑡 + 𝑄𝑜𝑓𝑓 − 𝑄𝑖𝑛
𝑄𝑖𝑛 Eq. 9
𝜀𝑖 =𝑦𝑖
𝑜𝑢𝑡𝑄𝑜𝑢𝑡 + 𝑦𝑖𝑜𝑓𝑓
𝑄𝑜𝑓𝑓 − 𝑦𝑖𝑖𝑛𝑄𝑖𝑛
𝑦𝑖𝑖𝑛𝑄𝑖𝑛
Eq. 10
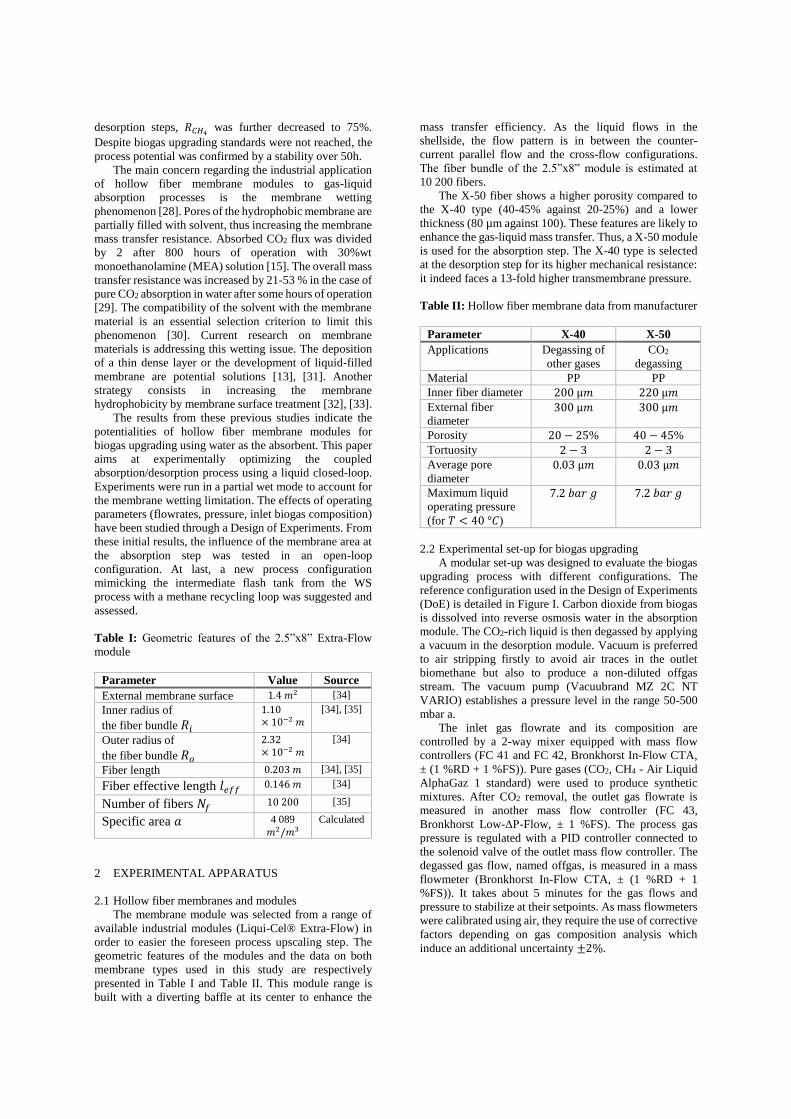
Most of the experiments display a very good mass
balance (𝜀 < 5%) for the three indicators (Figure II). In
such a process, a 15% error can even be considered
admissible. As a general trend, the CH4 and CO2 errors
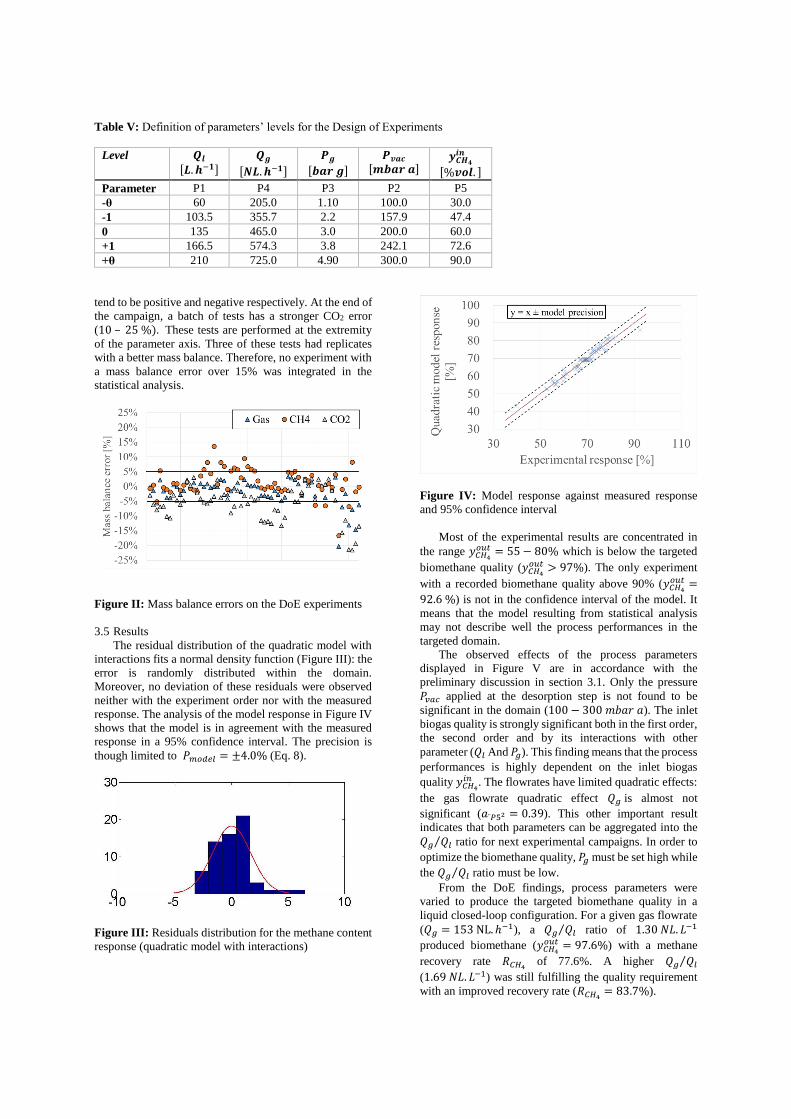
Table V: Definition of parameters’ levels for the Design of Experiments
Level 𝑸𝒍
[𝑳. 𝒉−𝟏] 𝑸𝒈
[𝑵𝑳. 𝒉−𝟏]
𝑷𝒈
[𝒃𝒂𝒓 𝒈]
𝑷𝒗𝒂𝒄
[𝒎𝒃𝒂𝒓 𝒂] 𝒚𝑪𝑯𝟒
𝒊𝒏
[%𝒗𝒐𝒍. ]
Parameter P1 P4 P3 P2 P5
-θ 60 205.0 1.10 100.0 30.0
-1 103.5 355.7 2.2 157.9 47.4
0 135 465.0 3.0 200.0 60.0
+1 166.5 574.3 3.8 242.1 72.6
+θ 210 725.0 4.90 300.0 90.0
tend to be positive and negative respectively. At the end of
the campaign, a batch of tests has a stronger CO2 error
(10 – 25 %). These tests are performed at the extremity
of the parameter axis. Three of these tests had replicates
with a better mass balance. Therefore, no experiment with
a mass balance error over 15% was integrated in the
statistical analysis.
Figure II: Mass balance errors on the DoE experiments
3.5 Results
The residual distribution of the quadratic model with
interactions fits a normal density function (Figure III): the
error is randomly distributed within the domain.
Moreover, no deviation of these residuals were observed
neither with the experiment order nor with the measured
response. The analysis of the model response in Figure IV
shows that the model is in agreement with the measured
response in a 95% confidence interval. The precision is
though limited to 𝑃𝑚𝑜𝑑𝑒𝑙 = ±4.0% (Eq. 8).
Figure III: Residuals distribution for the methane content
response (quadratic model with interactions)
Figure IV: Model response against measured response
and 95% confidence interval
Most of the experimental results are concentrated in
the range 𝑦𝐶𝐻4
𝑜𝑢𝑡 = 55 − 80% which is below the targeted
biomethane quality (𝑦𝐶𝐻4
𝑜𝑢𝑡 > 97%). The only experiment
with a recorded biomethane quality above 90% (𝑦𝐶𝐻4
𝑜𝑢𝑡 =
92.6 %) is not in the confidence interval of the model. It
means that the model resulting from statistical analysis
may not describe well the process performances in the
targeted domain.
The observed effects of the process parameters
displayed in Figure V are in accordance with the
preliminary discussion in section 3.1. Only the pressure
𝑃𝑣𝑎𝑐 applied at the desorption step is not found to be
significant in the domain (100 − 300 𝑚𝑏𝑎𝑟 𝑎). The inlet
biogas quality is strongly significant both in the first order,
the second order and by its interactions with other
parameter (𝑄𝑙 And 𝑃𝑔). This finding means that the process
performances is highly dependent on the inlet biogas
quality 𝑦𝐶𝐻4
𝑖𝑛 . The flowrates have limited quadratic effects:
the gas flowrate quadratic effect 𝑄𝑔 is almost not
significant (𝑎¨𝑃52 = 0.39). This other important result
indicates that both parameters can be aggregated into the
𝑄𝑔 𝑄𝑙⁄ ratio for next experimental campaigns. In order to
optimize the biomethane quality, 𝑃𝑔 must be set high while
the 𝑄𝑔 𝑄𝑙⁄ ratio must be low.
From the DoE findings, process parameters were
varied to produce the targeted biomethane quality in a
liquid closed-loop configuration. For a given gas flowrate
(𝑄𝑔 = 153 NL. ℎ−1), a 𝑄𝑔 𝑄𝑙⁄ ratio of 1.30 𝑁𝐿. 𝐿−1
produced biomethane (𝑦𝐶𝐻4
𝑜𝑢𝑡 = 97.6%) with a methane
recovery rate 𝑅𝐶𝐻4 of 77.6%. A higher 𝑄𝑔 𝑄𝑙⁄
(1.69 𝑁𝐿. 𝐿−1) was still fulfilling the quality requirement
with an improved recovery rate (𝑅𝐶𝐻4= 83.7%).

Figure V: First order effects and significant second order
parameters from the quadratic model
The recovery rate are still low compared to the
available technologies which allow to recover more than
97% of the inlet methane flow [4], [5]. Nonetheless, this
experimental set-up produces on one side a methane-rich
fraction which can be injected into the gas grid, and on the
other side a CO2-rich fraction. Compared to other available
technologies, this offgas flow is not diluted in an air flow
(as for air stripping) and still contain a significant methane
fraction (respectively 𝑦𝐶𝐻4
𝑜𝑓𝑓= 25.3 𝑎𝑛𝑑 20.0%). This
methane content is high enough to burn this offgas flow in
a low calorific burner and cover the digester heat demand.
This process point is thus a first proof-of-concept for a
biogas upgrading process of industrial interest.
4 STRATEGIES FOR PROCESS IMPROVEMENT
4.1 Limitation in the DoE experiments
The DoE confirmed the gas-to-liquid ratio to be a
significant parameter to adjust the process performances.
To further investigate the role of this aggregated
parameter, the response of the DoE model was plotted
against the performances of an ideal mass transfer
exchanger (liquid outlet at equilibrium with inlet biogas)
in Figure VI. The inlet biogas composition was set to a
typical biogas composition (𝑦𝐶𝐻4
𝑖𝑛 = 60%) and the
absorption pressure was maximised to 𝑃𝑔 = 5 𝑏𝑎𝑟 𝑔 in
order to improve the biomethane quality.
Figure VI: Influence of 𝑄𝑔 𝑄𝑙⁄ ratio on the biomethane
quality: comparison of the DoE quadratic model with ideal
exchanger performances
DoE model is applied with 𝑄𝑔 = 205 𝑁𝐿. ℎ−1
In an ideal exchanger, a decrease in the water
temperature improves the absorption performance. It is a
way towards process intensification. Under 𝑇𝑙 = 20°𝐶, a
theoretical 𝑄𝑔 𝑄𝑙⁄ ratio of 5.29 𝑁𝐿. 𝐿−1 is needed to obtain
a 97% quality biomethane. The DoE model built from
experimental data reaches 90% biomethane quality only
for ratios below 1.10 𝑁𝐿. 𝐿−1. It is well below the
performances of an ideal exchanger.
Two hypothesis are possible explanations to this
observation. Firstly, the process was operating in a closed-
loop configuration. As a result, the inlet absorbent may not
be fully regenerated before entering the absorption
module. On the contrary, the ideal exchanger curves
suppose that the inlet liquid is free of dissolved gases. The
second assumption is that the experimental set-up used in
the DoE campaign (i.e. a X-50 absorption module) is
limited by mass transfer and therefore cannot meet the
performances of an ideal exchanger. An increase of the
exchange surface would improve the process
performances. The second hypothesis is tested in the
following paragraph.
4.2 Influence of the absorption surface
According to the transfer unit methods, a longer
exchanger leads to an improved biomethane quality.
Therefore, two membranes modules were set in series to
double the exchange surface and test the mass transfer
limitation hypothesis. An open-loop configuration was set
to avoid the question of the desorption efficiency.
The biomethane quality increases by 10-15 points
when the exchange surface is doubled (Figure VII) but
conserves the dependency on the 𝑄𝑔 𝑄𝑙⁄ ratio. These
results are compared to simulated results from a 1D model
describing both CO2 and CH4 absorption. The constant
overall mass transfer coefficient 𝐾𝐿 is an adjustable
parameter of the 1D model. The adjusted 𝐾𝐿 is not constant
between the two series but still in the same range (1.9 ×10⁻⁵ 𝑚. 𝑠−1 and 2.5 × 10⁻⁵ 𝑚. 𝑠−1 respectively for one
and two membrane modules).
Figure VII: Comparison of biomethane quality at
different 𝑄𝑔 𝑄𝑙⁄ ratio with one or two membrane modules
Open-loop configuration
The adjusted values of the model are consistent with
the overall mass transfer coefficient derived from the
calculation of the average mass transfer potential by Eq. 5
(Table VI). The overall mass transfer coefficient relative
to the gas phase is very slightly below literature values
(2.4 − 4.0 10−5𝑚. 𝑠−1 as reported by Lu [38]). 𝐾𝐿 is
constant for the 1-module serie (2.02 ±0.07 10−5𝑚. 𝑠−1). It slightly increases during the 2-
module serie and a higher standard deviation is observed
(2.80 ± 0.19 10−5𝑚. 𝑠−1).
The increase of the membrane area could improve the
biomethane composition. Though, simulations from the
1D model indicates that 7 membrane modules in series

Table VI: Overall mass transfer coefficients calculated from experimental data
N modules 𝑸𝒍
[𝑳. 𝒉−𝟏] 𝑸𝒈/𝑸𝒍
[𝑵𝑳. 𝑳−𝟏]
𝑷𝒈
[𝒃𝒂𝒓 𝒈] 𝒚𝑪𝑯𝟒
𝒊𝒏
[%𝒗𝒐𝒍. ]
𝐊 𝑳
[𝟏𝟎−𝟓𝒎. 𝒔−𝟏]
𝐊 𝑮
[𝟏𝟎−𝟓𝒎. 𝒔−𝟏]
1 210 0.7 5.0 60.1 2.02 1.85
210 1.0 5.0 60.0 2.02 1.85
210 1.7 5.0 59.8 1.96 1.80
210 2.5 5.0 59.9 1.94 1.78
210 3.2 5.0 60.0 1.99 1.80
210 4.0 5.0 60.0 2.15 1.92
2 210 2.5 5.0 59.8 2.58 2.38
210 3.2 5.0 60.3 3.03 2.73
210 4.0 5.0 60.0 2.81 2.59
are required to reach the targeted biomethane quality
(𝑦𝐶𝐻4
𝑜𝑢𝑡 > 97%) under 𝑄𝑔 𝑄𝑙⁄ = 4.0 𝑁𝐿. 𝐿−1. This ratio
was chosen to be slightly below the ratio needed in the
case of an ideal mass exchanger (Figure VI). Moreover,
the inlet liquid is supposed to be free from dissolved gas
content.
The important number of modules is explained by
a reduced average absorbed CO2 flux 𝐽𝐶𝑂2. Figure VIII
shows that this flux is reduced by 20 % from the 1-
module serie to the 2-module serie. In the second
module, CO2 has already been largely removed from
the gas flow and therefore the mass transfer potential is
lower than in the 1-module serie. In the membrane-wet
regime, similar fluxes were reported for the absorption
of pure CO2 under atmospheric pressure in water (0.9 −1.4 10−3 𝑚𝑜𝑙. 𝑚2. 𝑠−1) [29].
Figure VIII: Absorbed CO2 flux at different 𝑄𝑔 𝑄𝑙⁄ ratio
with one or two membrane modules
Open-loop configuration
4.3 Addition of a methane recycling loop
The impact of the 𝑄𝑔 𝑄𝑙⁄ ratio was highlighted both
from DoE findings and from Figure VII. The biomethane
quality is improved with a lower 𝑄𝑔 𝑄𝑙⁄ ratio: it reaches
𝑦𝐶𝐻4
𝑜𝑢𝑡 = 94.6% under 𝑄𝑔 𝑄𝑙 = 1.00 𝑁𝐿. 𝐿−1⁄ . In the
meantime, the methane recovery rate decreases (𝑅𝐶𝐻4=
84.2% under 𝑄𝑔 𝑄𝑙 = 1.00 𝑁𝐿. 𝐿−1⁄ ). A new process
arrangement is suggested and assessed to minimize this
methane slip.
Commercial biogas water scrubbers are designed with
an intermediate step for the regeneration of the CO2-rich
solvent. A flash-tank is set to decrease the pressure at an
intermediate level in order to recycle part of the dissolved
methane content [6]. A new membrane contactor was
therefore added in the liquid closed-loop to mimic this
architecture (Figure IX).
Figure IX: Simplified closed-loop configuration with
methane recycling loop
The process performances were compared against the
results obtained in the reference architecture (Figure I)
under the same operating conditions. The recycled flow
was controlled by a needle valve to investigate the
influence of the gas pressure in the intermediate membrane
contactor. The biomethane quality was maintained
constant (𝑦𝐶𝐻4
𝑜𝑢𝑡 = 95.5 − 95.9%) and comparable to the
methane content obtained in the reference case (Figure X).
By progressively closing the needle valve, the
intermediate gas pressure 𝑃𝑖𝑛𝑡 increased from 0.25 to
1.9 𝑏𝑎𝑟 𝑔. It increased the methane content in the recycled
gas flow 𝑦𝐶𝐻4
𝑟𝑒𝑐 from 57.2 to 76.9 %.
Figure X: Addition of methane recycling loop: influence
of intermediate gas pressure
The methane recovery rate 𝑅𝐶𝐻4 was calculated by Eq.
2 assuming that the recycled gas flow would be mixed with
process inlet biogas flow. Indeed, the methane content in
the recycled gas flow would not significantly affect the
inlet biogas quality (𝑦𝐶𝐻4
𝑖𝑛 = 60%). 𝑅𝐶𝐻4thus decreased
from 93.5 to 88.5% with the increase of 𝑃𝑖𝑛𝑡. As 𝑃𝑖𝑛𝑡
increases, the recycled gas flow

Table VII: Overall mass transfer coefficients calculated from experimental data
Reference configuration
Biogas 𝑸𝒍
[𝑳. 𝒉−𝟏] 𝑸𝒈/𝑸𝒍
[𝑵𝑳. 𝑳−𝟏]
𝑷𝒈
[𝒃𝒂𝒓 𝒈]
𝐓 𝐥 [°𝑪]
𝒚𝑪𝑯𝟒
𝒊𝒏
[%𝒗𝒐𝒍. ]
𝒚𝒂𝒊𝒓𝒊𝒏
[%𝒗𝒐𝒍. ]
𝐊 𝑳
[𝟏𝟎−𝟓𝒎. 𝒔−𝟏] 𝒚𝑪𝑯𝟒
𝒐𝒖𝒕
[%𝒗𝒐𝒍. ]
𝐑 𝐂𝐇𝟒
[%]
Synth. 120 1.30 5.0 27.0 59.5 0.0 2.62 97.6 77.6
90 1.69 5.0 26.7 59.7 0.0 2.85 97.2 83.7
Raw 210 1.09 4.5 16.3 59.0 1.8 3.07 94.3 83.9
210 1.09 4.5 16.2 58.0 0.8 2.92 96.2 82.8
is reduced, resulting in an increased methane slip at the
desorption step. Completely closing the intermediate
needle valve would stop the methane recycling and the
process configuration would be similar to the reference
case (𝑅𝐶𝐻4= 83%).
The best process performances (𝑦𝐶𝐻4
𝑜𝑢𝑡 = 95.9% /
𝑅𝐶𝐻4= 93.5%) were obtained at low intermediate
pressure 𝑃𝑖𝑛𝑡 = 0.25 𝑏𝑎𝑟 𝑔. The corresponding overall
mass transfer coefficient is slightly below previous results
in reference configuration (2.53 × 10⁻⁵ 𝑚. 𝑠−1). It
indicates that the addition of the recycling loop mainly
impacts the methane mass transfer.
4.4 On-site experimental campaign with farm biogas
These results obtained with synthetic biogas had to be
confirmed during an on-site experimental campaign to
upgrade real raw biogas. The farm AD unit co-digests cow
slurry with agroindustrial waste (beet pulp, brewing
dregs…), crop residues or grass silage. A by-pass flow is
diverted from the average 30 𝑁𝑚𝑏𝑖𝑜𝑔𝑎𝑠3 . ℎ−1 flow to be
upgraded in the pilot process. During the 2-week field
campaign, the methane content was stable (𝑦𝐶𝐻4
𝑖𝑛 = 56.3 −
59.0%). An air injection inside the digester maintains the
𝐻2𝑆 content low (< 200 𝑝𝑝𝑚𝑣) by sulfur oxidation.
Though this air injection results in the presence of nitrogen
and oxygen in the biogas flow (1.7 − 2%). This air
injection was stopped during 3 days for the experimental
campaign purpose.
From the previous values of 𝐾𝐿, this experimental
campaign was operated with a higher inlet biogas flowrate
(𝑄𝑔 = 229 NL. ℎ−1) to intensify the pilot process to its
maximum. In addition, due to biogas compressor
limitations, the absorption pressure 𝑃𝑔 was set only to
4.5 𝑏𝑎𝑟 𝑔. The 97% biomethane quality was almost
reached with a 𝑄𝑔 𝑄𝑙⁄ ratio of 1.09 𝑁𝐿. 𝐿−1 (Table VII).
The same experimental process point was repeated with a
lower inlet air content. The biomethane quality was thus
increased from 94.3 to 96.2 %. Similar biogas upgrading performances were achieved
in the reference architecture both with synthetic and raw
farm biogas. The process displayed similar average mass
transfer coefficients with synthetic biogas and real biogas
(2.62 − 2.85 × 10⁻⁵ 𝑚. 𝑠−1 against 2.92 − 3.07 ×10⁻⁵ 𝑚. 𝑠−1). The slight increase may be due to an
increased liquid flowrate during farm experiments.
Therefore, it is reasonable to assume that the process
optimization can be carried out using synthetic biogas at
the lab for the sake of convenience.
Moreover, within the 2 weeks, no significant
performance degradation was observed. Therefore, the
exposure of the membrane material is not extremely
sensitive to the presence of biogas impurities (like 𝐻2𝑆 or
volatile organic compounds). The polymer compatibility
with these impurities must be carefully study for future
industrial developments.
5 CONCLUSION
The use of membrane contactors for biogas upgrading
purposes was optimized in an absorption/desorption cycle
with a liquid closed-loop. The reference process
configuration with equivalent membrane areas for the
absorption and desorption steps was optimized by a
Design of Experiments. A high biomethane purity (𝑦𝐶𝐻4
𝑜𝑢𝑡 =
97.6%) was obtained with an improved methane recovery
rate compared to previous reported results (𝑅𝐶𝐻4= 83.7%
against 75%). This moderate recovery rate is a first
process point of interest as the calorific content of the non-
diluted offgas flow (𝑦𝐶𝐻4
𝑜𝑓𝑓= 20.0 − 25.3%) may be used
to cover the digester heating demand in a low calorific
burner. Doubling the membrane area at the absorption step
proved that a significant number of modules (7) are needed
to approach an ideal mass exchanger under conditions
𝑄𝑔 𝑄𝑙⁄ = 4.0 𝑁𝐿. 𝐿−1 close to the theoretically optimized
flowrates ratio. An alternative process arrangement
mimicking the conventional WS methane recycling loop
revealed a significant improvement of the methane
recovery rate without affecting the biomethane quality
(𝑦𝐶𝐻4
𝑜𝑢𝑡 = 95.9% / 𝑅𝐶𝐻4= 93.5%). This second process
point is a very promising result to combine the advantages
of membrane contactors and WS into an innovative biogas
upgrading process. Additional studies are required to
optimize the membrane area ratio between the absorption,
partial and final degassing steps (set to 1:1:1 in the present
study) and to meet the performances of available biogas
upgrading technologies.
6 REFERENCES
[1] A. Wellinger, J. Murphy, and D. Baxter, The biogas
handbook - Science, production and applications.
Woodhead Publishing, 2013.
[2] M. Pöschl, S. Ward, and P. Owende, ‘Evaluation of
energy efficiency of various biogas production and
utilization pathways’, Appl. Energy, vol. 87, no. 11,
pp. 3305–3321, Nov. 2010.
[3] W. M. Budzianowski and M. Brodacka, ‘Biomethane
storage: Evaluation of technologies, end uses,
business models, and sustainability’, Energy
Convers. Manag., Aug. 2016.
[4] L. Yang, X. Ge, C. Wan, F. Yu, and Y. Li, ‘Progress
and perspectives in converting biogas to
transportation fuels’, Renew. Sustain. Energy Rev.,
vol. 40, pp. 1133–1152, Dec. 2014.
[5] F. Bauer, C. Hulteberg, T. Persson, and D. Tamm,
‘Biogas upgrading - Review of commercial
technologies’, 2013.

[6] Y. Xiao et al., ‘CO2 Removal from Biogas by Water
Washing System’, Chin. J. Chem. Eng., vol. 22, no.
8, pp. 950–953, Aug. 2014.
[7] P. Rotunno, A. Lanzini, and P. Leone, ‘Energy and
economic analysis of a water scrubbing based biogas
upgrading process for biomethane injection into the
gas grid or use as transportation fuel’, Renew.
Energy, vol. 102, pp. 417–432, Mar. 2017.
[8] D. Benizri, ‘Epuration du biogaz à la ferme :
EPUROGAS, une solution énergétique et
économique d’avenir. - Etude expérimentale et
modélisation d’un procédé d’absorption de dioxyde
de carbone avec de l’eau sous pression à une échelle
industrielle -’, Université de Toulouse, 2016.
[9] D. Thrän, ‘European biomethane potentials’, in
Workshop on Biomethane Trade, 2012, vol. 21, p.
2012.
[10] COWI, ‘State of the Art on Alternative Fuels
Transport Systems in the European Union’,
European Commission, Jul. 2015.
[11] AEBIOM, ‘A Biogas Roadmap for Europe’,
European Biomass Association, Brussels, Oct. 2009.
[12] P. Luis, B. Van der Bruggen, and T. Van Gerven,
‘Non-dispersive absorption for CO2 capture: from
the laboratory to industry’, J. Chem. Technol.
Biotechnol., vol. 86, no. 6, pp. 769–775, Jun. 2011.
[13] S. Zhao et al., ‘Status and progress of membrane
contactors in post-combustion carbon capture: A
state-of-the-art review of new developments’, J.
Membr. Sci., vol. 511, pp. 180–206, Aug. 2016.
[14] E. Chabanon, B. Belaissaoui, and E. Favre, ‘Gas–
liquid separation processes based on physical
solvents: opportunities for membranes’, J. Membr.
Sci., vol. 459, pp. 52–61, Jun. 2014.
[15] E. Chabanon, D. Roizard, and E. Favre, ‘Membrane
Contactors for Postcombustion Carbon Dioxide
Capture: A Comparative Study of Wetting
Resistance on Long Time Scales’, Ind. Eng. Chem.
Res., vol. 50, no. 13, pp. 8237–8244, Jul. 2011.
[16] L. Gomez-Coma, A. Garea, and A. Irabien, ‘Carbon
dioxide capture by [emim][Ac] ionic liquid in a
polysulfone hollow fiber membrane contactor’, Int.
J. Greenh. Gas Control, vol. 52, pp. 401–409, Sep.
2016.
[17] A. McLeod, B. Jefferson, and E. J. McAdam,
‘Quantifying the loss of methane through secondary
gas mass transport (or “slip”) from a micro-porous
membrane contactor applied to biogas upgrading’,
Water Res., vol. 47, no. 11, pp. 3688–3695, Jul. 2013.
[18] S.-J. Kim, A. Park, S.-E. Nam, Y.-I. Park, and P. S.
Lee, ‘Practical designs of membrane contactors and
their performances in CO2/CH4 separation’, Chem.
Eng. Sci., vol. 155, pp. 239–247, Nov. 2016.
[19] A. McLeod, B. Jefferson, and E. J. McAdam, ‘Biogas
upgrading by chemical absorption using ammonia
rich absorbents derived from wastewater’, Water
Res., vol. 67, pp. 175–186, Dec. 2014.
[20] W. Rongwong, S. Boributh, S. Assabumrungrat, N.
Laosiripojana, and R. Jiraratananon, ‘Simultaneous
absorption of CO2 and H2S from biogas by capillary
membrane contactor’, J. Membr. Sci., vol. 392–393,
pp. 38–47, Mar. 2012.
[21] S. Atchariyawut, R. Jiraratananon, and R. Wang,
‘Separation of CO2 from CH4 by using gas–liquid
membrane contacting process’, J. Membr. Sci., vol.
304, no. 1–2, pp. 163–172, Nov. 2007.
[22] S. A. M. Marzouk, M. H. Al-Marzouqi, M. H. El-
Naas, N. Abdullatif, and Z. M. Ismail, ‘Removal of
carbon dioxide from pressurized CO2–CH4 gas
mixture using hollow fiber membrane contactors’, J.
Membr. Sci., vol. 351, no. 1–2, pp. 21–27, Apr. 2010.
[23] S. A. M. Marzouk, M. H. Al-Marzouqi, M.
Teramoto, N. Abdullatif, and Z. M. Ismail,
‘Simultaneous removal of CO2 and H2S from
pressurized CO2–H2S–CH4 gas mixture using
hollow fiber membrane contactors’, Sep. Purif.
Technol., vol. 86, pp. 88–97, Feb. 2012.
[24] N. A. Rahim, N. Ghasem, and M. Al-Marzouqi,
‘Absorption of CO2 from natural gas using different
amino acid salt solutions and regeneration using
hollow fiber membrane contactors’, J. Nat. Gas Sci.
Eng., vol. 26, pp. 108–117, Sep. 2015.
[25] V. Fougerit, V. Pozzobon, D. Pareau, M.-A.
Théoleyre, and M. Stambouli, ‘Gas-liquid absorption
in industrial cross-flow membrane contactors:
Experimental and numerical investigation of the
influence of transmembrane pressure on partial
wetting’, Chem. Eng. Sci., Mar. 2017.
[26] A. Mansourizadeh, ‘Experimental study of CO2
absorption/stripping via PVDF hollow fiber
membrane contactor’, Chem. Eng. Res. Des., vol. 90,
no. 4, pp. 555–562, Apr. 2012.
[27] V. Teplyakov, A. Okunev, and N. Laguntsov,
‘Computer design of recycle membrane contactor
systems for gas separation’, Sep. Purif. Technol., vol.
57, no. 3, pp. 450–454, Nov. 2007.
[28] H. Kreulen, C. A. Smolders, G. F. Versteeg, and W.
P. M. van Swaaij, ‘Determination of mass transfer
rates in wetted and non-wetted microporous
membranes’, Chem. Eng. Sci, vol. 48, no. 11, pp.
2093–2102, 1993.
[29] M. Mavroudi, S. P. Kaldis, and G. P.
Sakellaropoulos, ‘A study of mass transfer resistance
in membrane gas–liquid contacting processes’, J.
Membr. Sci., vol. 272, no. 1–2, pp. 103–115, Mar.
2006.
[30] S. Mosadegh-Sedghi, D. Rodrigue, J. Brisson, and
M. C. Iliuta, ‘Wetting phenomenon in membrane
contactors – Causes and prevention’, J. Membr. Sci.,
vol. 452, pp. 332–353, Feb. 2014.
[31] L. Gomez-Coma et al., ‘Membrane modules for CO2
capture based on PVDF hollow fibers with ionic
liquids immobilized’, J. Membr. Sci., vol. 498, pp.
218–226, Jan. 2016.
[32] M. A. Abdulhameed et al., ‘Carbon dioxide capture
using a superhydrophobic ceramic hollow fibre
membrane for gas-liquid contacting process’, J.
Clean. Prod., vol. 140, pp. 1731–1738, Jan. 2017.
[33] H. J. Lee and J. H. Park, ‘Effect of hydrophobic
modification on carbon dioxide absorption using
porous alumina (Al2O3) hollow fiber membrane
contactor’, J. Membr. Sci., vol. 518, pp. 79–87, Nov.
2016.
[34] A. Dupuy, ‘Stabilisation de l’inerface liquide-liquide
dans un contacteur membranaire : application à
l’extraction sélective de terpènes oxygénés d’huiles
essentielles d’agrumes’, AgroParisTech, 2010.
[35] A. Sengupta, P. A. Peterson, B. D. Miller, J.
Schneider, and C. W. Fulk Jr, ‘Large-scale
application of membrane contactors for gas transfer
from or to ultrapure water’, Sep. Purif. Technol., vol.
14, no. 1, pp. 189–200, 1998.

[36] R. Sander, ‘Compilation of Henry’s law constants,
version 3.99’, Atmospheric Chem. Phys. Discuss.,
vol. 14, no. 21, pp. 29615–30521, Nov. 2014.
[37] J.-G. Lu, Y.-F. Zheng, and M.-D. Cheng, ‘Wetting
mechanism in mass transfer process of hydrophobic
membrane gas absorption’, J. Membr. Sci., vol. 308,
no. 1–2, pp. 180–190, Feb. 2008.
[38] J.-G. Lu, Y.-F. Zheng, and M.-D. Cheng, ‘Membrane
contactor for CO2 absorption applying amino-acid
salt solutions’, Desalination, vol. 249, no. 2, pp. 498–
502, Dec. 2009.
7 ACKNOWLEDGEMENTS
This work was financially supported by the
Marne departmental council, the Champagne-
Ardenne regional council and Reims Metropole
through the Biotechnology Chair of
CentraleSupelec.
Recommended