Evaluation of Renal Function: A Comparison Between Camera-BasedTc-99m MAG3 and 24-Hour Creatinine Clearances
Fabio P Esteves, MD: Department of Radiology, Division of Nuclear Medicine, EmoryUniversity Hospital, Atlanta, GARaghuveer K Halkar, MD: Department of Radiology, Division of Nuclear Medicine,Emory University School of Medicine and Veterans Affairs Medical Center, Atlanta, GAMuta M. Issa, MD, MBA: Department of Urology, Emory University School of Medicineand Veterans Affairs Medical Center, Atlanta, GASandra Grant, CNMT: Nuclear Medicine Service, Veterans Affairs Medical Center,Atlanta, GAAndrew Taylor, MD: Department of Radiology, Division of Nuclear Medicine, EmoryUniversity School of Medicine and Veterans Affairs Medical Center, Atlanta, GA
Department of Radiology, Division of Nuclear Medicine, Emory University School ofMedicine and Veterans Affairs Medical Center, Atlanta, GA
Emory University HospitalDepartment of Radiology, Division of Nuclear Medicine1364 Clifton Road N.E.Atlanta, GA 30322
Acknowledgements: The authors would like to acknowledge ROI LMN07595 for supportof this research.
Corresponding Author: Andrew Taylor, M.D.Emory University HospitalDepartment of Radiology, Division of Nuclear Medicine1364 Clifton Road N.E.Atlanta, GA 30322Phone: 404-727-4852Fax: 404-327-6685E-mail: [email protected]
Major Paper
Evaluation of Renal Function: A Comparison Between Camera-BasedTc-99m MAG3 and 24-Hour Creatinine Clearances
ABSTRACT
OBJECTIVE: The 24-hour creatinine clearance is the standard clinical technique to
measure renal function; however, this measurement is cumbersome and inconvenient for
patients. We hypothesized that a camera-based Tc-99m mercaptoacetyltriglycine
(MAG3) clearance obtained simultaneously with a standard MAG3 scan would correlate
well with the 24-hour creatinine clearance and could serve as a simple marker of renal
function.
MATERIALS AND METHODS: Data were obtained from a retrospective analysis of
28 patients with varying degrees of renal dysfunction and 85 subjects evaluated for
kidney donation. The MAG3 clearance was calculated using a camera-based technique
without blood or urine sampling. The creatinine clearance was measured using the
plasma creatinine and a 24-hour urine collection. The MAG3 and creatinine clearances
were corrected for body surface area and values in normal subjects and patients were
compared using paired T-test analysis. The linear association between the MAG3 and
creatinine clearances was expressed by Pearson’s correlation coefficient.
RESULTS: The mean MAG3 clearance in the potential renal donors was 321 95
ml/min (95% C.I. 171-546 ml/min), significantly higher than the mean creatinine
clearance of 152 51 ml/min (95% C.I. 79-278 ml/min, p<0.001). The mean MAG3
clearance in patients was 15370 ml/min (95% C.I. 32-316 ml/min) and was also
significantly higher than the mean creatinine clearance of 74 36 ml/min (95% C.I. 21-
138 ml/min, p<0.001). The ratio of the mean creatinine clearance to the mean MAG3
clearance was essentially the same for volunteers and patients, 0.47 and 0.48,
1

respectively. The Pearson’s correlation between the MAG3 and creatinine clearances
was 0.80 (95% C.I. 0.72-0.86).
CONCLUSION: The camera-based Tc-99m MAG3 clearance correlates well with the
24-hour creatinine clearance and can provide a simple and convenient index of renal
function.
Key Words: renal scan, renal function, MAG3 clearance, creatinine clearance
2
INTRODUCTION
Measurement of renal function can provide crucial data to assist in scan interpretation
and clinical management decisions. The serum creatinine is often used in clinical practice
as an index of renal function but abnormal values may not be present until the glomerular
filtration rate (GFR) has decreased by 50-80% [1]. Because of the limitations associated
with the serum creatinine, the 24-hour creatinine clearance is still the standard clinical
technique to measure GFR but even this measurement is far from ideal. A 24-hour urine
collection is an inconvenient outpatient measurement that restricts mobility, mandates
two trips to the hospital/clinic, and requires urine collection, storage and transport. Most
important for both outpatients and inpatients, the creatinine clearance measurement will
not be accurate if the urine collection is incomplete. Even if the urine collection is
complete, the clearance measurement can be affected by muscle mass and diet. Creatine
from ingested meat is converted to creatinine and can account for as much as 30% of total
creatinine excretion [2]. Creatinine is not only excreted by glomerular filtration but it is
also secreted by the renal tubule. The secretion of creatinine varies substantially both in
the same individuals over time and between different individuals [3,4]. In addition, the
proportion of total renal creatinine excretion due to tubular secretion increases with
decreasing renal function [5]. This is particularly problematic in the follow-up of patients
with a significant degree of renal dysfunction because the glomerular filtration rate can
fall more rapidly than indicated by either serum creatinine or creatinine clearance.
Tc-99m mercaptoacetyltriglycine (MAG3) was introduced in 1986 as a replacement for
iodine-131 hippuran (OIH) [6,7] and is currently used for 60-70% of the renal scans
3
performed annually in the United States [8]. The clearance of Tc-99m MAG3 is highly
correlated with the clearance of OIH and is used as an index of effective renal plasma
flow (ERPF) [9]. Plasma sample techniques for the measurement of the MAG3 clearance
have been recently reviewed [10]; however, the need for a high degree of technical
competence to perform plasma-based clearances has led to the development of camera-
based techniques that do not require plasma or urine samples [11-14]. The camera-based
MAG3 clearance can be generated at the time of a routine MAG3 renal scan on many
commercial camera/computer systems. Although MAG3 is primarily eliminated by renal
tubular secretion, we hypothesized that tubular secretion and GFR would provide
comparable estimates of overall renal function and that there would be a good correlation
between the Tc-99m MAG3 and 24-hour creatinine clearances.
4
MATERIALS AND METHODS
Subjects
Review of patient records was approved by the Institutional Review Board. The study
population initially consisted of 89 subjects being evaluated for kidney donation at
Emory University Hospital between August, 1998 and March, 2001. Preoperative
evaluation included clinical laboratory studies of blood and urine samples, creatinine
clearance, magnetic resonance renal arteriography, and MAG3 renal scan. These studies
were performed within a week of each other. Twenty-four patients with varying degrees
of renal dysfunction from the Veterans Affairs Medical Center in Atlanta studied between
May, 1998 and February, 2000, had a creatinine clearance measured within 24 hours of
the MAG3 renal scan and were included in the data base. Finally, a reviewer requested
additional patients with impaired renal function. Consequently, a retrospective chart
review was performed of all the MAG3 studies performed at Emory Hospital from July
2003 to January 2005. Five patients with an abnormal 24-hour creatinine clearance
measured within one week of the MAG3 renal study were identified and included in the
study.
Infiltration was calculated by drawing a region of interest (ROI) over the injection site at
the conclusion of the study. Counts in the injection site ROI were corrected for decay
and divided by dose injected to obtain a conservative estimate of the infiltrated dose. Five
subjects were excluded because of dose infiltration exceeding 1%. The remaining 113
subjects comprised the study group (85 normal subjects and 28 patients). The range of
the creatinine clearance for the normal subjects and patients was 71-309 and 19-139
mL/min/1.73m2, respectively. For the MAG3 clearance, the range for the normal
subjects and patients was 155-635 and 29-334 mL/min/1.73m2, respectively.
Procedure
Each study was performed with 1-11 mCi (37-407 MBq) of Tc-99m MAG3
(Mallinckrodt Medical, St. Louis, MO). The patients at Veterans Affairs Medical Center
received 1-2 mCi, whereas the potential renal donors and patients at Emory University
Hospital received 7-11 mCi of Tc-99m MAG3. Radiochemical purity was 95.0 2.7%
(Sep-Pak Cartridge - Millipore, Milford, MA). The data were processed and the camera
based MAG3 clearance was calculated using the QuantEMTM software, which was
developed specifically for Tc-99m MAG3 scans. The technique was similar to the camera
based technique described to calculate GFR [15]. Briefly, the percent of the injected dose
of MAG3 accumulated by the kidneys between 1-2.5 (VA subjects) or 2-3 minutes
(Emory subjects) post-injection was converted to a MAG3 clearance by the use of a
regression equation [11,12]. To determine the percent injected dose in the kidney at a
specific time interval, the dose injected was counted on the camera. If 7-11 mCi were to
be administered, a 1-2 mCi dose was counted on the camera to avoid deadtime losses and
the 1-2 mCi dose and the dose to be injected were counted in a dose calibrator; the ratio
of counts in the dose calibrator was used to convert the 1-2 mCi dose counted on the
camera to the counts injected. A region of interest was placed over the whole kidney and
time zero was defined as the time the bolus reached the kidney. Counts in the kidney
were determined at 1-2.5 or 2-3 minute intervals and corrected for background and
attenuation using an attenuation coefficient of 0.123 [11,12]. The kidney counts were
divided by the counts injected to obtain a percent dose in the kidney at 1-2.5 or 2-3 min
post-injection. This percent dose in the kidney was then converted to a MAG3 clearance
using regression equations derived from a multicenter study that related the percent
injected dose in the kidney at 1-2.5 or 2-3 minutes to a multiple plasma sample MAG3
clearance[12].
The creatinine clearance was determined from a 24-hour urine creatinine with the serum
creatinine collected at the end of the 24-hour urine collection. Each clearance
measurement was corrected for body surface area (BSA) using the following equation:
BSA(m2) = (weight in kg0.425)(height in cm0.725)(71.84)/10,000 [16]. The clearances were
corrected for BSA because the magnitude of the GFR, ERPF and MAG3 clearances
correlates with BSA; larger individuals have higher clearances and smaller individuals
have lower clearances [17]. The BSA correction adjusts for the effect of size on the
absolute clearance measurement and reduces variability; BSA-corrected clearances
standardized to 1.73m2 provide a better comparison to standard normal values.
For statistical analysis, Pearson’s correlation coefficient was used to express the
linear association between the BSA-corrected MAG3 and creatinine clearances. The
linear relationship between the MAG3 and creatinine clearances was determined by
regression analysis with the MAG3 clearance as the independent variable and the
creatinine clearance as the dependent variable. Student’s t-test was used to compare
clearance results between the MAG3 and creatinine clearances. A p value 0.05 was
considered to be significant.
7
RESULTS
The 85 potential renal donors were 41% male, had a mean age of 41 11 years, a mean
BSA of 1.90 0.24 m2 and a mean creatinine clearance of 152 51 ml/min/1.73m2 (95%
C.I. 79-278 ml/min), which was significantly less than the mean camera-based MAG3
clearance of 321 95 ml/min/1.73m2 (95% C.I. 171-546 ml/min, p<0.001). Twenty-
seven out of 28 patients were men with a mean age of 66 8.6 years, a mean BSA of
2.03 0.25 m2 , and a mean creatinine clearance of 74 36 ml/min/1.73m2 (95% C.I. 21-
138 ml/min), which was also significantly less than the mean MAG3 clearance of 153
70 ml/min/1.73m2 (95% C.I. 32-316 ml/min, p<0.001).
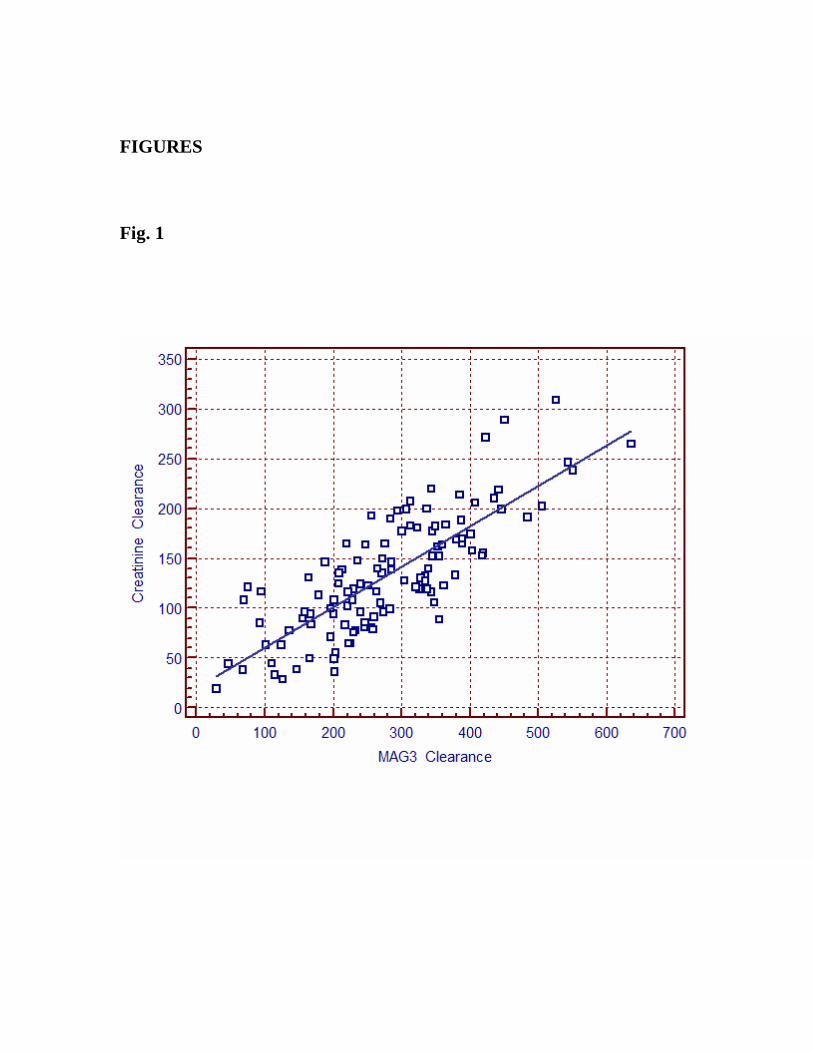
The MAG3 and creatinine clearances (Figure 1) were highly correlated (r=0.80,
p<0.001). Linear regression was used to derive the following equation: Creatinine
clearance (ml/min/1.73m2) = 20 + .407 x (MAG3 clearance in ml/min/1.73m2). The
standard error of measurement for the intercept (20 ml/min/1.73m2) was 8.75
ml/min/1.73m2 . The 95% confidence interval for the intercept ranged from 2.2 to 36.8
ml/min/1.73m2 and the intercept was greater than zero (p=0.03).
8
DISCUSSION
Tc-99m MAG3 is a radiotracer with a rate of urinary excretion essentially equivalent to
iodine-131 orthoiodohippurate (OIH) [6-9]. Compared to I-131 OIH, MAG3 has the
advantages of lower radiation exposure to the patient and better imaging characteristics
because of the 140 keV photon of Tc-99m. The renal clearance of MAG3 is substantially
higher than the renal clearance of Tc-99m DTPA (diethyltriaminepentaacetic acid) and
MAG3 has become the radiopharmaceutical of choice for renal scans in many clinical
contexts, particularly in patients with suspected obstruction and patients with impaired
renal function [8, 10, 18]. Measurement of the MAG3 clearance at the time of the scan
adds important functional information to help direct patient management and detect an
early loss in renal function when the images and the renogram curves may still appear
normal [8]. A camera-based MAG3 clearance can be obtained at the time of the scan
without blood or urine sampling and the camera based measurement correlates well with
the more complex methods involving plasma sampling [11-14].
The line of regression (Fig. 1) comparing the camera-based MAG3 and creatinine
clearances has an intercept of 20 ml/min/1.73m2 with a 95% confidence interval of 2.2 –
36.8 ml/min/1.73m2. If the MAG3 and creatinine clearances provided a perfectly
equivalent measurement of renal function, then a MAG3 clearance of zero would
correspond to a creatinine clearance of zero. In fact, the intercept (Fig 1) was slightly
greater than zero, p = 0.03. There are several possible explanations for the observation
that the intercept was slightly greater than zero: (1) The MAG3 and creatinine clearances
may not be perfectly correlated. (2) The camera-based MAG3 clearance is not a perfect
9
measure of the MAG3 clearance; principal sources of error of the camera-based
technique include corrections for attenuation and background subtraction. (3) There were
not enough patients with very poor renal function. (4) Finally, and perhaps most
importantly, the creatinine clearance is not a perfect measure of GFR. Although GFR can
be estimated from the Cockcroft-Gault [18] and MDRD [19] formulas, these estimates
may deviate substantially from the true GFR in patients with fluid overload, hepatic
insufficiency, and azotemia. GFR can be measured using I-125 iothalamate but this is a
tedious and time consuming technique and is far too labor intensive to be used in a
general radiology practice [10]. At our institution, the standard to measure of GFR in
potential renal donors is the creatinine clearance. Using the creatinine clearance to
measure GFR is not as much of a problem in patients with normal renal function but the
creatinine clearance overestimates GFR in patients with poor function due to secretion of
creatinine by the tubules [3,4]; tubular secretion may explain the fact that the line of
identity did not run through zero. Conceivably, the MAG3 clearance may correlate
better with an inulin or I-125 iothalamate clearance than with a creatinine clearance.
Tc-99m MAG3 is excreted primarily via proximal tubular secretion; consequently, its
clearance is a measurement of tubular cell function and is not a measure of GFR [9]. For
this reason, the regression equation should not be used to calculate the creatinine
clearance from the MAG3 clearance; nevertheless, the regression equation does show
that, on average, the creatinine clearance is about 40% of the MAG3 clearance. If a loss
in renal function results in a proportional loss in GFR and tubular function, then either
measurement will serve as an acceptable index of renal function. Our study suggests that
despite being handled differently by the kidneys, the BSA-corrected MAG3 and
creatinine clearances are highly correlated (Pearson’s correlation=0.80). Consequently, in
normal patients and those with chronic renal impairment, either measurement can serve
as an index of renal function. This argument is further supported by the fact that the
standard deviation of the MAG3 and creatinine clearances (expressed as percent of the
mean) in normal subjects was 30% for MAG3 and 34% for the creatinine clearance,
suggesting that the two measurements are similar for defining normality. Finally,
preliminary data suggest that the camera-based MAG3 clearance is more reproducible
than creatinine clearance in patients with stable renal disease [21].
In summary, the camera-based MAG3 clearance avoids the cumbersome nature,
inconvenience and incomplete urine collections associated with a 24-hour creatinine
clearance and can easily be obtained at the time of a MAG3 renal scan. The camera-based
MAG3 clearance is highly correlated with the creatinine clearance and provides a simple,
safe and convenient test of renal function.
ACKNOWLEDGEMENTS
The authors would like to acknowledge ROI LMN07595 for support of this research.
12
REFERENCES
1. Hood B, Attman PO, Ahlmen J, Jagenburg R. Renal hemodynamics and
limitations of creatinine clearance in determining filtration rate in glomerular
disease. Scand J Urol Nephrol 1971; 5:154-161
2. Lew S, Bosch JP. Effect of creatinine clearance and excretion in young and
elderly healthy subjects and in patients with renal disease. J Am Soc Nephrol
1991; 2:856-865
3. Sjostrom PA, Odlind BG, Wolgast M. Extensive tubular secretion and
reabsorption of creatinine in humans. Scand J Urol Nephrol 1988; 22:129-131
4. Levey AS, Berg RL, Gassman JJ, Hall PM, WalkerWG. Creatinine filtration,
secretion and excretion during progressive renal disease. Modification of Diet in
Renal Disease (MDRD) Study Group. Kidney Int Suppl 1989; 27:S73-80
5. Shemesh O, Golbetz H, Kriss JP, Myers BD. Limitations of creatinine as a
filtration marker in glomerulopathic patients. Kidney Int 1985; 28:830-838
6. Fritzberg AR, Kasina S, Eshima D, Johnson DL. Synthesis and biological
evaluation of technetium-99m MAG3 as a hippuran replacement. J Nucl Med
1986; 27:111-116
7. Taylor Jr A, Eshima D, Fritzberg AR, Christian PE, Kasina S. Comparison of
iodine-131 OIH and technetium-99m MAG3 renal imaging in volunteers. J Nucl
Med 1986; 27:795-803
8. Taylor A. Radionuclide renography: a personal approach. Semin Nucl Med 1999;
29:102-127
13
9. Eshima D, Taylor Jr A. Technetium-99m mercaptoacetyltriglycine: Update on the
new 99mTc renal tubular function agent. Semin Nucl Med 1992; 22:61-73
10. Blaufox MD, Aurell M, Bubeck B, et al. Report of the radionuclides in
Nephrourology Committee on renal clearance. J Nucl Med 1996; 37:1883-1890
11. Taylor A Jr, Corrigan PL, Galt J, et al. Measuring technetium-99m-MAG3
clearance with an improved camera-based method. J Nucl Med 1995; 36:1689-
1695
12. Taylor A, Manatunga A, Morton K, et al. Multicenter trial validation of a camera-
based method to measure Tc-99m mercaptoacetyltriglycine, or Tc-99m MAG3,
clearance. Radiology 1997; 204:47-54
13. Inoue Y, Ohtake T, Ikuo Y, Yoshikawa K, Asai S, Ohtomo K. Evaluation of
renal function from 99mTc-MAG3 renography without blood sampling. J Nucl
Med 1999; 40:793-798
14. Bocher M, Shrem Y, Tappiser A, et al. Tc-99m mercaptoacetyltriglycine
clearance: comparison of camera-assisted methods. Clin Nucl Med 2001; 26:745-
750
15. Gates GF. Glomerular filtration rate: estimation from fractional renal
accumulation of Tc-99m DTPA (stannous). AJR 1982;138:565-570
16. Du Bois D, Du Bois EF. A formula to estimate the approximate surface area if
height and weight be known. Nutrition 1989; 5:303-311
17. Kasiske BL, Keane WF. Laboratory assessment of renal disease: clearance,
urinalysis, and renal biopsy. In: Brenner B, ed. The Kidney. Philadelphia: W.B.
Saunders Company, 2000:1129-1170
14
18. O’Reilly P, Aurell M, Britton K, Kletter K, Rosenthal L, Testa T. Consensus on
diuresis renography for investigating the dilated upper urinary tract. J Nucl Med
1996; 37:1872-1876
19. Cockcroft DW, Gault MH. Prediction of creatinine clearance from serum
creatinine. Nephron 1976; 16:31-41
20. Levey AS, Bosch JP, Lewis JB, Greene T, Rogers N, Roth D. A more accurate
method to estimate glomerular filtration rate from serum creatinine: a new
prediction equation. Modification of Diet in Renal Disease Study Group. Ann
Intern Med 1999; 130:461-470
21.Taylor A, Myrick S, Grant S, Issa M, Halkar R, Alazraki NP. A prospective
study to compare the reproducibility of camera based MAG3 and creatinine
clearance measurements. J Nucl Med 1999; 40:52P.
FIGURE LEGENDS
Fig. 1. Scatter plot showing the correlation between the camera-based MAG3 and
creatinine clearances (mL/min/1.73m2). The Pearson’s correlation is 0.80.
16
FIGURES
Fig. 1

17
Recommended