1
COMPARATIVE ANALYSIS OF ACID ACTIVATED NTEJE CLAY AND TWO COMMERCIALLY AVAILABLE ADSORBENTS (FULLER’S EARTH
AND ACTIVATED CARBON)
BY
ETUK, ANYANIME CHRISTOPHER
PG/M.SC./12/62662
DEPARTMENT OF PURE AND INDUSTRIAL CHEMISTRY FACULTY OF PHYSICAL SCIENCE
UNIVERSITY OF NIGERIA, NSUKKA
JANUARY, 2015
2
COMPARATIVE ANALYSIS OF ACID ACTIVATED NTEJE CLAY AND TWO COMMERCIALLY AVAILABLE ADSORBENTS (FULLER’S EARTH AND ACTIVATED CARBON)
BY
ETUK, ANYANIME CHRISTOPHER
PG/M.SC./12/62662
RESEARCH PROJECT
SUBMITTED TO THE DEPARTMENT OF PURE AND INDUSTRIAL CHEMISTRY, FACULTY OF PHYSICAL SCIENCES, UNIVERSITY OF NIGERIA, NSUKKA IN PARTIAL FULFILMENT OF THE REQUIREMENT FOR THE AWARD OF MASTER OF SCIENCE (M.Sc.) DEGREE IN INDUSTRIAL CHEMISTRY
JANUARY, 2015

3
DECLARATION
This Project contains the report of an original work that was carried out by me and has not
been presented in any previous application for any degree or diploma. All literatures cited,
information from other sources have been acknowledged by means of references.
Sign: ------------------------ Date: -------------------
ETUK, ANYANIME CHRISTOPHER

4
CERTIFICATION This is to certify that the research work titled, “COMPARATIVE ANALYSIS
OF ACID ACTIVATED NTEJE CLAY AND TWO COMMERCIALLY
AVAILABLE ADSORBENTS (FULLER’S EARTH AND ACTIVATED
CARBON)” was carried out by Etuk, Anyanime Christopher with registration
number: PG/M.Sc/12/62662 and has been approved by the undersigned as
having met the standard for the Department of Pure and Industrial Chemistry,
University of Nigeria, Nsukka in partial fulfillment of the requirements for the
award of Master of Science (M.Sc.) degree in Industrial Chemistry.
-------------------------------------- ---------------------- Prof. Linus E. Aneke Date Supervisor
------------------------------------------------------ ----------------------------- Dr. A. E. Ochonogor Date Head of Department ------------------------------------------------------- -------------------------------- External Examiner Date

5
DEDICATION
With reference to God, I dedicate this work to my dear family (Dad, Mum and siblings) whose
support and love to me has been immeasurable.

6
ACKNOWLEDGMENT
The success of this work wasn’t without challenges. It is therefore necessary to
acknowledge contributors and facilitators to this fruition. And in so doing, I thank God for His
mercies and grace that qualify me to this lofty height. I am humbled at His protection, journey
mercies and provisions I enjoyed throughout the period of this study. May his name be praised.
It is compulsory within my spirit to acknowledge my supervisor, Prof. Linus Enemor
Aneke. Untiring he was correcting my mistakes, happily he was bearing my disturbances to his
telephone lines and would always be there for me. Thank you. I am not ungrateful to the head,
Department of Pure and Industrial Chemistry, University of Nigeria, Nsukka, Dr. A. E. Ochonogor
for his fatherly response and contributions which were strategic to this success.
I acknowledge the immense contribution of all the staffs (teaching and non-teaching) of the
Department of Pure and Industrial Chemistry, University of Nigeria, Nsukka. Amongst whom are
Prof. P. O. Ukoha who has been elevated to the position of the Dean, Faculty of Physical
Sciences, Dr. J. Asegbeloyn, Dr. P. M. Ejikeme. Specially, I acknowledge and appreciate the effort
of Engr. J. U. Ani. His contribution and advice speaks volume to the success of this work. Thank
you. Let me acknowledge in advance the external examiner, who will do another good but tedious
job to the overall success of this study. Thank you, Sir.
I acknowledge and appreciate the efforts of my parent, bearing the entire cost of this study,
my siblings for their love and patience, friends and donors who stood by me throughout the period
of this work.
Finally, I appreciate Christ Church Chapel, University of Nigeria, Nsukka, its Choir (C4)
and Methodist Campus Fellowship (MCF) for their moral support and all those whose
contribution(s) and efforts made this work a success.

7

8

9
ABSTRACT
The composition and bleaching properties of Nteje clay in comparison with two commercially available adsorbents (activated carbon and fuller’s earth) were investigated to study its competence for use as an alternative to high cost imported adsorbents. The modification of the raw clay sample was carried out by acid activation to enhance the surface area of the clay by exchange of octahedral cations e.g Al3+, Fe3+ and Mg2+ with H+ ions which led to the modification of the clay crystalline structure. The raw clay sample was characterized using X-ray Diffraction (XRD) analysis and Fourier Transfer Infrared Spectroscopy. The acid activated sample was used along the two commercially available adsorbents (activated carbon and fuller’s earth) in adsorptive bleaching of palm oil to study its adsorptive capacity. The bleaching was done at constant temperatures of 60 oC, 80 oC, 100 oC, 120 oC and 140 oC varying time at 10, 20 30, 40 and 50 minutes at each constant temperature. The kinetics and thermodynamics of the adsorption reaction was investigated at 333 k, 353 k, 373 k, 393 k and 413 k. To further understand the kinetics, the adsorption data were analyzed by pseudo-second order, elovich and power function equations. Adsorptive bleaching of palm oil was carried out using optimum operating conditions of temperature, clay dosage and reaction time. The results revealed that the adsorption followed power function equation for both activated carbon (A.C) and fuller’s earth (F.E) with linear regression coefficient (R2) values of 0.987 and 0.990 respectively and followed elovich equation for activated Nteje clay (A.N.C) with (R2) value of 0.985. Analysis of the equilibrium data using Langmuir and Freundlich isotherms showed that Langmuir isotherm provided the best fit for the three adsorbents understudy. Furthermore, the evaluation of the adsorption thermodynamic parameters revealed that the adsorption process was spontaneous and exothermic because of the free energy change, negative change in enthalpy and positive change in entropy. A maximum colour reduction of 79 % was obtained for both A.N.C and F.E and 78 % for A.C all at 140 oC. The results from this study reveals that modification of this alumino-silicate increased its adsorptive capacity and produced equal results and responses like their commercially available counterparts. Application of the low cost modification technique Nteje Clay therefore should not be doubted, as this study have establish that it competes and compares favourably with the imported, commercially available adsorbents.

10
LIST OF ABBREVIATIONS AND SYMBOLS
ANC - Activated Nteje Clay
AC - Activated carbon
FE - Fuller’s Earth
XRD - X-ray Diffraction
EDTA - Ethylene di-amime tetraacetic acid
UANC - Unactivated Nteje Clay
CPO - Crude Palm Oil
RBDPO - Refined, bleached, deodorized palm oil
FTIR - Fourier transform infrared
SEM - Scanning electron microscope
DBPO - Deodorized, bleached palm oil
FFA - Free fatty acid
PFAD - Palm fatty acid distillate
NHP - Non-hydratable phosphatide
RBD - Refined, bleached and deodorized
PV - Peroxide value
DOBI - Deterioration of bleachability index
IR - Infrared
Å - Angstrom
M - meter
λ - lambda
F - Fahrenheit
% - Percentage
mmHg - millimeters mercury
ppm - Parts per million
γ - Gamma
wt% - weight percent
KJ/mol - Kilojoules per mole
K - Kelvin

11
μm - Micrometer oC - Degrees centigrade
M - Molar
N - Normal
m2/g - Meters square per grams
ml - mills
meq - milli equivalent
S/N - Serial number
etc - et cetera

12
TABLE OF CONTENT
Title page
Certification
Approval page
Dedication
Acknowledgement
Table of content
List of Tables
Abstract
List of Figures
List of Abbreviations and Symbols
CHAPTER ONE: INTRODUCTION
1.1 Research background
1.2 Research objectives and scope
1.3 Significant of study
CHAPTER TWO: LITERATURE REVIEW
2.1 Introduction
2.2 Clays
2.2.1 Classification of clays
2.2.2 Modification of clays-
2.2.3 Methods of modification of clay minerals
2.1.3.1 Thermal activation
2.1.3.2 Acid activation
2.1.3.2.1Mechanism of acid activation
2.3 Characterization techniques for clay
2.3.1 X-ray fluorescence
2.3.2 Fourier transform infrared spectroscopy (FTIR)
2.3.3 Powdered X-ray diffraction analysis
2.3.4 Scanning electron microscope
2.4 Use of clay in decolourizing and refining oil
2.4.1 Types of clays used in decolourizing

13
2.4.2 Properties required of decolourizing clays
2.5 Activated carbon
2.5.1 Production
2.5.2 Physical reactivation
2.5.3 chemical reactivation
2.6 Pre-treatment – Degumming, deodorization and bleaching
2.6.1 Degumming process
2.6.2 Deodorization
2.6.3 Bleaching process
2.7 What is degumming?
2.7.1 Types of degumming
2.7.1.1 Dry degumming
2.7.1.2 Water degumming
2.7.1.3 Acid degumming
2.7.1.4 Enzymatic degumming
2.7.1.5 EDTA – degumming
2.7.1.6 Membrane degumming
2.7.2 Process theory of degumming
2.8 What is bleaching?
2.8.1 Types of bleaching
2.8.1.1 Heat bleaching
2.8.1.2 Chemical oxidation
2.8.1.3 Adsorption
2.8.2 Process theory of bleaching
2.8.3 Palm oil (Elaeis guineensis)
2.8.3.1 Composition of crude palm oil (CPO)
2.9 Survey of related literature
CHAPTER THREE: EXPERIMENTAL
3.1 Modification of clay by chemical activation
3.2 Physical and chemical characterization of Nteje clay
3.2.1 Surface area measurement

14
3.2.2 Bulk density
3.2.3 Specific Gravity
3.2.4 Oil retention
3.2.5 pH and acidity measurement
3.2.6 Cation exchange capacity (CEC)
3.3 Pretreatment - degumming and neutralization
3.3.1 Degumming process
3.3.2 Neutralization process
3.4 Bleaching process
3.5 Adsorption kinetics
3.6 Adsorption isotherm
3.7 Adsorption thermodynamics
CHAPTER FOUR: RESULTS AND DISCUSSION
4.1 Physico-chemical characterization of Nteje clay
4.2 FTIR characterisation
4.3 XRD analysis
4.4 Effect of activation
4.5 Effect of bleaching time
4.6 Effect of temperature
4.7 Adsorption kinetics
4.8 Adsorption isotherm
4.9 Adsorption thermodynamics
CHAPTER FIVE: CONCLUSIONS AND RECOMMENDATIONS
5.1 Conclusion
5.2 Recommendations
5.3 Contribution to knowledge
REFERENCES
APPENDICES
APPENDICES

15
Appendix A: Table of Values for the Amount of Pigment Adsorbed (Percentage Bleaching) and
Isotherm Parameters at Various Constant Temperatures.
Appendix B: Table of Values for the Adsorption Thermodynamic Plot at Constant Time.
Appendix C: Table of Values for the Adsorption Kinetic Plots at Constant Temperatures.
Appendix D: Detailed X-ray Diffraction (XRD) Analysis Result as Obtained from Physics
Advanced Laboratory, Sheda Science and Technology, Abuja

16

17
LIST OF FIGURES
Figure 2.1: Flow Diagram of Dry Degumming
Figure 2.2: Flow Diagram of Water Degumming
Figure 2.3: Flow Diagram of Acid Degumming
Figure 2.4: Flow Diagram of EDTA Degumming
Figure 2.5: Chemical Structure of Phosphatide
Figure 2.6: Mechanism of Adsorption
Figure 4.1: FTIR Spectrum Of Natural Nteje Clay
Figure 4.2: FTIR Spectrum Of Activated Nteje Clay
Figure 4.3: Charts of Percentage Bleaching with Time at Various Constant Temperatures
Figure 4.4: Pseudo-second Order Plot for AC, FE and ANC at 10 min
Figure 4.5: Pseudo-second Order Plot for AC, FE and ANC at 20 min
Figure 4.6: Pseudo-second Order Plot for AC, FE and ANC at 30 min
Figure 4.7: Pseudo-second order Plot for AC, FE and ANC at 40 min
Figure 4.8: Pseudo-second Order Plot for AC, FE and ANC at 50 min

18
Figure 4.9: Elovich Plot for AC, FE and ANC at 10 min
Figure 4.10: Elovich Plot for AC, FE and ANC at 20 min
Figure 4.11: Elovich plot for AC, FE and ANC at 30 min
Figure 4.12: Elovich Plot for AC, FE and ANC at 40 min
Figure 4.13: Elovich Plot for AC, FE and ANC at 50 min
Figure 4.14: Power Function Equation Plot for AC, FE and ANC at 10 min
Figure 4.15: Power Function Equation Plot for AC, FE and ANC at 20 min
Figure 4.16: Power Function Equation Plot for AC, FE and ANC at 30 min
Figure 4.17: Power Function Equation Plot for AC, FE and ANC at 40 min
Figure 4.18: Power Function Equation Plot for AC, FE and ANC at 50 min
Figure 4.19: Freundlich Isotherm Plot for AC, FE and ANC at 10 oC
Figure 4.20: Freundlich Isotherm Plot for AC, FE and ANC at 20 oC
Figure 4.21: Freundlich Isotherm Plot for AC, FE and ANC at 30 oC
Figure 4.22: Freundlich Isotherm Plot for AC, FE and ANC at 40 oC
Figure 4.23: Freundlich Isotherm Plot for AC, FE and ANC at 50 oC

19
Figure 4.24: Langmuir Isotherm Plot for AC, FE and ANC at 10 oC
Figure 4.25: Langmuir Isotherm Plot for AC, FE and ANC at 20 oC
Figure 4.26: Langmuir Isotherm Plot for AC, FE and ANC at 30 oC
Figure 4.27: Langmuir Isotherm Plot for AC, FE and ANC at 40 oC
Figure 4.28: Langmuir Isotherm Plot for AC, FE and ANC at 50 oC
Figure 4.29: Plot of ���� versus 1 �� for AC, FE and ANC at 10 min
Figure 4.30: Plot of ���� versus 1 �� for AC, FE and ANC at 20 min
Figure 4.31: Plot of ���� versus 1 �� for AC, FE and ANC at 30 min
Figure 4.32: Plot of ���� versus 1 �� for AC, FE and ANC at 40 min
Figure 4.33: Plot of ���� versus 1 �� for AC, FE and ANC at 50 min

20
LIST OF TABLES
Table 2.1: Compositions of Phospholipids of Palm Oil (mole %)
Table 4.1: Physical Properties of AC, FE, ANC and UANC
Table 4.2: XRD Analysis Result of Nteje Clay
Table 4.3: Effect of Bleaching Time at 60 oC
Table 4.4: Effect of Bleaching Time at 80 oC
Table 4.5: Effect of Bleaching Time at 100 oC
Table 4.6: Effect of Bleaching Time at 120 oC
Table 4.7: Effect of Bleaching Time at 140 oC
Table 4.8: Pseudo-second Order Parameters for AC, FE and ANC
Table 4.9: Elovich Parameters for AC, FE and ANC
Table 4.10: Power Function Equation Parameters for AC, FE and ANC
Tables 4.11: Freundlich and Langmuir Isotherm Parameters evaluated for AC, FE and ANC at 60 oC
Table 4.12: Freundlich and Langmuir Isotherm Parameters evaluated for AC, FE and ANC at 80 oC

21
Table 4.13: Freundlich and Langmuir Isotherm Parameters evaluated for AC, FE and ANC at
100 oC
Table 4.14: Freundlich and Langmuir Isotherm Parameters evaluated for AC, FE and ANC at 120 oC
Table 4.15: Freundlich and Langmuir Isotherm Parameters evaluated for AC, FE and ANC at 140 oC
Table 4.16: Thermodynamic Parameters Evaluated for AC, FE and ANC at 10 Mins.
Table 4.17: Thermodynamic Parameters Evaluated for AC, FE and ANC at 20 Mins.
Table 4.18: Thermodynamic Parameters Evaluated for AC, FE and ANC at 30 Mins.
Table 4.19: Thermodynamic Parameters Evaluated for AC, FE and ANC at 40 Mins.
Table 4.20: Thermodynamic Parameters Evaluated for AC, FE and ANC at 50 Mins.

22
23
CHAPTER ONE
INTRODUCTION
1.1 Research Background
Natural clay minerals are well known and familiar to mankind from the earliest days of
civilization1. Because of their low cost, abundance in most continents of the world, high sorption
properties, high dissolubility in acidic solutions and potential for ion exchange, clay materials are
suitable substances as source of metals and adsorbents. Clay is composed mainly of silica,
alumina, water and frequently with appreciable quantities of iron, alkalis as well as alkali earth
metals. Two structural units are involved in the atomic lattices of most clay minerals. One unit
consists of closely packed oxygen atoms and hydroxyls in which aluminum, iron and magnesium
atoms are embedded in an octahedral combination so that they are at equal distant from six oxygen
or hydroxyls. The second unit is built of silica tetrahedrons. The silica tetrahedrons (Si4O6(OH)4)
are arranged to form a sheet of composition2.
Clay deposits are widespread over the regions of Nigeria and are under utilized in the process
industries largely because we do not have the technology. These clay deposits can be mined,
purified and processed into useful raw materials for the process industries. Naturally occurring
clays are alumino-silicate minerals containing sodium, potassium, and calcium, with traces of
magnesium and iron which may be substituted for aluminum. The structure of these clays can be
altered by heating or reaction with strong acids or alkalis to improve their adsorptive properties
and colour. The majority of these clays do not possess such properties, but, may be activated by
some forms of treatment and their efficiency in the bleaching of vegetable oils can be improved.

24
Activation of clays can be accomplished by calcinations, reaction with mineral acids/alkalis, or
combination of both techniques.
1.2 Research Objective and Scope
The aim of this research was to make comparative analysis of the bleaching efficiency of a locally
substituted adsorbent, Nteje clay to the imported, commercially available activated carbon and
fuller’s earth. Because little or no work has been done in comparing the bleaching efficiency of
Nteje clay to its commercial standards, hence the need for the study. This study if found efficient
to the imported bleaching efficiencies of activated carbon and fuller’s earth, should be able to
operate at various quality of crude palm oil (C.P.O) fed and produce equal results and responses as
its commercial standards. By doing so, the purity of the final product including its commercial and
health values will be enhanced.
Therefore, the specific objectives of the research were:-
1. Preparation, characterization of activated and unactivated Nteje clay as well as its
activation.
2. To carry out adsorption of colour pigment from palm oil
3. To study the chemical kinetics, thermodynamics and equilibria of the adsorption process.
1.3 Problem Statement
1. Despite positive results by researchers of the bleaching capacity of Nteje clay, it is still
facing heavy industrial discrimination leading to little or no patronage
25
2. This study was also motivated by the easy contamination of vegetable and seed oils due to
the presence of both physical and chemical impurities.
3. The importation of large quantities of adsorbents and at a very high cost.
4. There is the problem of few locally substituted earth sources for research compared to
activated carbon with several substituted local sources.
5. Research have revealed that there are more than enough earth (clays) available that can be
used as adsorbent to meet our local demand.
1.4 Significance of Study
Nteje clay has been reported by several authors to have been successful in the adsorptive
bleaching of palm oil and its potency of being an alternative to costly, imported adsorbents.
Despite these successful results, it is more valuable when the adsorptive power of these local clays
are strong enough to permit it to compete actively with adsorbents already accepted as the standard
quality for refining oils. Hence, the main objective of this research which was to compare the
widely reported bleaching efficiency of this locally substituted adsorbent (Nteje clay) to the
imported, commercially available standards (fuller’s earth and activated carbon). The study will
properly validate its use as a local substituent for industrial and scientific applications, if found
competent.
26
CHAPTER TWO
LITERATURE REVIEW
2.1 Introduction
The use of local raw materials in the process industries has been an age old practiced which
so many researchers have dealt with in the last twenty decades. These locally available raw
materials ranging from agricultural wastes to naturally occurring materials like clays have been
found to be useful in such areas like cement production, resins, polishes, metal manufacturing,
ceramics industries, cosmetics, textiles, confectionaries, leather industries, etc. The enormous
availability of these raw materials has necessitated further research work into their alternate uses
other than the ones already developed. Clay, which is one of the most readily available of these
materials, has been found useful in so many areas of life ranging from refractory to metal
processing. Much work has been carried out on the possibility of leaching out some of the metallic
oxides that form the base constituents of clay minerals- alumina, magnesia, ferric oxide, calcium
oxide, and titanium oxide3. The various works are reviewed to see the extent of work done and find
out the lapses which this work will fill and also improvement on the established processes.
2.2 Clays
The word clay is used in ceramics to mean several different kinds of material(s). It is often
taken to mean one of a particular group of purified true clay minerals, each having a definite
composition and a characteristic crystal structure. At other times, it refers to a natural or
manufactured mixture of materials that contains some true clay minerals, which can be made
workable by the addition of water4. The true clay minerals occur in great varieties in nature and are
found in commercial workable deposits of various purities all over the world. True clay minerals
are hydrated aluminum silicates that have been formed by alteration and breakdown of parent

27
igneous rocks5. The most important source rocks for clay formation are feldspathic rocks or
granites (typically mixtures of feldspars, quartz, and mica).
The gradual alteration of parent rocks to form clay minerals has usually taken place over
very long time periods within the earth’s crust under the chemical action of heat, high-pressure
gases and water. Deposits of clays formed by such a hydrothermal process are frequently found
still mixed with fragments of unaltered parent rock. These are called residual or primary clay
deposits. A long ago, erosion exposed many primary clay deposits, and streams and rivers washed
much of the clays out from their original deposits. The actions of the moving water tended to
partially purify the material by separating out some of the heavier parent rock fragments. The
resulting finer particles were washed downstream to settle out in the calm waters of lakes or where
rivers emptied into ancient seas. Clays deposited in such a manner are called sedimentary or
secondary clays6. These deposits still contain some finely divided mineral impurities and often also
contain organic material resulting from decaying vegetation entrapped in the clays as they settled
out of the water. The most abundant true clay mineral is Kaolinite, which is a hydrated aluminum
silicate with the chemical formula Al2Si2O5(OH)4. A clay raw material that consist primarily of
Kaolinite is called kaolin. The name kaolin comes from the Chinese word kauling, which means
“high-ridge,” the name of a hill near Jauchau Fu where an important ancient deposit was located7.
Kaolinite occurs in nature in relatively thick beds made up of billions of these tiny Kaolinite
crystals, which typically measure about 1 millionth of a meter (1 μm), or approximately 40
millionths of an inch, across the plate face by about 0.1 μm in thickness. Several structural
variations of the fixed Kaolinite formula exist, depending on differences in internal arrangement of
the Al, Si, and O atoms in the crystal. Montmorillonite is a true clay mineral with a crystal
structure completely different from Kaolinite but fairly closely related to the structure of the

28
mineral mica. The general chemical formula for montmorillonite is Al2Si4O10(OH)2 but there are
always significant amounts of iron, magnesium, and potassium atoms present within the crystals8.
The crystal structure of montmorillonite consists of layers, and large amounts of water which can
be accommodated between the layers, leading to the possibility of considerable swelling when the
dry clay contacts water. Montmorillonite is the major mineral in deposits of very fine-grained,
highly weathered, volcanic glass called bentonite.
2.2.1 Classification of Clays
The classification of clays have been organized about the origin of clays (geological
viewpoint), their chemical compositions (chemical viewpoint), or their uses (technological
viewpoint). As an example of the first classification, one finds categories such as residual clays,
lake clays, glacial clays, sedimentary clays, etc., and examples of the second viewpoint are
siliceous clays, high-alumina clays, manganiferous clays, etc. A mineralogical classification of
clays includes both the clay minerals (Kaolinite, montmorillonite, etc.) and additional rock forming
and other minerals5. For technological purposes, factors which determine the technological
classification of clay (rock deposit) take into account the following: (1) the dominant clay-mineral
type including breakdown into its polymorphs, the sites and amount of charge on it, and shape of
clay crystal and particle. (2) The clay minerals present in minor quantities, but perhaps coating the
surface of the major constituent. (3) The particle size distribution of the clay and other minerals.
(4) Ion-exchange capacity (cat ion, anion) and neutral molecule sorption. (5) The kind of
exchangeable ions present on the clay and degree of saturation of exchange sites. (6)
Hygroscopicity of the clay. (7) Reactivity of the clay with organic compounds. (8) Expansion
potentialities of the clay mineral lattice. (9) Electrolytes and solutions in association with the clay
deposit. (10) The accessory minerals, or mineral “impurities,” their sizes, homogeneity of mixture,
29
and their ion-exchange capacity. (11) Content of organic matter and especially its occurrence—
size and discreteness of particles, its adsorption on and/or within the clay crystal units, and
protective colloid action. (12) Presence or absence of bacteria or other living organisms. The pH
and other properties of a clay deposit may vary notably within a short time where bacteria are
growing. (13) Content of hydrated alumina and/or silica, which are relatively soluble in ground
water or in dilute acid or alkali. (14) The texture and structure of the clay deposit, such as
lamination, orientation of mineral particles, and other gross features. Clay minerals are classified
preferably on a structural basis5.
2.2.2 Modification of Clays
Modification can alter the clay structure to enlarge its surface area, thereby increasing the
adsorptive and dissolution capacities9. Modification of clay is vital to increase the range of
applicability of clays for the adsorption of colour pigments and extraction of metals10. The
chemical composition of clay minerals varies depending upon the origin influencing the layer
charge, cation exchange capacity, adsorption capacity, dissolution capacity, and morphology.
These factors play a significant role in the modification of the natural clays11. After modification
with cationic surfactants the organic groups are attached to the surface of the natural clays and
largely change the surface properties9. The physical, chemical and biological properties of
modified adsorbents are different from the original adsorbent12.
2.2.3 Methods of Modification of Clay Minerals
The term activation refers to chemical and physical treatments employed to enhance the
adsorption and dissolution capacities of clays. 13 There are various methods for modification of
clay minerals, such as, acid activation11, thermal treatment14, treatment with cationic surfactant[15],

30
polymer modification, pillaring by different types of poly (hydroxo metal) cations, intra-particle
and inter-particle polymerization, de-hydroxylation and calcination, de-lamination and re-
aggregation of smectites, and lyophilisation, etc.
2.2.3.1 Thermal Activation
The thermal activation of clay is a physical treatment which involves calcination of clays at
high temperature14. The change in structure and composition upon heating is different for different
clays and largely depends on the particle size and the heating regime16. Furthermore, the clay
minerals are generally calcined prior to their use in order to remove any impurities or moisture
attached to the clay particles11. The thermal activated clays are extensively used in textile, oil and
sugar industries to remove colour and other impurities17. Initially, in the dehydration stage, the
adsorbed and hydrated water and impurities attached to the clay particles are removed. This results
in the weight loss of the clay particles and increase in surface area, providing access to more sites
for adsorption16. Further heating corresponds to the de-hydroxylation. If heating is continued
beyond de-hydroxylation the clay structure and the surface functional groups are altered.
Breakdown of the bonds within the clay structure takes place resulting in the collapse of structure
and reduction in surface area.Vimonses et al (2009)18 studied the adsorption of cadmium and zinc
ions on bentonite. The modification of bentonite was conducted by simple heating at 100 and 200
oC and acid activation was carried in the range from 0.5 to 2.5M H2SO4. The thermal activated
clay at 200 oC was much more effective compared to other activated clay. Chaari et al (2008)19
studied the adsorption of lead on thermal activated clays. The results revealed that adsorption of
lead on the smectite clay increased with the increase in calcination temperature due to the removal
of physico-sorbed water and then decreased with further increase in temperature because of
decrease in surface area.

31
2.2.3.2 Acid Activation
The clay formulated by treating it with inorganic acids at high temperatures is termed acid
activated clays20. The acid activation of the clays is normally done by treating it with HCl or
H2SO4 or HNO321 and the cost of production of these acid activated clays is low. The acid
activation of the clays alters the physical properties, such as enhancing the surface area and
average pore volume22. It can also change the chemical properties such as cation exchange
capacity and the surface acidity of the clays, thus, generating the desirable characteristics required
for an effective adsorbent23.
2.2.3.2.1 Mechanism of Acid Activation
The acid activation of clay is a two-step procedure in which the splitting of particles within
the octahedral sheet takes place. In the first step the exchangeable cations are replaced by protons
(H+). The second step involves the leaching of octahedral cations such as Al3+, Mg2+, and Fe3+
from the octahedral and the tetrahedral sheets[11]. The octahedral Al3+ cations could be more easily
leached by acid attack than the tetrahedral Si4+ cations. However, to prevent the excessive leaching
of Al3+ at high concentration, which results in rupture of the lattice structure and decrease in the
surface area of the clay, it is essential to use the appropriate amount of acid. Hajjaji M. et al
(2009)24 investigated the adsorption of methylene blue on raw and acid activated bentonite. The
adsorption capability can decrease after acid activation using certain acid at a high concentration.
The acid activation of bentonite was carried out by treating it with 6.7 M HCl at boiling
temperature for 3 hours. The high acid strength and temperature may have caused the
decomposition of the montmorillonite structure and formation of excess amorphous silica.
32
Apart from leaching of cations from octahedral and tetrahedral sheets, acid activation also
removes impurities like calcite and exposes the edges of platelets leading to an increase in surface
area. The acid activated clays have a lower layer charge, lower cation exchange efficiency and
higher surface area than the natural clays, and could be desired for adsorption. Jovanovic and
Jonackovic (1991)25 activated bentonite with HCl over a concentration range of 0.5 – 4 M. It was
found that surface area of bentonite increased with severity of acid. The maximum surface area
and optimal porosity is achieved by activation with 2 M HCl and decreases with further increase in
acid concentration. The increase in surface area at a low concentration is attributed to cation
exchange and removal of impurities; however, the decrease in surface area beyond 2 M HCl is due
to structural changes and the decomposition of samples. The properties of the acid activated clays
are controlled by the following factors: acid concentration, temperature, treating time, and dry
acid/clay ratio, drying temperature of the clay, washing procedure. Bhattacharyya K. G. et al
(2006)26 activated Kaolinite and montmorillonite by acid activation with 0.25 M H2SO4 for 3
hours. On acid activation, the surface area of Kaolinite increased from 3 to 15 m2g-1, whereas the
surface area of montmorillonite increased from 19 to 52 m2g-1. The adsorption of Fe (III) ions on
montmorillonite was more than Kaolinite and acid activation enhanced the activation capacity
adsorbing more Fe (III) ions on the acid activated forms. A comparative study of the effect of acid
activation with H2SO4 and HCl has been reported by Pushpaletha et. al, (2005)27. The results
revealed that modification of clay by sulphuric acid was proven to be more efficient than
hydrochloric acid. The activation was carried out over a concentration range of 0.35 to 10 N. The
maximum conversion of benzene was obtained by sample treated with 1.5 N for both acid and
significant increase in conversion of acid activated bentonites was observed compared to raw
bentonite. Kara M. et. al. (2003)28 analyzed the effect of HNO3, HCl, and H2SO4 on the

33
modification of sepiolite. The surface area evaluation revealed that surface area of sepiolite
increased with acid activation and followed the order H2SO4 > HCl > HNO3. Furthermore, the
results showed that acid activation followed by thermal activation drastically increases the surface
area.
2.3 Characterization Techniques for Clay
In this study, various characterization techniques were used to analyze the properties of the clay
samples. In this section, a brief overview of the characterization techniques is described.
2.3.1 X-ray Fluorescence
The X-ray fluorescence (XRF) is widely used to measure the elemental composition of
materials. Since this method is fast and non-destructive to the sample, it is the method of choice for
field applications and industrial production for control of materials. Depending on the application,
XRF can be performed by using not only X-rays but also other primary sources like alpha
particles, protons or high energy electron beams. When a primary X-ray excitation source from an
X-ray tube or a radioactive source strikes a sample, the X-ray can either be absorbed by the atom
or scattered through the material. The process in which an X-ray is absorbed by the atom by
transferring all of its energy to an innermost electron is called the photoelectric effect. During this
process, if the primary X-ray had sufficient energy, the electron is ejected from the inner shell,
creating a vacancy. The vacancy presents an unstable condition for the atom. As the atom returns
to its stable condition, electron from the outer shell is transferred to the inner shell and in the
process give off a characteristic X-ray whose energy is the difference between the two binding
energies of the corresponding shells. Because each element has a unique set of energy levels, each
element produces X-rays at a unique set of energies, allowing one to nondestructively measure the
elemental composition of a sample. The process of emissions of characteristic X-rays is called "X-

34
ray Fluorescence," or XRF. Analysis using X-ray fluorescence is called "X-ray Fluorescence
Spectroscopy." In most cases the innermost K and L shells are involved in XRF detection. A
typical X-ray spectrum from an irradiated sample will display multiple peaks of different
intensities. The identification of atom can be done by comparing the spectrum with the standard
value stored in the look-up table. Also, the quantitative analysis can be done using the intensities
of the peaks.
2.3.2 Fourier Transform Infrared Spectroscopy
The region of the infrared spectrum which is of great interest to most of the chemists is the
wavelength range 2.5 to 15 μm. In practice, units proportional to frequency, (wave number in units
of cm-1) rather than wavelength, are commonly used and the region 2 to 15 μm corresponds to
approximately 4000 to 400 cm-1. The atoms in a molecule are constantly oscillating around
average positions. Bond lengths and bond angles are continuously changing due to this vibration.
A molecule absorbs infrared radiation when the vibration of the atoms in the molecule produces an
oscillating electric field with the same frequency as the frequency of incident infrared radiation
when they are in resonance. Each molecule has its own characteristic spectrum. The bands that
appear depend on the types of bonds and the structure of the molecule. Fourier transform infrared
(FTIR) spectroscopy measures dominantly vibrations of functional groups and highly polar bonds.
Thus these chemical fingerprints are made up of the vibration features of all the samples
components. FTIR spectrometer records the interaction of IR radiation with experimental samples,
measuring the frequencies at which the sample absorbs the radiation and the intensities of the
absorptions. Determining these frequencies allows identification of the sample's chemical makeup,
since chemical functional groups are known to absorb light at specific frequencies. FTIR
experiments generally can be classified into the following two categories: (a) qualitative analysis,

35
where the aim is to identify the sample and (b) quantitative analysis, where the intensity of
absorptions is related to the concentration of the component.
2.3.3 Powder X-ray Diffraction
X-rays are electromagnetic radiation of wavelength about 1 Å (10 - 100 m), which is about
the same size as atomic distances in solid thus it can be used to probe the crystalline structure at
atomic level. X-ray diffraction has been used in two main areas, for the fingerprint characterization
of crystalline materials and the determination of their structure. Each crystalline solid has its
unique characteristic X-ray powder pattern which may be used as a "fingerprint" for its
identification. Once the material has been identified, X-ray crystallography may be used to
determine its structure, i.e. how the atoms pack together in the crystalline state and what the inter-
atomic distance and angle are. These unique properties made X-ray diffraction one of the most
important characterization tools used in solid state chemistry and material science. An important
equation for X-ray diffraction is Bragg’s equation which shows a relationship between X-ray.
wavelength (λ) with lattice point distance (d) and the incident diffraction angle (θ).
nλ = 2 d sinθ .
Different crystal plane in the crystal will diffract X-ray at different angle according to the
Bragg’s equation. By rotating the sample plane with respect to the incident X-ray therefore,
diffracted angles can be recorded by a detector and the diffraction pattern is obtained. The
identification of the sample structure can be done by comparing the spectrum with the pattern
stored in the database.
2.3.4 Scanning Electron Microscopy

36
Scanning electron microscope (SEM) is a type of microscope that uses electrons rather than
light to form an image. There are many advantages in using the SEM instead of a light microscope.
The SEM has a large depth of field, which allows a large amount of the sample to be in focus at
one time. The SEM also produces images of high resolution, which means that small spaced
features can be examined at a high magnification. Preparation of the samples is relatively easy
since most SEM instruments only require the sample to be conductive. The combination of higher
magnification, larger depth of focus, greater resolution, and ease of sample observation makes the
SEM one of the most heavily used instruments in present-day research. By using the wave-particle
duality, SEM creates the magnified images by using electrons instead of light waves. The SEM
shows very detailed 3-dimensional images at much higher magnifications than is possible with a
light microscope. The images created without light waves are rendered black and white. By the
nature of electron beam, a vacuum is required during the operation; therefore the sample has to be
prepared carefully to withstand the vacuum inside the microscope. The samples must be
conductive material in order to be able to interact with electron; SEM samples are coated with a
very thin layer of gold by a machine called a sputter coater. The sample is placed inside the
microscope's vacuum column through an air-tight door. After the air is pumped out of the column,
an electron gun emits a beam of high energy electrons. This beam travels downward through a
series of magnetic lenses designed to focus the electrons to a very fine spot. Near the bottom, a set
of scanning coils moves the focused beam back and forth across the specimen, row by row. As the
electron beam hits each spot on the sample, secondary electrons and back scattered electrons are
knocked loose from its surface. A detector counts these electrons and sends the signals to an
amplifier. The final image is built up from the number of electrons emitted from each spot on the
sample. By this way the morphology of the sample can be seen directly from the micrograph.

37
2.4 Use of Clay in Decolourizing and Refining Oil
Clay materials are used widely to decolourize oils. Decolourization is applied to mineral,
vegetable, and animal oils. Clay materials are used extensively to refine such oils as cotton seed,
soy, palm, and lard oils prior to the manufacture of soaps, paints, and various edible oils. The clay
may serve to deodorize, dehydrate, and neutralize as well as decolourize the oil, but
decolourization is generally the major objective of such processes. Clay may be used in
decolourizing and purifying processes in two ways. The oils may be filtered through a granular
product of 10 to 60 mesh particles, or the oil may be placed into contact with finely ground clay of
approximately –200 meshes; then the oil is separated from the clay by some sort of filter pressing
operations. The percolation process is essentially a low-temperature process, whereas the contact
process uses temperatures in the range of 300—6000 F.
2.4.1 Types of Clays used in Decolourizing
A wide range of clay materials have been used for decolourizing, ranging from fine grained
silts to clays composed of almost pure clay minerals. The materials may be substantially crude clay
or clay that has been prepared by chemical and physical treatment. In earlier times crude clays
called fuller’s earths were used. The name comes from the use of these clays in cleaning or fulling
wool. At the present time, the term fuller’s earth is applied to any clay that has adequate
decolourizing and purifying capacity to be used commercially in oil refining without chemical
treatment. It means nothing so far as the composition and origin of the earth is concerned. Various
silty materials have moderate decolourizing and adsorptive capacities that have permitted their use

38
in the past. It was soon found that many types of clay composed of Attapulgite and some
Montmorillonite possess superior decolourizing powers and such clays supplanted the silts. In the
preparation of these clays, they are dried at 400- 6000 F and ground to various sizes. The activity
of the Attapulgite clay can be substantially enhanced by extrusion under high pressure at low
moisture contents. So far as is known, Montmorillonite clays are not improved by such extrusion.
It is generally recognized that only some Montmorillonite clays possess substantial decolourizing
properties, and that this is not solely a matter of the purity of the Montmorillonite. The explanation
for this variation in the decolourizing ability of these clays is not known and they can be evaluated
only by actually decolourizing tests. Zvanut F. J. (1937)8 have shown that Halloysite clays may
have high decolourizing power. Kaolinite clay from southern Illinois has high decolourizing
power. Diaz F. et al (2001)21 have reported that unusual Illitic clay from Northern Illinois also has
high decolourizing power. Chambers, G. P. (1959)5 has indicated that some Sepiolite clays from
Spain are excellent decolourizing materials. So far as is known, however, at the present time only
Attapulgite and Montmorillonite clays are used commercially for decolourizing. It is well-known
that acid activation enhances the decolourizing power of some Montmorillonite clays several-fold.
2.4.2 Properties Required of Decolourizing Clays
For satisfactory use, the ability of the material to decolourize must be high, that is, a
relatively small amount of earth must have a large amount of colour reduction. In addition, the
earth must have low oil retention, that is, only a small amount of oil is retained by the earth in the
course of the decolourizing process. This property is particularly critical if the oil is of the sort that
cannot be reclaimed from the spent earth by the use of a solvent or by distillation. The clay must
have good filtration characteristics—in the percolation process there must be fairly rapid
movement of oil through the earth, and in the contact process the earth must not unduly bind the

39
filters. Any change in the composition or the character of the oil during the process of
decolourizing is very important. The change may be desired or may be detrimental, depending on
the particular oil and the desired use. In the case of edible oils, the earth must not impart an
obnoxious odour or taste to the oil.
2.5 Activated Carbon
Activated carbon, also called activated charcoal or activated coal, or carbo activatus, is a
form of carbon processed to be riddled with small, low-volume pores that increase the surface area
available for adsorption or chemical reactions. The term “activated” is sometimes substituted with
active.
Due to its high degree of microporosity, just one gram of activated carbon has a surface area in
excess of 500 m2, as determined by adsorption isotherms of carbon dioxide gas at room or 0.0 °C
temperature. An activation level sufficient for useful application may be attained solely from high
surface area, however, further chemical treatment often enhances adsorption properties.
All activated carbons contain some micropores, mesopores and macropores characteristics but
their proportions to one another vary substantantially depending upon the kind of starting material
and the production procedures29. The bleaching action seems to be due to the large adsorbent
surface of carbon. This large surface held in a small volume, would influence the surface tension
of the compounds with which it will come into contact, thus causing adsorption. There are a large
number of commercial grades of activated carbon that are used for adsorbing gasses and vapours,
odours and colouring materials30.

40
2.5.1 Production
Activated carbon is carbon produced from carbonaceous source materials such as nutshells,
coconut husk, peat, wood, coir, lignite, coal, and petroleum pitch. It can be produced by one of the
following processes:
2.5.2 Physical Reactivation
The source material is developed into activated carbon using hot gases. This is generally done by
using one or a combination of the following processes:
• Carbonization: Material with carbon content is pyrolyzed at temperatures in the range 600–
900 °C, in absence of oxygen (usually in inert atmosphere with gases like argon or
nitrogen)
• Activation/Oxidation: Raw material or carbonized material is exposed to oxidizing
atmospheres (oxygen or steam) at temperatures above 250 °C, usually in the temperature
range of 600–1200 °C.
2.5.3 Chemical Activation
Prior to carbonization, the raw material is impregnated with certain chemicals. The
chemical is typically an acid or a strong base, or a salt (phosphoric acid, potassium hydroxide,
sodium hydroxide, calcium chloride, and zinc chloride. Then, the raw material is carbonized at
lower temperatures (450–900 °C). It is believed that the carbonization / activation step proceeds

41
simultaneously with the chemical activation. Chemical activation is preferred over physical
activation owing to the lower temperatures and shorter time needed for activating material.
2.6 Pre-treatment – Degumming, Deodorization and Bleaching
2.6.1 Degumming Process
The main objective of this degumming is to remove the unwanted gums from the oil, which
will interfere with the stability of the final product in later stage. The objective is achieved by
treating the crude palm oil (CPO) with the specified quantity of food grade acid normally
phosphoric or citric acid of certain concentration. The main component contained in the gums,
which has to be removed, is phosphatide. It is vital to remove the phosphatide content in the crude
oil because the presence of this component will impart undesirable flavor and color, and shorten
the shelf life of oil. The phosphatides emulsifying action is the main culprit that causes the
oxidative instability of the crude palm oil (CPO). In this unit operation, the incoming crude palm
oil is first heated up to a temperature of about 90 oC – 110 oC before it is treated with phosphoric
acid. The dosage of phosphoric acid normally used is within the range of 0.05 – 0.1 % of oil
weight with acid concentration approximately about 80 - 85 %. It is meant to decompose the non-
hydratable phosphatides as well as to coagulate the phosphatides making them insoluble and thus
easily removed during bleaching. Excessive amount of phosphoric acid needs to be avoided as it
may cause rise in phosphorus acid and this excessiveness may be difficult to be removed and
contribute to further refining problems.

42
2.6.2 Deodorisation
The filtered Deodorised Bleached Palm Oil (DBPO) is then channeled into the deodorizer
for the deacidification and deodorisation treatment. This process utilizes a combination of high
temperature heating approximately about 240 – 260 oC, under vacuum (2 – 4 mmHg) and direct
steam injection of about 2.5 - 4.0 % by weight of oil31. During this deodorization process, free fatty
acid (FFA) in the form of palm fatty acid distillate (PFAD) is removed as refining waste at the
upper section of deodorizer. Apart from FFA, carotenoid pigment, primary and secondary
oxidation products are also being removed as it may contribute to off-flavour. The deodorized oil
is then cooled before it is filtered by means of a polishing filter and sent to storage tanks.
2.6.3 Bleaching Process
During bleaching process in palm oil refinery, degummed oil is treated with bleaching
earth and heated up to a temperature of about 100 oC before entering the vacuum bleacher. The
dosage of acid activated clay used is typically within the range of 0.5 – 2.0 % by weight of oil and
the contact time with continuous agitation is about 30 minutes.
During this stage, trace metal complexes such as iron and copper, pigments, phosphatides and
oxidation products are removed by adsorptive effect of the bleaching earth. Any residual of
phosphoric acid are removed during this stage too. The bleached oil is then filtered on industrial
filters such as plate and frame filter press or vertical leaf pressure filter.
2.7 Degumming
Technically, degumming is referred as an operation of purification of seed oils, which
normally contain impurities in the colloidal state or dissolved in them31. Fats and oils contain
43
complex organo-phosphorus compound referred to as phospholipids (phosphatides) or more
usually, as gums. Phospholipids should be removed because of their strong emulsifying action and
if they are not removed, the oil will go through undue darkening during deodorization at high
temperature32. The phospholipids (phosphatides) are removed during processing by a variety of
treatments collectively referred to as degumming. The treatment usually involves hydration with
water, orthophosphoric acid, and polybasic organic acids either singly or in combination, followed
by centrifuging the precipitated material.
2.7.1 Types of Degumming
There are 6 types of degumming process in vegetable oil industry. The differences between
all these types are based on methods of processing, chemicals used and the content of phosphatides
in the crude vegetable oil. The types of degumming process are as follows;
2.7.1.1 Dry Degumming
Dry degumming process involves the removal of gums through precipitation by acid
conditioning and via filtration during the bleaching process, not via centrifugal separation. This
process is used for low-phosphatides oil such as palm oil, lauric oils, edible tallow and suitable to
be used for preparing oils for subsequent physical refining. This type of process eliminates
bleaching, as separate processing step, thus, it is cost-advantageous and it is a well-proven process.

44
LOW PHOSPHATIDE OIL
Figure 2.1: Schematic Diagram of Dry Degumming
2.7.1.2 Water Degumming
Water degumming is a process of removing gums through precipitation by pure water
hydration of crude oil via centrifugal separation. This method is used when extracting gums for
production of lecithin, soybean oil and for crude oil with 200 ppm phosphorus content. In this
process, water is the main agent used to remove the hydratable phosphatides from vegetable oils
and it can be carried out in batch or continuous procedure depending on the type of the oil to be
degummed and amount of oil to be processed. This process is insufficient to be used for
subsequent physical refining.
Mixing
Bleaching
Mixing
Filtration
Heating 90 -100 0C
Under Vacuum
Dry-Degummed Oil
Spent Earth
Phosphoric Acid
Bleaching Earth

45
Figure 2.2: Schematic Diagram of Water Degumming
2.7.1.3 Acid Degumming
In this acid degumming process, gums are precipitated by some form of acid conditioning
process and subsequently removed by centrifugal separation. In this process method, the gums can
be hydrated at temperature higher than 40 oC and the process may lead to dewaxing which is
usually associated with processing of sunflower and rice brand oils. In organic refining process,
dilute organic (citric) acid is normally used and the removal of residual phosphatides is by
bleaching using silica hydrogel.
Crude Oil
Water Degummed Oil
Mixing
Separating
Holding
Drying
Heating 80 -100 0C
Water 15 -30 Minutes
Wet Gums
Drying
Commercial Lecithin

46
Figure 2.3: Schematic Diagram of Acid Degumming
2.7.1.4 Enzymatic Degumming
Enzymatic degumming is a special degumming that is enhanced by using some food-grade
enzymes. Types of oil that uses this process method are soybean oil and rapeseed oil. The
advantage of enzymatic degumming is that no soap stock is produced so there are no oil losses due
to soap stock separation.
2.7.1.5 EDTA- Degumming
EDTA degumming is a physico-chemical degumming process. It involves a complete
elimination of phospholipids by a chelating agent, Ethylene Diamine Tetraacetic Acid (EDTA), in
the presence of an emulsifying additive.
Crude oil
Mixing
Separating
Holding
Drying
Heating >40 0C
Acid degummed Oil
Gums
Citric Acid/Dilute Acid

47
Figure 2.4: Schematic Diagram of EDTA Degumming
2.7.1.6 Membrane Degumming
Membrane degumming process is usually used in extraction plant. According to Lin L. et.
al. (1997)33, membrane separation is primarily a size-exclusion-based, pressure-driven process. It
separates different components according to the molecular weight or particle sizes and shapes of
individual components and dependent on their interactions with membrane surfaces and other
components of the mixture. During oil processing, miscella, which contain 25-30 % of crude oil
and 70- 75 % hexane are obtained from extraction prior to solvent removal. Phospholipids can be
separated from triglyceride in the miscella stage using appropriate membrane. The membrane-
based crude oil degumming produces permeate and retentate containing triglyceride and
phospholipids, respectively. The majority of the coloring materials and some of the FFAs and
other impurities are included in phospholipids micelles and are removed as well33. This processing
method is typically used for cottonseed oil.
Crude oil
Mixing
Separating
Holding
Drying
Heating 75-80 0C
EDTA-Degummed Oil
Gums
EDTA (Wetting Agent)
20 - 30 Minutes

48
2.7.2 Process Theory of Degumming
Phospholipids, proteins and carbohydrates, vegetable gums and colloidal components have
negative influence towards the storage of oil. They are considered as undesirable substances in
refining because they increase the oil loss and hamper other operations. Oils that have certain
amount of these substances should be degummed in order to remove all those substances. There
are two kinds of phospholipids that exist, those that are hydratable and those that cannot be
hydrated (non-hydratable phosphatides -NHP). Hydratable phospholipids can be removed easily by
the addition of water where the process can be conducted rapidly at elevated temperature or slowly
at low temperature. However, the temperature should stay below the temperature at which the
phospholipids hydrate starts to become liquid crystals (usually ~ 40 oC). By taking up water,
phospholipid lose their lipophilic character and become lipophobic and thus precipitate from oil34.
Whereas, for non-hydratable phospholipids, they have to be converted to hydratable ones. The
conversion of non-hydratable phospholipids to hydratable is done usually through acidulation
followed by neutralisation. Traditionally, acids that are being used are usually sufficiently strong to
hydrate phospholipids without hydrolyzing the triglycerides. At present, citric or phosphoric acid
is normally used for any type of vegetable oil. However, phosphoric acid is more preferred by the
palm oil refiners because of lower unit cost and easier handling35.

49
Table 2.1: Composition of Phospholipids of Palm Oil (mole %)
Phospholipid Percentage
Phosphatidylcholine (PC) 36
Phosphatidylethanolamine (PE) 24
Phosphatidylinositol (PI) 22
Phosphatidylglycerol 9
Disphosphatidylglycerol 4
Phosphatidic Acid (PA) 3
Lysophosphatidylethanolamine 2
Phosphatidylserine Trace
Lysophosphatidylcholine Trace
Phospholipids are present in relatively small quantities of about 5 – 130 ppm in palm oil as
compared with other vegetable oils. Sambanthamurthi R. et. al. (1991)36 mentioned that the
solvent extracted mesocarp oil usually contained 1000-2000 ppm phospholipids , however it is
only present at level of 20-80 ppm in commercial crude palm oil. Phospholipids have been
reported to show antioxidant effects. Their antioxidant-synergistic effects can be attributed to the
sequestering of soluble pro-oxidant metal ions to form inactive species. Hudson and Maghoub also
showed a synergism between phospholipids and naturally occurring antioxidants such as α-
tocopherol and quercetin. Hydratable insoluble metal ions can also be dispersed by phospholipids
through miscellar action. Since phospholipids and glycolipids cause reverse micelle, vesicle or
emulsion droplet formation, phospholipids can remove metal ions and their hydrophilic salts from
the lipid phase to reduce oxidation.

50
2.8 Bleaching
The term bleaching refers to the treatment that is given to remove colour producing
substances and to further purify the fat or oil. The usual method of bleaching is by adsorption of
the colour producing substances on an adsorbent material. There are lot of adsorbent materials that
are used in vegetable oil industry, for examples, acid activated bleaching earth, natural bleaching
earth, activated carbon and synthetic silicates. Acid activated bleaching earth (fuller’s earth) or
clay, sometimes called bentonite, is the adsorbent material that has been used most extensively.
This substance consists primarily of hydrated aluminium silicate. Usually, bleaching earth does not
remove all the colour producing materials, much of which are actually removed by thermal
destruction during the deodorization process.
Fig. 2.6: Adsorption Mechanism
51
2.8.1 Types of Bleaching Methods
There are three types of bleaching methods that can be used in the edible oil industry, (Gunstone F.
D. (1983)37). They are described below:
2.8.1.1 Heat Bleaching
Some pigments, such as the carotenes become colorless if heated sufficiently. However this
will leave the pigment molecules in the oil and may have adverse effect on oil quality. According
to Gunstone F. D. (1983)37, if this oil comes into contact with air. colored degradation products
such as chroman-5,6-quinones from γ- tocopherol present, may be formed. These are very difficult
to remove.
2.8.1.2 Chemical Oxidation
Some pigments for example carotenoids are made colorless or less colored by oxidation.
But such oxidation invariably affects the glycerides and destroys the natural antioxidants.
Consequently, it is never used for edible oil but restricted to oils for technical purposes, such as
soap-making
2.8.1.3 Adsorption
Adsorption is the common method usually used for bleaching the edible oil by using
bleaching agents. Examples of bleaching agents are bleaching earths, activated carbon and silica
gel. Bleaching agents normally posses a large surface that has a more or less specific affinity for
pigment-type molecules, thus removing them from oil without damaging the oil itself
2.8.2 Palm Oil (Elaeis guineensis)
In 1434, a Portuguese sailor, Gil Eannes first reported about oil palms (Elaeis guineesis)34.
Today, they flourish mainly in the western part of Africa, Indonesia, and Malaysia and most

52
recently in Brazil and Colombia. Oil palm tree grow up to 20 m in height and grow best at
temperature of 24 – 27 oC. Oil palm tree requires a humid climate and the cultivated oil palm
carries fruits from their fourth year onward and can be harvested for 40 – 50 years34. Palm oil is
derived from the fleshy part or the mesocarp of the fruit of the palm species Elaeis guineesis. The
commercial value of this crop mainly lies in the oil that can be obtained from the mesocarp of the
fruit- palm oil and the kernel of the nut- palm kernel oil. In fact, oil palm is the only fruit that can
give these two types of oil. Both are edible oils but with very different chemical composition,
physical properties and applications. As mentioned, the oil palm produces two types of oils, palm
oil from the fibrous mesocarp and palm kernel oil from the palm kernel. Palm oil and palm kernel
oil have a wide range of applications; about 80% are used for food applications while the rest is
feedstock for a number of non-food applications39. Among the food uses, refined, bleached and
deodorized (RBD) olein is used mainly as cooking and frying oils, shortenings and margarine
while RBD stearin is used for the production of shortenings and margarine. RBD palm oil, which
is the un-fractionated palm oil, is used for producing margarine, shortenings, vanaspati, frying fats
and ice cream39.
2.8.2.1 Composition and Constituents of Crude Palm Oil (CPO)
Salmiah A. (2000)39 stated that crude vegetable oil commonly consists of desirable
triglycerides, unsaponifiable matter together with small amount of impurities. Most of these
impurities contribute undesirable effects to the oil, for instance, colour, flavor, odour, instability
and foaming. These impurities should be removed by a purification step in order to produce good
quality refine oil with minimal possible oil loss or damage to the oil and desirable materials such
as tocophenols and carotenes. The compositions of crude palm oil can be classified as a mixture of
five main chemical groups40. They are oil, oxidized products, non-oil (but oil soluble), impurities,

53
water soluble. Some of these chemical groups need to be removed partially or completely through
the refining process in order to produce good edible oil that has better stability and storage. Thus,
in palm oil refineries the CPO produced undergoes degumming, bleaching and deodorization in
order to obtain refined, bleached and deodorized palm oil (RBDPO).
2.9 Survey of Related Works
Onukwuli et. al. (1995)41 reported that the bleaching or adsorptive properties of Nigerian
local clays can be improved by thermal and acid activation. They also found that the bleaching
performance of the clays, measured in terms of the percentage colour reduction of palm oil
depended on the temperature and length of time of activation, with Ukpor clay giving the highest
colour reduction (92 %), while that of acid activated clays depended on the acid used, the type of
clay, acid concentration, temperature, time of activation, and quantity of the acid relative to clay.
They established that Nsu clay was not easily activated by thermal and acid activation, and that
HNO3 was not suitable as an activating agent for the clays investigated. The acids used were
H2SO4, HCl, and HNO3 and it was concluded that H2SO4 gave the best bleaching ability at a low
concentration of 0.5 M with 82 % maximum colour reduction, followed by HCl at a concentration
of 1M with 58 % colour reduction while HNO3 gave the lowest at a concentration of 2.5 M with
about 32 % colour reduction.
Okwara and Osoka (2006)42 in their work using sodium hydroxide (NaOH) as the
activating agent found out that local clay from Mbano, Ohaozara, and Bauchi can be activated with
the alkali at various concentrations. They concluded that the clay from Mbano (kaolin) can be
activated using 3 M of NaOH to give a maximum colour reduction of 76.38 %, clay from Bauchi
(Fuller’s earth) could be activated with 2.9 M NaOH solutions to give a maximum colour

54
reduction of 80.69 %, while the clay from Ohaozara (Bentonite) could be activated with 1M NaOH
to give a maximum colour reduction of 78.66 %. They also estimated that the percentage colour
reduction of the clays from Mbano and Bauchi could be adequately modeled using a third order
polynomial with correlation coefficient of unity within the range of the experimental data, while
that of Ohaozara could be modeled using a logarithmic function with a correlation coefficient of
0.9866.
Salawudeen et. al. (2007)43 reported that acid activation increased the bleaching power of
Nigerian clays and that hydrochloric acid activated clays proved more effective than those of
sulphuric acid. They also reported that the bleaching efficiency increased with increase in the
concentration of the acids irrespective of the type and that the optimal concentration lies in the
range of 35 % and 45 %, while the clay dosage for the bleaching process was in the range between
5 to 10 % mass of the oil.
Nnadozie et. al. (1989)44 investigated the applicability of local clays from Nsu and Okija
areas of Eastern Nigeria in the bleaching of Nigerian crude palm oil. They reported that the clays
from Okija possess some potential as an adsorptive cleanser in the refining of the said crude palm
oil when activated with various concentrations of sulphuric acid. They found out that best result
was obtained when 3 M H2SO4 was used in the activation of Okija clay while the Nsu clay showed
little or no effect at such concentration. The comparison of Okija with an imported bentonite
purchased from Baroid Nigeria limited, Warri, showed that the Okija clay can compete favourably
with imported bleaching earth.

55
Makhoukhi et. al. (2009)45 studied the acid activation of Algerian bentonite by means of 33
factorial designs. They concluded that the acid concentration and activation time influenced greatly
the bleaching capacity of the investigated bentonite, while the temperature exerted no significant
individual effect on the activation. They also reported that the investigated process parameters
exert binary interactions and that the highest bleaching capacity was found to be 99 % under
optimum activation conditions of acid concentration (34 %), contact time (7 h), and temperature
(90 oC).
James et. al. (2008)46 investigated the bleaching performance of a Nigerian Yola bentonite.
They found out that the bleaching performance was enhanced upon activation and that the
predominant active sites on the raw clay are Lewis acid sites, while those on the activated clay are
Bronsted acid sites. They also reported that the best bleaching performance was obtained with clay
sample activated with 5M H2SO4 at acid/clay ratio of 0.7, bleaching temperature of 120 oC and at
10 minutes stirring time.
Nde-Aga et. al. (2007)47 investigated the adsorption of carotene and free fatty acid from
palm oil onto activated Cameronian clay, activated with sulphuric acid. They reported that the time
required to attain adsorption equilibrium decreased as the temperature increased and that the clay
activated with 1M sulphuric acid solution was the most efficient in the adsorption experiment.
They found out that the Freundlich equation is applicable to the adsorption isotherm and the
Brimberg model used to determine the activation energy of the adsorption process gave the values
72 ± 11, 74 ± 11, and 37 ± 6 kJ/mol, for 0.5, 1, and 2M H2SO4 activated clays, respectively.
CHAPTER THREE
EXPERIMENTAL

56
3.1 Modification of Clay by Chemical Activation
The clay sample was obtained on 24th February, 2014. The clay was mined at Achallaku
village, Nteje, Oyi local government area of Anambra state. The clay was ground to fineness, and
then activated. Activation was done using 45 % hydrochloric acid (HCl). 200 g of the ground clay
sample was charged into a 500 ml beaker and slurry of it was made with distilled water. The
activation was carried out by adding the 45 % HCl to the clay slurry and the mixture was boiled for
90 minutes at a regulated temperature of 100 oC. After slow cooling, the slurry was filtered
through a big filter paper. The filtered clay was thoroughly washed with distilled water and re-
filtered to remove the residual acid used in the activation. The sample was then dried in an oven
until the weight of the clay remained constant. The lumps of the activated dried clay was re-ground
using a morter and pestle. Both the activated and the unactivated clay samples were sieved to an
extreme Geologic fineness known as silt.
3.2 Physical and Chemical Characterization of Nteje Clay
3.2.1 Surface Area Measurement: The surface area of each adsorbent was determined according
to the method of Inglethorpe S. D. J., (1993)48. In the process, 1.5 g of each adsorbents was
agitated in 100 ml of HCl that has been diluted to pH of 3. Then 30 g of NaCl was added while
stirring the suspension. The volume was then made up to 150 ml with de-ionized water resulting in
the change of the pH to 4. 0.10 N NaOH was used to raise the pH from 4 to 9 and the volume of
NaOH used, V; recorded. The surface area was then calculated using the equation:
S = 32V – 25 3.00
Where, S is the surface area (m2/g)

57
3.2.2 Bulk Density: The bulk density was carried out according to the method described by Nde-
Aga, B. J. et .al. (2007)49. Done by the tapping procedure. A known weight of each sample after
being dried at 105 0C, was charged into a 10 ml capacity graduated cylinder. The bottom of the
cylinder was tapped gently on the laboratory bench top several times until there was no further
diminution of the sample level. The bulk density was then calculated using the equation below;
Bulk Density (g/ml) = Wmat/Vmat 3.10
Where, Wmat is the weight of the dry material (g) and Vmat is the volume of the dry material (ml).
3.2.3 Specific Gravity: The specific gravity of the clay samples were determined as specified by
the British Standard BS 1377:90. A 50 ml density bottle with the stopper on was dried in an oven
and weighed (m1). Twenty five grams of the samples were oven-dried at105 oC for 24 hours. The
samples were transferred into the density bottle and the bottle with its content and the stopper
weighed again (m2). Then the sample in the bottle was covered with kerosene of known specific
gravity. With the stopper removed, the container was placed in a vacuum dessicator, and the air
gradually evacuated. When no more air was seen to be released, the bottle was removed from the
dessicator and filled with de-aired kerosene. The stopper was again inserted and the bottle
immersed in a water bath until a constant temperature of 25 oC was attained. The bottle was then
wiped dry and weighed (m3). The bottle was afterwards emptied of its contents, cleaned and
completely filled with kerosene, covered with stopper and re-weighed (m4). The specific gravity
(Gs) of the sample was calculated as:
�� = ��(� ��� �)�� ��� ���(� ��� �)
3.11
�� = Specific gravity of kerosene = 0.80

58
3.2.4 Oil Retention: This was done according to the method described by Achife, E. C et al
(1989)50. One hundred grams of oil and 10 g of each of the samples were mixed together and heated
up to 120 oC for 5 minutes. The mixture was filtered using a vacuum system for 30 minutes. The
filtered cake was then weighed. The percentage oil retention was calculated as:
% OR = Wc [(100 - % H2O in Cake) – 10 (100 - % H2O in Clay)]/ 10 3.12
Where OR represents oil retention, Wc is the weight of cake (g). The percentage of H2O in cake
and in clay was determined by drying them in an oven at 110 oC until a constant weight was
attained.
3.2.5 pH and Acidity Measurement: 10 g of each clay samples were added to 100 ml of distilled
water. The mixture was stirred vigorously. The pH of the clay suspension was then measured via
pH meter. In the acidity test, 10 g of clay was boiled for 3 minutes with 10 ml distilled water then
filtered and washed with another 100 ml of distilled water. The combined filtrate and washed
liquid were then titrated with 0.1 N NaOH solutions to phenolphthalein end point.
The acidity was then calculated as percentage weight of NaOH per gram as:
Clay Acidity = [(V x N x 40) / Wc] x 100 3.13
Where V is the volume of sodium hydroxide used in titration (ml), N is normality of sodium
hydroxide and W is weight of clay (g).

59
3.2.6 Cation Exchange Capacity (CEC): This was done according to the method described by
Dias M. I. et. al. (2003)51. Five grams of the clay sample was weighed into the 250 ml polythene
bottle with a magnetic stirrer. The bottle and its content was weighed (M1). One hundred millilitres
of buffered barium chloride solution was added to the bottle and was placed on a magnetic stirring
plate and agitated for 1 hour. At the end of the period, the bottle was centrifuged at 1500 rpm for
15 minutes and the supernatant solution was discarded. Further 200 ml of the buffered barium
chloride solution was added and the mixture was agitated on a magnetic stirring plate for another 1
hour. The bottle and its contents were left overnight. The following day, the bottle and its contents
were centrifuged at 1500 rpm for 15 minutes and the supernatant solution discarded. Two hundred
millilitres of distilled water was added and agitated for few minutes on the magnetic stirring plate.
It was centrifuged for further 15 minutes and the supernatant solution discarded. The bottle and its
content was weighed (M2). One hundred millilitres of MgSO4 solution was pipette into the bottle
and stirred well and was left to stand for 2 hours with occasional agitation on the magnetic stirring
plate. After 2 hours the content was centrifuged at 1500 rpm for 15 minutes and the supernatant
solution decanted into the stoppered bottle. Five millilitres aliquot of this solution was pipetted into
a 100 ml conical beaker and 5 ml of ammonia buffer and 6 drops of indicator were added to it.
This mixture was titrated with standard EDTA (titer A1 ml). Another titration was done with a 5 ml
of aliquot of 0.05 M MgSO4 solution (titer B ml). The end point was indicated by a blue to pink
colour change. The cation exchange capacity was calculated as follows:
CEC = 8{B – ([A1 x (100 + M2 – M1)] / 100)} meg/100 g 3.14
Where M1 = weight of bottle plus dry content (g)
M2 = weight of bottle plus wet content (g)

60
A1 = titration end-point of sample (ml)
B = titration end-point of MgSO4 solution (ml)
3.3 Pre-treatment – Degumming and Neutralisation
3.3.1 Degumming Process: The oil used for degumming and bleaching was obtained at Ogige
market, Nsukka on the 25th of February, 2013. One thousand millilire of melted crude palm oil
(CPO) was accurately measured into a 3000 ml beaker. The oil in the beaker was then heated to a
temperature of 40 oC. Phosphoric acid, 1 % of the oil weight was then added to the oil with
adequate stirring. The oil was later left to stand to enable the precipitation and settlement of the
phosphatide (gums) and subsequent separation of same. The degummed oil was stored for further
use.
3.3.2 Neutralisation: The acid degummed oil was neutralized by adding an alkali of 1.7 M. 0.5
cm3 of sodium hydroxide (NaOH) solution was used per gram of degummed oil charged. The
mixture was then stirred at a regulated temperature of 75 oC for 20 minutes to break the emulsion
formed. Two layers were formed after centrifuging, oil and soap. The soap stock was then filtered
off and the neutralized oil was stored for the next phase of the bleaching process.
3.4 Bleaching Process
Bleaching of the degummed-neutralized oil was carried out according to the method
described by Preeti S. N., et. al. (2007)52. Fifty grams of the degummed-neutralized palm oil was
charged into a 250 ml beaker and then heated up to 100 oC on a magnetic hot plate. The dosage of
the bleaching earth fed at each charge was 10 % of the oil weight. At the end of the bleaching
process, the content of the flask was filtered with a Whatmann filter paper at a regulated
temperature of 30-35 oC to allow for ease of filtration at the end of each bleaching process, and the
61
concentration of pigment of filtrate was determined. The absorbance of the palm oil was measured
using a UV Spectrophotometer. The samples were diluted in hexane to a concentration of 10 %
(v/v), and the absorbances of the samples were determined at a wavelength of 450 nm. The
absorbance of the unbleached palm oil was also measured, to enable the calculation of the amount
of pigment adsorbed at each run. The bleaching performance of the adsorbents was determined
using the equation:
������ �� �����ℎ��� �%�= 100 − ���������� �� �������� ��� ���������� ���������� �� ����� ��� ���
× 100 3.15
3.5 Adsorption kinetics
The kinetic models used in the analysis of the data are as follows: pseudo-second order,
Elovich and power function equations. The respective linear forms of the equations are as given
below:
� ��� = 1����
�� + � ��� – Pseudo − second order 3.16
�� = �1�� �ln����+ �1
�� ����− Elovich model 3.17
���� = ���� + ����� - Power function equation 3.18
qt = q = adsorption capacity at time (t)
qe = adsorption capacity at equilibrium
K = rate constant for pseudo-second order model
(gmg-1 min-1)
α = initial adsorption rate (mg/min)

62
β = is related to the extent of surface coverage and the activated
energy for chemisorption (g/mg)
a & b = power function constants
t = time in seconds
3.6 Adsorption Isotherms
The Freundich and Langmuir equations as reported by Ho, Y. S. et. al (2000)53 were used
for isotherm study. Freundlich adsorption equation is given as: ��
= ���� 3.19
Taking log of both sides gives
log ��
= ���� + ������ 3.20
Where, x = the amount of substance adsorbed, m = the amount of adsorbent (clay), Xe = the
residual amount at equilibrium which is mathematically equal to 1 – x. The plot of log x/m versus
log �� gives n as slope and log K as intercept.
Langmuir adsorption equation is given as
��/�
= ��
+ ��
�� 3.21
Where, a and b are Langmuir constants. The plot of Xe/(x/m) versus Xe was used to evaluate the
values of a and b.
3.6 Adsorption thermodynamics

63
Thermodynamic behavior of the adsorption process was evaluated by the following
thermodynamic parameters including the change in free energy (ΔG), enthalpy (ΔH), and entropy
(ΔS).These parameters were obtained using the equation:
∆�� = − ������ 3.22
where ∆�� is the standard free energy change (J/mol), R the universal gas constant (8.314 J/mol
K), and T is the absolute temperature (K). Considering the relationship between ∆�� and ��,
change in equilibrium constant with temperature can be obtained in the differential forms.
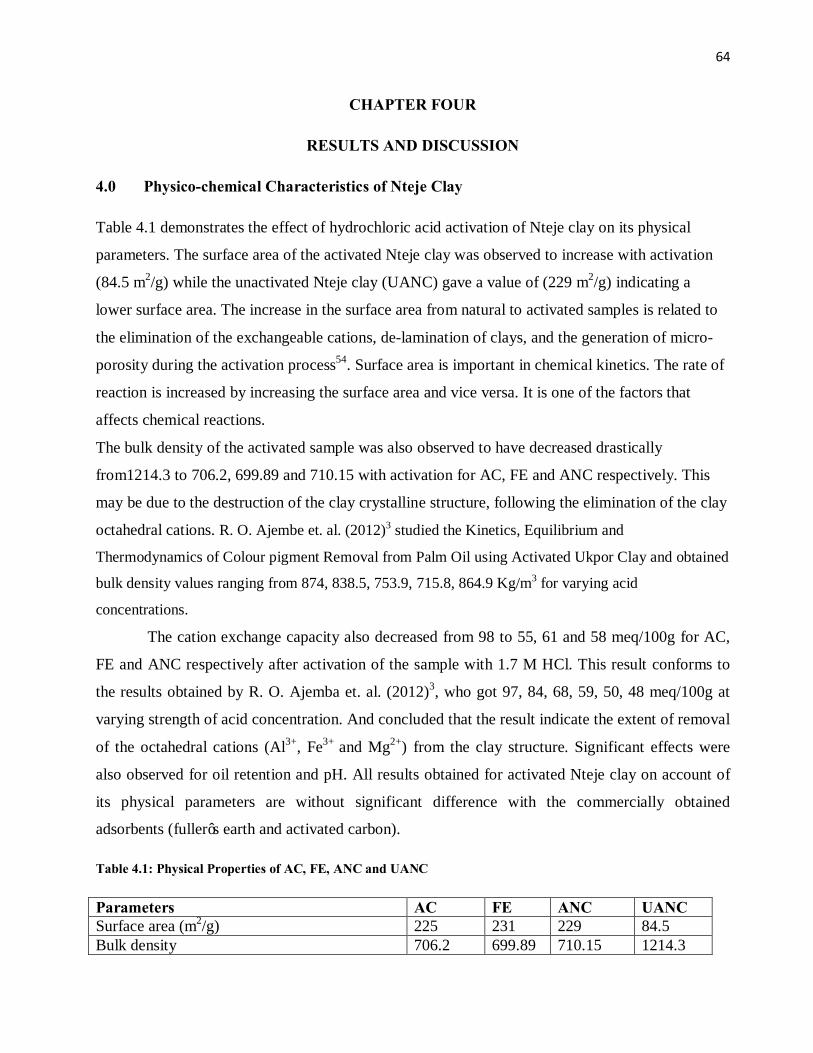
64
CHAPTER FOUR
RESULTS AND DISCUSSION
4.0 Physico-chemical Characteristics of Nteje Clay
Table 4.1 demonstrates the effect of hydrochloric acid activation of Nteje clay on its physical
parameters. The surface area of the activated Nteje clay was observed to increase with activation
(84.5 m2/g) while the unactivated Nteje clay (UANC) gave a value of (229 m2/g) indicating a
lower surface area. The increase in the surface area from natural to activated samples is related to
the elimination of the exchangeable cations, de-lamination of clays, and the generation of micro-
porosity during the activation process54. Surface area is important in chemical kinetics. The rate of
reaction is increased by increasing the surface area and vice versa. It is one of the factors that
affects chemical reactions.
The bulk density of the activated sample was also observed to have decreased drastically
from1214.3 to 706.2, 699.89 and 710.15 with activation for AC, FE and ANC respectively. This
may be due to the destruction of the clay crystalline structure, following the elimination of the clay
octahedral cations. R. O. Ajembe et. al. (2012)3 studied the Kinetics, Equilibrium and
Thermodynamics of Colour pigment Removal from Palm Oil using Activated Ukpor Clay and obtained
bulk density values ranging from 874, 838.5, 753.9, 715.8, 864.9 Kg/m3 for varying acid
concentrations.
The cation exchange capacity also decreased from 98 to 55, 61 and 58 meq/100g for AC,
FE and ANC respectively after activation of the sample with 1.7 M HCl. This result conforms to
the results obtained by R. O. Ajemba et. al. (2012)3, who got 97, 84, 68, 59, 50, 48 meq/100g at
varying strength of acid concentration. And concluded that the result indicate the extent of removal
of the octahedral cations (Al3+, Fe3+ and Mg2+) from the clay structure. Significant effects were
also observed for oil retention and pH. All results obtained for activated Nteje clay on account of
its physical parameters are without significant difference with the commercially obtained
adsorbents (fuller’s earth and activated carbon).
Table 4.1: Physical Properties of AC, FE, ANC and UANC
Parameters AC FE ANC UANC Surface area (m2/g) 225 231 229 84.5 Bulk density 706.2 699.89 710.15 1214.3

65
(kg/m3) Cation exchange capacity (meq/100g) 55 61 58 98 Oil retention (%) 50.9 52.6 52.8 30 pH 1.5 1.7 1.4 7.3
4.1 FTIR Characterization
Fourier Transform Infra-red (FTIR) analysis of the raw and activated material were
investigated, to study the effect of acid activation on the clay and help in the identification of
various forms of the minerals present in the clay samples. Both the spectra of the raw and acid
activated Nteje clay are presented in Figures 4.1 and 4.2 respectively. The coupled vibrations are
appreciable due to the availability of various constituents. In the IR study of the clays, the Si-O
stretching vibrations were observed at 445.57 cm-1, 559.38 cm-1, 565.16 cm-1, 783.13 cm-1, and
788.91 cm-1 showing the presence of quartz in the clay samples. The appearance of v (Si-O-Si) and
δ (Si-O) bands also support the presence of quartz[55], a strong band at 3694.77 cm-1, 3692.84 cm-1,
3623.4 cm-1, 3442.8 cm-1, 3432.44 cm-1, and 3419.9 cm-1 indicate the possibility of the hydroxyl
linkage. However, broad band at 3449.8 cm-1, 3432.44 cm-1, 3419.9 cm-1, and band at 1643.41 cm-
1, 1641.48 cm-1, and 1639.55 cm-1 in the spectrum of the clay suggests the possibility of water of
hydration in the samples. Most of the bands such as 3694.77 cm-1, 3692.84 cm-1, 3623.4 cm-1,
1066.67 cm-1, 1046.42 cm-1, 1037.74 cm-1, 920.08 cm-1, 788.91 cm-1, 783.13 cm-1, 525.62 cm-1,
518.87 cm-1, 472.58 cm-1 show the presence of Kaolinite. The vibrations observed at 525.62 cm-1,
518.87 cm-1, and 472.58 cm-1 indicate the possibility of the presence of montmorillonite3. The
presence of bands at 3694.77 cm-1, 3692.84 cm-1, 3623.4 cm-1, 3449.8 cm-1, 3432.44 cm-1, 3419.9
cm-1, 2376.38 cm-1, 1643.41 cm-1, 1641.48 cm-1, 1639.55 cm-1, 1066.67 cm-1, 1046.42 cm-1,
1037.74 cm-1 and 792.77 cm-1 indicate the possibility of the presence of parlygorskite3, whereas
3623.4 cm-1, and 998.2 cm-1 are indicative of gypsum and 70 690.54 cm-1 shows the possibility of
the presence of dickite.
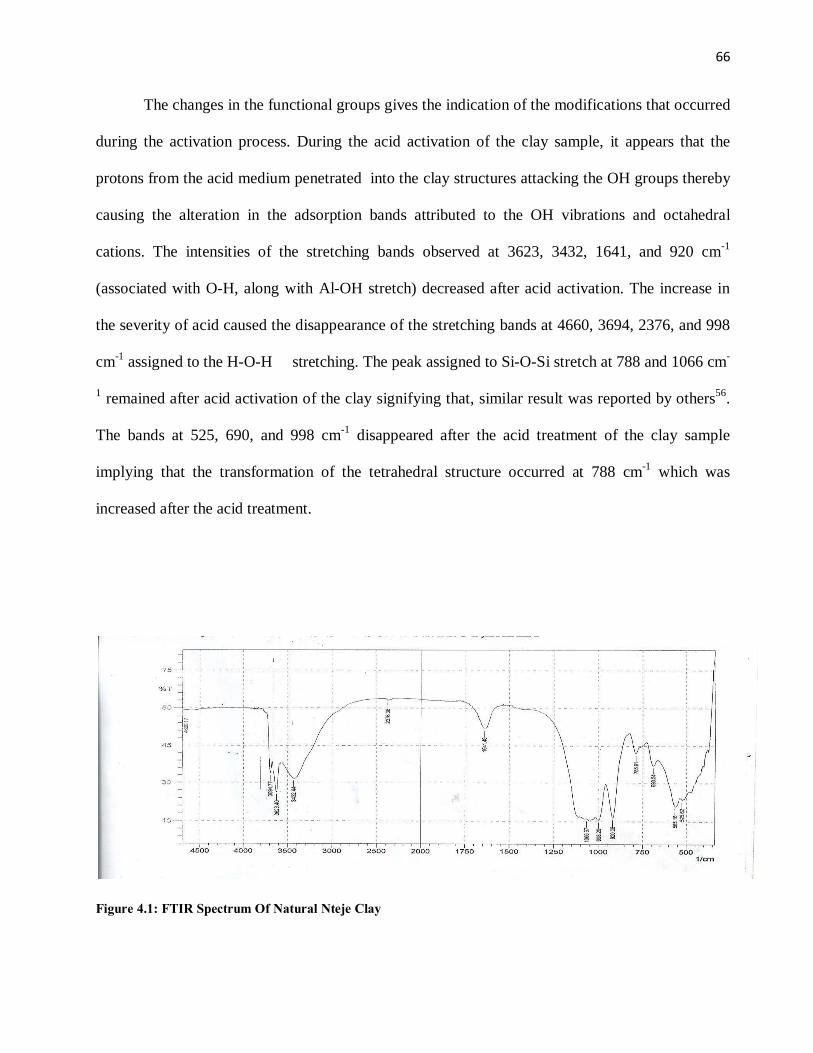
66
The changes in the functional groups gives the indication of the modifications that occurred
during the activation process. During the acid activation of the clay sample, it appears that the
protons from the acid medium penetrated into the clay structures attacking the OH groups thereby
causing the alteration in the adsorption bands attributed to the OH vibrations and octahedral
cations. The intensities of the stretching bands observed at 3623, 3432, 1641, and 920 cm-1
(associated with O-H, along with Al-OH stretch) decreased after acid activation. The increase in
the severity of acid caused the disappearance of the stretching bands at 4660, 3694, 2376, and 998
cm-1 assigned to the H-O-H stretching. The peak assigned to Si-O-Si stretch at 788 and 1066 cm-
1 remained after acid activation of the clay signifying that, similar result was reported by others56.
The bands at 525, 690, and 998 cm-1 disappeared after the acid treatment of the clay sample
implying that the transformation of the tetrahedral structure occurred at 788 cm-1 which was
increased after the acid treatment.
Figure 4.1: FTIR Spectrum Of Natural Nteje Clay

67
Figure 4.2: FTIR Spectrum Of Activated Nteje Clay
4.2 XRD Analysis
Table 4.2 is the X-ray Diffraction (XRD) analysis of powdered Nteje clay which was done
at Physics Advanced Laboratory, Sheda Science and Technology, Sheda, FCT, Abuja. The XRD
analysis was necessary in order to obtain information on the mineral composition of the clay, to
enable its comparison with the mineral compositions of the commercially available activated
carbon and fuller’s earth. The XRD analysis of Nteje clay reveals that its composition are of four
minerals namely: Dickite, Kaolinite, montmorillonite and palygorskite. Dickite, kaolinite, nacrite
and halloysite have the same composition but with different crystalline structure (Polymorph).
These compositions of Nteje clay will not exactly compare with the compositions of the imported,
commercially available fuller’s earth and activated carbon. Variance in the composition of these
adsorbents, does not affect their bleaching efficiencies. According to Siew W. L. (1991)57 analysis
of various samples of fuller’s earth varies so greatly that chemical analysis is no more a criterion in
determining whether or not a particular clay shall be classified as a fuller’s earth. Like all other
clays, fuller’s earth is hydrous, aluminium silicate containing small proportions of other
substances. Most fuller’s earth materials contain a higher percentage of water than most clays, but

68
this water is not an essential factor in the bleaching properties of all fuller’s earth materials; some
bleach fully as well after they have been driven off of their water as before, and others lose much
of their bleaching power when this water is removed. To determine whether or not a particular clay
is a fuller’s earth is no simple matter, for its bleaching power is practically the only characteristic
by which it may be identified. Among the properties formerly attributed to fuller’s earth are
nonplasticity, disintegrating in water, detergent action, large water content and the property of
adhering to the tongue. Hence, why the mineral composition of Nteje clay would vary with its
commercially available counterparts.
Same can also be said of the chemical composition of activated carbon being at variance
with that of Nteje clay. It is obvious that the high temperature employed in carbonization, drives
off organic and inorganic minerals present in the source material, leaving a porous carbonaceous
product.
Table 4.2: XRD Analysis Summarised Result for Nteje Clay
S/N MINERAL NAME
PDF INDEX NAME EMPIRICAL FORMULA
CHEMICAL FORMULA
1 Dickite Aluminium Silicate Hydroxide
Al2H4O9Si2
Al2 Si2O5(OH)4
2 Kaolinite Aluminium Silicate Hydroxide
Al2H4O9Si2
Al2 Si2O5(OH)4
3 Palygorskite Magnesium Aluminium Silicate Hydroxide
H18Mg5O30Si8
(Mg, Al)5 (Si, Al)8 (OH)2 . 8H2O
4 montmorillonite Sodium Magnesium Aluminum Silicate Hydroxide Hydrate
Al2H4Na0.3O13Si4 Na0.3(Al, Mg)2 Si4O10(OH)2 xH2O
4.3 Effect of Activation

69
Acid activation was carried out using optimum operating conditions described by Berbesi,
R. (2006)58. The structural features of the clay were modified by treatment with a food grade acid
(concentrated hydrochloric acid). During this process the physical structure and chemical
compositions are altered in a controlled manner to maximize specific properties. The adsorption
process was influenced by some factors as follows:
• particle size
• adsorbent polarity
• surface area
• pore volume
• pore size.
4.4 Effect of Oil Degumming and Neutralization
4.5 Effect of Bleaching Time
The effect of contact time on the bleaching efficiencies of the clays were also investigated
as shown in Tables 4.3 to 4.7. The percentage colour reduction was observed to have improved
from 30–45 minutes. No further improvement was observed in percentage colour reduction after
this time. The highest bleaching time established for hydrochloric acid activated Nteje clay was
between 30 to 45 minutes (Tables 4.5 to 4.7). This result is in agreement with the result of
Hymore F. K., et. al. (1989)60 which stated that the contact time for effective bleaching typically
ranges from 15 to 45 minutes. According to James, O.O., et. al. (2008)61 the quality of crude palm
oil is of utmost importance to the refiners as it relates directly to the bleaching time and product’s
shelf life. Establishing optimum bleaching time is therefore important as prolonged bleaching time
may lead to colour deterioration. Howes P. D., et. al. (1991)62 made similar observation while
bleaching palm oil using local clays to prepare adsorbents. Similar trend was also obtained for

70
fuller’s earth and activated carbon which dictates the competence of the hydrochloric acid
activated Nteje clay compared to the standards (AC and FE).
Table 4.3: Effect of Bleaching Time at 60 oC
A.C F.E A.N.C S/N Time % Bleaching % Bleaching % Bleaching 1 0-10 14.815 17.581 20.021 2 10-20 20.021 29.730 29.930 3 20-30 31.411 30.531 32.432 4 30-40 35.836 34.434 36.136 5 40-50 38.338 40.041 38.939
Table 4.4: Effect of Bleaching Time at 80 oC
A.C F.E A.N.C S/N Time % Bleaching % Bleaching % Bleaching 1 0-10 20.021 24.024 20.021 2 10-20 30.231 33.433 29.930 3 20-30 38.138 40.141 32.432 4 30-40 48.849 47.948 36.136 5 40-50 49.049 48.649 38.939
Table 4.5: Effect of Bleaching Time at 100 oC
A.C F.E A.N.C S/N Time % Bleaching % Bleaching % Bleaching 1 0-10 34.535 40.041 37.838 2 10-20 50.951 49.750 50.151 3 20-30 74.474 72.773 72.272 4 30-40 76.076 76.577 75.576 5 40-50 77.077 77.678 78.879
Table 4.6: Effect of Bleaching Time at 120 oC
A.C F.C A.N.C S/N Time % Bleaching % Bleaching % Bleaching 1 0-10 38.839 39.940 39.940 2 10-20 50.451 49.950 49.449

71
3 20-30 75.876 70.071 74.975 4 30-40 76.076 75.676 76.877 5 40-50 77.878 78.879 78.579
Table 4.7: Effect of Bleaching Time at 140 oC
A.C F.E A.N.C S/N
Time % Bleaching % Bleaching % Bleaching
1 0-10 44.044 39.940 42.843 2 10-20 58.358 56.757 51.852 3 20-30 77.377 76.476 77.778 4 30-40 77.978 78.879 78.979 5 40-50 78.478 79.079 79.079
4.6 Effect of Temperature
Figures 4.3 shows the effect of temperature on the performance of AC, FE and ANC used
in bleaching palm oil. The highest bleaching efficiency wasn’t obtained within the range 90 to 125
oC according to Hymore F. K., et. al. (1989)60. This contradiction can best be explained by Howes
P. D. et. al. (1991)63. They reported that the optimum bleaching temperature is specific for a
particular adsorbent and oil, which is between 100 to 120 oC for palm oil and gave no range for
adsorbents. The highest bleaching efficiency was obtained at 140 oC with percentage bleaching of
78.478 for AC, 79.079 for FE and 79.079.079 for ANC. This result conforms to the result obtained
by Mustapha et. al. (2013)56 who reported a temperature of 140 oC for adsorptive bleaching of
palm oil. Like the commercially available standards (activated carbon and fuller’s earth), activated
Nteje clay was observed to yield its highest bleaching efficiency at similar temperature. The
viscosity of the oil was also observed to have decreased with increasing temperature. Hamilton R.
J. (1995)57 reported that oil viscosity decreases with increasing temperature, resulting in better
dispersion of particles, improved clay interactions and flowability.

72

73
Figure(s). 4.3: Charts of Percentage Bleaching with Time at Various Constant Temperatures
0
10
20
30
40
50
10 20 30 40 50
% B
leac
hing
Time (S)
At 60oC
AC
FE
ANC 0102030405060
10 20 30 40 50
% B
leac
hing
Time (S)
At 80oC
AC
FE
ANC
0
20
40
60
80
100
10 20 30 40 50
% B
leac
hing
Time (S)
At 100oC
AC
FE
ANC0
20
40
60
80
100
10 20 30 40 50
% B
leac
hing
Time (S)
At 120oC
AC
FE
ANC
0
20
40
60
80
100
10 20 30 40 50
% B
leac
hing
Time (s)
At 140oC
AC
FE
ANC

74
4.7 Adsorption kinetics
In order to examine the mechanism of adsorption process such as mass transfer and
chemical reaction, some suitable kinetic models are needed to analyse the rate data64. A study of
adsorption kinetics provides information about the mechanism of adsorption, which is important
for the efficiency of the process65. These kinetic models are useful for the design and optimisation
of effluent – treatment process66.
Figures 4.4 to 4.18 illustrate the amount of colour pigment adsorbed as a function of time for AC,
FE and ANC. The experimental data were analyzed using known kinetic models in order to
examine the controlling mechanism of the adsorption process. The models are: pseudo-second
order, elovich model and power function equation. The associated kinetic parameters have been
evaluated for the slopes and intercepts of the respective linear plots and presented in Tables 4.3 to
4.5, respectively. Comparison of the analysed data based on their linear regression coefficient (R2)
values shows that the experimental data were best described by the power function equation for
both AC and FE with (R2) values of 0.987 and 0.990, respectively and elovich model for ANC
with a correlation value (R2) of 0.985. The models which the adsorbents followed do not form any
significant difference in their adsorption efficiencies since the elovich model has equally given a
nice correlation for ANC as the power function equation for AC and FE.

75
Figure 4.4: Pseudo-second Order Plot for AC, FE and ANC at 10 min.
Figure 4.5: Pseudo-second Order Plot for AC, FE and ANC at 20 min
y = -0.06x + 4.968R² = 0.176
y = -0.068x + 5.619R² = 0.752
y = -0.054x + 4.983R² = 0.789
0
1
2
3
4
5
6
7
8
0 10 20 30 40 50 60
1/q t
t (s)
AC
FE
ANC
y = -0.071x + 5.159R² = 0.850
y = -0.051x + 4.297R² = 0.861
y = -0.036x + 3.690R² = 0.947
0
1
2
3
4
5
6
0 10 20 30 40 50 60
1/q t
t (s)
AC
FE
ANC

76
Figure 4.6: Pseudo-second Order Plot for AC, FE and ANC at 30 min
Figure 4.7: Pseudo-second Order Plot for AC, FE and ANC at 40 min
y = -0.038x + 2.924R² = 0.775
y = -0.031x + 2.634R² = 0.838
y = -0.034x + 2.751R² = 0.834
0
0.5
1
1.5
2
2.5
3
3.5
0 10 20 30 40 50 60
1/q t
t (s)
AC
FE
ANC
y = -0.032x + 2.671R² = 0.804
y = -0.031x + 2.652R² = 0.870
y = -0.031x + 2.644R² = 0.827
0
0.5
1
1.5
2
2.5
3
0 10 20 30 40 50 60
1/q t
t (s)
AC
FE
ANC

77
Figure 4.8: Pseudo-second Order Plot for AC, FE and ANC at 50 min
Figure 4.9: Elovich Plot for AC, FE and ANC at 10 min
y = -0.018x + 2.025R² = 0.425
y = -0.029x + 2.515R² = 0.769
y = -0.028x + 2.458R² = 0.810
0
0.5
1
1.5
2
2.5
3
0 10 20 30 40 50 60
1/q t
t (s)
AC
FE
ANC
y = 0.156x - 0.228R² = 0.951
y = 0.126x - 0.108R² = 0.946
y = 0.113x - 0.054R² = 0.985
0
0.05
0.1
0.15
0.2
0.25
0.3
0.35
0.4
0.45
0 1 2 3 4 5
q t
ln t
AC
FE
ANC

78
Figure 4.10: Elovich Plot for AC, FE and ANC at 20 min
Figure 4.11: Elovich Plot for AC, FE and ANC at 30 Min
y = 0.192x - 0.254R² = 0.968
y = 0.161x - 0.137R² = 0.982
y = 0.134x - 0.034R² = 0.958
0
0.1
0.2
0.3
0.4
0.5
0.6
0 1 2 3 4 5
q t
ln t
AC
FE
ANC
y = 0.292x - 0.324R² = 0.939
y = 0.261x - 0.217R² = 0.924
y = 0.275x - 0.267R² = 0.949
0
0.1
0.2
0.3
0.4
0.5
0.6
0.7
0.8
0.9
0 1 2 3 4 5
q t
ln t
AC
FE
ANC

79
Figure 4.12: Elovich Plot for AC, FE and ANC at 40 Min
Figure 4.13: Elovich Plot for AC, FE and ANC at 50 Min
y = 0.269x - 0.239R² = 0.908
y = 0.261x - 0.223R² = 0.952
y = 0.268x - 0.235R² = 0.908
0
0.1
0.2
0.3
0.4
0.5
0.6
0.7
0.8
0.9
0 1 2 3 4 5
q t
ln t
AC
FE
ANC
y = 0.234x - 0.091R² = 0.926
y = 0.265x - 0.202R² = 0.942
y = 0.257x - 0.178R² = 0.886
0
0.1
0.2
0.3
0.4
0.5
0.6
0.7
0.8
0.9
0 1 2 3 4 5
q t
ln t
AC
FE
ANC

80
Figure 4.14: Power Function Plot for AC, FE and ANC at 10 Min
Figure 4.15: Power Function Plot for AC, FE and ANC at 20 Min
y = 0.639x - 1.483R² = 0.968
y = 0.478x - 1.209R² = 0.933y = 0.405x - 1.086
R² = 0.967
-0.9
-0.8
-0.7
-0.6
-0.5
-0.4
-0.3
-0.2
-0.1
00 0.5 1 1.5 2
log
q
log t
AC
FE
ANC
y = 0.592x - 1.289R² = 0.987
y = 0.464x - 1.081R² = 0.990
y = 0.354x - 0.904R² = 0.979
-0.8
-0.7
-0.6
-0.5
-0.4
-0.3
-0.2
-0.1
00 0.5 1 1.5 2
log
q
log t
AC
FE
ANC

81
Figure 4.16: Power Function Plot for AC, FE and ANC at 30 Min
Figure 4.17: Power Function Plot for AC, FE and ANC at 40 Min
y = 0.551x - 1.000R² = 0.950
y = 0.462x - 0.866R² = 0.938
y = 0.528x - 0.936R² = 0.728
-0.5
-0.45
-0.4
-0.35
-0.3
-0.25
-0.2
-0.15
-0.1
-0.05
00 0.5 1 1.5 2
log
q
log t
AC
FE
ANC
y = 0.480x - 0.891R² = 0.926
y = 0.462x - 0.869R² = 0.963
y = 0.472x - 0.877R² = 0.926
-0.45
-0.4
-0.35
-0.3
-0.25
-0.2
-0.15
-0.1
-0.05
0
0 0.5 1 1.5 2
log
q
log t
AC
FE
ANC

82
Figure 4.18: Power Function for AC, FE and ANC at 50 Min
Table 4.8: Pseudo-second Order Parameters for AC, FE and ANC
S/N To C AC FE ANC
qe K2 * 10-
3
R2 qe K2 * 10-3 R2 qe K2 * 10-3 R2
1 60 0.201 -2.42 0.176 0.178 -2.15 0.752 0.201 -2.18 0.789
2 80 0.194 -2.67 0.850 0.233 -2.77 0.861 0.271 -2.64 0.947
3 100 0.342 -4.44 0.775 0.379 -4.45 0.838 0.364 -4.50 0.834
4 120 0.374 -4.48 0.804 0.377 -4.41 0.804 0.378 -4.43 0.827
5 140 0.494 -4.39 0.425 0.398 -4.59 0.769 0.407 -4.64 0.810
Table 4.9: Elovich Parameters for AC, FE and ANC
S/N To C AC FE ANC
y = 0.389x - 0.735R² = 0.934
y = 0.461x - 0.845R² = 0.946
y = 0.436x - 0.811R² = 0.906
-0.45
-0.4
-0.35
-0.3
-0.25
-0.2
-0.15
-0.1
-0.05
00 0.5 1 1.5 2
log
q
log t
AC
FE
ANC

83
B a R2 b a R2 b a R2
1 60 -4.36 1.169 0.951 -9.259 1.134 0.946 -18.52 1.011 0.985
2 80 -3.94 1.212 0.968 -7.299 1.175 0.982 -29.41 1.143 0.958
3 100 -3.08 1.340 0.939 -4.608 1.298 0.924 -3.745 1.317 0.949
4 120 -4.18 1.308 0.908 -4.484 1.298 0.952 -4.255 1.307 0.908
5 140 -10.99 1.264 0.926 -4.950 1.303 0.942 -5.618 1.293 0.886
Table 4.10: Power Function Equation Parameters for AC, FE and ANC
S/N To C AC FE ANC
B a R2 b a R2 b a R2
1 60 -1.483 -0.194 0.968 -1.209 -0.321 0.933 -1.086 -0.393 0.967
2 80 -1.289 -0.228 0.987 -1.081 -0.333 0.990 -0.904 -0.451 0.979
3 100 -1.000 -0.259 0.950 -0.866 -0.335 09.38 -0.936 -0.277 0.728
4 120 -0.891 -0.319 0.926 -0.869 -0.335 09.63 -0.877 -0.326 0.926
5 140 -0.735 -0.410 0.934 -0.845 -0.336 0.946 -0.811 -0.361 0.906
4.8 Adsorption Isotherm
A sorption isotherm (also adsorption isotherm) describes the equilibrium of the sorption of
a material at a surface (more general at a surface boundary) at constant temperature. It represents
the amount of material bound at the surface (the sorbate) as a function of the material present in
the gas phase and/or in the solution.

84
Figures 4.19 to 4.28 are Freundlich and Langmuir isotherm plots for AC, FE and ANC describing
the equilibrium of the sorption of palm oil impurities at constant temperatures. The associated
isotherm parameters are calculated and presented in Tables 4.6 to 4.10. To evaluate the nature of
adsorption, the experimental isotherm data were fitted by model isotherm equations namely;
Freundlich and Langmuir models.
Isotherm study of the three adsorbents were best described by Langmuir adsorption isotherm with
linear correlation coefficient (R2) values of 0.982 for AC and 0.999 for both FE and ANC. The
forces of attraction existing between the adsorbent and adsorbate were almost the same strength as
chemical bonds. This type of adsorption can be said to be Chemical adsorption (Chemisorption),
and is always attributed to Langmuir adsorption. Consequently, the following can be deduced of
the adsorption process:
(1) It has high heat of adsorption in the range of 40-400kJ/mol
(2) Forces of attraction were chemical bonds
(3) Took place at high temperature
(4) It is irreversible
(5) It is highly specific
(6) Required activation energy
(7) The adsorption of colour pigment on the three adsorbents was monolayer.
(8) The surfaces of the adsorbents were uniform, that is, all the adsorption sites were
equivalent.
(9) All the adsorption occurred through the same mechanism.
(10) Adsorbed molecules did not interact

85
Figure 4.19: Freundlich Isotherm Plot at 60 oC
y = -2.913x - 2.304R² = 0.977
y = -1.929x - 2.116R² = 0.753
y = 0.704x - 0.062R² = 0.907
-2.5
-2
-1.5
-1
-0.5
0-0.25 -0.2 -0.15 -0.1 -0.05 0 0.05
log(
x/m
)
log(Xe)
AC
FE
ANC
y = -1.895x - 2.149R² = 0.965
y = -1.441x - 2.026R² = 0.947
y = -1.188x - 1.956R² = 0.973
-2.5
-2
-1.5
-1
-0.5
0
-0.35 -0.3 -0.25 -0.2 -0.15 -0.1 -0.05 0 0.05
log(
x/m
)
logXe
AC
FE
ANC

86
Figure 4.20: Freundlich Isotherm Plot at 80 oC
Figure 4.21: Freundlich Isotherm Plot at 100 oC
Figure 4.22: Freundlich Isotherm Plot at 120 oC
y = -0.732x - 1.871R² = 0.967
y = -0.613x - 1.803R² = 0.996
y = -0.646x - 1.823R² = 0.989
-2
-1.8
-1.6
-1.4
-1.2
-1
-0.8
-0.6
-0.4
-0.2
0-0.8 -0.6 -0.4 -0.2 0 0.2
log(
x/m
)
logXe
AC
FE
ANC
y = -0.675x - 1.839R² = 0.977
y = -0.646x - 1.832R² = 0.967
y = -0.683x - 1.849R² = 0.989 -2
-1.8
-1.6
-1.4
-1.2
-1
-0.8
-0.6
-0.4
-0.2
0-0.8 -0.6 -0.4 -0.2 0 0.2
log(
x/m
)
logXe
AC
FE
ANC

87
Figure 4.23: Freundlich Isotherm Plot at 140 oC
Figure 4.24: Langmuir Isotherm Plot at 60 oC
y = -0.576x - 1.784R² = 0.975
y = 1.085x + 0.050R² = 0.996
y = 1.113x + 0.064R² = 0.986
-2
-1.5
-1
-0.5
0
0.5
-0.8 -0.6 -0.4 -0.2 0 0.2
log(
x/m
)
logXe
AC
FE
ANC
y = 340.6x - 183.8R² = 0.953
y = 208.1x - 98.52R² = 0.72
y = 166.1x - 72.18R² = 0.785
0
20
40
60
80
100
120
140
0 0.2 0.4 0.6 0.8 1
Xe/(
x/m
)
Xe
AC
FE
ANC

88
Figure 4.25: Langmuir Isotherm Plot at 80 oC
Figure 4.26: Langmuir Isotherm Plot at 100 oC
y = 191.8x - 80.25R² = 0.937
y = 120.9x - 41.84R² = 0.96
y = 98.74x - 29.91R² = 0.977
0
10
20
30
40
50
60
70
80
90
0 0.2 0.4 0.6 0.8 1
Xe/(
x/m
)
Xe
AC
FE
ANC
y = 72.46x - 11.60R² = 0.965
y = 56.08x - 6.993R² = 0.999
y = 61.16x - 8.353R² = 0.992
0
5
10
15
20
25
30
35
40
45
0 0.1 0.2 0.3 0.4 0.5 0.6 0.7
Xe/(
x/m
)
Xe
AC
FE
ANC

89
Figure 4.27: Langmuir Isotherm Plot at 120 oC
Figure 4.28: Langmuir Isotherm Plot at 140 oC
Table 4.11: Freundlich and Langmuir Isotherm Parameters Evaluated for AC, FE and ANC at 60 oC.
ISOTHERM FREUNDLICH LANGMIUR
y = 64.57x - 9.315R² = 0.976
y = 61.78x - 7.971R² = 0.974
y = 64.74x - 9.239R² = 0.990
0
5
10
15
20
25
30
35
0 0.1 0.2 0.3 0.4 0.5 0.6 0.7
Xe/(
x/m
)
Xe
AC
FE
ANC
y = 55.86x - 6.962R² = 0.982
y = 71.81x - 10.74R² = 0.962
y = 64.59x - 8.742R² = 0.999
0
5
10
15
20
25
30
35
0 0.1 0.2 0.3 0.4 0.5 0.6
Xe/(
x/m
)
Xe
AC
FE
ANC

90
PARAMETER K n R2 a b R2 AC 0.344 -2.304 0.977 0.0029 -0.539 0.953 FE 0.513 -2.116 0.753 0.0048 -0.473 0.72 ANC 0.708 -0.062 0.907 0.0060 -0.435 0.785
Table 4.12: Freundlich and Langmuir Isotherm Parameters Evaluated for AC, FE and ANC at 80 oC
ISOTHERM FREUNDLICH LANGMIUR PARAMETER K n R2 a b R2 AC 0.527 -2.149 0.965 0.0052 -0.418 0.937 FE 0.692 -2.026 0.947 0.0083 -0.346 0.96 ANC 0.841 -1.956 0.973 0.010 -0.222 0.977
Table 4.13: Freundlich and Langmuir Isotherm Parameters Evaluated for AC, FE and ANC at 100 oC
ISOTHERM FREUNDLICH LANGMIUR PARAMETER K n R2 a b R2 AC 0.733 -1.871 0.967 0.0138 -0.160 0.965 FE 0.612 -1.803 0.996 0.0178 -0.125 0.999 ANC 0.647 -1.823 0.989 0.0163 -0.137 0.992
Tables 4.14: Freundlich and Langmuir Isotherm Parameters Evaluated for AC, FE and ANC at 120oC
ISOTHERM FREUNDLICH LANGMIUR PARAMETER K n R2 a b R2 AC 0.675 -1.839 0.977 0.0154 -0.144 0.976 FE 0.647 -1.832 0.967 0.0161 -0.129 0.974 ANC 0.682 -1.849 0.989 0.0154 -0.143 0.990
Tables 4.15: Freundlich and Langmuir Isotherm Parameters Evaluated for AC, FE and ANC at 140oC
ISOTHERM FREUNDLICH LANGMIUR PARAMETER K n R2 a b R2 AC 0.577 -1.784 0.975 0.0179 -0.125 0.982 FE 1.084 0.050 0.996 0.0139 -0.149 0.962 ANC 1.112 0.064 0.986 0.0155 -0.135 0.999
4.9 Adsorption Thermodynamics
91
The reaction rate can be calculated from the knowledge of kinetic studies. But the changes
in reaction that can be expected during the sorption process require the knowledge of
thermodynamic parameters. Thermodynamic considerations of an adsorption process are necessary
to conclude whether the process is spontaneous or not.
Figures 4.29 to 4.33 show the thermodynamic linear plots of ���� versus 1 �� . The values of the
thermodynamic parameters of AC, FE and ANC were calculated and presented in Tables 4.11 to
4.15. The values of the Gibbs free energy change of adsorption (∆��) are all negative and
decreases as the temperature increases. According to Puah, C. W. et. al. (2004)69, a decrease in the
negative value of ∆�� with an increase in temperature indicates that the adsorption process is more
favourable at higher temperatures. This is possible because the mobility of adsorbate
ions/molecules in the solution increases with increase in temperature, and the affinity of the
adsorbate on the adsorbent is high at higher temperatures. This can be seen in the effect of
temperature on the adsorption efficiencies of the adsorbents (figures 4.3). As the temperature of
the reaction was increased, the adsorption of colour pigments onto the adsorbent also increased.
The values of the enthalpy (∆��) and entropy (∆��) calculated from the plot of ���� versus 1��
are presented in Tables 4.11 to 4.15. The values for the change in enthalpy are negative and this
implies that the adsorption process of colour pigments from palm oil onto locally activated clay is
exothermic. In an exothermic process, the total energy absorbed in bond breaking is less than the
total energy released in bond making between adsorbate and adsorbent thereby resulting in the
release of extra energy in the form of heat. The magnitude of ∆�� gives an idea about the type of
sorption. The heat evolved during physical adsorption falls in the range of 2.1–20.9 KJ/mol while
that evolved during chemical sorption is in the range of 40 to 400 KJ/mol. As can be seen from
thermodynamic parameters, therefore, in Tables 4.11 to 4.15, it can be deduced that the adsorption

92
of colour pigments onto acid activated Nteje clay can be attributed to a physico-chemical
adsorption process rather than a pure physical or chemical adsorption process69. The entropy (∆��)
calculated and presented in Tables 4.11 to 4.15 is positive and this reflects the affinity of the
adsorbent towards the adsorbate species. A positive value of ∆�� suggests increased randomness at
the solid/solution interface with some structural changes in the adsorbate and adsorbent. The
adsorbed solvent molecules which are displaced by the adsorbate species gain more translational
entropy than is lost by the adsorbate ions/molecules, thus allowing for the prevalence of
randomness in the system. The same result was also reported by (R. O. Ajemba et. al. 2012)3.
Figure 4.29: Plot of ��� � Versus � �� for AC, FE and ANC at 10 min
y = -2207.x + 4.922R² = 0.921
y = -1695.x + 3.687R² = 0.896
y = -1453.x + 3.095R² = 0.918
-2
-1.8
-1.6
-1.4
-1.2
-1
-0.8
-0.6
-0.4
-0.2
00 0.001 0.002 0.003 0.004
ln K
f
1/T
AC
FE
ANC

93
Figure 4.30: Plot of ��� �Versus � �� for AC, FE and ANC at 20 Min
Figure 4.31: Plot of ��� � Versus � �� for AC, FE and ANC at 30 Min
y = -2342.x + 5.719R² = 0.963
y = -1879.x + 4.560R² = 0.961
y = -1545x + 3.737R² = 0.996
-1.6
-1.4
-1.2
-1
-0.8
-0.6
-0.4
-0.2
0
0.2
0 0.001 0.002 0.003 0.004
ln K
f
1/T
AC
FE
ANC
y = -3230x + 9.229R² = 0.850
y = -2945.x + 8.491R² = 0.869
y = -3114.x + 8.926R² = 0.895
-1
-0.5
0
0.5
1
1.5
2
0 0.001 0.002 0.003 0.004
ln K
f
1/T
AC
FE
ANC

94
Figure 4.32: Plot of ��� � Versus � �� for AC, FE and ANC at 40 Min
Figure 4.33: Plot of ��� � Versus � �� for AC, FE and ANC at 50 Min
Table 4.16: Thermodynamic Parameters Evaluated for AC, FE and ANC at 10 Mins. AC FE ANC
y = -2981.x + 8.612R² = 0.817
y = -2480.x + 7.424R² = 0.749
y = -3026.x + 8.740R² = 0.840
-1
-0.5
0
0.5
1
1.5
2
0 0.001 0.002 0.003 0.004
ln K
f
1/T
AC
FE
ANC
y = -2631.x + 7.825R² = 0.819
y = -2993.x + 8.756R² = 0.850
y = -2928.x + 8.582R² = 0.800
-1
-0.5
0
0.5
1
1.5
2
0 0.001 0.002 0.003 0.004
ln K
f
1/T
AC
FE
ANC

95
T(K) ∆G0 ∆S0 ∆H0 R2 T(K) ∆G0 ∆S0 ∆H0 R2 T(K) ∆G0 ∆S0 ∆H0 R2
333 -22.37 0.59
-26.55
0.92
333 -16.79 0.44
-20.39
0.896
333 -14.14 0.37
-17.48
0.918
353 -23.55 353 -17.68 353 -14.88 373 -24.74 373 -18.56 373 -15.62 393 -25.92 393 -19.45 393 -16.38 413 -27.10 413 -20.33 413 -17.11 Table 4.17: Thermodynamic Parameters Evaluated for AC, FE and ANC at 20 Mins.
AC FE ANC
T(K) ∆G0 ∆S0 ∆H0 R2 T(K) ∆G0 ∆S0 ∆H0 R2 T(K) ∆G0 ∆S0 ∆H0 R2
333 -25.72 0.69
-28.17
0.963
333 -20.51 0.55
-22.60
0.961
333 -16.81 0.45
-18.58
0.996
353 -27.16 353 -21.60 353 -17.71 373 -28.48 373 -22.70 373 -18.06 393 -29.86 393 -23.79 393 -19.50 413 -31.23 413 -24.89 413 -20.40 Table 4.18: Thermodynamic Parameters Evaluated for AC, FE and ANC at 30 Mins.
AC FE ANC
T(K) ∆G0 ∆S0 ∆H0 R2 T(K) ∆G0 ∆S0 ∆H0 R2 T(K) ∆G0 ∆S0 ∆H0 R2
333 -40.85
1.11
-38.85
0.850
333 -37.24
0.55
-22.60
0.961
333 -16.81
1.074
-37.45
0.895
353 -43.07 353 -39.58 353 -17.71 373 -45.29 373 -41.63 373 -18.06 393 -47.51 393 -43.67 393 -19.50 413 -52.43 413 -45.71 413 -20.40 Table 4.19: Thermodynamic Parameters Evaluated for AC, FE and ANC at 40 Mins
AC FE ANC T(K) ∆G0 ∆S0 ∆H0 R2 T(K) ∆G0 ∆S0 ∆H0 R2 T(K) ∆G0 ∆S0 ∆H0 R2
333 -38.08 1.04
-35.86
0.817
333 -32.72 0.89
-29.83
0.749
333 -38.64 1.05
-36.39
0.840
353 -40.16 353 -34.51 353 -40.73 373 -42.23 373 -36.19 373 -42.84 393 -44.30 393 -38.08 393 -45.24 413 -46.37 413 -39.86 413 -47.05 Table 4.20: Thermodynamic Parameters Evaluated for AC, FE and ANC at 50 Mins
AC FE ANC T(K) ∆G0 ∆S0 ∆H0 R2 T(K) ∆G0 ∆S0 ∆H0 R2 T(K) ∆G0 ∆S0 ∆H0 R2
333 -34.50 0.94
-31.65
0.819
333 -38.66 1.05
-35.99
0.850
333 -37.89 1.032
-35.22
0.800
353 -36.38 353 -40.77 353 -39.95 373 -38.26 373 -42.88 373 -42.06 393 -40.15 393 -44.98 393 -44.08 413 -42.03 413 -47.09 413 -46.14

96

97
CHAPTER FIVE
CONCLUSIONS, RECOMMENDATIONS AND CONTRIBUTIONS TO KNOWLEDGE
5.1 Conclusion
The comparative analysis of the bleaching efficiency of activated Nteje clay with the imported,
commercially available adsorbents (activated carbon and fuller’s earth) has been successfully
investigated, and the following conclusions are made:
(1) Like other earth-mined adsorbents, activated Nteje clay retain its specific mineral
composition having hydrous aluminium silicate as its base which must be common in all
the earth adsorbents.
(2) The bleaching (adsorption) efficiency of this activated Nteje clay effectively competes
favourably with the imported, commercially available adsorbents (activated carbon and
fuller’s earth). Like the later, activated Nteje clay bleaches at similar conditions and
produce equal results and responses.
(3) The Nteje clay was kinetically best described by the elovich model with linear
regression coefficient (R2) value of 0.985 which is as good as activated carbon and fuller’s
earth which both followed power function equation with (R2) values of 0.987 and 0.990,
respectively.
(4) Like the standard adsorbents, activated Nteje clay was best described by the Langmuir
isotherm with (R2) value of 0.999 well competing with the activated carbon and fuller’s
earth having 0.982 and 0.999, respectively.

98
(5) Thermodynamics of this clay (activated Nteje clay) shows similar trend with the
commercially available adsorbents, which includes negative free energy change (∆G),
negative enthalpy change (∆H) and positive entropy change (∆S), thereby implying that
adsorption was feasible at all temperatures.
5.2 Recommendation
The effects of the various activating methods of Nteje clay should be advanced into the concept of
defect chemistry, to understand the kind of defect caused by the various activating agents/methods
on the crystalline structure of the clay and applying the Gibbs-Duhem equation in studying the
thermodynamics of the various defects.
5.3 Contribution to knowledge
The bleaching potential of Nteje clay has long been established, but contrary to its resourcefulness,
lacks patronage. This could be traced to doubts arising from its competitative efficiency to the
commercially, imported, available adsorbents.
This work has therefore established that Nteje clay, naturally occurring in nature equally produce
results and responses comparable to the imported, commercially available adsorbents. The
conviction of this work will therefore furnish industries and research institutions with the trust for
the industrial and scientific application of Nteje clay.
REFERENCES
1 Preeti S. N., Singh B. K., (2007) - Instrumental characterization of clay by XRF, XRD, and FTIR. Bull. Mater. Sci., 30(3), 235 – 238.

99
2 J. T. Nwabanne and F. C. Ekwu (2013) - Decolourisation of palm oil by Nigerian local clay: A study of adsorption isotherms and bleaching isotherms. International Journal of multidisciplinary Sciences and Engineering, Vol. 4, No. 1, January 2013
3 R. O. Ajemba and Okechukwu D. Onukwuli (2012) – Adsorptive removal of colour pigments from palm oil using acid activated Nteje clay. Kinetics, Equilibrium and Thermodynamics. Physicochem. Probl. Miner. Process 49(1), 2013, 369-381
4 Sleppy, W. C., (2002) - Aluminum compounds- introduction. Kirk-Othmer Encyclopedia of Chemical Technology (online).
5 Chambers, G. P. C., (1959) - Some industrial applications of the clay mineral, sepiolite. Silicates Inds. 24, 3 – 11.
6 Amira International limited, (2001) - Alumina technology roadmap.
http://www.amira.com.au/documents/alumina/index. 7 International Aluminum Institute, (2003) - Statistics, alumina production.
http://www.world-aluminium.org/iai/stats. 8 Zvanut F. J., (1937) - X-ray investigation of the pyro-chemical changes in Missouri halloysite.
J. Am. Ceram. Soc. 20, 251 – 256. 9 Dai J. C., Huang J. T., (1991) - Surface modification of clays and clay-rubber composite.
Applied Clay Science, 15, 51 – 65. 10 An J. H., Dultz S., (2007) - Adsorption of tannic acid on chitosan-montmorillonite as a
function of pH and surface charge properties. Applied Clay Science, 36, 256 – 264. 11 Steudel A., Batenburg L. F., Fischer H. R., Weidler P. G., Emmerich K., (2009) -
Alteration of swelling clay minerals by acid activation. Applied Clay Science, 44, 105 –115.
12 Jiuhui Q. U., (2008). Research progress of novel adsorption processes in water purification.
A review. J. Environ. Sci. 20, 1 – 13. 13 Christidis G. E., Scott P. W., Dunham A. C., (1997) - Acid activation and bleaching
capacity of bentonites from the islands of Milos and Chios, Aegean and Greece. Applied Clay Science, 12, 329 – 347.
14 Al-Asheh S., Banat F., Abu-Aitah L., (2003) - Adsorption of phenol using different typesN
of activated bentonites. Separation Purification Technology, 33, 1 – 10. 15 He H., Frost R. F., Bostrom T., Yuan P., Duong L., Yang D., Xi Y., Kloprogge T., (2006) -
Changes in morphology of organo clays with HDTMA surfactant loading. Applied Clay Science, 31, 262 – 271.

100
16 Beraganya F., Theng B. K., Lagaly G., (2006) - Modified clays and clay minerals. Handbook of Clay Science, Development in Clay Science, vol. 1, Elsiever, The Netherlands.
17 Sennour R., Mimane G., Benghalem A., Taleb S., (2009) - Removal of persistent pollutant
chlorobenzene by adsorption onto activated montmorillonite. Applied Clay Science, 43, 503 – 506.
18 Vimonses V., Jin B., Chow C., Saint C., (2009) - Enhancing removal efficiency of anionic dye by combination and calcination of clay minerals and calcium hydroxide. Journal of Hazardous Material, 161, 132 – 139. 19 Chaari I., Fakhfakh E., Chalcroun S., Bouzid J., Boujelben N., Feki M., Rocha F., Jamoussi
F., (2008) - Lead removal from aqueous solution by Tunisian smectite clay. Journal of Hazardous Materials, 156, 545 – 551.
20 Koyuncu H., (2008) - Adsorption kinetics of 3-hydroxybenzaldhyde on native and
activated bentonite. Applied Clay Science, 38, 279 – 287. 21 Diaz F., DeSouzaSanctozs R., (2001) - Studies on the acid activation of Brazilian smectite clays. Quim. Nova. 24, 343 – 353. 22 Doulia D., Leodopoloud C., Gimouhopoulos K., Rigas F., (2009) - Adsorption of humic
acid on acid-activated Greek bentonite. Journal of Colloid and Interface Science, 340,131 – 141.
23 Lian L., Guo L., Guo C., (2009) - Adsorption of congo red from aqueous solution on Ca-
bentonite. J. Hazardous Materials, 161, 126 – 131. 24 Hajjaji M., El-Arfaoui H., (2009) - Adsorption of methylene blue and zinc ions on raw and
acid activated bentonite from Morocco. Applied Clay Science, 46, 418 – 421. 25 Jovanovic N., Jonackovic J., (1991) - Pore structure and adsorption properties of an acid-
activated bentonite. Applied Clay Science, 6, 59 – 68. 26 Bhattacharyya K. G., SenGupta S., (2006) - Adsorption of Fe (III) from water by natural
and acid activated clays: Studies on equilibrium isotherm, kinetics, and thermodynamics of interactions. Adsorption, 12, 185 – 204.
27 Pushpaletha P., Rugmini S., Lalithambika M., (2005) - Correlation between surface properties and catalytic activity of clay catalysts. Applied Clay Science, 30, 141 – 153. 28 Kara M., Yuzer H., Sabah E., Celik M. S., (2003) - Adsorption of cobalt from aqueous solutions onto sepiolite. Water Res. 37, 224 – 232.

101
29 Patterson H. W. B. (1992) - Bleaching and Purifying Fats and Oils. Theory and Practice. AOCS Press.
30 Leong W. L. (1992) - The Refining and Fractionation of Palm Oil. Palm Oil Mill Engineers-
Executives Training Course 14th Semester 1. PORIM Bangi. 1-6 31 Bernardini E. (1985) - Vegetable Oils and Fats Processing (Volume II). Interstampa Rome
Inc. 32 Kim I. C., Kim J. H., Lee K. H., Tak T. M. (2002) - Phospholipids separation (degumming)
from crude vegetable oil by polyimide ultrafiltration membrane. Journal of Membrane Science (205): 113-123
33 Lin L, Rhee K. C., Koseoglu S. S. (1997) - Bench-scale membrane degumming of crude
vegetable oil: Process Optimization. Journal of Membrane Science (134): 101-108 34 Bockish M. (1998) - Fats and Oils Handbook. AOCS Press. 35 Thiagarajan T. and Tang T. S. (1991) - Refinery Practices and Oil Quality. 1991 PORIM
International Palm Oil Conference (Chemistry and Technology). 254-266 36 Sambanthamurthi R., Sundram K, Tan Y. A. (2000) - Chemistry and biochemistry of palm
oil. Progress in Lipid Research. (39): 507-558 37 Gunstone F. D., Norris F. A. (1983) - Lipids in Foods: Chemistry, Biochemistry and Technology , Pergamonn Press. 38 Chambers, G. P. C., (1959) - Some industrial applications of the clay mineral, sepiolite.
Silicates Inds. 24, 3 – 11. 39 Salmiah A.,(2000) - Non-food Uses of Palm Oil and Palm Kernel Oil. MPOPC Palm Oil
Information Series, Kuala Lumpur: 24 40 Abdul Azis A (2000). The Effect of CPO Quality Parameters (FFA, M&I,
IV, PV, AV , DOBI and Colour) on the Refinery Production Efficiency. Proceedings of the 2000 National Seminar on Palm Oil Milling, Refining Technology, Quality and Environment. July 3-4. Genting Hotel, Genting Highlands,Malaysia. 79-88
41 Onukwuli O. D., Ukwuoma O., Igbokwe P. K., Aneke L. E., (1995) - Production of activated clay for the bleaching of palm oil. Journal of the Nigerian Society of Chemical Engineers, 14, 28 – 34.
42 Okwara C. A., Osoka E. C., (2006) - Caustic activation of local clays for palm oil bleaching. Journal of Engineering and Applied Sciences 1 (4): 526 – 529.
43 Salawudeen T. O., Dada E. O., Alagbe S. O., (2007) - Performance evaluation of treated clays for palm oil bleaching. Journal of Engineering and Applied Sciences 2

102
(11): 1677 – 1680.
44 Nnadozie N. N., Arowolo T. A., Akpan H. J., (1989) - Quality of Nigerian palm oil after bleaching with local treated clays. JAOCS, 66(2), 218 – 222.
45 Makhoukhi B., Didi M. A., Villemin D., Azzouz A., (2009) - Acid activation of bentonite
for use as a vegetable oil bleaching agent. Grasas Y Aceites, 60 (4), 343 – 349. 46 James O. O., Mesubi M. A., Adekola F. A., Odebunmi E. O., Adekeye J. I. D., Bale R. B.,
(2008) - Bleaching performance of a Nigerian (Yola) bentonite. Latin American Applied Research, 38, 45 – 49.
47 Al-Zahrani A. A., Al-Shahrani S. S., Al-Tawil Y. A., (2000) - Study on the activation of Saudi natural bentonite, Part II: Characterization of the produced active clay and its test as adsorbing agent. J. King Saudi Uni., 13(2), 193 – 203.
48 Inglethorpe S. D. J., Morgan D. J., Highley D. E., Bloodworth A. J., (1993) - Industrial mineral laboratory manual – Bentonite. British Geological Survey Technical Report, WG/93/20.
49 Nde-Aga, B. J, Kamga, R. and Nguetnkam, J. P. (2007) - Adsorption of palm oil carotene and free fatty acids onto acid activated Cameroonian clays. Journal of Applied Sciences. 7 2462 – 2467.
50 Achife, E. C and Tbemesi, J.A. (1989) - Applicability of the Freundlich and Langmuir adsorption isotherms in the bleaching of rubber and melon seed oils. J. Am. Oil Chem. Soc; 66 247 – 253.
51 Dias M. I., Suarez Barrios M., Prates S., Martin Pozas J.M., (2003) - Characterization and acid activation of Portuguese special clay, Appl. Clay Sci., 18, 537–549
52 Preeti S. N., Singh B. K., (2007) - Instrumental Characterization of Clay by XRF, XRD,
and FTIR. Bull. Mater. Sci., 30(3), 235 – 238. 53 Ho, Y. S. and Mckay, G., (2000) – The Kinetics of Sorption of Divalent Metals ions onto
Sphagnum Moss Peat. Water Res. 34: 735 – 742
54 Harry O. Brady (1960) - The Nature and Properties of Soils – A Colege Text of Edaphology (6th ed), New York: Macmilliuan Publishers, New York, NY.
55 Siew W. L. (1994) - An Overview of DOBI and the Use of Discrimant Functions Analysis
for Quality of Crude Palm Oil. PORIM Information Series 18. 1-4
56 Mustapha S. I., Mohammed A. A., Zakari, A. Y., Mohammed H. A. (2013) - Performance Evaluation of Local Clays from Northern Nigeria for the Refining of Palm Oil. Journal of Chemical Engineering and Material Sciences. Vol. 4(5), pp. 58-66.

103
57 Hamilton R J (1995) - Developments in Oils and Fats. Blackie Academic & Professional.
58 Berbesi, R. (2006) - Achieving Optimal Bleaching Performance. Oil Mill Gazetteer. Pp. 1-5.
59 Wong C. Y (1983) - Survey of Malaysian Crude Palm Oil Quality Delivered to Refiners.
International Conference on Palm Oil Product Technology, Kuala Lumpur .81-87 60 Hymore F. K., Iyayi A. F., (1989) - Use of Local Clays in the Refining of Palm Oil. N. S.
Che. J. 8(2):161-171. 61 James, O.O., Mesubi, M.A., Adekola, F.A., Odebunmi, E.O., Adekeye, J.I.D. and Bale,
R.B. (2008) - Bleaching performance of a Nigerian (Yola) Bentonite. Latin American Applied Research. 34 45 – 49.
62 Atkins P. W. (1998) - “Physical Chemistry” Oxford University press, 6th ed., ISBN 0-9-
850101-3 63 Howes P D, Soon T C, Lim S H, Shaw D B, Stemp P K (1991) - Bleaching Earths, Trends
and developments in Bleaching. 1991 PORIM International Palm Oil Conference (Chemistry and Technology). 55-75
64 Saha P., Chowdhury S., (2010) - Insight into Adsorption Thermodynamics, Desalination,
250, 349–363. 65 Choo, Y. M. (2000) – Specialty Products: Carotenoids. Advances in oil palm research
(Basiron, Y., Alani, B. S. and Chan, K. eds). Vol. 11. MPOB, Bangi P., 1036-1060,
66 Chein, S. H. and Clayton, W. R., (1980) – Application of Elovich Equation to the Kinetics of Phosphate release and sorption on soils. Soil Sci. Soc. Am. J. 44: 265 – 268
67 Howes P D, Soon T C, Lim S H, Shaw D B, Stemp P K (1991) Bleaching Earths, Trends and developments in Bleaching. (1991) - PORIM International Palm Oil Conference (Chemistry and Technology). 55-75
68 Mustapha S. I. et al (2013) – Performance Evaluation of local Clays from Northern Nigeria for the Bleaching of Palm Oil. Journal of Chemical Engineering and Material Science. Vol. 4(5), PP. 58 – 66
69 Puah, C. W., Choo, Y. M., Ma, A. N. and Chua, C. (2004) – Degumming and bleaching: Effect on selected constituents of palm oil. Journal of oil palm research. 16(2) 57-63

104
APPENDIX A
TABLE OF VALUES FOR THE AMOUNT OF PIGMENT ADSORBED (PERCENTRAGE BLEACHING) AND ISOTHERM PARAMETERS AT VARIOUS
CONSTANT TEMPERATURES
TABLES A1: Values for the Plot of Percentage Bleaching Versus Time, Log � �⁄ Versus Log(��) for Freundlich Isotherm, and ��
� �⁄ Versus �� for Langmuir Isotherm at 60
oC.
A. C.
S/N Time Absorbance Amount Adsorbed(X)
% Bleaching
x/m logx/m xe (1 – x)
log(xe) xe/x/m
0 0 0.999 0 0 0 0 0 0 0 1 10 0.851 0.148 14.815 0.007 -2.131 0.852 -0.069 115.135 2 20 0.799 0.200 20.021 0.010 -2.000 0.800 -0.097 80.000 3 30 0.685 0.314 31.411 0.016 -1.796 0.686 -0.164 42.875 4 40 0.641 0.358 35.836 0.018 -1.745 0.642 -0.192 35.667 5 50 0.616 0.383 38.338 0.019 -1.721 0.617 -0.209 32.474
F. E.
S/N Time Absorbance Amount Adsorbed(X)
% Bleaching
X/m LogX/m Xe (1 – x)
LogXe Xe/X/m
0 0 0.999 0 0 0 0 0 0 0 1 10 0.824 0.175 17.581 0.009 -2.058 0.825 -0.084 94.286 2 20 0.702 0.297 29.730 0.015 -1.824 0.703 -0.153 46.867 3 30 0.694 0.305 30.531 0.015 -1.824 0.695 -0.158 46.333 4 40 0.655 0.344 34.434 0.017 -1.769 0.656 -0.183 38.588 5 50 0.599 0.400 40.041 0.020 -1.699 0.600 -0.222 30.000
A. N. C.
S/N Time Absorbance Amount Adsorbed(X)
% Bleaching
X/m LogX/m Xe (1 – x)
LogXe Xe/X/m
0 0 0.999 0 0 0 0 0 0 0 1 10 0.799 0.200 20.021 0.010 -2.000 0.800 -0.097 80.000 2 20 0.700 0.299 29.930 0.015 -1.824 0.701 -0.152 46.733 3 30 0.675 0.324 32.432 0.016 -1.769 0.676 -0.170 42.250 4 40 0.638 0.361 36.136 0.018 -1.745 0.639 -0.194 35.500
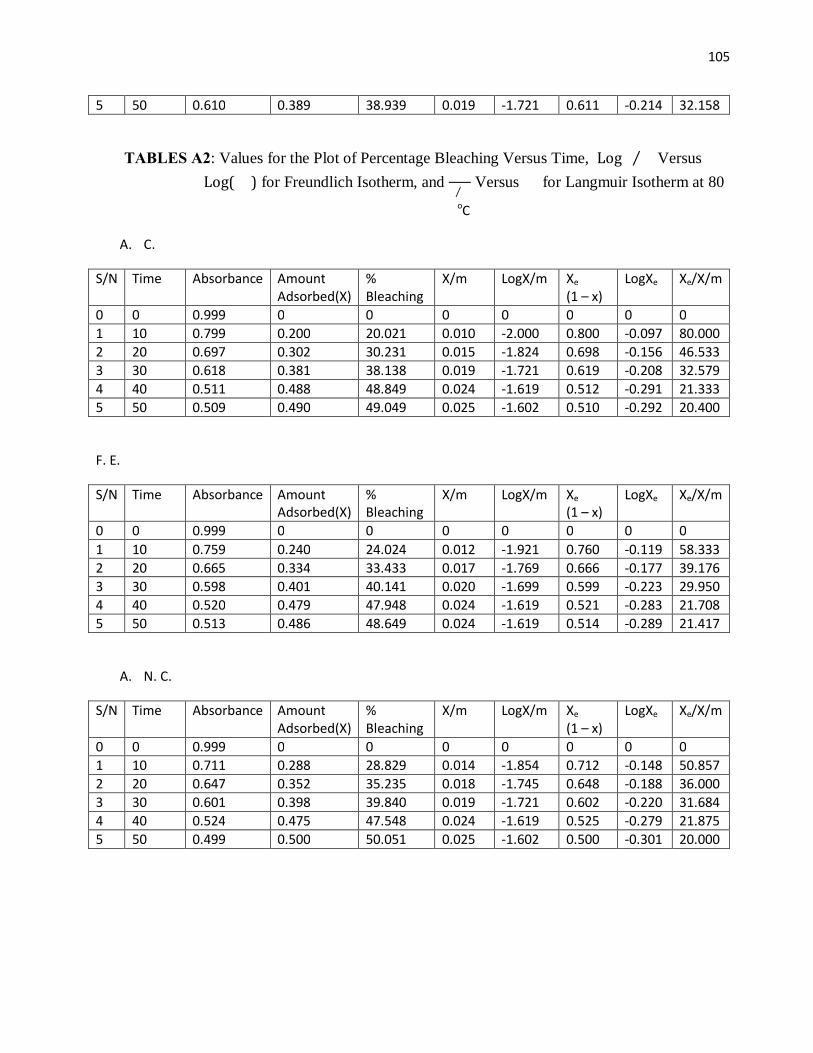
105
5 50 0.610 0.389 38.939 0.019 -1.721 0.611 -0.214 32.158
TABLES A2: Values for the Plot of Percentage Bleaching Versus Time, Log � �⁄ Versus Log(��) for Freundlich Isotherm, and ��
� �⁄ Versus �� for Langmuir Isotherm at 80
oC
A. C.
S/N Time Absorbance Amount Adsorbed(X)
% Bleaching
X/m LogX/m Xe (1 – x)
LogXe Xe/X/m
0 0 0.999 0 0 0 0 0 0 0 1 10 0.799 0.200 20.021 0.010 -2.000 0.800 -0.097 80.000 2 20 0.697 0.302 30.231 0.015 -1.824 0.698 -0.156 46.533 3 30 0.618 0.381 38.138 0.019 -1.721 0.619 -0.208 32.579 4 40 0.511 0.488 48.849 0.024 -1.619 0.512 -0.291 21.333 5 50 0.509 0.490 49.049 0.025 -1.602 0.510 -0.292 20.400
F. E.
S/N Time Absorbance Amount Adsorbed(X)
% Bleaching
X/m LogX/m Xe (1 – x)
LogXe Xe/X/m
0 0 0.999 0 0 0 0 0 0 0 1 10 0.759 0.240 24.024 0.012 -1.921 0.760 -0.119 58.333 2 20 0.665 0.334 33.433 0.017 -1.769 0.666 -0.177 39.176 3 30 0.598 0.401 40.141 0.020 -1.699 0.599 -0.223 29.950 4 40 0.520 0.479 47.948 0.024 -1.619 0.521 -0.283 21.708 5 50 0.513 0.486 48.649 0.024 -1.619 0.514 -0.289 21.417
A. N. C.
S/N Time Absorbance Amount Adsorbed(X)
% Bleaching
X/m LogX/m Xe (1 – x)
LogXe Xe/X/m
0 0 0.999 0 0 0 0 0 0 0 1 10 0.711 0.288 28.829 0.014 -1.854 0.712 -0.148 50.857 2 20 0.647 0.352 35.235 0.018 -1.745 0.648 -0.188 36.000 3 30 0.601 0.398 39.840 0.019 -1.721 0.602 -0.220 31.684 4 40 0.524 0.475 47.548 0.024 -1.619 0.525 -0.279 21.875 5 50 0.499 0.500 50.051 0.025 -1.602 0.500 -0.301 20.000

106
TABLES A3: Values for the Plot of Percentage Bleaching Versus Time, Log � �⁄ Versus Log(��) for Freundlich Isotherm, and ��
� �⁄ Versus �� for Langmuir Isotherm at 100 oC
A. C.
S/N Time Absorbance Amount Adsorbed(X)
% Bleaching
X/m LogX/m Xe (1 – x)
LogXe Xe/X/m
0 0 0.999 0 0 0 0 0 0 0 1 10 0.654 0.345 34.535 0.017 -1.769 0.655 -0.184 38.529 2 20 0.490 0.509 50.951 0.025 -1.602 0.491 -0.309 19.640 3 30 0.255 0.744 74.474 0.037 -1.432 0.256 -0.592 6.919 4 40 0.239 0.760 76.076 0.038 -1.420 0.240 -0.619 6.316 5 50 0.229 0.777 77.077 0.039 -1.409 0.223 -0.652 5.718
F. E.
S/N Time Absorbance Amount Adsorbed(X)
% Bleaching
X/m LogX/m Xe (1 – x)
LogXe Xe/X/m
0 0 0.999 0 0 0 0 0 0 0 1 10 0.599 0.400 40.041 0.020 -1.699 0.600 -0.222 30.000 2 20 0.502 0.497 49.750 0.025 -1.602 0.503 -0.298 20.120 3 30 0.272 0.727 72.773 0.036 -1.440 0.273 -0.564 7.583 4 40 0.234 0.765 76.577 0.038 -1.420 0.235 -0.629 6.184 5 50 0.223 0.776 77.678 0.039 -1.409 0.224 -0.649 5.744
A. N. C.
S/N Time Absorbance Amount Adsorbed(X)
% Bleaching
X/m LogX/m Xe (1 – x)
LogXe Xe/X/m
0 0 0.999 0 0 0 0 0 0 0 1 10 0.621 0.378 37.838 0.019 -1.721 0.622 -0.206 32.737 2 20 0.498 0.501 50.151 0.025 -1.602 0.499 -0.302 19.960 3 30 0.277 0.722 72.272 0.036 -1.444 0.278 -0.556 7.722 4 40 0.244 0.755 75.576 0.038 -1.420 0.245 -0.611 6.447 5 50 0.211 0.788 78.879 0.039 -1.409 0.212 -0.674 5.436

107
TABLES A4: Values for the Plot of Percentage Bleaching Versus Time, Log � �⁄ Versus Log(��) for Freundlich Isotherm, and ��
� �⁄ Versus �� for Langmuir Isotherm at 120 oC
A. C.
S/N Time Absorbance Amount Adsorbed(X)
% Bleaching
X/m LogX/m Xe (1 – x)
LogXe Xe/X/m
0 0 0.999 0 0 0 0 0 0 0 1 10 0.611 0.388 38.839 0.019 -1.721 0.612 -0.213 32.211 2 20 0.495 0.504 50.451 0.025 -1.602 0.496 -0.305 19.840 3 30 0.241 0.758 75.876 0.038 -1.420 0.242 -0.616 6.368 4 40 0.239 0.760 76.076 0.038 -1.420 0.240 -0.619 6.316 5 50 0.221 0.778 77.878 0.039 -1.409 0.222 -0.654 5.692
F. E.
S/N Time Absorbance Amount Adsorbed(X)
% Bleaching
X/m LogX/m Xe (1 – x)
LogXe Xe/X/m
0 0 0.999 0 0 0 0 0 0 0 1 10 0.600 0.399 39.940 0.019 -1.721 0.601 -0.221 31.632 2 20 0.500 0.499 49.950 0.025 -1.602 0.501 -0.300 20.040 3 30 0.299 0.700 70.071 0.035 -1.456 0.300 -0.523 8.571 4 40 0.243 0.756 75.676 0.038 -1.420 0.244 -0.613 6.421 5 50 0.211 0.788 78.879 0.039 -1.409 0.212 -0.674 5.436
A. N. C.
S/N Time Absorbance Amount Adsorbed(X)
% Bleaching
X/m LogX/m Xe (1 – x)
LogXe Xe/X/m
0 0 0.999 0 0 0 0 0 0 0 1 10 0.600 0.399 39.940 0.019 -1.721 0.601 -0.221 31.632 2 20 0.505 0.494 49.449 0.024 -1.619 0.506 -0.296 21.083 3 30 0.250 0.749 74.975 0.037 -1.432 0.251 -0.600 6.784 4 40 0.231 0.768 76.877 0.038 -1.420 0.232 -0.635 6.105 5 50 0.214 0.785 78.579 0.039 -1.409 0.215 -0.668 5.513

108
TABLES A5: Values for the Plot of Percentage Bleaching Versus Time, Log � �⁄ Versus Log(��) for Freundlich Isotherm, and ��
� �⁄ Versus �� for Langmuir Isotherm at 140 oC
A. C.
S/N Time Absorbance Amount Adsorbed(X)
% Bleaching
X/m LogX/m Xe (1 – x)
LogXe Xe/X/m
0 0 0.999 0 0 0 0 0 0 0 1 10 0.559 0.440 44.044 0.022 -1.658 0.560 -0.252 25.455 2 20 0.416 0.583 58.358 0.029 -1.538 0.417 -0.379 14.379 3 30 0.226 0.773 77.377 0.039 -1.409 0.227 -0.644 5.821 4 40 0.220 0.779 77.978 0.039 -1.409 0.221 -0.656 5.667 5 50 0.215 0.784 78.478 0.039 -1.409 0.216 -0.666 5.538
F. E.
S/N Time Absorbance Amount Adsorbed(X)
% Bleaching
X/m LogX/m Xe (1 – x)
LogXe Xe/X/m
0 0 0.999 0 0 0 0 0 0 0 1 10 0.600 0.399 39.940 0.019 -1.721 0.601 -0.221 31.632 2 20 0.432 0.567 56.757 0.028 -1.553 0.433 -0.364 15.464 3 30 0.235 0.764 76.476 0.038 -1.420 0.236 -0.627 6.211 4 40 0.211 0.788 78.879 0.039 -1.409 0.212 -0.674 5.436 5 50 0.209 0.790 79.079 0.039 -1.409 0.210 -0.678 5.385
A. N. C.
S/N Time Absorbance Amount Adsorbed(X)
% Bleaching
X/m LogX/m Xe (1 – x)
LogXe Xe/X/m
0 0 0.999 0 0 0 0 0 0 0 1 10 0.571 0.428 42.843 0.021 -1.678 0.572 -0.243 27.238 2 20 0.481 0.518 51.852 0.026 -1.585 0.482 -0.317 18.538 3 30 0.222 0.777 77.778 0.039 -1.409 0.223 -0.652 5.718 4 40 0.210 0.789 78.979 0.039 -1.409 0.211 -0.676 5.410 5 50 0.209 0.790 79.079 0.039 -1.409 0.210 -0.678 5.385

109
APPENDIX B
TABLE OF VALUES FOR THE ADSORPTION THERMODYNAMIC PLOT AT CONSTANT TIME
TABLES B1: Values for the Plot of ���� Versus 1 �� at 10 min
A.C
S/N Tempt (K) Tempt (K-
1) lnKf = ln(X/Xe)
1 333 0.0030 -1.749 2 353 0.0028 -1.386 3 373 0.0027 -0.781 4 393 0.0025 -0.583 5 413 0.0024 -0.476
F.E
S/N Tempt (K) Tempt (K-
1) lnKf = ln(X/Xe)
1 333 0.0030 -1.551 2 353 0.0028 -0.863 3 373 0.0027 -0.823 4 393 0.0025 -0.646 5 413 0.0024 -0.405
A.N.C
S/N Tempt (K) Tempt (K-
1) lnKf = ln(X/Xe)
1 333 0.0030 -1.386 2 353 0.0028 -0.851 3 373 0.0027 -0.736 4 393 0.0025 -0.571 5 413 0.0024 -0.451

110
TABLES B2: Values for the Plot of ���� Versus 1 �� at 20 mins
A.C
S/N Tempt (K) Tempt (K-
1) lnKf = ln(X/Xe)
1 333 0.0030 -1.386 2 353 0.0028 -0.837 3 373 0.0027 -0.485 4 393 0.0025 -0.048 5 413 0.0024 -0.039
F.E
S/N Tempt (K) Tempt (K-
1) lnKf = ln(X/Xe)
1 333 0.0030 -1.152 2 353 0.0028 -0.689 3 373 0.0027 -0.402 4 393 0.0025 -0.084 5 413 0.0024 -0.056 A.N.C
S/N Tempt (K) Tempt (K-
1) lnKf = ln(X/Xe)
1 333 0.0030 -0.906 2 353 0.0028 -0.599 3 373 0.0027 -0.414 4 393 0.0025 -0.099 5 413 0.0024 0
TABLES B3: Values for the Plot of ���� Versus 1 �� at 30 mins
A.C
S/N Tempt (K) Tempt (K-
1) lnKf = ln(X/Xe)
1 333 0.0030 -0.641 2 353 0.0028 0.036 3 373 0.0027 1.067 4 393 0.0025 1.153 5 413 0.0024 1.248

111
F.E
S/N Tempt (K) Tempt (K-
1) lnKf = ln(X/Xe)
1 333 0.0030 -0.405 2 353 0.0028 -0.012 3 373 0.0027 0.979 4 393 0.0025 1.180 5 413 0.0024 1.242
A.N.C
S/N Tempt (K) Tempt (K-
1) lnKf = ln(X/Xe)
1 333 0.0030 -0.498 2 353 0.0028 0.004 3 373 0.0027 0.954 4 393 0.0025 1.126 5 413 0.0024 1.313
TABLES B4: Values for the Plot of ���� Versus 1 �� at 40 mins
A.C
S/N Tempt (K) Tempt (K-
1) lnKf ln(X/Xe)
1 333 0.0030 -0.456 2 353 0.0028 0.016 3 373 0.0027 1.142 4 393 0.0025 1.153 5 413 0.0024 1.254
F.E
S/N Tempt (K) Tempt (K-
1) lnKf = ln(X/Xe)
1 333 0.0030 -0.409 2 353 0.0028 0.996 3 373 0.0027 0.847 4 393 0.0025 1.131 5 413 0.0024 1.313

112
A.N.C
S/N Tempt (K) Tempt (K-
1) lnKf = ln(X/Xe)
1 333 0.0030 -0.409 2 353 0.0028 -0.024 3 373 0.0027 1.093 4 393 0.0025 1.197 5 413 0.0024 1.295
TABLES B5: Values for the Plot of ���� Versus 1 �� at 50 mins
A.C
S/N Tempt (K) Tempt (K-
1) lnKf = ln(X/Xe)
1 333 0.0030 -0.241 2 353 0.0028 0.335 3 373 0.0027 1.225 4 393 0.0025 1.259 5 413 0.0024 1.289
F.E
S/N Tempt (K) Tempt (K-
1) lnKf = ln(X/Xe)
1 333 0.0030 -0.409 2 353 0.0028 0.269 3 373 0.0027 1.175 4 393 0.0025 1.313 5 413 0.0024 1.325
A.N.C
S/N Tempt (K) Tempt (K-
1) lnKf = ln(X/Xe)
1 333 0.0030 -0.290 2 353 0.0028 0.072 3 373 0.0027 1.248 4 393 0.0025 1.319 5 413 0.0024 1.325

113
APPENDIX C
TABLE OF VALUES FOR THE ADSORPTION KINETIC PLOTS AT CONSTANT TEMPERATURES
KINETIC PARAMETERS
TABLES C1: Values for the Plots of 1 ��� Versus �(�) for Pseudo-second Order, �� Versus Ln � for Elovich Model and Log � Versus Log � for Power Function Equation at 60 oC
AC
S/N Time (s) log t ln t qt 1/qt log qt 1 10 1 2.30 0.148 6.757 -0.829 2 20 1.30 2.99 0.200 0.5 -0.699 3 30 1.48 3.40 0.314 3.184 -0.503 4 40 1.60 3.69 0.358 2.793 -0.446 5 50 1.69 3.91 0.383 2.611 -0.417
FE
S/N Time (s) log t ln t qt 1/qt log qt 1 10 1 2.30 0.175 5.714 -0.757 2 20 1.30 2.99 0.297 3.367 -0.527 3 30 1.48 3.40 0.305 3.279 -0.516 4 40 1.60 3.69 0.344 2.907 -0.463 5 50 1.69 3.91 0.400 2.500 -0.398
ANC
S/N Time (s) log t ln t qt 1/qt log qt 1 10 1 2.30 0.200 5.000 -0.699 2 20 1.30 2.99 0.299 3.344 -0.524 3 30 1.48 3.40 0.324 3.086 -0.489 4 40 1.60 3.69 0.361 2.770 -0.442 5 50 1.69 3.91 0.389 2.571 -0.410

114
TABLES C2: Values for the Plots of 1 ��� Versus �(�) for Pseudo-second Order, �� Versus Ln � for Elovich model and Log � Versus Log � for Power Function Equation at 80 oC
AC
S/N Time (s) log t ln t qt 1/qt log qt 1 10 1 2.30 0.200 5.000 -0.699 2 20 1.30 2.99 0.302 3.311 -0.519 3 30 1.48 3.40 0.381 2.625 -0.419 4 40 1.60 3.69 0.488 2.049 -0.312 5 50 1.69 3.91 0.490 2.041 -0.309
FE
S/N Time (s) log t ln t qt 1/qt log qt 1 10 1 2.30 0.240 4.167 -0.619 2 20 1.30 2.99 0.334 2.994 -0.476 3 30 1.48 3.40 0.401 2.494 -0.397 4 40 1.60 3.69 0.479 2.088 -0.319 5 50 1.69 3.91 0.486 2.058 -0.311
ANC
S/N Time (s) log t ln t qt 1/qt log qt 1 10 1 2.30 0.288 3.472 -0.541 2 20 1.30 2.99 0.352 2.841 -0.453 3 30 1.48 3.40 0.398 2.513 -0.400 4 40 1.60 3.69 0.475 2.105 -0.323 5 50 1.69 3.91 0.500 2.000 -0.301
TABLES C3: Values for the Plots of 1 ��� Versus �(�) for Pseudo-second Order, �� Versus Ln � for Elovich Model and Log � Versus Log � for Power Function Equation at 100 oC
AC
S/N Time (s) log t ln t qt 1/qt log qt 1 10 1 2.30 0.345 2.899 -0.462 2 20 1.30 2.99 0.509 1.965 -0.293 3 30 1.48 3.40 0.744 1.344 -0.128 4 40 1.60 3.69 0.760 1.316 -0.119 5 50 1.69 3.91 0.777 1.287 -0.105
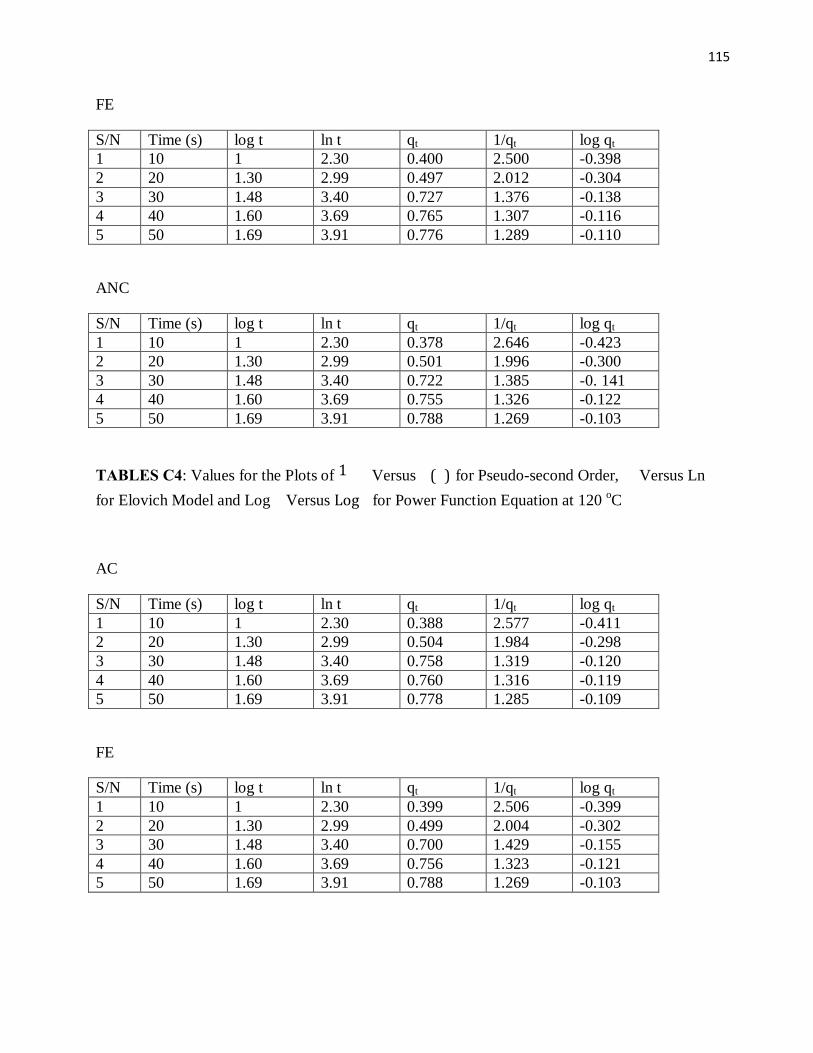
115
FE
S/N Time (s) log t ln t qt 1/qt log qt 1 10 1 2.30 0.400 2.500 -0.398 2 20 1.30 2.99 0.497 2.012 -0.304 3 30 1.48 3.40 0.727 1.376 -0.138 4 40 1.60 3.69 0.765 1.307 -0.116 5 50 1.69 3.91 0.776 1.289 -0.110
ANC
S/N Time (s) log t ln t qt 1/qt log qt 1 10 1 2.30 0.378 2.646 -0.423 2 20 1.30 2.99 0.501 1.996 -0.300 3 30 1.48 3.40 0.722 1.385 -0. 141 4 40 1.60 3.69 0.755 1.326 -0.122 5 50 1.69 3.91 0.788 1.269 -0.103
TABLES C4: Values for the Plots of 1 ��� Versus � (�) for Pseudo-second Order, �� Versus Ln � for Elovich Model and Log � Versus Log � for Power Function Equation at 120 oC
AC
S/N Time (s) log t ln t qt 1/qt log qt 1 10 1 2.30 0.388 2.577 -0.411 2 20 1.30 2.99 0.504 1.984 -0.298 3 30 1.48 3.40 0.758 1.319 -0.120 4 40 1.60 3.69 0.760 1.316 -0.119 5 50 1.69 3.91 0.778 1.285 -0.109
FE
S/N Time (s) log t ln t qt 1/qt log qt 1 10 1 2.30 0.399 2.506 -0.399 2 20 1.30 2.99 0.499 2.004 -0.302 3 30 1.48 3.40 0.700 1.429 -0.155 4 40 1.60 3.69 0.756 1.323 -0.121 5 50 1.69 3.91 0.788 1.269 -0.103

116
ANC
S/N Time (s) log t ln t qt 1/qt log qt 1 10 1 2.30 0.399 2.506 -0.399 2 20 1.30 2.99 0.494 2.024 -0.306 3 30 1.48 3.40 0.749 1.335 -0.126 4 40 1.60 3.69 0.768 1.302 -0.115 5 50 1.69 3.91 0.785 1.274 -0.105
TABLES C5: Values for the Plots of 1 ��� Versus � (�) for Pseudo-second Order, ��Versus Ln � for Elovich Model and Log � Versus Log � for Power Function Equation at 140 oC
AC
S/N Time (s) log t ln t qt 1/qt log qt 1 10 1 2.30 0.440 2.273 -0.357 2 20 1.30 2.99 0.583 1.175 -0.234 3 30 1.48 3.40 0.773 1.294 -0.112 4 40 1.60 3.69 0.779 1.284 -0.114 5 50 1.69 3.91 0.784 1.276 -0.106
FE
S/N Time (s) log t ln t qt 1/qt log qt 1 10 1 2.30 0.399 2.506 -0.399 2 20 1.30 2.99 0.567 1.764 -0.246 3 30 1.48 3.40 0.764 1.309 -0.117 4 40 1.60 3.69 0.788 1.269 -0.103 5 50 1.69 3.91 0.790 1.266 -0.102
ANC
S/N Time (s) log t ln t qt 1/qt log qt 1 10 1 2.30 0.428 2.336 -0.369 2 20 1.30 2.99 0.518 1.931 -0.286 3 30 1.48 3.40 0.777 1.287 -0.109 4 40 1.60 3.69 0.789 1.267 -0.103 5 50 1.69 3.91 0.790 1.266 -0.102

117
APPENDIX D DETAILED X-RAY DIFFRACTION ANALYSIS (XRD) RESULT
Appendix D 1
Name and Formula Reference code: 00-058-2002 Mineral name: Dickite-2M1 PDF index name: Aluminum Silicate Hydroxide Empirical formula: Al2H4O9Si2 Chemical formula: Al2Si2O5 ( OH )4 Crystallographic Parameters Crystal system: Monoclinic Space group: Cc Space group number: 9 a (Å): 5.1477 b (Å): 8.9396 c (Å): 14.4164 Alpha (°): 90.0000 Beta (°): 96.7182 Gamma (°): 90.0000 Measured density (g/cm^3): 2.58 Volume of cell (10^6 pm^3): 658.86 Z: 4.00 RIR: - Subfiles and Quality Subfiles: Inorganic Mineral Common Phase Forensic Pharmaceutical Excipient Quality: Indexed (I) Comments

118
General comments: Data collected using a 0.02° step scan with a count time of 0.5
seconds. Sample source: Sample from Thomaston section of Pinecolliery, Schulykill Co.,
Pennsylvania, USA. Sample preparation: The sample was settled in water for 4 hours to obtain <2
micrometer particles. Specimen was an oriented preparation on a glass slide.
Unit cell: Cell and hkl values were assigned using data from PDF 00-058-2003. Unit cell refinement was not possible because too few peaks were identified.
Temperature: Pattern taken at 298 K. References Primary reference: Smith, D., Pennsylvania State Univ., University Park, PA, USA.,
Private Communication, (1983) Peak List No. h k l d [A] 2Theta[deg] I [%] 1 0 0 2 7.16160 12.349 100.0 2 1 1 0 4.45970 19.893 0.4 3 0 0 4 3.58310 24.829 78.3 4 0 0 6 2.38820 37.634 11.1 Stick Pattern

119
APPENDIX D 2 Name and Formula Reference code: 00-021-0958 Mineral name: Palygorskite PDF index name: Magnesium Aluminum Silicate Hydroxide Hydrate Empirical formula: H18Mg5O30Si8 Chemical formula: ( Mg , Al )5 ( Si , Al )8O20 ( OH )2 ·8H2O Crystallographic Parameters Crystal system: Monoclinic Space group: Pn Space group number: 7 a (Å): 12.7800 b (Å): 17.8300 c (Å): 5.2400 Alpha (°): 90.0000 Beta (°): 95.7700
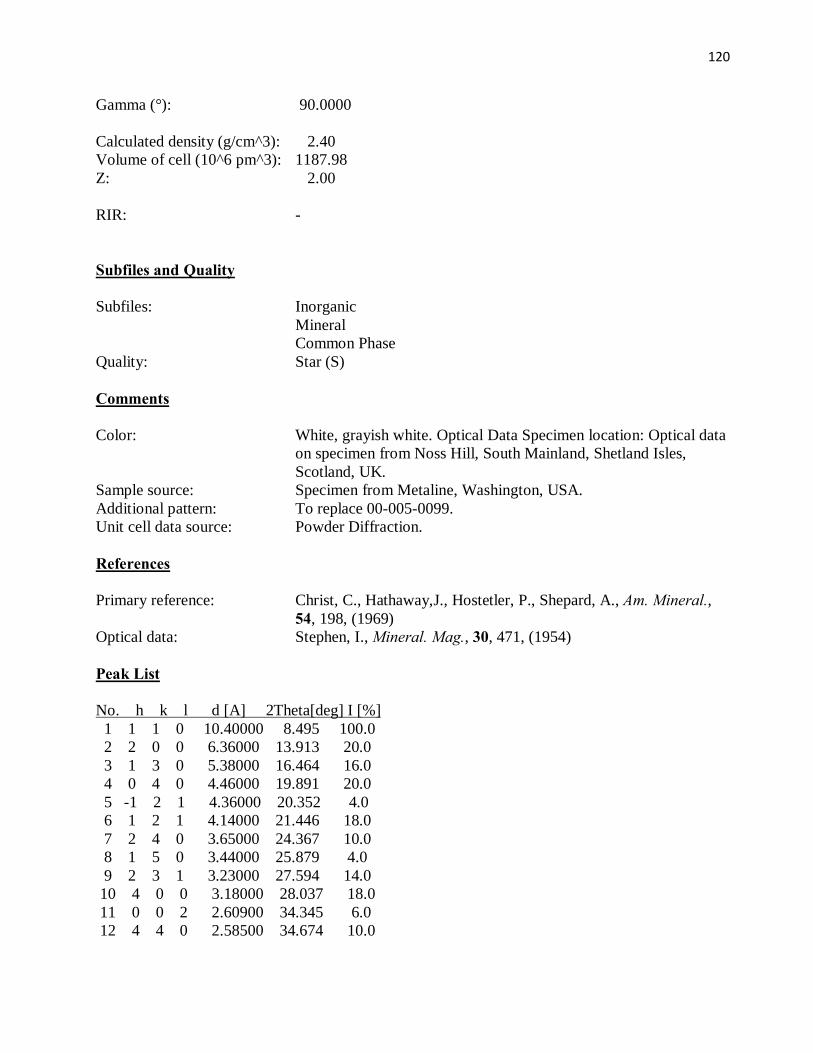
120
Gamma (°): 90.0000 Calculated density (g/cm^3): 2.40 Volume of cell (10^6 pm^3): 1187.98 Z: 2.00 RIR: - Subfiles and Quality Subfiles: Inorganic Mineral Common Phase Quality: Star (S) Comments Color: White, grayish white. Optical Data Specimen location: Optical data
on specimen from Noss Hill, South Mainland, Shetland Isles, Scotland, UK.
Sample source: Specimen from Metaline, Washington, USA. Additional pattern: To replace 00-005-0099. Unit cell data source: Powder Diffraction. References Primary reference: Christ, C., Hathaway,J., Hostetler, P., Shepard, A., Am. Mineral.,
54, 198, (1969) Optical data: Stephen, I., Mineral. Mag., 30, 471, (1954) Peak List No. h k l d [A] 2Theta[deg] I [%] 1 1 1 0 10.40000 8.495 100.0 2 2 0 0 6.36000 13.913 20.0 3 1 3 0 5.38000 16.464 16.0 4 0 4 0 4.46000 19.891 20.0 5 -1 2 1 4.36000 20.352 4.0 6 1 2 1 4.14000 21.446 18.0 7 2 4 0 3.65000 24.367 10.0 8 1 5 0 3.44000 25.879 4.0 9 2 3 1 3.23000 27.594 14.0 10 4 0 0 3.18000 28.037 18.0 11 0 0 2 2.60900 34.345 6.0 12 4 4 0 2.58500 34.674 10.0

121
13 -1 6 1 2.55500 35.094 10.0 14 1 6 1 2.50600 35.803 12.0 Stick Pattern

122
APPENDIX D 3 Name and Formula Reference code: 00-001-0527 Mineral name: Kaolinite PDF index name: Aluminum Silicate Hydrate Empirical formula: Al2H4O9Si2 Chemical formula: Al2Si2O5 ( OH )4 Crystallographic Parameters Crystal system: Anorthic a (Å): 5.1400 b (Å): 8.9300 c (Å): 7.3700 Alpha (°): 91.8000 Beta (°): 104.5000 Gamma (°): 90.0000 Measured density (g/cm^3): 2.58 Volume of cell (10^6 pm^3): 327.34 RIR: - Status, Subfiles and Quality Status: Marked as deleted by ICDD Subfiles: Inorganic Mineral Pharmaceutical Excipient Quality: Indexed (I) Comments Deleted by: Deleted by 00-005-0143, replaced by 00-014-0164, 00-012-0447. Color: Colorless. Additional pattern: See PDF 00-006-0221. References

123
Primary reference: Hanawalt. et al., Anal. Chem., 10, 475, (1938) Optical data: Ross, Kerr., U.S. Geol. Surv. Prof. Paper, 165, (1930) Unit cell: Brindley, Robinson., Mineral. Mag., 27, 42, (1946) Peak List No. h k l d [A] 2Theta[deg] I [%] 1 0 0 1 7.20000 12.283 80.0 2 0 2 0 4.45000 19.936 80.0 3 1 1 0 4.30000 20.639 64.0 4 -1 -1 1 4.20000 21.136 48.0 5 -1 1 1 4.04000 21.984 32.0 6 0 0 2 3.59000 24.780 100.0 7 1 -3 0 2.56000 35.023 48.0 8 -1 3 1 2.50000 35.892 48.0 9 1 -3 1 2.34000 38.439 80.0 10 1 -3 2 1.99000 45.547 32.0 11 2 3 0 1.90000 47.835 8.0 12 -2 -3 2 1.85000 49.212 8.0 13 -2 2 3 1.80000 50.674 8.0 14 1 4 2 1.67000 54.937 40.0 15 -1 3 4 1.54000 60.026 16.0 16 1 -5 2 1.49000 62.260 56.0 17 3 2 2 1.31000 72.033 8.0 18 1 0 5 1.29000 73.330 16.0 19 2 -6 1 1.24000 76.809 16.0 Stick Pattern

124
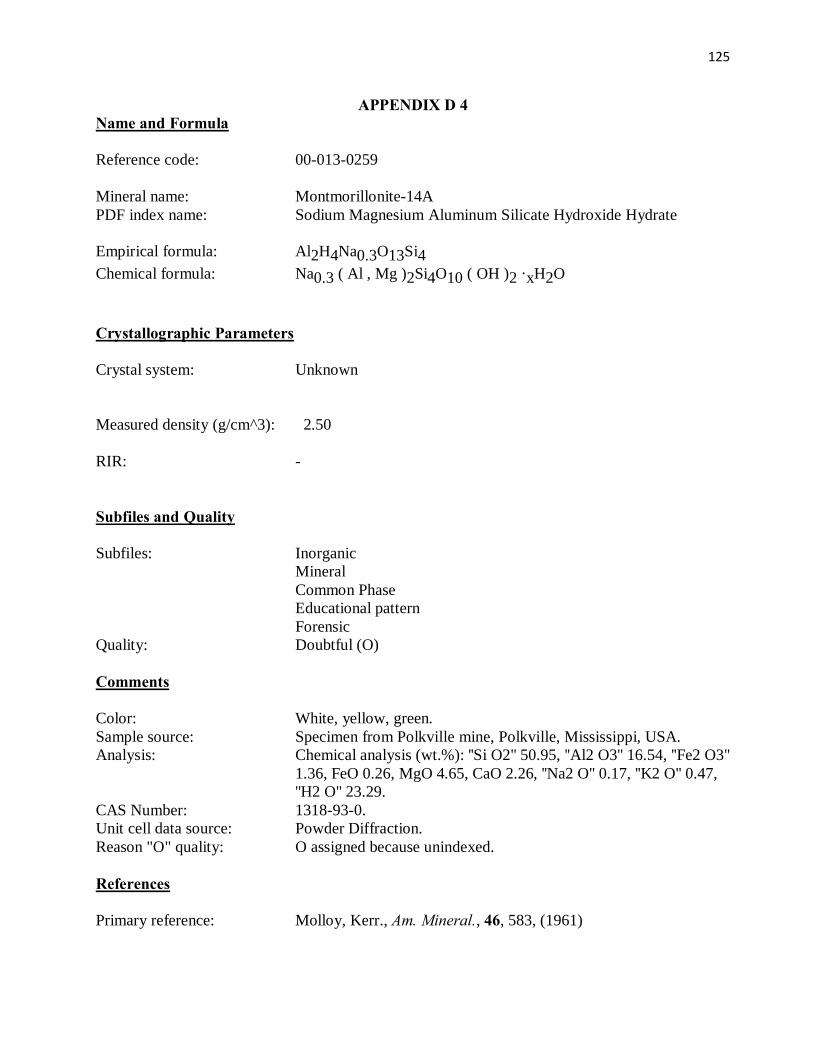
125
APPENDIX D 4 Name and Formula Reference code: 00-013-0259 Mineral name: Montmorillonite-14A PDF index name: Sodium Magnesium Aluminum Silicate Hydroxide Hydrate Empirical formula: Al2H4Na0.3O13Si4 Chemical formula: Na0.3 ( Al , Mg )2Si4O10 ( OH )2 ·xH2O Crystallographic Parameters Crystal system: Unknown Measured density (g/cm^3): 2.50 RIR: - Subfiles and Quality Subfiles: Inorganic Mineral Common Phase Educational pattern Forensic Quality: Doubtful (O) Comments Color: White, yellow, green. Sample source: Specimen from Polkville mine, Polkville, Mississippi, USA. Analysis: Chemical analysis (wt.%): ''Si O2'' 50.95, ''Al2 O3'' 16.54, ''Fe2 O3''
1.36, FeO 0.26, MgO 4.65, CaO 2.26, ''Na2 O'' 0.17, ''K2 O'' 0.47, ''H2 O'' 23.29.
CAS Number: 1318-93-0. Unit cell data source: Powder Diffraction. Reason "O" quality: O assigned because unindexed. References Primary reference: Molloy, Kerr., Am. Mineral., 46, 583, (1961)

126
Peak List No. h k l d [A] 2Theta[deg] I [%] 1 13.60000 6.494 100.0 2 4.47000 19.846 18.0 3 3.34000 26.668 10.0 4 3.23000 27.594 10.0 5 2.92000 30.591 8.0 6 2.59000 34.605 5.0 7 2.49000 36.041 5.0 Stick Pattern
Recommended


![[Anvil Christopher] Anvil, Christopher - Interstel(BookFi)](https://img.dokumen.tips/doc/110x75/577c7f1a1a28abe054a33ed5/anvil-christopher-anvil-christopher-interstelbookfi.jpg)