ESTIMATING PHOTOVOLTAIC POWER OUTPUT UNDER VARIANCE OF IRRADIANCE LEVELHaryo Agung Wibowo
Auckland University of TechnologyEmail: [email protected]

WHAT IS SOLAR ENERGY
•It is the largest sources of energy received on Earth
•Solar is a renewable sources of energy•Solar power would be a lot safer for the
environment and a lot better for the health people

GENERATING ELECTRICITYFROM SOLAR ENERGY
•Use semiconductor medium to convert sunlight into electricity
Crystalline Material
Thin Film Cell
Organic and Polymer Cell

GENERATING ELECTRICITYFROM SOLAR ENERGY
•Convert sunlight into DC voltage electricity
DC/AC Converter+
-

HOW DOES PV WORK?
•Photon of sunlight help excite an electron in semiconductor crossing a higher conduction band, leave electron – hole pair
--
--
-
++
++
+
Electric Field
Load

HOW DOES PV WORK?
--
--
-
+
•Junction with higher concentration of electron become negative pole
•Electric field are created between positive and negative junction
++
++
Electric Field
Load

•If external pathway is provided, electron will be swept away to the circuit. In macro view it was appeared as electric current
HOW DOES PV WORK?
--
--
-
++
++
+
Electric Field
Load

ADVANTAGES OF SOLAR PV SYSTEM•It converts solar energy directly into
electrical energy without going through thermal-mechanical link. It has no wear and tear part
•Solar PV system are reliable, modular, durable and generally maintenance free

ADVANTAGES OF SOLAR PV SYSTEM•These system are quiet, compatible with
almost all environments, expected life span for 20 years or more
Snowy, High Altitude Site
Desert Climate

ADVANTAGES OF SOLAR PV SYSTEM•It can be located at the place of use and
hence no distribution network is required
DISADVANTAGES OF SOLAR PV SYSTEM•At present the cost of solar cell are still
high, making them economically uncompetitive with other conventional power sources
Conventional Coal
Combined Cycle Gas
Plant
Geothermal Nuclear Wind Solar$0.00
$1,000.00
$2,000.00
$3,000.00
$4,000.00
$5,000.00
Pri
ce/
kW

DISADVANTAGES OF SOLAR PV SYSTEM• As solar energy produced only in the daylight
time, an energy storage is needed to make electricity available on demand which make the whole system more expensive.

DISADVANTAGES OF SOLAR PV SYSTEM•The efficiency of commercially available
solar cells are low•Large number of solar cell area are
required to generate power on utilities scale
Wind Turbine Monocrystalline Polycrsytalline Thin Film Polymer Cell0%
10%
20%
30%
40%

PROBLEM IDENTIFICATION
•How large the solar cell area is required to deliver particular energy amount?The answer depends on a number of locality factor:1.Solar irradiance2.Temperature3.Dust deposition density4.Manufacture mismatch tolerances5.Inverter efficiency6.Spectral distribution

PRIMARY CONCERN
•To know how large does PV size should be, we need to know exactly how does power output behave as a function of solar irradiance

CAN IT AFFECT POWER OUTPUT?
•In engineering sense, yes•As solar irradiance increase, the higher
number of photon hitting the modules.•In micro view, it release greater number
of electron crossing the conduction band and create more hole – electron pair
•Then higher electrical current and voltage will be resulted

HOW TO QUANTIFY?
•We have to be familiar with:1. Expected PV operating region2. Typical manufacture product datasheet

PV OPERATING REGION
•PV current – voltage (I-V) curve is used a basis to identify module circuit key parameter
Open Circuit Voltage (Voc)
Short Circuit Current (Isc)

PV OPERATING REGION• To determine where the system will actually be
operating, we need to find common spot where the I-V curve of the load and I-V curve of the PV intersect
Load I-V curve
System operating point

PV OPERATING REGION
•We always expect to boost the power into the maximum point

PV OPERATING REGION
•We always expect to boost the power into the maximum pointHow to do that:1. Control the PV or load or
both I-V curve simultaneously
2. Distribution network must be able to absorb whatever amount of the power being generated

PV OPERATING REGION• Given that two condition is possibly met, make
sense if we want to push the operation of PV always satisfying maximum power point (Pmp)
First Fact To Note:Pmp is always varying dependent on solar irradiance value encountered by PV

MANUFACTURE DATA SHEET

DATA SHEET IN I-V CURVE

DATA SHEET IN I-V CURVE
Isc
Voc
Vmp, Imp
1000 W/m2, 25 C,⁰1.5 AM

THE GAP • Loosing large amount of information outlining PV maximum
power output characteristic under natural sunlight condition.
Truth Facts:In Auckland, chance of receiving illumination at 990-1010 W/m2 (STC) are only less than 0.3% per year
That imply more than 99% , irradiance will be discovered outside of that range

WHAT DO WE GET SO FAR?
•Accept that PV is always regulated to achieve operation at maximum power point
•Know that manufacture will only provide PV parameter based on STC rating

THE GAP• Consequently, we do not know exactly how large the
scale of PV have to be implemented to meet minimum energy demand.
• Without such essential information is available, sensibly the most simple way to estimate the power output are using a linearization approach.
• However, that is too risky, as this solution may produce some degree of erroneous which affect the dimension overall system become way too underrated or oversized
• Underrate -> expected energy outcome will never be realized
• Oversize -> the capital cost may no longer suggest PV had competitive energy price as other renewable source

STUDY MOTIVATIONA guidance should be there to make engineer knowledgeable about the way to use various simple approach for predicting PV maximum power output within different irradiance value
• Not only that, they should also be advised about the degree of error will be generated from each method compare to the real PV output, so that necessary correction factor can be applied accordingly to the overall PV design to obtain correct system dimensioning.

RESEARCH GOAL
•Introduce various analytical method to predict PV maximum power output under different irradiance level using information suggested under STC rating
•Test the calculation model and observe the degree of accuracy compare to the information provided by manufacture datasheet
• The PV product used as data sheet references isSharp PV ND-220E1J polycrystalline cell

STUDIED ANALYTICAL METHOD
•Six algebraic method to correct from STC to any operating condition will be covered here:1. Whitfield and Osterwald2. Jones and Underwood3. Araujo and Sanchez4. Constant Efficiency Number5. Constant Fill Factor6. Variable Fill Factor

WHITFIELD AND OSTERWALD
•Due to lengthy formula should be completely written on each analytical method, it is only single formula will be presented here.
•One that pretty simple to use is: max max*
21000 /
mGP P
W m

VALIDATING THE METHODS• Each model are then tested under 4 illumination level
that is referred to a standard laboratory test supplied by manufacture (200, 400, 600, 800 W/m2)

VALIDATING THE METHODS• The calculation result is compared to the extracted
manufacture PV output performance:
• And the deviation are measured using following equation:

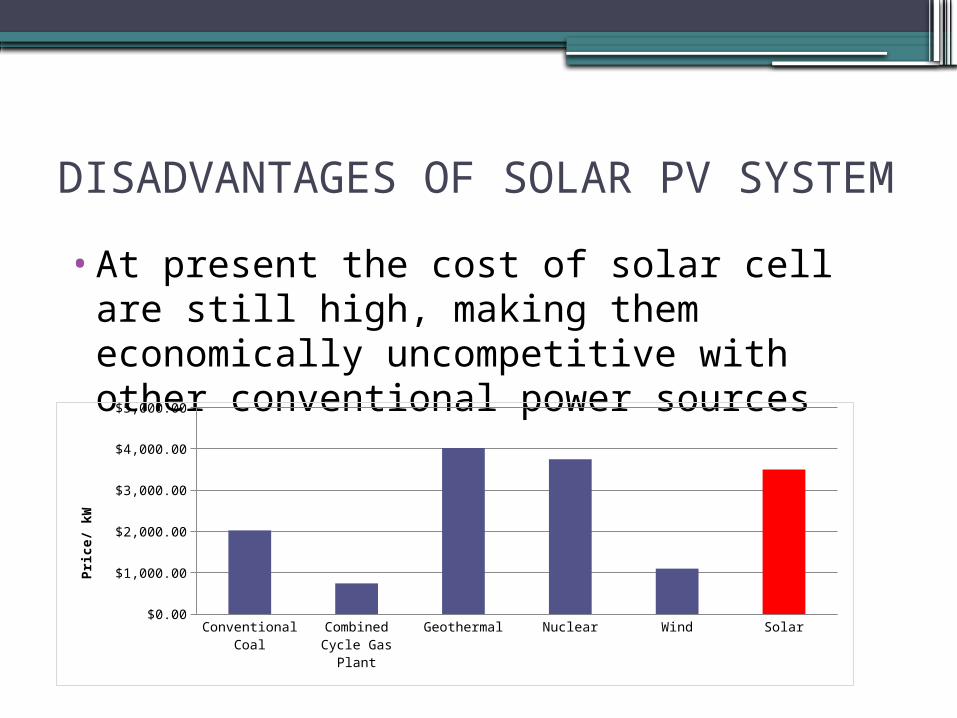
VALIDATING THE METHODS• The degree of erroneous between each method are
presented under following figure:

VALIDATING THE METHODS• All method return good
result with <5% error margin in the region close to 800 W/m2
• As the irradiance drop, deviation is amplified
• Whitfield and Osterwald, Variable Fill Factor method yield + 10% error when 400W/m2 is given as an input
VALIDATING THE METHODS• Best technique shown
least error (<10%) can be derived from Araujo and Sanchez method.
• The worst performance is achieved by Variable Fill Factor method because variance of Voc are not taken into account in the formula
• It should be anticipated that the error may become worse as high as >10% at irradiance <200 W/m2

ANOTHER FACTSHEET• From New Zealand National Institute of Water and
Atmospheric Research (NIWA) statistic it is interestingly revealed that around 82% global irradiance received in Auckland was found by less than 400W/m2
. It is equivalent with 32% of solar energy captured on PV surface every year.
• From that, the error prediction on PV annual energy yield, calculated from constant efficiency/Whitfield & Osterwald/ Variable Fill Factor method by not taking appropriate error correction measure, is around
32% x 10% = 3.2%

SUMMARY• Error cannot be avoided when predicting photovoltaic
power output using analytical method• It has been shown that method proposed by Araujo
and Sanchez has a good proximity with real PV characteristic represented in this case by Sharp ND-220E1J product
• To the existing available analytic method, the degree of accuracy need to be improved particularly for prediction PV power output under low irradiance regime

END OF PRESENTATION
Recommended