1
Paper to be presented at OECD Workshop on Productivity Analysis and
Measurement, Bern, 16-18 October 2006
Estimates of Labor and Total Factor Productivity
by 72 industries in Korea (1970-2003)
October 16, 2006
Hak K. Pyo, Keun Hee Rhee and Bongchan Ha*
*Seoul National University, Korea Productivity Center and Korea Institute
for Industrial Economics respectively. An earlier version of this paper (data
structure part) was presented at EU-KLEMS Workshop in Valencia, May 7-9,
2006. We acknowledge financial support by the Bank of Korea and Korea
Institute of International Economic Policy and research assistance of
Eunkyung Jeon and Sun Young Jung at Seoul National University.
[email protected] for correspondence.

2
Estimates of Labor and Total Factor Productivity by 72 industries in Korea (1970-2003)
Hak K. Pyo, Keun Hee Rhee and Bongchan Ha*
Abstract
As Krugman (1994), Young (1994), and Lau and Kim (1994)'s studies showed,
the East Asian economic miracle may be characterized as `input-led' growth.
However, both the stagnation in investment and the decrease in average
working hours combined with decrease in the fertility rate require a productivity
surge for a renewed sustainable growth in East Asia. The purpose of our study
is to identify the sources of economic growth based on a KLEMS model for the
Republic of Korea which experienced a financial crisis in 1997 after joining
OECD. We report estimates of KLEMS inputs and gross output in Korea based
on 72-industry classification following EU KLEMS project guidelines. We also
provide estimates of 72 industry-level labor productivity and total factor
productivity. We have found that Korea’s catch-up process with industrial
nations in its late industrialization has been predominantly input-led and
manufacturing based as documented in Timmer(1999) and Pyo (2001). We
have also found that TFP growth has been positively affected by the growth of
labor productivity and output growth. However, since its financial crisis in
December 1997, the sources of growth seem to have switched to TFP-growth
based and IT-intensive Service based. But lower productivity in service
industries due to regulations and lack of competition seems to work against
finding renewed sustainable growth path.
JEL-Classification: O14, O47
Key-Words: Labor Productivity, Total Factor Productivity, sustainable growth
*Seoul National University, Korea Productivity Center and Korea Institute for I
ndustrial Economics respectively. [email protected] for correspondence.

3
1. Introduction In recent years, especially since the 1997 economic crisis in the East Asian
countries including Korea, considerable changes have taken place in the
Korean economy, such as investment stagnation (see e.g. Pyo(2006) Pyo and
Ha (2005)), changes in production input patterns, and so on. One of the most
important changes is the demand for high productivity, which would
compensate the recent slowdowns of growth rates in capital and labor inputs.
As Krugman (1994), Young (1994), and Lau and Kim (1994) showed, the East
Asian economic miracle may be summarized as `input-led' growth. Korea was
no exception in this respect of growth pattern.
However, both the stagnation in investment and the decrease in average
working hours require a productivity surge for long-term growth in Korea. In
addition, a sharp decrease in the fertility rate in Korea necessitates productivity
increase in order to improve the present income level and facilitate the support
of the large elderly population by the small numbers of working age adults. For
these reasons, `productivity-driven' growth is indispensable for Korea.
According to Lewis (2004), the fast economic growth in Korea is the result of
both large labor input and capital accumulation. He argues that the average
working hours is 40% higher than that of the U.S., and almost a third of GDP
has been allocated to investment, while GDP per capita in Korea is about half of
the U.S. GDP per capita. The focus is changing from how much inputs are put
into production to how well those are organized.
The purpose of this paper is to explain the data structure of Korea for the
estimation of productivities by industry in KLEMS model and present preliminary
estimates of labor productivity and total factor productivity (TFP) at reasonably
detailed industry level. We have used 72-sector industrial classification following
the guidelines of EU KLEMS project for the future comparability with EU
member countries, the United States, and Japan. Therefore, an analysis based
on detailed industrial classification gives us better views on productivity and
growth, which is difficult to grasp in broader industrial classifications. Industries
in an economy have shown different productivity trends and growth patterns
according to their characteristics of production, competition policies, and other
economic and non-economic circumstances.

4
KLEMS model is a kind of gross output growth accounting in which output is
measured by gross output and inputs are decomposed by capital (K), labor (L),
energy (E), material (M), and service (S). Since this methodology is basically
based on gross output, it has the advantage of eliminating effects of
intermediate inputs from other industries on productivity, therefore allowing
productivities by industry to be more accurate. Moreover, the assumption on
real value-added production function (separability assumption) is not usually
guaranteed1, which also gives legitimacy to gross output growth accounting.
However, gross output growth accounting requires more information on
intermediate inputs than value-added growth accounting. Therefore, the data
structure for estimating productivity has to be consistent with not only national
income accounts but also input-output tables, Use and Make Matrix etc. and the
estimation methodology for unavailable data should be examined more carefully.
We have found that Korea’s catch-up process with industrial nations in its late
industrialization has been predominantly input-led and manufacturing based.
We have also found that TFP growth has been positively affected by the growth
of labor productivity and output growth. However, since its financial crisis in
December 1997, the sources of growth seem to have switched to TFP-growth
based and IT-intensive Service based. But lower productivity in service
industries due to regulations and lack of competition seems to work against
finding renewed sustainable growth path.
This paper is organized as follows. Section 2 examines data structure including
the methodology of measuring gross output by industry from Input-Output
Tables and National Accounts published by the Bank of Korea and input
measurements. Section 3 presents the estimates of labor productivity and TFP
by 72-industry and examines the relations between labor productivity and TFP
and between output growth and TFP growth by periods. Section 4 concludes
the paper.
1See Berndt and Christensen (1973,1974), Berndt and Wood (1974), Denny
and Fuss (1977), and Yuhn (1991) for the U.S., and Pyo and Ha (2006) for
Korea

5
2. Data Structure
2.1 Gross Output Data
National Accounts by the Bank of Korea (1999, 2004) report annual series
(1970-2002) of nominal gross outputs at basic prices, both nominal and real
value-added at basic prices, nominal compensation of employees, and
operating surplus at current prices of 21 industries including 9 manufacturing
industries. Those data can be extended to the year 2005 from ECOS (Economic
Statistics System) in the Bank of Korea website2. National Accounts (1987,
1994, 1999, 2004) also reports annual series (1985-2002) of both nominal and
real Make Tables (V-Tables) and real Use Tables (U-Tables).
In addition to nominal gross output and both nominal and real value-added, real
gross output at basic prices and real intermediate inputs at purchase prices can
be obtained from Use Tables. However, since Make Tables and Use Tables for
the years 1970-1984 and 2003-2004 are unavailable, we have generated them
through RAS method using annual data from National Accounts and Input-
Output Tables, and benchmark tables of 1985 and 2000, respectively. As the
published Use Tables of National Accounts in Korea present the Domestic and
Import Use Tables combined, we have not been able to isolate them into two
separate tables. In the case of Use Tables before 1995, all the intermediate
commodity inputs by industry are measured at purchase prices. Since 1995,
those inputs have been measured at incomplete basic prices in the sense that
those inputs include trade and transportation margins but isolate net production
tax to the last row of intermediate input matrix. Because we have no information
for transformation of the Use Tables from purchase prices to basic prices before
1995 and the Use Tables after 1995 have been measured at incomplete basic
prices, we have changed the Use Tables at basic price after 1995 into Use
Tables at purchase price allocating net production tax to each commodity
proportional to each volume.
2http://www.bok.or.kr

6
The Bank of Korea has also published Input-Output Tables (commodity-by-
commodity) since 1960. Its most recent 2000 Input-Output Table is the 19th
Table. The detailed description of Input-Output Tables during 1970-2000 is
summarized in Table 1. Input-Output Tables of Korea have relatively detailed
information, even though they are restricted to commodity-by-commodity tables.
For example, the table for 2000 has 28, 77, 168, 404 commodities in large,
medium, small, and basic classifications, respectively.
Table 1. Input-Output Tables in Korea
Year Basic Small Medium Large
1970 153 56
1973 153 56
1975 392 164 60
1978 164 60
1980 396 162 64
1983 396 162 64 19
1985 402 161 65 19
1986 161 65 20
1987 161 65 20
1988 161 65 20
1990 405 163 75 26
1993 163 75 26
1995 402 168 77 28
1998 168 77 28
2000 404 168 77 28
(Number of commodity classification)
(1) Estimation of Use Tables
While National Accounts do not contain detailed information about industries
(21 industries), our industrial classification is 72 industries according to EU
KLEMS classification (See Appendix Table A-1). In order to reconcile the
National Accounts data to our industrial classification, we have used other data
sources, such as Mining & Manufacturing Census and Surveys, Wholesale and

7
Retail Surveys, and so on. Since we do not have detailed information on
intermediate input structures, we have assumed the same intermediate input
structures for the industries belonging to the same category of National
Accounts classification. As for Input-Output Tables, they have detailed
commodity classifications enough to match the 21-commodity classification in
National Accounts. However, since they are not annually published, we have used interpolation method for the missing years. We have attached
reclassification of National Accounts into 72 industries in Appendix Table A-2.
Since the Bank of Korea reports nominal and real Make(V) Tables and real
Use(U) Tables, nominal Use Tables should be generated for obtaining nominal
intermediate input shares, which are used in estimating total factor productivity.
Following Timmer (2005), we have used the commodity prices to nominalize all
uses of the commodities under the assumption that the same commodity has
the same price whichever industry uses it.
where PijX
denotes a price index for intermediate input of commodity i in
industry j , and PiC denotes a price index of commodity i .
The commodity prices ( PiC ) we have used are the weighted averages of
domestic and imported commodity prices, since the Use Tables cannot be
separated into domestic and imported Use Tables to apply separated prices.
Producer's Price Index (PPI) has been used as a proxy for domestic commodity
prices ( PiD ), and Imported Price Index (CIF) has been used as imported
commodity prices( PiIM ). Even though PPI is not purchaser's price for the lack
of transportation and trade margins, it is a reasonable proxy for domestic
commodity price index.
The above procedure can be shown as follows:
We can derive real domestic commodity inputs ( XiD ) subtracting real imported
8
commodity inputs in Input-Output Tables ( XiIM ) from real commodity inputs in
Use Tables ( Xi ).
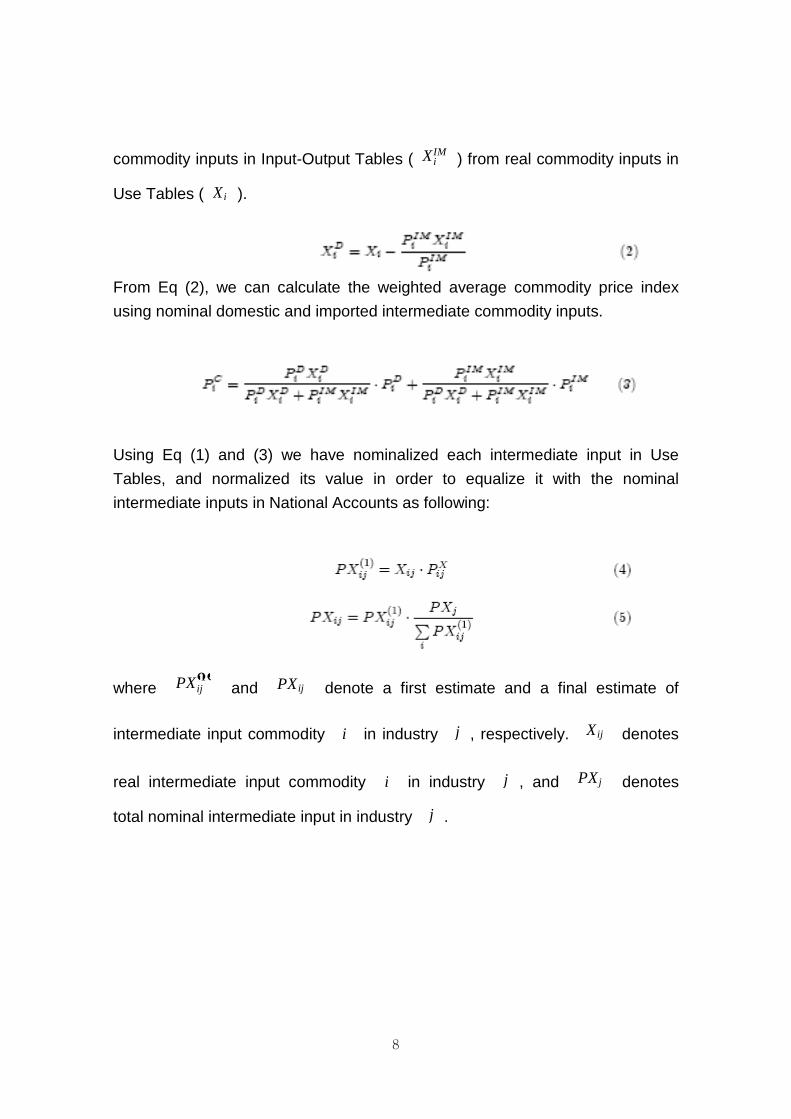
From Eq (2), we can calculate the weighted average commodity price index
using nominal domestic and imported intermediate commodity inputs.
Using Eq (1) and (3) we have nominalized each intermediate input in Use
Tables, and normalized its value in order to equalize it with the nominal
intermediate inputs in National Accounts as following:
where PXij1
and PXij denote a first estimate and a final estimate of
intermediate input commodity i in industry j , respectively. Xij denotes
real intermediate input commodity i in industry j , and PXj denotes
total nominal intermediate input in industry j .

9
(2) Estimation of Make and Use Tables for the Missing
Years
We have estimated the Make and Use Tables for the missing years, 1970-1984
and 2003-2004 through a biproportional adjustment methodology, RAS. For the
years 1970-1984 we have used the 1985 tables as benchmark tables, and for
the years 2003-2004 we have used the 2002 tables. We have annual series of
each industry's gross output, value-added, intermediate input, and so on.
However, because we do not have annual series of each commodity's data in
Input-Output Tables, we have applied the interpolation method between existing
tables and normalized them to the National Accounts data.
(3) Aggregation Issues
A Make and Use Table framework gives more detailed information of
transactions in an economy than aggregated National Accounts data: constant
values, volume indices, and price indices of commodities. In addition to this, the
ESA 95 Input-Output Manual (2002) gives more advantages: (1) the numerical
consistency, reliability and plausibility, (2) different volume indices and deflators
according to different level of aggregation, and (3) relationship between trade
and transport margin, taxes, subsidies, and so on.
We have applied a simple summation for the Make Table aggregation over
commodities under the assumption of the same deflator over all commodities
produced in the same industry following Timmer (2005). With regard to the
aggregation in Use Tables, we have not applied any aggregation technique
considering each commodity as different inputs.
In order to aggregate detailed industrial data, we have used chained Laspeyres
Index following Timmer (2005). While the major advantage of chained
Laspeyres index is additivity, it can also give us an advantage of a better match
between products in consecutive time periods than between periods that are far
apart (SNA -1993). Since this index uses changing weights, the problems of
rapid shifts in the composition of an economy are minimized.
10
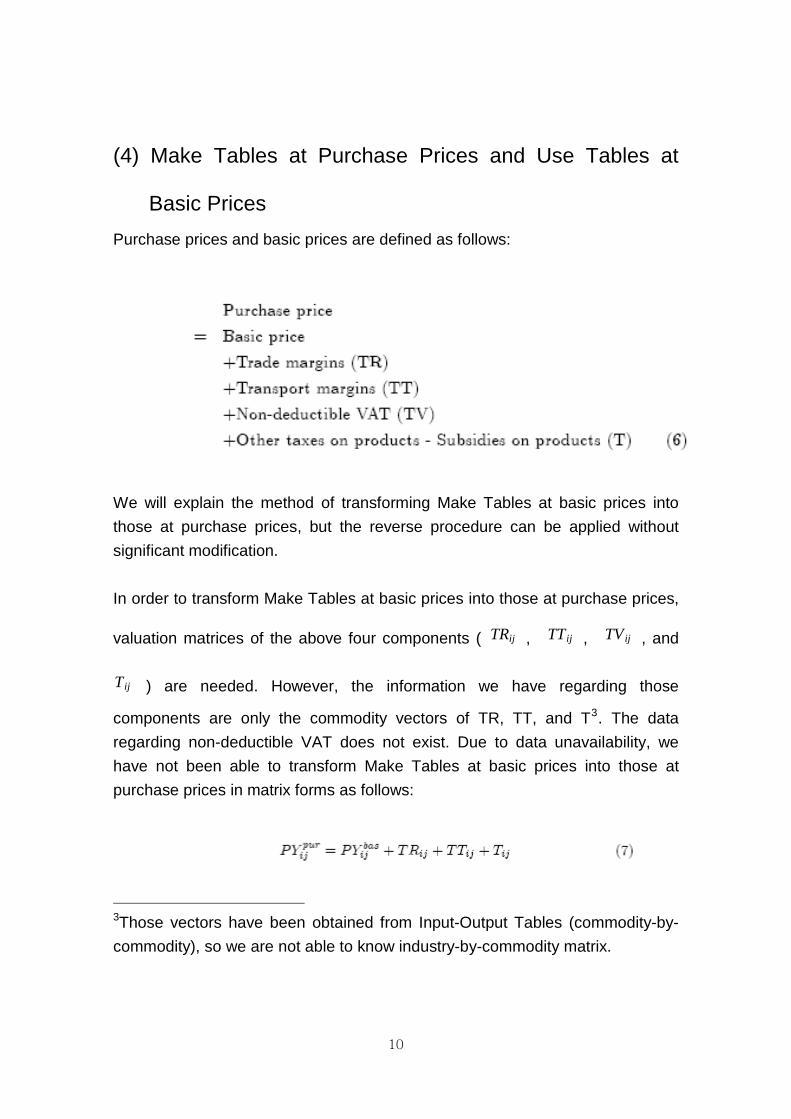
(4) Make Tables at Purchase Prices and Use Tables at
Basic Prices
Purchase prices and basic prices are defined as follows:
We will explain the method of transforming Make Tables at basic prices into
those at purchase prices, but the reverse procedure can be applied without
significant modification.
In order to transform Make Tables at basic prices into those at purchase prices,
valuation matrices of the above four components ( TRij , TTij , TVij , and
Tij ) are needed. However, the information we have regarding those
components are only the commodity vectors of TR, TT, and T3. The data
regarding non-deductible VAT does not exist. Due to data unavailability, we
have not been able to transform Make Tables at basic prices into those at
purchase prices in matrix forms as follows:
3Those vectors have been obtained from Input-Output Tables (commodity-by-
commodity), so we are not able to know industry-by-commodity matrix.
11
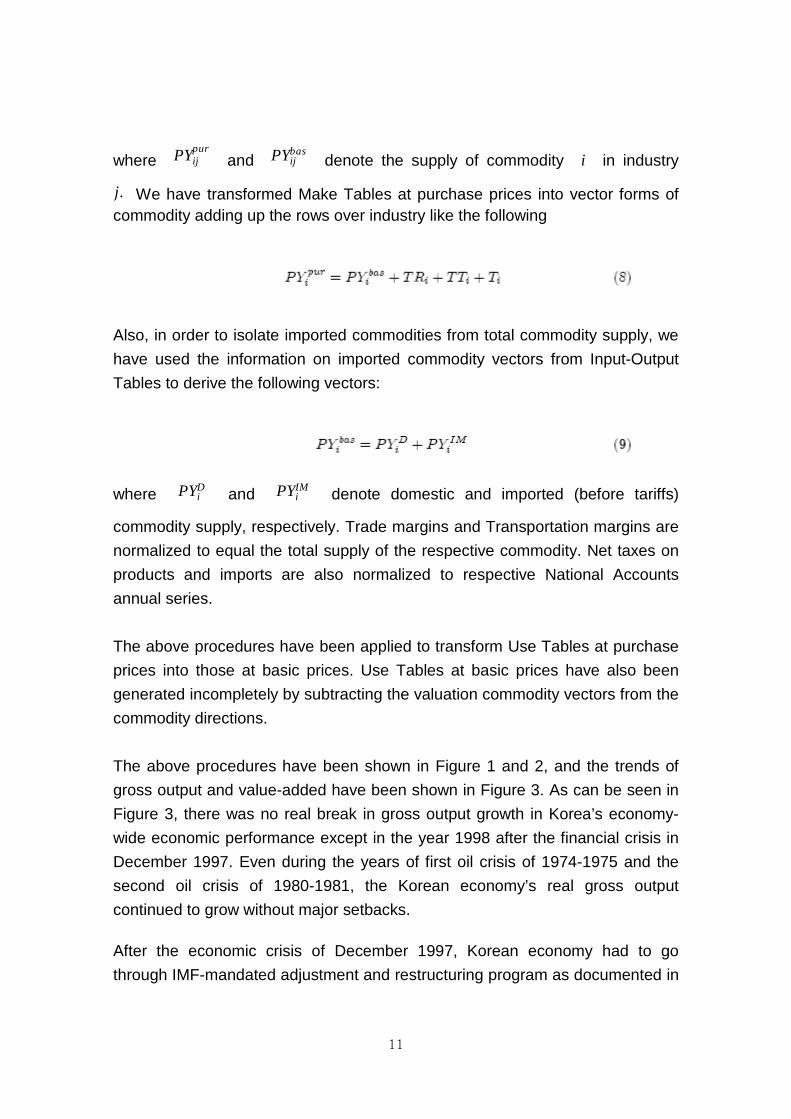
where PYijpur
and PYijbas
denote the supply of commodity i in industry
j. We have transformed Make Tables at purchase prices into vector forms of commodity adding up the rows over industry like the following
Also, in order to isolate imported commodities from total commodity supply, we
have used the information on imported commodity vectors from Input-Output
Tables to derive the following vectors:
where PYiD and PYi
IM denote domestic and imported (before tariffs)
commodity supply, respectively. Trade margins and Transportation margins are
normalized to equal the total supply of the respective commodity. Net taxes on
products and imports are also normalized to respective National Accounts
annual series.
The above procedures have been applied to transform Use Tables at purchase
prices into those at basic prices. Use Tables at basic prices have also been
generated incompletely by subtracting the valuation commodity vectors from the
commodity directions.
The above procedures have been shown in Figure 1 and 2, and the trends of
gross output and value-added have been shown in Figure 3. As can be seen in
Figure 3, there was no real break in gross output growth in Korea’s economy-
wide economic performance except in the year 1998 after the financial crisis in
December 1997. Even during the years of first oil crisis of 1974-1975 and the
second oil crisis of 1980-1981, the Korean economy’s real gross output
continued to grow without major setbacks.
After the economic crisis of December 1997, Korean economy had to go
through IMF-mandated adjustment and restructuring program as documented in

12
Pyo (2004). We observe that even though economy-wide labor productivity
continues to grow, the disparity between labor productivity in Manufacturing and
that in Service has been widening. As the IMF-mandated restructuring in
Manufacturing sector has improved on labor productivity gain through cut-back
of unnecessary manpower, the restructuring in most of Service sector except a
few IT-related finance and communication sectors has been lagging behind.
Figure 1. Make Table at purchase prices
commodity
industry PYijbas PYj
PYiD
PYiIM
TRi
TTi
Ti
PYipur

13
Figure 3. Trend of Real Gross Output (2000 prices)
0
200
400
600
800
1000
1200
1400
1600
1800
1970
1972
1974
1976
1978
1980
1982
1984
1986
1988
1990
1992
1994
1996
1998
2000
2002
2004
Trilli
on W
on
14
2.2 Measurement of Capital Input
The success of late industrialization by newly industrializing economies could
not have been made possible if both the rapid accumulation of capital and its
changing distribution among sectors were not realized in their development
process. However, it is difficult to identify these factors empirically because the
time series data of capital stocks in fast-developing economies by both types of
assets and by industries are not readily available. The lack of investment data
for a sufficiently long period of time to apply the perpetual inventory estimation
method was the main cause of the problem. However, the National Statistical
Office of the Republic of Korea has conducted nation-wide national wealth
survey four times since 1968. Korea is one of a few countries which have
conducted economy-wide national wealth surveys at a regular interval. Since
the first National Wealth Survey (NWS) was conducted in 1968, the subsequent
surveys were made in every ten years in 1977, 1987, and 1997, respectively.
Since such regular surveys with nation-wide coverage are very rare in both
developed and developing countries, an analysis on the dynamic profile of
national wealth seems warranted to examine how national wealth in a fast
growing economy is accumulated and distributed among different sectors.
The estimation of national wealth by types of assets and by industries was
made by Pyo (2003) by modified perpetual inventory method and polynomial
benchmark year estimation method using four benchmark-year estimates. We
have extended his estimates to the year 2004, and changed the base year from
1995 to 2000.
(1) Estimation of Capital Stock4
1) Estimating Method for 1970-1997 In principle the existence of four benchmark year estimates of gross and net
capital stocks makes it possible for us to apply the polynomial benchmark year
estimation method. In Pyo's earlier studies (Pyo 1988, 1992, and 1998), he
estimated proportional retirement rates and depreciation rates both by types of
4This section has been quoted from Pyo, Rhee, and Ha (2004)

15
assets and by industries based on the polynomial equations.
When we applied the polynomial benchmark year equation to estimate the
proportional retirement rates for the sub-periods of 1977-87 and 1987-97, most
of estimates became negative including the average economy-wide retirement
rates (-3.0% for 1977-87 and --3.1% for 1987-97) except other Construction
(0.6%) and Transport Equipment (3.4%) in 1977-87 and Nonresidential Building
(0.9%) in 1987-97. Therefore, following Pyo (1998), we have applied the
polynomial benchmark year estimation method to estimating depreciation by
types of assets only. Thus we have generated net stocks by types of assets first
for the period of 1968-97 and then, distributed them over different sectors of
industries by using interpolated industrial weights between the respective
benchmark years.
We have decided to estimate net capital stock first and then to estimate gross
capital stock by using interpolated net-gross conversion ratios for the following
two reasons. The basic reason is due to the fact that the margin of prediction
error from the polynomial benchmark year equation turns out to be larger with
gross capital stock than with net capital stock as had been observed in Pyo
(1992).
2) Estimating Method after 1997 National Statistical Office of Korea has decided to terminate National Wealth
Survey by 1997 and to switch from direct estimation to indirect estimation of
national wealth following the method of BEA and OECD. The cost of such direct
national wealth survey has increased significantly as the size of national
economy has expanded considerably. In addition, some of the participating
institutions such as Kookmin Bank for unincorporated business enterprises
have been privatized so that National Statistical Office alone can no longer
afford national wealth survey. Japan had terminated its National Wealth Census
in 1970 for almost the same reasons.
Therefore, for the period after 1997, which is the last year of national wealth
survey, we have to estimate capital stocks by a modified perpetual inventory
method using 1997 NWS as benchmark estimates. First, we estimate net stocks
by type of assets in constant prices by using the depreciation rates estimated
from the period of 1987-1977 and distribute them across industries using both
industrial weights in 1997 NWS and those in subsequent Mining &
Manufacturing Census and Surveys and Wholesale and Retail Surveys. In the

16
long run, the estimated depreciation rates by type of assets may need to be
updated and revised by the micro data-based studies. Second the generated
net stocks by type of assets and by industries have to be converted into gross
stock by using the net-gross conversion ratio of 1997 NWS for the time being.
But ultimately we may need further studies on the trend of net-gross conversion
ratio by type of assets and by industries and the average asset life.
3) Reconciliation with Database of Pyo (2003) Since the database of Pyo (2003) covers 10 broad categories of industrial
sector together with 28 sub-sectors of Manufacturing, it has been reclassified
and reconciled with 72 industry classification using other sources such as
Mining & Manufacturing Census and Surveys, Wholesale and Retail Surveys,
and so on. We have classified assets into five categories; residential building,
non-residential building, other construction, transportation vehicles, and
machinery, while excluding large animals & plants, household durables, and
inventory stocks as shown in Table 2.
Table 2. Depreciation Rates of Assets (Unit: %)
before 1978 1978-1987 after 1988
Residential Building 5.5 1.2 3.3
Non-residential Building -6.7 -1.3 3.0
Other Construction 9.7 8.4 1.0
Transportation Vehicles 49.3 28.7 16.9
Machinery 1.1 11.4 9.2
Source : Pyo (2003)
(2) Estimation of Capital Service Inputs
The purpose of this subsection is to outline the estimation of capital service
flows in Korea. We have followed the method of Jorgenson, Ho, and Stiroh
(2005) except the adjustment for a rapid IT asset price decline. The capital
service flows for each asset have been estimated from the capital stocks, and
have been aggregated over all the assets.

17
We have assumed that the flow of capital service is proportional to the average
of current and one-year lagged capital stocks, which means that currently
installed capital stock is available in the midpoint of the installed period. The k
-type capital service flow in industry j at time t can be defined as in (eq10).
where Zk,j,t denotes the k -type capital service flow in industry j at time
t , and qk,t denotes normalizing factor.
We have estimated the price of capital service through the user cost of capital
formula. This methodology derives the cost of capital by the equality between
two alternative investments: earning a nominal rate of return (it ) and investing in asset earning a rental fee and selling the depreciated asset:
where denotes the (expected) capital gains ( ),
and denotes the depreciation rate specific to k -type asset.
We have used yields of corporate bonds for nominal rates of return ( it ) and Pyo's (2003) results for depreciation rates as shown in Table 2. We did not
consider tax effects in estimating cost of capital for the unavailability of data.
Using the above capital service flow and capital service price of each asset, we
have derived aggregated capital service input by a Tornqvist index.
where the vk,j are the two-period average shares of the k -type capital
income in total capital income.
We have also estimated implicit price index of capital inputs (PjK
) from the

18
following equality:
2.3 Measurement of Labor Input
(1) Data
In order to measure labor input for KLEMS model, we have to obtain both
quantity data of labor input such as employment by industries and hours worked
and quality factors such as sex, education and age. Both availability and
reliability of labor statistics in Korea have improved since 1980. But the
measurement of labor input by industries cannot be readily made because the
statistics of employment by industries are not detailed enough to cover 72
sectors. Therefore, we have used other sources for breaking down the labor
data. More detailed classifications of employment will have to rely on
Employment Table, which is published as a supporting table to Input-Output
Table. But it is available only every five year when main Input-Output Tables are
published. Mining and Manufacturing Census and Survey by National Statistical
Office also report employment statistics but it is limited to mining and
manufacturing only.
Economically Active Population Yearbook by National Statistical Office reports
the number of employment, unemployment, not-economically-active population
and economically active population. Report on Monthly Labor Survey by
Ministry of Labor publishes monthly earnings and working days of regular
employees. Survey Report on Wage Structure by the same ministry reports
wages. Nominal wages are also available from this survey.
For the present study, we have obtained the raw data file of Survey Report on
Wage Structure from the Ministry of Labor and Economically Active Population
Survey from National Statistical Office for the period of 1980-2003. The data are
classified by two types of gender (Male and Female), three types of age (below
30, 30-49, and 50 above), and four types of education (middle school and under,

19
high school, college, and university above) and, therefore, there is a total of 24
categories of labor as shown Table 3.
Table 3. Classification of Labor Input
Categories
Gender (1) male (2) female
Age (1) below 30 (2) 30-49 (3) above 50
Education (1) middle school and under (2) high school
(3) college (4) university or above
(2) Estimating Labor Quantity and Quality Inputs
Since the raw-data file of the Survey Report on Wage Structure contains more
detailed industrial classification than that of the Economically Active Population
Survey, we have calculated the quantity of labor from the Economically Active
Population Survey and the quality of labor from the Survey Report on Wage
Structure. This enables us to include self-employed labor as well as to use more
detailed data. However, since the Survey Report on Wage Structure does not
include Agriculture and Government sectors, we had to use the average value
of the entire economy for the quality measure of these two sectors.
In order to make quality adjustments to the employment data, we have taken
the following steps5:
(1) Defining PLlj
as wage rate for j industry and l type category of labor,
the share of labor income by l type category of labor in j industry can be expressed as;
5Jorgenson, Gollop, and Fraumeni (1987)
20
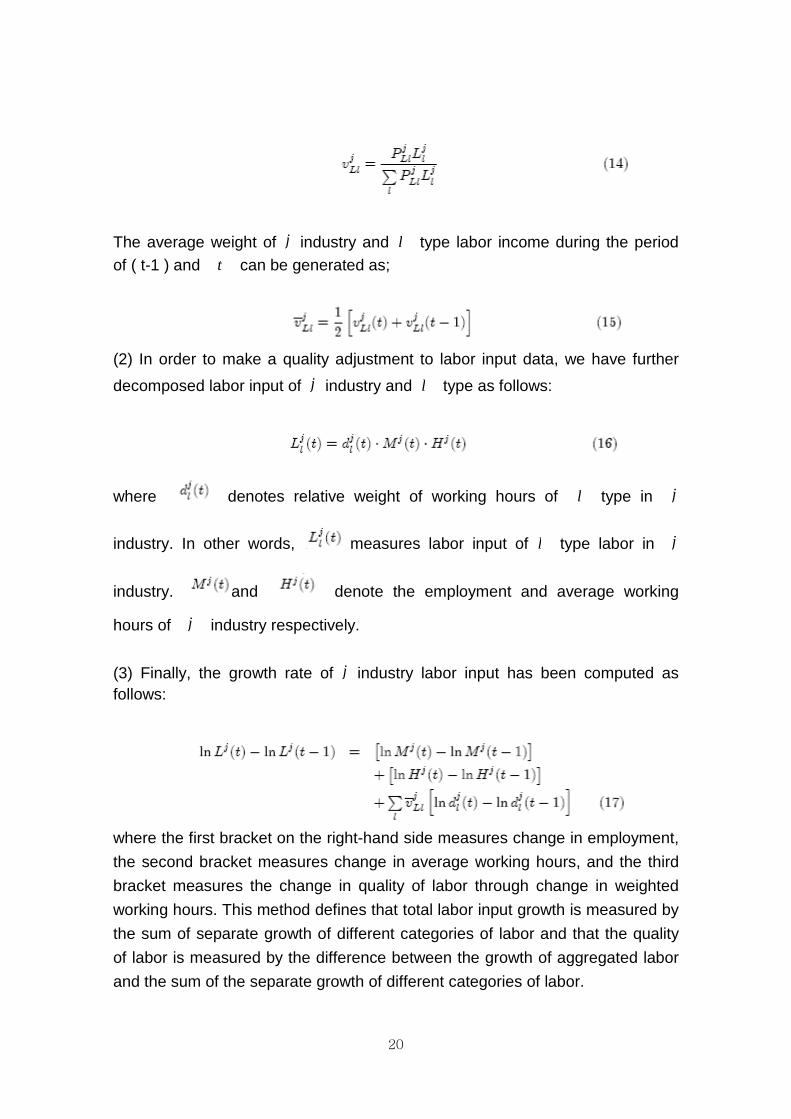
The average weight of j industry and l type labor income during the period of ( t-1 ) and t can be generated as;
(2) In order to make a quality adjustment to labor input data, we have further
decomposed labor input of j industry and l type as follows:
where denotes relative weight of working hours of l type in j
industry. In other words, measures labor input of l type labor in j
industry. and denote the employment and average working
hours of j industry respectively.
(3) Finally, the growth rate of j industry labor input has been computed as follows:
where the first bracket on the right-hand side measures change in employment,
the second bracket measures change in average working hours, and the third
bracket measures the change in quality of labor through change in weighted
working hours. This method defines that total labor input growth is measured by
the sum of separate growth of different categories of labor and that the quality
of labor is measured by the difference between the growth of aggregated labor
and the sum of the separate growth of different categories of labor.

21
2-4 Energy, Material, and Service and Input Shares
In order to decompose intermediate inputs into energy (E), material (M), and
service (S) inputs, we have identified coal and lignite, crude petroleum and
natural gas, uranium and thorium ores, metal ores, coke, refined petroleum
products and nuclear fuel, gas, water, and electricity commodities as energy
inputs, both primary commodities and remaining manufacturing commodities as
material inputs, and remaining service inputs as service inputs.
Regarding shares of inputs, we have used compensation of employees as
shares of labor inputs and remaining value-added as shares of capital inputs.
This method may underestimate the shares of labor input by allocating the
compensation of self-employed to the shares of capital input, and this gap
would be especially large in primary industry. There are some adjustment
processes to correct underestimation of labor share as attempted by, for
example Harberger (1978), but we have not applied it in order to avoid arbitrary
adjustments. This can be improved in future studies. As for energy, material,
and service inputs, we have used nominal inputs for their own shares.

22
3. Estimates of Labor Productivity and TFP by 72-
industry
3.1 Trend of Labor Productivity Level and Growth Rates
by Sector
(1) The Level of Labor Productivity and its Trend
As shown in Figure 4, the general trend of labor productivity reveals a rising
trend but with a remarkable difference between Manufacturing and Service.
While the labor productivity level in Manufacturing measured as the ratio of real
price output to working hours increased sharply, the level in Service increased
very slowly. The role of productivity gain in Manufacturing in the catch-up
process of Korea has been well-documented by Timmer (1999) and Pyo (2001).
As observed in Pyo and Ha (2005), the labor productivity level was not reduced
during the years (1997-1998) of the Asian Financial Crisis because of IMF-
mandated industrial restructuring: the reduced output was matched by reduced
employment leaving labor productivity level unaffected.
The relatively sluggish productivity gain in Service sector has been pointed out
by IMF in their recent consultation with the Korean authorities as a bottleneck of
sustainable growth for Korea. Inklaar, Timmer and van Ark (2006) also pointed
out the slower productivity gain of service industries in Europe relative to those
in the United States. A more detailed decomposition of labor productivity by
sector and by sub-period is presented in Table 4 and 5. According to Kim(2006),
while the share of Service sector in Korean economy has increased sharply
reaching 56 percent level of GDP and 65 percent of total employment in 2005,
the Service productivity is not only low in level terms compared to industrial
nations’ levels but also lags behind in terms of growth rate. She also points out
that Korea’s inter-industry linkage effect between Manufacturing and Service is
also only about half the size of industrial nations.

23
Figure 4 Trend of labor productivity level
<unit: gross output per hour(won)>
0
10000
20000
30000
40000
50000
60000
70000
80000
70 71 72 73 74 75 76 77 78 79 80 81 82 83 84 85 86 87 88 89 90 91 92 93 94 95 96 97 98 99 00 01 02 03
Economy-wide Manufacturing Service
Table 4 Labor Productivity Level by industries: Sectoral labor productivity
level in manufacturing by period <unit: gross output per hour(won)>
Before
crisis
After
crisis Code Industry '72-'79 '80-'89 '90-'99
'90-'98 '99-'03
'72-'03
9 Food products and beverages 36,999 39,367 55,163 54,193 90,177 50,884
10 Tobacco products 36,922 40,586 90,594 89,379 195,570 77,609
11 Textiles 6,452 14,174 22,709 22,007 38,216 18,203
12 Wearing apparel, dressing and dying of fur 12,161 9,768 13,732 13,860 19,494 13,037
13 Leather, leather products and footwear 16,679 7,605 17,031 16,130 34,307 16,444
14 Wood and products of wood and cork 4,834 13,773 26,831 26,364 47,559 20,359
15 Pulp, paper and paper products 11,621 13,755 39,931 38,555 71,876 29,278
16 Publishing 12,699 23,025 41,144 37,476 76,242 32,823
17* Printing and reproduction 151,732 388,216 23,194 23,570 15,967 168,374
18 Coke, refined petroleum products and nuclear fuel 274,511 339,248 482,051 468,709 1,013,717 464,860
19 Pharmaceuticals 6,287 12,999 20,620 20,665 1,451,946 238,313
20 Chemicals excluding pharmaceuticals 19,562 20,168 100,634 90,439 133,936 57,556
21 Rubber and plastics products 3,070 8,368 27,769 26,649 47,226 18,257
22 Other non-metallic mineral products 8,884 11,959 27,173 25,961 56,995 22,165
23 Basic metals 13,314 36,861 69,079 66,241 115,772 51,567

24
24 Fabricated metal products 9,132 35,166 38,886 38,054 62,489 33,739
25 Machinery, nec 9,241 10,268 20,074 19,024 45,098 17,916
26 Office, accounting and computing machinery 20,453 35,659 51,379 48,471 169,000 56,296
27 Insulated wire 24,917 13,769 26,158 23,513 155,335 41,416
28 Other electrical machinery and apparatus nec 2,854 7,251 27,079 26,237 52,172 18,511
29 Electronic valves and tubes 2,631 61,877 54,903 54,209 57,471 44,220
30 Telecommunication equipment 3,756 10,289 44,215 33,205 55,150 22,110
31 Radio and television receivers 4,067 6,231 23,202 18,350 39,864 14,354
32 Scientific instruments 1,959 10,277 42,768 41,220 37,830 21,205
33 Other instruments - - - - - -
34 Motor vehicles, trailers and semi-trailers 19,467 36,677 61,206 61,482 88,334 47,422
35 Building and repairing of ships and boats 158,390 286,959 83,660 88,164 89,862 168,109
36 Aircraft and spacecraft 132* 858 31,281 29,831 90,103 26,004*
37 Railroad equipment and transport equipment nec 2,838 1,879 14,641 14,314 7,200 6,448
38 Manufacturing nec 3,614 7,591 16,945 16,630 23,283 11,591
39 Recycling - - - - - -
* In case of the industrial classification code #36, the labor productivity is applied to the period of 1976-
1979 or 1976-2003 because of the data insufficiency,
Table 5 Labor Productivity Level by industries: Sectoral labor productivity
level in Service by period
<unit: gross output per hour(won)>
Before
crisis
After
crisis Code Industry '72-'79 '80-'89 '90-'99
'90-'98 '99-'03
'72-'03
40 Electricity supply 15,448 52,504 90,511 86,384 179,068 72,544
41 Gas supply 14,371 51,533 153,843 130,874 225,650 91,763
42 Water supply 14,372 51,534 344,577 338,580 784,980 237,576
43 Construction 10,256 14,659 22,949 22,739 26,014 17,605
44 Sale, maintenance and repair of motor vehicles and
motorcycles 67,587 4,234 1,800 1,942 699 18,875
45 Wholesale trade and commission trade 95,249 4,307 5,265 5,198 6,288 27,603
46 Retail trade 162,844 3,970 10,885 10,959 11,857 46,886
47 Hotels and restaurants 105,649 6,820 7,673 7,651 7,820 31,917
48 Inland transport 3,973 6,180 9,958 9,726 12,768 7,655

25
49 Water transport 12,758 44,351 189,712 191,043 209,677 103,542
50 Air transport 48,873 47,013 73,068 75,421 136,955 69,521
51 Supporting and auxiliary transport activities 22,824 22,252 13,633 13,781 12,904 18,552
52 Post and telecommunications 22,668 14,465 30,773 27,838 69,494 28,875
53 Financial intermediation 4,580 9,163 23,830 23,034 39,388 16,641
54 Insurance and pension funding 6,943 20,992 33,231 35,061 29,756 22,806
55 Activities related to financial intermediation - 28,342* 34,939 31,599 46,941 35,137*
56 Imputation of owner occupied rents 447,193 200,889 440,570 461,481 90,498 318,508
57 Other real estate activities 437,768 211,920 43,026 47,409 42,199 195,594
58 Renting of machinery and equipment 437,408 211,920 316,158 321,506 1,928,040 567,257
59 Computer and related activities 437,418 211,920 65,469 68,565 24,535 198,697
60 Research and development 417,881 211,920 94,137 98,492 89,770 212,423
61 Legal, technical and advertising 13,404 110,908 34,166 35,704 20,800 51,302
62 Other business activities, nec 13,075 110,945 12,612 12,089 14,119 43,545
63 Public admin and defence 13,557 251,094 2,552 2,751 1,256 82,826
64 Education 13,370 247,426 5,595 5,444 6,734 83,246
65 Health and social work 5,168 10,412 18,945 18,564 19,182 12,764
66 Sewage and refuse disposal, sanitation and similar
activities 2,473 6,329 74,183 60,749 102,172 35,646
67 Activities of membership organizations nec 6,656 7,046 23,951 24,048 18,522 13,523
68 Media activities 5,870 7,046 27,001 29,255 30,274 16,627
69 Other recreational activities 151,168 319,953 85,555 93,977 17,390 166,925
70 Other service activities 55,559 114,660 73,632 81,243 9,723 74,090
71 Private households with employed persons 60,947 122,708 41,276 41,789 34,584 70,740
72 Extra-territorial organizations and bodies - - - - - -
* In case of the industrial classification code #55, the labor productivity growth is applied to the period of
1986-89 or 1986-03 because of the data insufficiency
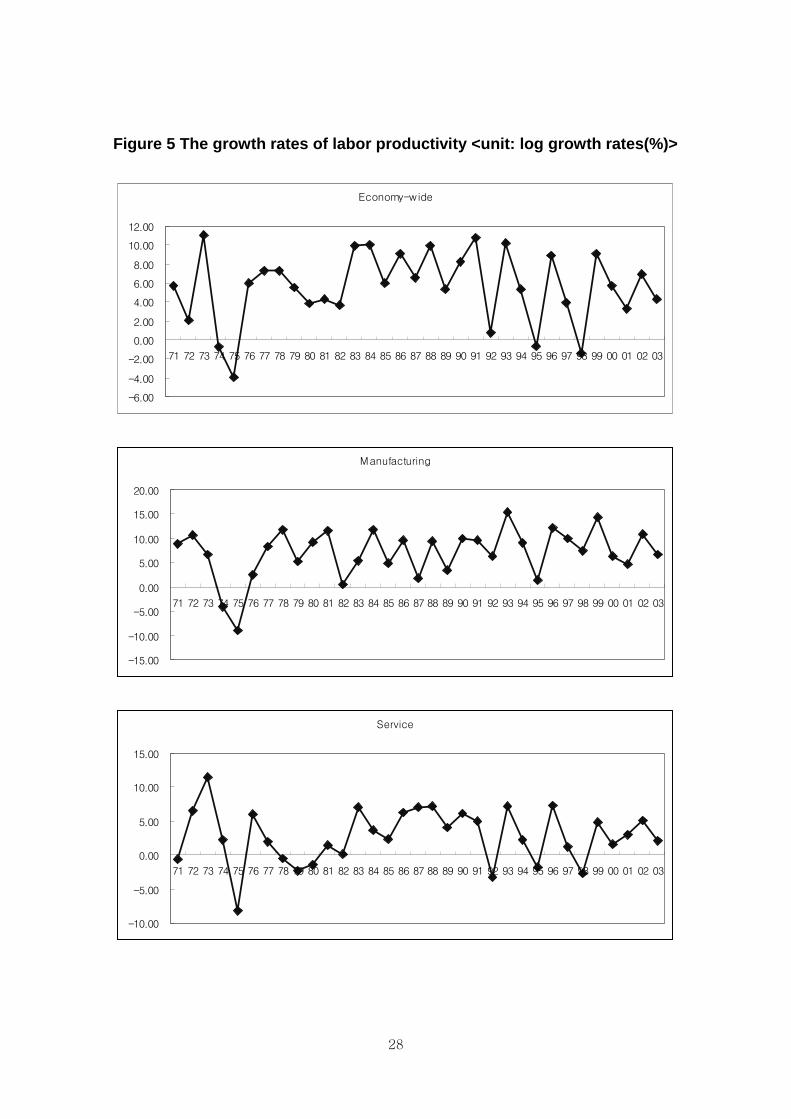
(2) The growth rates of labor productivity by Sector
The growth rates of labor productivity as summarized in Table 4 and shown in
Figure 5 confirm the remarkable difference between Manufacturing and Service
sector. Throughout the entire period of 1971-2003, the economy-wide labor
productivity has grown at the average rate of 5.59 percent but with the sectoral
difference between Manufacturing (6.99 %) and Service (2.91 %). The

26
difference did not shrink but rather has expanded as the process of
industrialization continued. For example, the difference in the 1990’s (9.55 % vs.
2.64 %) has been more than doubled since 1970’s (4.01 % vs. 2.15 %).
The observed difference in both levels and growth rates of labor productivity
between Manufacturing and Service can signal the difference in the degree of
foreign competition, the proportion of tradable and non-tradable and the degree
of domestic competition due to historically different regulatory environments. For
example, the proportion of public enterprises and their subsidiaries in total
output of many service industries such as utilities (electricity, water and gas),
transportation and communication is a lot greater than their proportion in
Manufacturing so that their productivity improvement could have been sluggish
over time. In addition, many non-tradable sectors of service industries such as
retail trade, real estate and financial services, hotels and restaurants etc. have
been subject to all kinds of regulations such as zoning, sanitary standards and
segregated financial market services etc.
Table 6 Growth Rates of Labor Productivity by Sector (%)
Period Economy-wide Manufacturing Service
72-'79 4.32 4.01 2.15
80-'89 6.87 6.75 3.77
90-'99 5.54 9.55 2.64
90-'98 5.14 9.01 2.40
99-'03 5.87 8.61 3.33
72-'03 5.59 6.99 2.91
A more detailed analysis of labor productivity can be made by looking at growth
rates of labor productivity by sub-sectors of both Manufacturing and Service
industries. Table 7 reports our estimates of growth rates of labor productivity in
sub-manufacturing industries. Within Manufacturing, we also observe a large
difference in growth rates of labor productivity ranging from Aircraft and
Spacecraft (27.08 %) to Tobacco Products (- 4.78 %). In general, export-
oriented manufacturing industries such as Electrical Machinery and Electronic
devices (14 % range) and Computing Machinery and Television and Radio

27
Receivers etc. (10 % range) have been leader industries in improving labor
productivity.
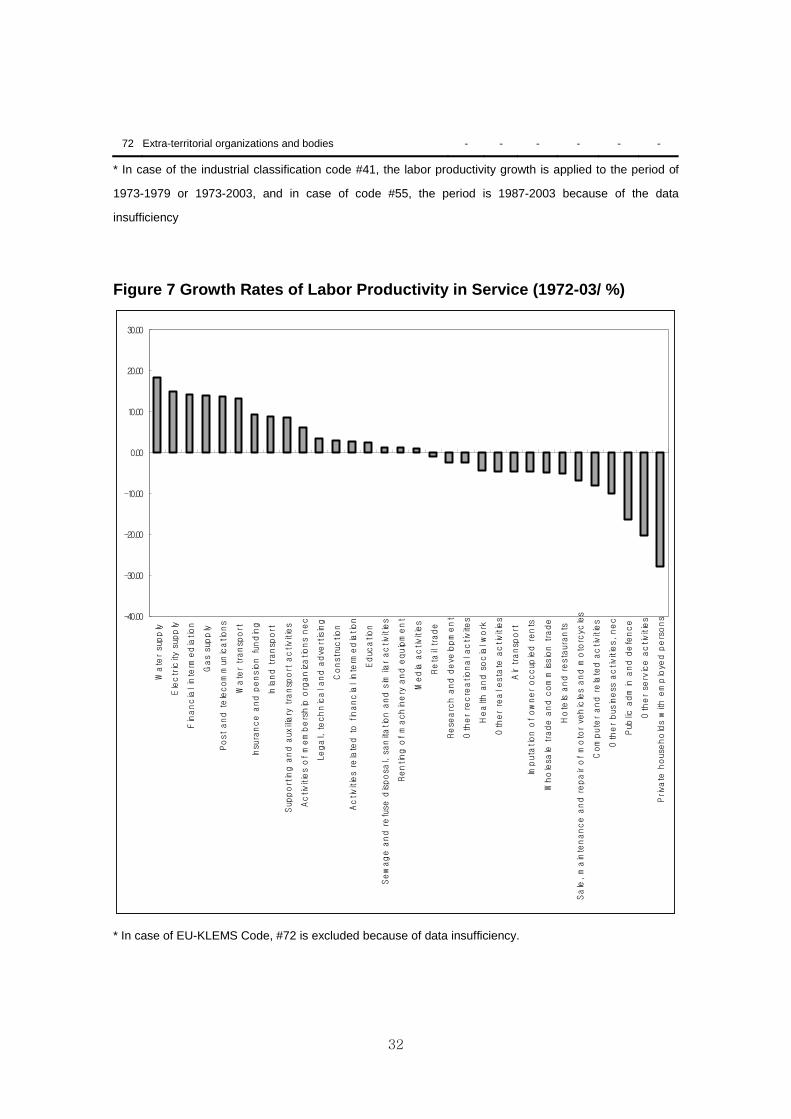
In Service industries, the intra-industry difference of labor productivity growth is
even larger than in Manufacturing. As presented in Table 8, Water Supply
(17.92 %), Electricity (14.48 %) and Gas Supply (14.08 %) have been leader
industries because they have been under the public enterprises with rising
demand for social overhead capital. On the other hand, Private House Hold with
Employed Persons (- 26.69 %), Other Service Activities (- 19.47 %) and Public
Administration and defense (- 15.84 %) have been on the lower end of the labor
productivity growth.
28
Figure 5 The growth rates of labor productivity <unit: log growth rates(%)>
Economy-wide
-6.00
-4.00
-2.00
0.00
2.00
4.00
6.00
8.00
10.00
12.00
71 72 73 74 75 76 77 78 79 80 81 82 83 84 85 86 87 88 89 90 91 92 93 94 95 96 97 98 99 00 01 02 03
Manufacturing
-15.00
-10.00
-5.00
0.00
5.00
10.00
15.00
20.00
71 72 73 74 75 76 77 78 79 80 81 82 83 84 85 86 87 88 89 90 91 92 93 94 95 96 97 98 99 00 01 02 03
Service
-10.00
-5.00
0.00
5.00
10.00
15.00
71 72 73 74 75 76 77 78 79 80 81 82 83 84 85 86 87 88 89 90 91 92 93 94 95 96 97 98 99 00 01 02 03

29
Table 7 Growth Rates of Labor productivity in Manufacturing ( %)
Before
crisis
After
crisis Code Industry '72-'79 '80-'89 '90-'99
'90-'98 '99-'03
'72-'03
9 Food products and beverages 0.31 3.30 3.20 5.01 4.66 3.16
10 Tobacco products -36.96 6.28 4.62 3.62 15.92 -4.78
11 Textiles 9.92 5.39 6.41 6.43 8.39 7.36
12 Wearing apparel, dressing and dying of fur -3.42 4.67 -0.02 -1.44 13.19 2.09
13 Leather, leather products and footwear -29.77 -3.24 12.76 14.89 7.83 -3.85
14 Wood and products of wood and cork 20.78 9.02 6.89 9.38 7.69 12.12
15 Pulp, paper and paper products 1.08 7.14 9.92 11.27 6.95 6.58
16 Publishing 4.33 11.98 6.67 -1.60 16.64 6.90
17 Printing and reproduction 43.17 -28.17 -2.81 1.59 -15.13 1.38
18 Coke, refined petroleum products and nuclear fuel -2.51 -0.44 4.61 4.47 8.51 1.69
19 Pharmaceuticals -46.09 9.57 0.48 -0.22 86.74 3.41
20 Chemicals excluding pharmaceuticals 8.03 12.46 17.43 15.67 -2.05 9.93
21 Rubber and plastics products 14.20 11.13 7.33 6.45 6.65 10.01
22 Other non-metallic mineral products 3.36 6.95 8.00 7.40 15.07 7.33
23 Basic metals 17.40 10.13 6.81 7.59 4.78 10.61
24 Fabricated metal products 7.66 9.06 4.28 4.69 7.95 7.32
25 Machinery, nec 2.22 9.11 7.18 5.60 14.70 7.12
26 Office, accounting and computing machinery 18.78 0.47 9.44 5.43 22.29 10.12
27 Insulated wire -10.61 -2.90 13.39 12.05 26.55 3.53
28 Other electrical machinery and apparatus nec 24.09 5.52 12.22 13.82 15.00 14.29
29 Electronic valves and tubes 23.64 26.52 -2.40 -5.89 9.88 14.37
30 Telecommunication equipment -0.95 16.22 21.79 18.65 -12.66 7.82
31 Radio and television receivers 11.99 6.38 20.71 6.30 22.66 10.36
32 Scientific instruments -5.03 19.82 14.73 13.77 0.56 8.48
33 Other instruments - - - - - -
34 Motor vehicles, trailers and semi-trailers -7.21 9.42 -1.52 -6.68 19.98 2.09
35 Building and repairing of ships and boats 5.27 8.21 -21.86 -29.82 28.56 0.12
36 Aircraft and spacecraft 28.90* 20.70 34.72 41.48 12.83 27.08*
37 Railroad equipment and transport equipment nec -12.47 -3.28 23.10 26.82 -30.80 -1.75
38 Manufacturing nec 3.43 13.34 5.20 6.12 3.80 7.23
39 Recycling - - - - - -

30
* In case of the industrial classification code #36, the labor productivity growth is applied to the period of
1977-1979 or 1977-2003 because of the data insufficiency,
Figure 6 Growth Rates of Labor Productivity in Manufacturing (1972-03/ %)
-10.00
-5.00
0.00
5.00
10.00
15.00
20.00
25.00
30.00
Aircraft and spacecra
ft
Electronic valves and tubes
Oth
er electrical machinery and a
pparatus nec
Wood a
nd p
roduc
ts o
f wood and c
ork
Basic m
etals
Office, accoun
ting and c
omputing m
achinery
Chemicals e
xcluding p
harm
aceuticals
Rubber and plastics produc
ts
Radio and television receivers
Scientific instruments
Manufacturing nec
Oth
er non-meta
llic m
inera
l pro
duc
ts
Fabricate
d m
etal pro
duc
ts
Textiles
Machinery, nec
Pub
lishing
Telecommun
ication equipment
Pulp, paper and paper products
Insulate
d w
ire
Pharm
aceuticals
Food p
roduc
ts a
nd b
eve
rages
Moto
r vehicles, traile
rs a
nd semi-traile
rs
Wearing a
pparel, d
ressing a
nd dying of fur
Coke
, refined p
etroleum
pro
duc
ts a
nd n
uclear fuel
Printing and repro
duc
tion
Building a
nd repairing o
f ships and b
oats
Railroad e
quipment and tra
nsport e
quipment nec
Leath
er, leath
er pro
ducts and footw
ear
Tobacco p
roduc
ts
* In case of EU-KLEMS Code, #33, #39, they are excluded because of data insufficiency.

31
Table 8 Growth Rates of Labor Productivity in Service Industries (%)
Before
crisis
After
crisis Code Industry '72-'79 '80-'89 '90-'99
'90-'98 '99-'03
'72-'03
40 Electricity supply 26.31 15.59 7.68 8.61 5.98 14.81
41 Gas supply 23.56 16.87 17.62 13.12 -3.01 14.08
42 Water supply 25.62 16.87 18.63 17.48 11.31 18.36
43 Construction -0.51 6.42 2.40 3.57 0.38 2.94
44 Sale, maintenance and repair of motor vehicles and motorcycles 13.79 -15.96 -23.47 -28.17 16.66 -6.86
45 Wholesale trade and commission trade -4.76 -13.27 0.87 -1.15 5.07 -4.87
46 Retail trade 7.37 -16.64 6.21 8.79 1.00 -0.73
47 Hotels and restaurants -4.40 -11.82 -1.48 -3.88 4.03 -5.25
48 Inland transport 18.24 7.47 4.88 4.47 5.24 8.97
49 Water transport 17.01 15.25 10.69 15.66 -1.83 13.13
50 Air transport -39.14 9.24 0.55 3.70 8.22 -4.57
51 Supporting and auxiliary transport activities 24.37 9.56 -3.03 -2.14 0.61 8.57
52 Post and telecommunications 24.86 8.02 13.67 12.91 9.89 13.90
53 Financial intermediation 26.19 15.41 6.30 4.88 9.98 14.29
54 Insurance and pension funding 8.50 20.12 -7.05 0.57 6.51 9.59
55 Activities related to financial intermediation - - 7.53 -1.36 10.07 2.65
56 Imputation of owner occupied rents -1.02 -2.03 4.83 16.70 -53.65 -4.58
57 Other real estate activities -0.64 -2.25 -37.80 -44.38 56.47 -4.52
58 Renting of machinery and equipment -0.64 -2.25 5.36 17.35 -17.72 1.25
59 Computer and related activities -0.64 -2.25 -14.28 -17.68 -15.33 -8.23
60 Research and development -0.64 -2.25 -10.49 -10.71 9.57 -2.38
61 Legal, technical and advertising -3.09 9.08 2.02 3.95 2.85 3.62
62 Other business activities, nec -48.15 9.49 0.16 -6.08 5.19 -9.97
63 Public admin and defense -48.33 10.66 -32.22 -37.57 19.98 -16.20
64 Education 20.70 4.18 -3.65 -5.20 -17.05 2.36
65 Health and social work -40.34 13.67 6.55 7.03 -2.79 -4.27
66 Sewage and refuse disposal, sanitation and similar activities 0.80 6.42 33.68 32.77 -64.78 1.30
67 Activities of membership organizations nec 3.48 6.82 11.15 15.97 -7.60 6.30
68 Media activities -38.79 6.82 -1.19 -6.79 67.04 1.00
69 Other recreational activities -3.66 14.34 -33.19 -39.83 33.58 -2.39
70 Other service activities -89.32 19.18 -32.34 -31.03 29.95 -20.38
71 Private households with employed persons -88.61 19.22 -13.20 -16.44 -45.18 -27.83
32
72 Extra-territorial organizations and bodies - - - - - -
* In case of the industrial classification code #41, the labor productivity growth is applied to the period of
1973-1979 or 1973-2003, and in case of code #55, the period is 1987-2003 because of the data
insufficiency
Figure 7 Growth Rates of Labor Productivity in Service (1972-03/ %)
-40.00
-30.00
-20.00
-10.00
0.00
10.00
20.00
30.00
Wate
r su
pply
Electricity su
pply
Financial interm
ediation
Gas su
pply
Post a
nd telecommun
ications
Wate
r transp
ort
Insu
rance a
nd p
ension fun
ding
Inland transp
ort
Sup
porting a
nd a
uxiliary transp
ort a
ctivities
Activities of membership o
rganizations nec
Legal, technical and adve
rtising
Construction
Activities related to financial interm
ediation
Educ
ation
Sewage and refuse
disposa
l, sanitation a
nd sim
ilar activities
Renting o
f machinery and e
quipment
Media a
ctivities
Reta
il trade
Rese
arc
h a
nd deve
lopment
Oth
er re
cre
ational activite
s
Health and social work
Oth
er real estate
activities
Air tra
nsp
ort
Imputation o
f owner occup
ied rents
Wholesa
le trade and c
ommission trade
Hotels a
nd restaurants
Sale, maintenance and repair of motor ve
hicles and m
oto
rcyc
les
Computer and related activities
Other bus
iness a
ctivities, nec
Pub
lic admin a
nd defence
Oth
er se
rvice activities
Priva
te households with e
mploye
d persons
* In case of EU-KLEMS Code, #72 is excluded because of data insufficiency.
33
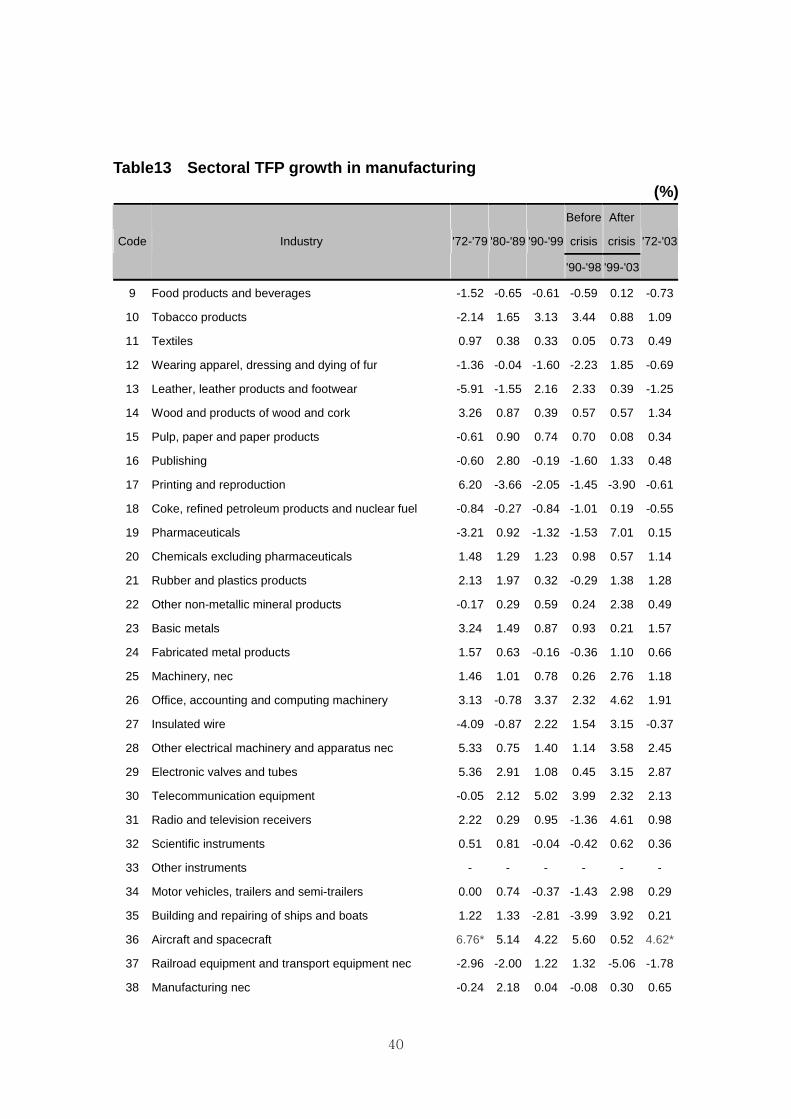
(3) Trend of TFP Growth by Sector
The growth rates of TFP by sector are shown in Figure 8. Throughout the entire
period 1972-2003, Korean economy experienced about 2 break-points: mid-
1970s which was the first oil shock and in 1997 which was the financial crisis.
The difference between two break points can be summarized as follows. During
the second half of 1970’s, the growth rate of gross output was not low, but the
growth rates of inputs such as capital(4.56%), labor(1.79%), energy(0.69%),
intermediate goods(3.34%) especially, were relatively higher. Therefore, the
growth rates of TFP have been estimated as negative. In case of late 1990’s
the negative growth of TFP has been resulted from the shrink of gross output
rooted from economic crisis.
In addition we observe that the estimated TFP growth rates in Manufacturing
are in general greater than in Service. It maybe due to the fact that an
innovation process such as product innovation or process innovation is more
sensitive and stronger in manufacturing than in service. Also the R&D
investment for innovation is in general more intensive in manufacturing than in
service. So the growth rates of TFP in Manufacturing seem to be greater than in
Service.

34
Figure 8 The growth rates of TFP (%)
Economy-wide
-6.00
-5.00
-4.00
-3.00
-2.00
-1.00
0.00
1.00
2.00
3.00
72 73 74 75 76 77 78 79 80 81 82 83 84 85 86 87 88 89 90 91 92 93 94 95 96 97 98 99 00 01 02 03
Manufacturing
-5.00
-4.00
-3.00
-2.00
-1.00
0.00
1.00
2.00
3.00
4.00
5.00
72 73 74 75 76 77 78 79 80 81 82 83 84 85 86 87 88 89 90 91 92 93 94 95 96 97 98 99 00 01 02 03
Service
-6.00
-5.00
-4.00
-3.00
-2.00
-1.00
0.00
1.00
2.00
3.00
72 73 74 75 76 77 78 79 80 81 82 83 84 85 86 87 88 89 90 91 92 93 94 95 96 97 98 99 00 01 02 03

35
3.2 Gross Output Growth Accounting and TFP Growth
The growth rate of economy-wide TFP has been estimated as -0.59 percent.
The growth rates of TFP in Manufacturing and Service are estimated as 0.48
percent and -0.92 percent respectively throughout the entire period of 1972-
2003 as shown in Table 7-9. Also the economy-wide TFP growth rate during the
pre-crisis period (1990-1998) has been estimated as -0.84 percent. And the
growth rate during the post-crisis period (1999-2003) has been estimated as
0.86 percent.
After the economic crisis in 1997-1998, the economy-wide growth rate of gross
output has been recovered, at the same time the growth rates of input factors
such as capital, labor and service have also been reduced from those during
the pre-crisis period. Accordingly, the growth rate of TFP during the post-crisis
period has been relatively higher than that during the pre-crisis period.
Secondly the contributions of TFP to economy-wide gross output growth during
the entire period of 1972-2003 are -7.5 percent, and 4.7 percent in
Manufacturing, and -12.8 percent in Service. Then we can examine the relative
contribution ratio of the input factors to the output growth. The relative
contribution ratios to output growth during the entire period are in order of
intermediate goods(52.3 percent), capital(15.6 percent), energy(11.3 percent),
service(10.2 percent), labor(5.8 percent) in Manufacturing. So the innovation or
the role of intermediate goods for enhancing productivity is more important in
Manufacturing than in Service. And the contribution ratio of TFP to
Manufacturing output growth (4.7 percent) is of rather insignificant magnitude.
On the other hand, in Service the contribution are in order of capital(48.7
percent), service(23.9 percent), labor(20.1 percent), intermediate goods(15.8
percent ), energy(4.2 percent). Hence we can see the input’s role for enhancing
productivity is different between Manufacturing and Service.
Thirdly the total factor productivity growth in gross output growth accounting is
lower than that without quality adjustment in input data. The quality of labor has
affected the growth of output about 2.4 percent in Manufacturing and 3.9
percent in Service during the entire period, Also the quantity of labor has

36
affected the growth of output by about 3.4 percent in Manufacturing and about
16.3 percent in Service during the entire period, Thus the labor input in Service
has influenced output growth both in quantity and quality of labor than that in
Manufacturing. The quantity of labor input in Manufacturing has been reduced
during the pre-crisis period. It reflects a drastic structural adjustment in Korea’s
labor market after the crisis of 1997-1998. As a consequence, the contribution
rate of labor to output growth has become negative in Manufacturing after the
crisis.
Table 9 Gross Output Growth Accounting and TFP growth in economy-
wide
<unit: log growth rates(%)>
Labor input
Period Gross
output
Capital
input Total
labor
Quantity
labor
Quality
labor
Energy
input
Intermediate
input
Service
input TFP
'72-79 9.48 4.56 1.79 1.03 0.76 0.69 3.34 1.13 -2.03
'80-'89 8.36 3.05 0.62 0.28 0.34 0.45 3.18 0.98 0.08
'90-'99 6.43 2.40 0.49 0.19 0.31 0.70 1.64 1.76 -0.56
'90-'98 5.84 2.54 0.49 0.15 0.34 0.63 1.30 1.71 -0.84
'99-'03 7.61 1.11 0.48 0.33 0.14 0.75 2.78 1.62 0.86
'72-'03 7.81 2.98 0.85 0.44 0.41 0.61 2.63 1.32 -0.59
contribution to output growth
'72-79 100.0 48.1 18.9 10.9 8.1 7.3 35.3 11.9 -21.5
'80-'89 100.0 36.5 7.4 3.4 4.0 5.3 38.0 11.8 0.9
'90-'99 100.0 37.3 7.7 2.9 4.8 10.9 25.6 27.3 -8.7
'90-'98 100.0 43.5 8.4 2.5 5.8 10.8 22.4 29.4 -14.4
'99-'03 100.0 14.6 6.3 4.4 1.9 9.9 36.6 21.3 11.4
'72-'03 100.0 38.2 10.9 5.6 5.3 7.8 33.7 17.0 -7.5

37
Table 10 Gross Output Growth Accounting and TFP growth in
manufacturing <unit: log growth rates(%)>
Labor input
Period Gross
output
Capital
input Total
labor
Quantity
labor
Quality
labor
Energy
input
Intermediate
input
Service
input TFP
'72-79 15.30 2.41 1.72 1.28 0.43 1.66 8.29 1.17 0.06
'80-'89 10.27 1.68 0.59 0.40 0.19 0.88 5.83 0.80 0.49
'90-'99 6.94 1.20 -0.14 -0.34 0.20 1.19 2.94 1.17 0.58
'90-'98 5.56 1.26 -0.22 -0.44 0.22 1.08 2.17 1.04 0.23
'99-'03 10.11 0.70 0.26 0.16 0.09 1.02 5.26 1.32 1.55
'72-'03 10.18 1.59 0.59 0.35 0.24 1.15 5.33 1.04 0.48
contribution to output growth
'72-79 100.0 15.8 11.2 8.4 2.8 10.8 54.2 7.6 0.4
'80-'89 100.0 16.3 5.7 3.9 1.8 8.6 56.8 7.8 4.8
'90-'99 100.0 17.3 -2.0 -4.9 2.8 17.2 42.3 16.9 8.4
'90-'98 100.0 22.6 -3.9 -7.9 4.0 19.5 39.0 18.7 4.1
'99-'03 100.0 6.9 2.5 1.6 0.9 10.1 52.1 13.0 15.3
'72-'03 100.0 15.6 5.8 3.4 2.4 11.3 52.3 10.2 4.7

38
Table 11 Gross Output Growth Accounting and TFP growth in service
<unit: log growth rates(%)>
Labor input
Period Gross
output
Capital
input Total
labor
Quantity
labor
Quality
labor
Energy
input
Intermediate
input
Service
input TFP
'72-79 7.86 4.77 2.05 1.52 0.54 0.26 1.43 1.36 -2.01
'80-'89 7.92 3.70 1.33 1.11 0.22 0.18 1.52 1.27 -0.08
'90-'99 6.54 3.17 1.28 1.12 0.16 0.37 0.69 2.37 -1.35
'90-'98 6.61 3.37 1.39 1.22 0.17 0.34 0.69 2.40 -1.58
'99-'03 5.87 1.39 0.86 0.68 0.18 0.54 0.73 2.02 0.33
'72-'03 7.22 3.51 1.45 1.17 0.28 0.30 1.14 1.73 -0.92
contribution to output growth
'72-79 100.0 60.7 26.1 19.3 6.8 3.3 18.1 17.3 -25.6
'80-'89 100.0 46.6 16.8 14.0 2.8 2.3 19.2 16.0 -0.9
'90-'99 100.0 48.5 19.6 17.2 2.5 5.7 10.6 36.3 -20.7
'90-'98 100.0 51.1 21.0 18.4 2.6 5.1 10.5 36.4 -24.0
'99-'03 100.0 23.6 14.7 11.6 3.1 9.3 12.4 34.4 5.6
'72-'03 100.0 48.7 20.1 16.3 3.9 4.2 15.8 23.9 -12.8
On the one hand the sectors which were based on IT technology such as i)
Office, accounting and computing machinery (1.91 percent), ii) Other electrical
machinery (2.45 percent), iii) Electronic valves and tubes(2.87 percent), iv)
Telecommunication equipment(2.13%) in Manufacturing, have shown higher
growth rate of TFP during the entire period(1972-2003) as shown in Table 11.
But the labor intensive sectors such as i) Leather and foot wear(-1.25 percent),
ii) Food products and beverages(-0.73percent), iii) Wearing apparel, dressing
and dying of fur(-0.69percent), iv)Printing and reproduction(-0.61 percent) have
shown negative growth rates of total factor productivity.
In Service, Post and telecommunication which is related strongly with IT
technology has recorded a relatively higher growth rate (4.93 percent) of TFP
among service sectors as shown in Table 12. But the social and private sectors
such as i) Public administration and defense (-10.36 percent), ii) Private
households with employed persons (-8.95 percent), iii) Other service activities(-
8.74 percent) have shown negative growth rates of TFP.
Therefore, we can see that the leading sectors for enhancing productivity

39
growth are related with IT sectors. Korean economy has heavily invested in IT
sectors on a full scale since 1995 (Table 10) as analyzed in Ha and Pyo (2004).
Table 12 The investment in IT sector
Year IT Investment (billion won) Growth(%)
1995 15,125.7 -
1996 17,916.0 16.9
1997 19,122.0 6.5
1998 17,099.2 -11.2
1999 23,716.0 32.7
2000 32,190.9 30.6
2001 31,502.0 -2.2
2002 33,143.8 5.1
2003 31,551.8 -4.9
2004 31,391.9 -0.5
*Investment is real value in 2000 prices
*Source: Bank of Korea (http://ecos.bok.or.kr
40
Table13 Sectoral TFP growth in manufacturing
(%)
Before
crisis
After
crisis Code Industry '72-'79 '80-'89 '90-'99
'90-'98 '99-'03
'72-'03
9 Food products and beverages -1.52 -0.65 -0.61 -0.59 0.12 -0.73
10 Tobacco products -2.14 1.65 3.13 3.44 0.88 1.09
11 Textiles 0.97 0.38 0.33 0.05 0.73 0.49
12 Wearing apparel, dressing and dying of fur -1.36 -0.04 -1.60 -2.23 1.85 -0.69
13 Leather, leather products and footwear -5.91 -1.55 2.16 2.33 0.39 -1.25
14 Wood and products of wood and cork 3.26 0.87 0.39 0.57 0.57 1.34
15 Pulp, paper and paper products -0.61 0.90 0.74 0.70 0.08 0.34
16 Publishing -0.60 2.80 -0.19 -1.60 1.33 0.48
17 Printing and reproduction 6.20 -3.66 -2.05 -1.45 -3.90 -0.61
18 Coke, refined petroleum products and nuclear fuel -0.84 -0.27 -0.84 -1.01 0.19 -0.55
19 Pharmaceuticals -3.21 0.92 -1.32 -1.53 7.01 0.15
20 Chemicals excluding pharmaceuticals 1.48 1.29 1.23 0.98 0.57 1.14
21 Rubber and plastics products 2.13 1.97 0.32 -0.29 1.38 1.28
22 Other non-metallic mineral products -0.17 0.29 0.59 0.24 2.38 0.49
23 Basic metals 3.24 1.49 0.87 0.93 0.21 1.57
24 Fabricated metal products 1.57 0.63 -0.16 -0.36 1.10 0.66
25 Machinery, nec 1.46 1.01 0.78 0.26 2.76 1.18
26 Office, accounting and computing machinery 3.13 -0.78 3.37 2.32 4.62 1.91
27 Insulated wire -4.09 -0.87 2.22 1.54 3.15 -0.37
28 Other electrical machinery and apparatus nec 5.33 0.75 1.40 1.14 3.58 2.45
29 Electronic valves and tubes 5.36 2.91 1.08 0.45 3.15 2.87
30 Telecommunication equipment -0.05 2.12 5.02 3.99 2.32 2.13
31 Radio and television receivers 2.22 0.29 0.95 -1.36 4.61 0.98
32 Scientific instruments 0.51 0.81 -0.04 -0.42 0.62 0.36
33 Other instruments - - - - - -
34 Motor vehicles, trailers and semi-trailers 0.00 0.74 -0.37 -1.43 2.98 0.29
35 Building and repairing of ships and boats 1.22 1.33 -2.81 -3.99 3.92 0.21
36 Aircraft and spacecraft 6.76* 5.14 4.22 5.60 0.52 4.62*
37 Railroad equipment and transport equipment nec -2.96 -2.00 1.22 1.32 -5.06 -1.78
38 Manufacturing nec -0.24 2.18 0.04 -0.08 0.30 0.65

41
39 Recycling - - - - - -
Table14 Sectoral TFP Growth in Service
(%)
Before
crisis
After
crisisCode Industry '72-'79 '80-'89 '90-'99
'90-'98 '99-'03
72-'03
40 Electricity supply 2.20 0.76 1.10 1.18 0.77 1.24
41 Gas supply 15.03 14.00 7.31 7.10 2.29 10.34
42 Water supply 8.67 3.38 -2.19 -2.51 -0.39 2.46
43 Construction -0.13 2.31 -0.91 -0.36 -1.27 0.39
44 Sale, maintenance and repair of motor vehicles and motorcycles - - -12.91 -14.71 2.09 -8.71*
45 Wholesale trade and commission trade -3.04 -2.46 -1.28 -2.21 1.26 -1.95
46 Retail trade -0.77 -3.31 -0.73 -0.71 0.41 -1.36
47 Hotels and restaurants -4.75 -4.69 -4.59 -6.20 1.80 -4.11
48 Inland transport 4.14 3.06 -0.42 -0.72 1.90 2.09
49 Water transport 4.72 2.21 1.31 1.92 0.71 2.52
50 Air transport -10.49 -0.79 -2.20 -1.85 2.70 -2.97
51 Supporting and auxiliary transport activities 5.71 0.76 -4.52 -4.83 1.50 0.54
52 Post and telecommunications 6.51 2.24 5.36 5.08 5.18 4.56
53 Financial intermediation 7.45 5.61 3.20 3.05 2.89 4.93
54 Insurance and pension funding 1.46 5.81 0.99 4.76 -0.28 3.47
55 Activities related to financial intermediation - - -2.77 -9.28 7.03 -3.46*
56 Imputation of owner occupied rents -8.68 -7.03 5.12 7.66 -11.66 -4.03
57 Other real estate activities -6.44 -3.41 -2.86 -3.70 12.35 -1.79
58 Renting of machinery and equipment -1.69 3.45 4.14 9.44 -4.13 2.66
59 Computer and related activities - - -7.89 -10.08 0.07 -6.45*
60 Research and development -0.73 -1.19 -2.51 -2.91 3.54 -0.82
61 Legal, technical and advertising -2.67 -0.04 -1.22 -1.24 0.38 -0.97
62 Other business activities, nec -11.74 3.97 -2.54 -4.20 2.69 -2.46
63 Public admin and defense -29.94 4.94 -18.73 -22.09 11.51 -10.36
64 Education 16.39 2.01 -2.35 -3.77 -12.68 1.68
65 Health and social work -32.93 9.88 1.43 1.88 -4.19 -5.27
66 Sewage and refuse disposal, sanitation and similar activities - - - - - -
67 Activities of membership organizations nec -3.54 -0.31 1.36 2.52 -2.73 -0.70
68 Media activities -16.43 -0.25 -9.24 -11.98 29.66 -2.92
69 Other recreational activities -4.15 2.90 -17.29 -20.27 13.60 -3.71
42
70 Other service activities -30.77 6.08 -18.93 -19.42 16.12 -8.74
71 Private households with employed persons -32.53 3.78 5.72 5.77 -23.15 -8.95
72 Extra-territorial organizations and bodies - - - - - -
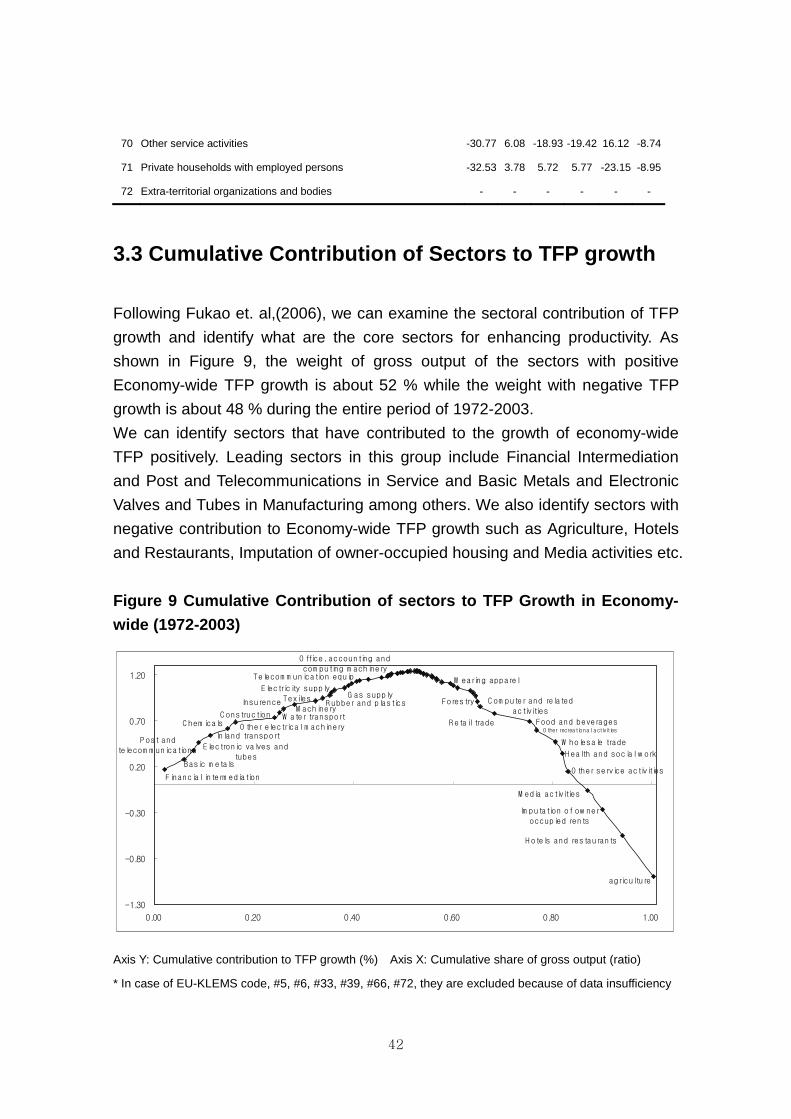
3.3 Cumulative Contribution of Sectors to TFP growth
Following Fukao et. al,(2006), we can examine the sectoral contribution of TFP
growth and identify what are the core sectors for enhancing productivity. As
shown in Figure 9, the weight of gross output of the sectors with positive
Economy-wide TFP growth is about 52 % while the weight with negative TFP
growth is about 48 % during the entire period of 1972-2003.
We can identify sectors that have contributed to the growth of economy-wide
TFP positively. Leading sectors in this group include Financial Intermediation
and Post and Telecommunications in Service and Basic Metals and Electronic
Valves and Tubes in Manufacturing among others. We also identify sectors with
negative contribution to Economy-wide TFP growth such as Agriculture, Hotels
and Restaurants, Imputation of owner-occupied housing and Media activities etc.
Figure 9 Cumulative Contribution of sectors to TFP Growth in Economy-
wide (1972-2003)
O ffice, accounting and
com puting m achineryTelecom m unication equip
Forestry C om puter and related
activities
R etail trade Food and beveragesO ther recreational activities
W holesale trade
H ealth and social w ork
O ther service activities
M edia activities
Im putation of ow ner
occupied rents
H otels and restaurants
agriculture
Electricity supplyG as supply
Inland transportP ost and
telecom m unications Electronic valves and
tubesBasic m etals
Financial interm ediation
C hem icals O ther electrical m achinery
C onstructionM achinery
Insurence
W ater transport
TexilesR ubber and plastics
W earing apparel
-1.30
-0.80
-0.30
0.20
0.70
1.20
0.00 0.20 0.40 0.60 0.80 1.00
Axis Y: Cumulative contribution to TFP growth (%) Axis X: Cumulative share of gross output (ratio)
* In case of EU-KLEMS code, #5, #6, #33, #39, #66, #72, they are excluded because of data insufficiency

43
As shown in Figure 10, the weight of gross output of the sectors with positive
TFP growth in Manufacturing is 72.4% while the weight with negative TFP
growth is 27.6% during the period of 1972-2003. The sub-sectors with positive
TFP growth are basic metals, chemicals, machinery, textiles, rubber and plastic,
fabricated metal, wood, other non metallic mineral, motor vehicles and trailers
as non IT sectors, and electronic valves and tubes, office, accounting and
computing machinery, telecommunications, radio and TV receivers as IT
sectors. The sub-sectors with negative TFP growth are leather and footwear,
wearing and apparel, coke and refined petroleum etc.
Figure 10 Cumulative Contribution of sectors to TFP Growth in
Manufacturing (1972-2003)
Motor vehicles , trailers
Other non metallic mineral
Radio and TV receivers
Wood
Leather and footwear
Wearing apparelCoke, refines petroleum
Food and beverages
Office, accounting and
computing machinery
Telecommunication
Fabricated metalRubber and plas tics
TexilesMachinery
Other eletrical machinery
Chemicals
Eletronic valves and tubes
Bas ic metals
0.0
0.2
0.4
0.6
0.8
1.0
1.2
1.4
1.6
0.0 0.1 0.2 0.3 0.4 0.5 0.6 0.7 0.8 0.9 1.0
Axis Y: Cumulative contribution to TFP growth (%) Axis X: Cumulative share of gross output (ratio)
On the other hand, we can look at Service industry separately. As shown in
Figure 11, the weight of gross output of the sectors with positive TFP growth in
Service is only about 40 % while the weight with negative TFP growth is 60 %
during the period of 1972-2003. The group of service industries with positive
TFP growth includes Financial intermediation, Post and communication, Inland
Transport, Water Transport, Construction etc. The group with negative TFP
growth includes Hotels and Restaurants, Imputation of owner-occupied housing,
Media activities and Wholesale trade etc.

44
Figure 11 Cumulative Contribution of sectors to TFP Growth in Service
(1972-2003)
Post and telecom m unicatios
Financial interm edition
Inland transportC onstruction W ater transport
Insurance and pentionG as supply
Electricity supply
H otel and restaurants
M edia activities
Im putation of ow ner
occupied rents
O ther service activities
W holesale trade
Health and social w orkO ther recreational
activities
Retail tradeC om puter and related activities
A ir transportO ther business activities
Legal,technical and advertising
-1.20
-1.00
-0.80
-0.60
-0.40
-0.20
0.00
0.20
0.40
0.60
0.80
0.00 0.20 0.40 0.60 0.80 1.00
Axis Y: Cumulative contribution to TFP growth (%) Axis X: Cumulative share of gross output (ratio)
* In case of EU-KLEMS code, #66, #72, they are excluded because of data insufficiency
3.4 Relations of TFP growth with Labor Productivity
and Output Growth
In order to identify the relation between labor productivity growth and TFP
growth, we can divide sectors into 4 groups by the average of growth rates in
Manufacturing or Service as follows:
In Manufacturing, the sectors that are above the average growth rates of both
labor productivity and TFP are:
- Electronic valves and tubes
- Other electrical machinery and apparatus
- Office, accounting and computing machinery
- Basic metal etc
The sectors in Manufacturing that are below the average growth rates of both

45
labor productivity and TFP are:
- Pulp, paper and paper products
- Printing and reproduction
- Wearing apparel
- Food and beverage
- Leather, leather products and footwear etc
On the other hand, in Service the sectors that are below the average growth
rates of both labor productivity and TFP are:
- Wholesale and retail and Hotels and Restaurants such as i) Retail trade,
ii) Wholesale trade and commission trade, iii) Sale, maintenance and
repair of motor vehicles, iv)Hotel and restaurants, and
- Business service such as i) Other business activities, ii) Computer and
related activities, and
- Social and private service such as i) Private households with employed
persons, ii) Public administration and defense etc.
In order to examine the relation between output growth and TFP growth, we can
divide sectors into 4 groups by the average of growth rates in Manufacturing or
Service as follows:
In Manufacturing (Table 15), the sectors that are above both the average growth
rate of output and that of TFP are over the average growth rates in
manufacturing in terms of output or TFP are:
- IT manufacturing sectors such as i) Electronic valves and tubes, ii)
Telecommunication equipment, iii) Office, accounting and computing
machinery, iv) Radio and television receivers, v) Other electrical
machinery and apparatus etc, and
- Traditional manufacturing sectors such as i) Machinery, ii) Chemicals etc.
Furthermore the sectors, labor intensive and relative advantage in Korean
economy during 1970s-1980s, which the growth rates are over the average
growth rates in manufacturing in terms of output or TFP simultaneously are:
- Pulp, paper and paper products
- Printing and reproduction
- Wearing apparel
- Food and beverage
46
- Leather, leather products and footwear etc
On the other hand, the sectors in Service that are above the average growth
rates (Table 16) of both output and TFP are:
- Gas supply
- Financial intermediation
- Post and telecommunication
The sectors in Service that are under the average growth rates of both output
and TFP are:
- Wholesale trade and commission trade,
- Hotels and restaurants
- Sale, maintenance and repair of motor vehicles etc
In case of i) Gas supply, ii) Financial intermediation, iii) Post and
telecommunication, they seem to have relative advantages in terms of
sectoral potential growth. But in case of i) Wholesale trade and commission
trade, ii) Hotels and restaurants, iii) Sales, maintenance and repair of motor
vehicles, so called traditional service sectors, they seem to have relative
disadvantages in terms of sectoral potential growth.
The relations of TFP with labor productivity and output growth can be further
examined by looking at the scatter diagrams such as Figure 12 and 13.
A visual inspection tells us that TFP growth is positively correlated with both
labor productivity growth and output growth and TFP-LP relation is stronger
than TFP –Output relation.
In Table 15, we have summarized two simple regression results where TFP
Growth rate is regressed upon LP and output growth rate. We are adopting
implicit hypotheses that higher LP and output growth induces TFP growth
through enhanced human capital and economies of scale. In both regressions,
the coefficients of LP growth and Output Growth are significant. The TFP-LP
regression seems more significant than TFP-Output regression.
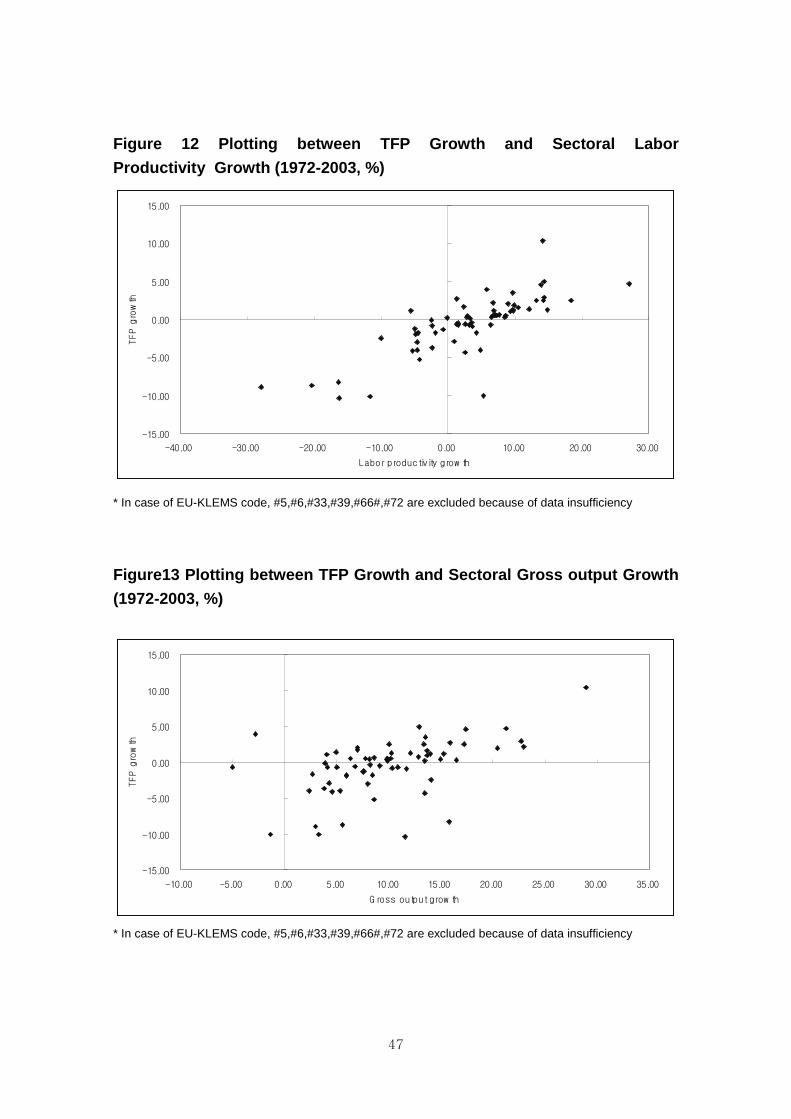
47
Figure 12 Plotting between TFP Growth and Sectoral Labor
Productivity Growth (1972-2003, %)
-15.00
-10.00
-5.00
0.00
5.00
10.00
15.00
-40.00 -30.00 -20.00 -10.00 0.00 10.00 20.00 30.00
Labor productivity grow th
TFP growth
* In case of EU-KLEMS code, #5,#6,#33,#39,#66#,#72 are excluded because of data insufficiency
Figure13 Plotting between TFP Growth and Sectoral Gross output Growth
(1972-2003, %)
-15.00
-10.00
-5.00
0.00
5.00
10.00
15.00
-10.00 -5.00 0.00 5.00 10.00 15.00 20.00 25.00 30.00 35.00
G ross output grow th
TFP growth
* In case of EU-KLEMS code, #5,#6,#33,#39,#66#,#72 are excluded because of data insufficiency

48
Table 15 Regression Results _____________________________________________________________________________________
1. Relation between Labor Productivity Growth and TFP Growth
Model: log (TFPt/TFPt-1)=α + β log (LPt/LPt-1)+ γ
log (TFPt/TFPt-1) = Sectoral average TFP growth rate during 1972-2003,
log (LPt/LPt-1) = Sectoral average labor productivity growth rate during
1972-2003
Number of sectors: 66 sectors (except #5,#6,#33,#39,#66#,#72 for data
insufficiency)
Dependent var. β S.E DW adjR2
TFP Growth Rate 0.322*** 0.031 1.967 0.613
***: Pr>t is 1%, **:Pr>t is 5%, *:Pr>t is 10%
1) Data for Sector 36 is available only during 1977-2003, and data for sectors of 44, 55, 59 are available
only during 1989-2003.
2. Relation between Gross Output Growth and TFP Growth
Model: log (TFPt/TFPt-1)=α + β log(GOt/GOt-1)+ γ
log (TFPt/TFPt-1) = Sectoral average TFP growth during 1972-2003,
log (GOt/GOt-1) = Sectoral average Gross output growth rate during 1972-
2003
Number of sectors: 66 sectors(except #5,#6,#33,#39,#66#,#72 for data
insufficiency)
Dependent var. β S.E DW adjR2
TFP Growth rate 0.306*** 0.066 1.479 0.235
***: Pr>t is 1%, **:Pr>t is 5%, *:Pr>t is 10%
1) Data for Sector 36 is available only during 1977-2003, and data for sectors of 44, 55, 59 are available
only during 1989-2003
_______________________________________________________________

49
Table 16 Relation between Labor Productivity and TFP in Manufacturing
(1972-2003)
<unit: log growth rates(%)>
EU-KLEMS
Code Industry Period Labor productivity TFP
Manufacturing 72-'03 6.99 0.48
High Labor productivity/High TFP
36 Aircraft and spacecraft 77-'03 27.08 4.62
29 Electronic valves and tubes 72-'03 14.33 2.87
28 Other electrical machinery and apparatus nec 72-'03 14.24 2.45
26 Office, accounting and computing machinery 72-'03 9.88 1.91
23 Basic metals 72-'03 10.42 1.57
14 Wood and products of wood and cork 72-'03 12.11 1.34
21 Rubber and plastics products 72-'03 9.66 1.28
20 Chemicals excluding pharmaceuticals 72-'03 9.73 1.14
31 Radio and television receivers 72-'03 9.31 0.98
24 Fabricated metal products 72-'03 7.08 0.66
38 Manufacturing nec 72-'03 7.67 0.65
22 Other non-metallic mineral products 72-'03 7.26 0.49
High Labor productivity/Low TFP
32 Scientific instruments 72-'03 8.52 0.36
Low Labor productivity/High TFP
30 Telecommunication equipment 72-'03 6.70 2.13
25 Machinery, nec 72-'03 6.79 1.18
10 Tobacco products 72-'03 -5.55 1.09
11 Textiles 72-'03 6.98 0.49
16 Publishing 72-'03 6.73 0.48
Low Labor productivity/Low TFP
15 Pulp, paper and paper products 72-'03 6.41 0.34
34 Motor vehicles, trailers and semi-trailers 72-'03 2.78 0.29
35 Building and repairing of ships and boats 72-'03 -0.07 0.21
19 Pharmaceuticals 72-'03 3.27 0.15
27 Insulated wire 72-'03 3.51 -0.37
18 Coke, refined petroleum products and nuclear fuel 72-'03 1.50 -0.55
17 Printing and reproduction 72-'03 1.28 -0.61
12 Wearing Apparel, Dressing And Dying Of Fur 72-'03 1.58 -0.69

50
9 Food products and beverages 72-'03 3.19 -0.73
13 Leather, leather products and footwear 72-'03 -4.89 -1.25
37 Railroad equipment and transport equipment nec 72-'03 -1.94 -1.78
* In case of EU-KLEMS Code, #33, #39, they are excluded because of data insufficiency.
Table 17 Relations between Labor Productivity and TFP in Service (1972-
2003)
<unit: log growth rates(%)>
EU-KLEMS
Code Industry Period Labor productivity TFP
Service 72-03 2.91 -0.92
High Labor productivity/High TFP
41 Gas supply 73-03 14.08 10.34
53 Financial intermediation 72-03 14.29 4.93
52 Post and telecommunications 72-03 13.90 4.56
54 Insurance and pension funding 72-03 9.59 3.47
49 Water transport 72-03 13.13 2.52
42 Water supply 72-03 18.36 2.46
48 Inland transport 72-03 8.97 2.09
40 Electricity supply 72-03 14.81 1.24
51 Supporting and auxiliary transport activities 72-03 8.57 0.54
43 Construction 72-03 2.94 0.39
67 Activities of membership organizations nec 72-03 6.30 -0.70
High Labor productivity/Low TFP
61 Legal, technical and advertising 72-03 3.62 -0.97
Low Labor productivity/High TFP
58 Renting of machinery and equipment 72-03 1.25 2.66
64 Education 72-03 2.36 1.68
60 Research and development 72-03 -2.38 -0.82
Low Labor productivity/Low TFP
46 Retail trade 72-03 -0.73 -1.36
57 Other real estate activities 72-03 -4.52 -1.79
45 Wholesale trade and commission trade 72-03 -4.87 -1.95
62 Other business activities, nec 72-03 -9.97 -2.46
68 Media activities 72-03 1.00 -2.92
50 Air transport 72-03 -4.57 -2.97

51
55 Activities related to financial intermediation 90-03 2.72 -3.46
69 Other recreational activities 72-03 -2.39 -3.71
56 Imputation of owner occupied rents 72-03 -4.58 -4.03
47 Hotels and restaurants 72-03 -5.25 -4.11
65 Health and social work 72-03 -4.27 -5.27
59 Computer and related activities 90-03 -16.84 -6.45
44 Sale, maintenance and repair of motor vehicles 90-03 -12.16 -8.71
70 Other service activities 72-03 -20.38 -8.74
71 Private households with employed persons 72-03 -27.83 -8.95
63 Public admin and defense 72-03 -16.20 -10.36
* In case of EU-KLEMS Code, #66, #72, they are excluded because of data insufficiency.
Table 18 Output and TFP Growth in Manufacturing (1972-2003)
<unit: log growth rates(%)>
EU-KLEMS
Code Industry Period
Output
growth TFP
Manufacturing 72-'03 10.18 0.48
High output growth/High TFP
36 Aircraft and spacecraft 77-'03 21.25 4.62
29 Electronic valves and tubes 72-'03 22.74 2.87
28 Other electrical machinery and apparatus nec 72-'03 17.22 2.45
30 Telecommunication equipment 72-'03 22.94 2.13
26 Office, accounting and computing machinery 72-'03 20.46 1.91
23 Basic metals 72-'03 13.65 1.57
21 Rubber and plastics products 72-'03 12.05 1.28
25 Machinery, nec 72-'03 15.29 1.18
20 Chemicals excluding pharmaceuticals 72-'03 13.98 1.14
31 Radio and television receivers 72-'03 13.65 0.98
24 Fabricated metal products 72-'03 12.81 0.66
High output growth/Low TFP
32 Scientific instruments 72-'03 14.93 0.36
34 Motor vehicles, trailers and semi-trailers 72-'03 16.48 0.29
35 Building and repairing of ships and boats 72-'03 13.43 0.21
Low output growth/High TFP
14 Wood and products of wood and cork 72-'03 4.91 1.34
10 Tobacco products 72-'03 4.05 1.09
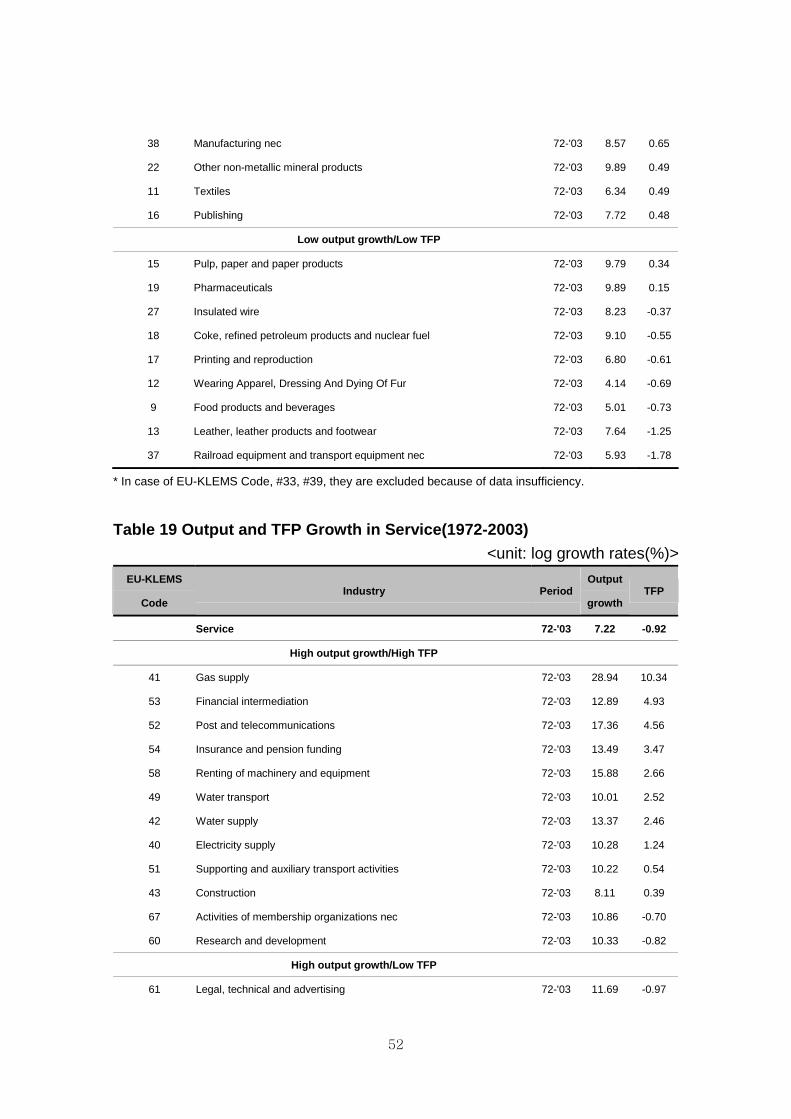
52
38 Manufacturing nec 72-'03 8.57 0.65
22 Other non-metallic mineral products 72-'03 9.89 0.49
11 Textiles 72-'03 6.34 0.49
16 Publishing 72-'03 7.72 0.48
Low output growth/Low TFP
15 Pulp, paper and paper products 72-'03 9.79 0.34
19 Pharmaceuticals 72-'03 9.89 0.15
27 Insulated wire 72-'03 8.23 -0.37
18 Coke, refined petroleum products and nuclear fuel 72-'03 9.10 -0.55
17 Printing and reproduction 72-'03 6.80 -0.61
12 Wearing Apparel, Dressing And Dying Of Fur 72-'03 4.14 -0.69
9 Food products and beverages 72-'03 5.01 -0.73
13 Leather, leather products and footwear 72-'03 7.64 -1.25
37 Railroad equipment and transport equipment nec 72-'03 5.93 -1.78
* In case of EU-KLEMS Code, #33, #39, they are excluded because of data insufficiency.
Table 19 Output and TFP Growth in Service(1972-2003)
<unit: log growth rates(%)>
EU-KLEMS
Code Industry Period
Output
growth TFP
Service 72-'03 7.22 -0.92
High output growth/High TFP
41 Gas supply 72-'03 28.94 10.34
53 Financial intermediation 72-'03 12.89 4.93
52 Post and telecommunications 72-'03 17.36 4.56
54 Insurance and pension funding 72-'03 13.49 3.47
58 Renting of machinery and equipment 72-'03 15.88 2.66
49 Water transport 72-'03 10.01 2.52
42 Water supply 72-'03 13.37 2.46
40 Electricity supply 72-'03 10.28 1.24
51 Supporting and auxiliary transport activities 72-'03 10.22 0.54
43 Construction 72-'03 8.11 0.39
67 Activities of membership organizations nec 72-'03 10.86 -0.70
60 Research and development 72-'03 10.33 -0.82
High output growth/Low TFP
61 Legal, technical and advertising 72-'03 11.69 -0.97
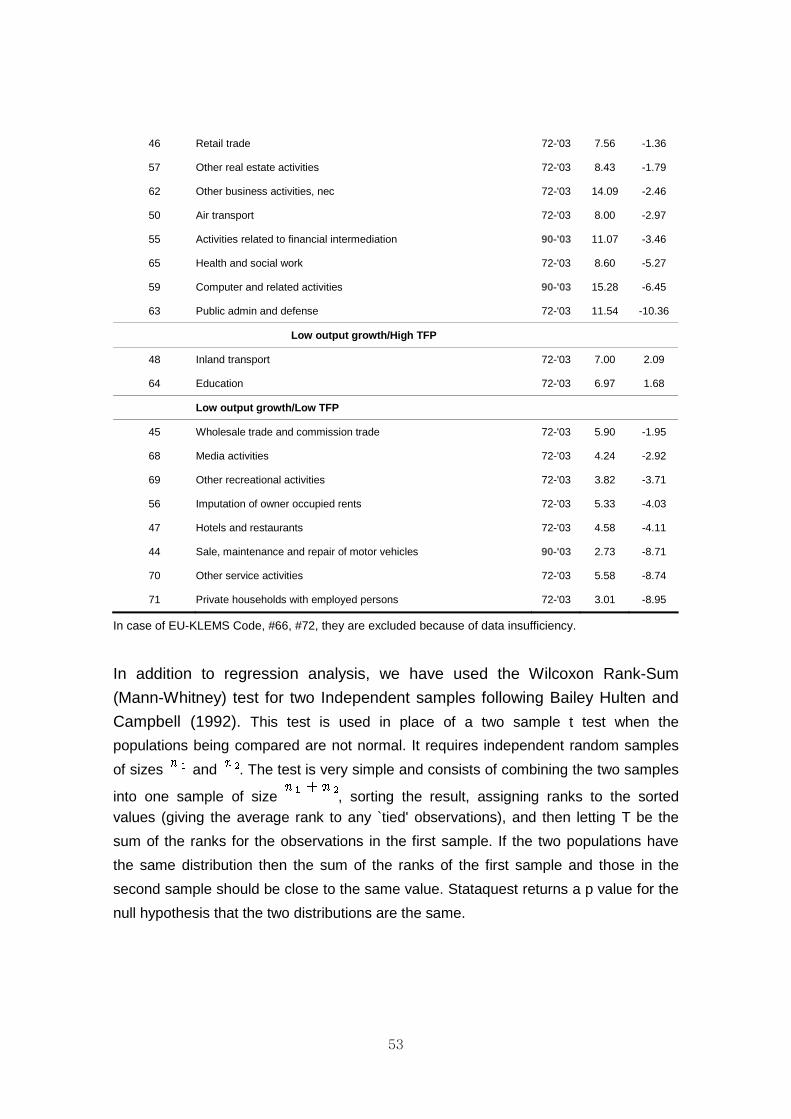
53
46 Retail trade 72-'03 7.56 -1.36
57 Other real estate activities 72-'03 8.43 -1.79
62 Other business activities, nec 72-'03 14.09 -2.46
50 Air transport 72-'03 8.00 -2.97
55 Activities related to financial intermediation 90-'03 11.07 -3.46
65 Health and social work 72-'03 8.60 -5.27
59 Computer and related activities 90-'03 15.28 -6.45
63 Public admin and defense 72-'03 11.54 -10.36
Low output growth/High TFP
48 Inland transport 72-'03 7.00 2.09
64 Education 72-'03 6.97 1.68
Low output growth/Low TFP
45 Wholesale trade and commission trade 72-'03 5.90 -1.95
68 Media activities 72-'03 4.24 -2.92
69 Other recreational activities 72-'03 3.82 -3.71
56 Imputation of owner occupied rents 72-'03 5.33 -4.03
47 Hotels and restaurants 72-'03 4.58 -4.11
44 Sale, maintenance and repair of motor vehicles 90-'03 2.73 -8.71
70 Other service activities 72-'03 5.58 -8.74
71 Private households with employed persons 72-'03 3.01 -8.95
In case of EU-KLEMS Code, #66, #72, they are excluded because of data insufficiency.
In addition to regression analysis, we have used the Wilcoxon Rank-Sum
(Mann-Whitney) test for two Independent samples following Bailey Hulten and
Campbell (1992). This test is used in place of a two sample t test when the
populations being compared are not normal. It requires independent random samples
of sizes and . The test is very simple and consists of combining the two samples
into one sample of size , sorting the result, assigning ranks to the sorted values (giving the average rank to any `tied' observations), and then letting T be the
sum of the ranks for the observations in the first sample. If the two populations have
the same distribution then the sum of the ranks of the first sample and those in the
second sample should be close to the same value. Stataquest returns a p value for the
null hypothesis that the two distributions are the same.

54
Table 20 Wilcoxon Rank-Sum (Mann-Whitney) Test results:
1. TFP-LP test
n1 n2 U P (two-tailed) P (one-tailed)
66 66 2178 1* 0.500766*
normal approx
z = 0 1* 0.5*
*These values are approximate.
The two samples are not significantly different (P >= 0.05, two-tailed test).
2.TFP-Gross Output growth test
n1 n2 U P (two-tailed) P (one-tailed)
66 66 2178 1* 0.500777*
normal approx
z = 0 1* 0.5*
*These values are approximate.
The two samples are not significantly different (P >= 0.05, two-tailed test).
4. Conclusion
The purpose of this paper is to explain the methodologies of how the database
of Korea has been constructed for estimating productivities by industry in
KLEMS model. For this purpose we have employed several conceptual tool and
data generation system as follows.
(1) Gross Output and Intermediate Inputs
We have used Make Tables and Use Tables as well as Input-Output Tables
(commodity-by-commodity) for measuring gross output and intermediate input
(energy, material, and service). In order to generate tables in missing years, we
have applied RAS method. The weighted average of Producer's Price Index
and Imported Price Index has been applied for input prices in Use Tables.

55
(2) Capital Input
Pyo (2003)'s estimates have been reconciled to generate capital stock series,
and the user costs of capital has been generated for estimating capital service
inputs.
(3) Labor input
Total labor input is decomposed into labor quantity (men-hour) and labor quality.
The former is generated form the Economically Active Population Yearbook by
NSO, and the latter from the Survey Report on Wage Structure by Ministry of
Labor while following the methodology of Jorgenson, Gollop, and Fraumeni
(1987).
Based on data structure we have generated, we have estimated 72-industry
level labor productivity and TFP. We have also conducted a gross output growth
accounting. Throughout the entire period of 1971-2003, the economy-wide labor
productivity has grown at the average rate of 5.59 percent but with the sectoral
difference between Manufacturing (6.99 %) and Service (2.91 %). The
difference did not shrink but rather has expanded as the process of
industrialization continued. For example, the difference in the 1990’s (9.55 % vs.
2.64 %) has been more than doubled since 1970’s (4.01 % vs. 2.15 %). The
observed difference in both levels and growth rates of labor productivity
between Manufacturing and Service can signal the difference in the degree of
foreign competition, the proportion of tradable and non-tradable and the degree
of domestic competition due to historically different regulatory environments.
The growth rate of economy-wide TFP has been estimated as -0.59 percent.
The growth rates of TFP in Manufacturing and Service are estimated as 0.48
percent and -0.92 percent respectively throughout the entire period of 1972-
2003. Throughout the entire period 1972-2003, Korean economy experienced
about 2 break-points: mid-1970s which was the first oil shock and in 1997 which
was the financial crisis. The difference between two break points can be
summarized as follows. During the second half of 1970’s, the growth rate of
gross output was not low, but the growth rates of inputs such as capital(4.56%),
labor(1.79%), energy(0.69%), intermediate goods(3.34%) especially, were
relatively higher. Therefore, the growth rates of TFP have been estimated as

56
negative. In case of late 1990’s the negative growth of TFP has been resulted
from the shrink of gross output rooted from economic crisis.
In addition we observe that the estimated TFP growth rates in Manufacturing
are in general greater than in Service. It maybe due to the fact that an
innovation process such as product innovation or process innovation is more
sensitive and stronger in manufacturing than in service. Also the R&D
investment for innovation is in general more intensive in manufacturing than in
service. So the growth rates of TFP in Manufacturing seem to be greater than in
Service.
We can identify sectors that have contributed to the growth of economy-wide
TFP positively by decomposing relative contribution of each sector to total TFP
growth (Y-axis) with each sector’s relative weight of output (X-axis). Leading
sectors in this group include Financial Intermediation and Post and
Telecommunications in Service and Basic Metals and Electronic Valves and
Tubes in Manufacturing among others. We also identify sectors with negative
contribution to Economy-wide TFP growth such as Agriculture, Hotels and
Restaurants, Imputation of owner-occupied housing and Media activities etc.
The relations of TFP with labor productivity and output growth can be examined
by looking at the scatter diagrams and a regression analysis. A visual inspection
tells us that TFP growth is positively correlated with both labor productivity
growth and output growth and TFP-LP relation is stronger than TFP –Output
relation. We have adopted an implicit hypotheses that higher LP and output
growth induces TFP growth through enhanced human capital and economies of
scale. In both regressions, the coefficients of LP growth and Output Growth are
significant. The TFP-LP regression seems more significant than TFP-Output
regression.
Productivities in an economy are not identical across industries, and productivity
differences are also observed when compared with the same industry in other
economies. For example, most industries in Japan exhibit higher productivity in
Manufacturing such as electrical machinery, motor, other transport vehicles,
and instruments industries resulting in higher productivity in the entire economy.
However, total factor productivities of Korea in construction, petroleum products,

57
fabricated machinery, and finance industries are higher than those of Japan.
International comparison of productivity among industries will demonstrate a
relative productivity of each industry, illustrating whether the way the goods or
services are produced is relatively efficient or not and referring to the
appropriate policies for improvement such as competition, restriction, R&D
policies, and so on. Establishment of dataset with the same standards for
productivity measurement will facilitate these inter-industry and international
comparisons, and contribute to a better understanding of economic growth.

58
References [1] Baily, Martin Neil, Charles Hulten, and David Campbell “ Productivity
Dynamics in Manufacturing Plants,” Brookings Papers on Economic
Activity:Microeconomics, pp.187-249,1992
[2] Berndt, E. and L. Christensen, "The Translog Function and the Substitution
of Equipment, Structures, and Labor in US Manufacturing, 1929-1968,"
Journal of Econometrics, Vol.1, pp.81-114, 1973
[3] Berndt, E. and L. Christensen, "Testing for the Existence of a Consistent
Aggregate Index of Labor Input," American Economic Review, Vol.3, pp.391-
404, 1974
[4] Berndt, E. and D. Wood, "Technology, Prices, and the Derived Demand for
Energy," Review of Economics and Statistics, Vol.57, pp.259-268, 1975
[5] Denny, M. and M. Fuss, "The Use of Approximation Analysis to Test for
Separability and the Existence of Consistent Aggregates," American
Economic Revew, vol.67, pp.404-418, 1977
[6] Harberger, Arnold C., "Perspectives on Capital and Technology in Less-
Developed Countries," in Contemporary Economic Analysis: Papers
presented at the conference of the Association of University Teachers of
Economics," Edited by Artis, Michael J. and Nobay, A. R., Croom Helm
London, 1987
[7] Inklaar, Robert, Marcel P. Timmer and Bart van Art (2006), “Mind the Gap!:
International Comparisons of Productivity in Services and Goods
Production,” unpublished manuscript
[8] Jorgenson, D.W., F. M. Gollop and B.M.Fraumeni, Productivity and US
Economic Growth, Cambridge MA: Harvard University Press, 1987
[9] Jorgenson, D.W., Mun S. Ho, and Kevin J. Stiroh, "Growth of U.S. Industries
and Investments in Information Technology and Higher Education," in
Measuring Capital in the New Economy, edited by Carol Corrado, John
Haltiwanger, and Daniel Sichel, Studies in Income and Wealth Vol. 65,
National Bureau of Economic Research, 2005
[10] Kim Hyunjeong, “The Shift to the Service Economy; Causes and Effects”,
BOK Institute, Working Paper 254, May 2006
[11]Krugman, Paul, "The Myth of Asia's Miracle," Foreign affairs,
November/December, 1994
[12] Kyoji Fukao, “Industry and firm level total factor productivity and economic
59
growth in Japan”, RIETI Workshop, July 2006,
[13] Kyoji Fukao, et al., “Estimation Procedures and TFP Analysis of the JIP
Analysis of the JIP Database 2006 Provisional Version”, Paper presented at
RIETI Conference on Determinants of Total Factor Productivity and Japan’s
Potential Growth: An International Perspective, July 25, 2006
[14] Lau, Lawrence J. and Jong-Il Kim, "The Sources of Growth of East Asian
Newly Industrialized Countries," Journal of Japanese and International
Economies, 1994.
[15] Lewis, W. William, The Power of Productivity: Wealth, Poverty, and the
Threat to Global Stability, University of Chicago Press, 2004
[16] Pyo, Hak K., "Estimates of Capital Stock and Capital / Output Coefficients
by Industries: Korea, 1953-1986", International Economic Journal, summer
1988
[17] Pyo, Hak K., "A Synthetic Estimate of National Wealth of Korea", 1953-
1990, KDI Working Paper No.9212, Korea Development Institute, Seoul,
1992
[18] Pyo. Hak K, "Estimates of Fixed Reproducible Tangible Assets in the
Republic of Korea, 1953-1996", KDI Working Paper No.9810, Korea
Development Institute, Seoul, 1998
[19] Pyo, Hak K., "Estimates of Capital Stocks by Industries and Types of
Assets in Korea (1953-2000)", Journal of Korean Economic Analysis, Panel
for Korean Economic Analysis and Korea Institute of Finance, Seoul 2003
[20] Pyo, Hak K., “Interdependecy in East Asia and the Post-Crisis
Macroeconomic Adjustment in Korea”, Seoul Journal of Economics, Volume
17 Number 1, Spring 2004
[21] Pyo Hak K. and Bongchan Ha, "A Test of Separability and Random Effects
in Production Function with Decomposed IT Capital," Forthcoming,
Hitotsubashi Journal of Economics, 2006
[22] Pyo Hak K., Keun-Hee Rhee, and Bongchan Ha , "Growth Accounting,
Productivity Analysis, and Purchasing Power Parity in Korea(1984-2000)",
presented at the Fifth Workshop on the International Comparison of
Productivity among Asian Countries, October, 2004, Tokyo, Japan, 2004
[23] Pyo Hak K. and Bongchan Ha, "Productivity Convergence and Investment
Stagnation in East Asia," presented at CIRJE seminar, University of Tokyo,
Japan, July 21, 2005
[24] Pyo Hak K., Keun-Hee Rhee, and Bongchan Ha , “Productivity Analysis by

60
Industry in Korea and International Comparison through EU KLEMS
Database:Data Structure”, Paper presented at EU-KLEMS Workshop, May
7-9, 2006, Valencia
[25] Pyo Hak K., Investment Stagnation in East Asia and Policy Implications for
Sustainable Growth, Working Paper 06-01,Korea Institute for International
Economic Policy, Seoul
[26] Timmer, Marcel, “The Dynamics of Asian Manufacturing: A Comparative
Perspective, 1963-1993”, Eindhoven Centre for Innovation Studies,
Dissertation Series, 1999
[27] Timmer, Marcel, "EUKLMES Road map WP1," EU KLEMS webpage,
October, 2005
[28] Young, Alwyn, "Lessons from the East Asian NICs : A Contrarian View,"
European Economic Review papers and proceedings, 1994
[29] Yuhn Ky-Hyang, "Functional Separability and the Existence of Consistent
Aggregates in U.S. Manufacturing," International Economic Review, Vol.32,
No.1, pp.229-250, 1991
61
Appendix
Table A-1. EU KLEMS Industrial Classification
Table A-2. Reclassification of National Accounts into 72 Industries
Table A-3. Nominal Gross Output
Table A-4. Nominal Value-added
Table A-5. Nominal Share of Labor
Table A-6. Nominal Share of Capital
Table A-7. Nominal Value of Energy
Table A-8. Nominal Value of Material
Table A-9. Nominal Value of Service
Table A-10. Real Gross Output
Table A-11. Real Value-added
Table A-12. Real Share of Labor
Table A-13. Real Share of Capital
Table A-14. Real Value of Energy
Table A-15. Real Value of Material
Table A-16. Real Value of Service
Table A-17. Real Capital Stock by Asset in 2000 Prices(Unit: Billion Won)
Table A-18. Real Capital Stock by Industry in 2000 Prices(Unit: Billion Won)
Table A-19 Employed
Table A-20 Aggregate Working Hour

62
Table A-21 Average Working Hour
Table A-22 Labor Quantity
Table A-23 Labor Quality
Table A-24 Labor Growth Rate

63
Table A-1. EUKLEMS Industrial Classifications
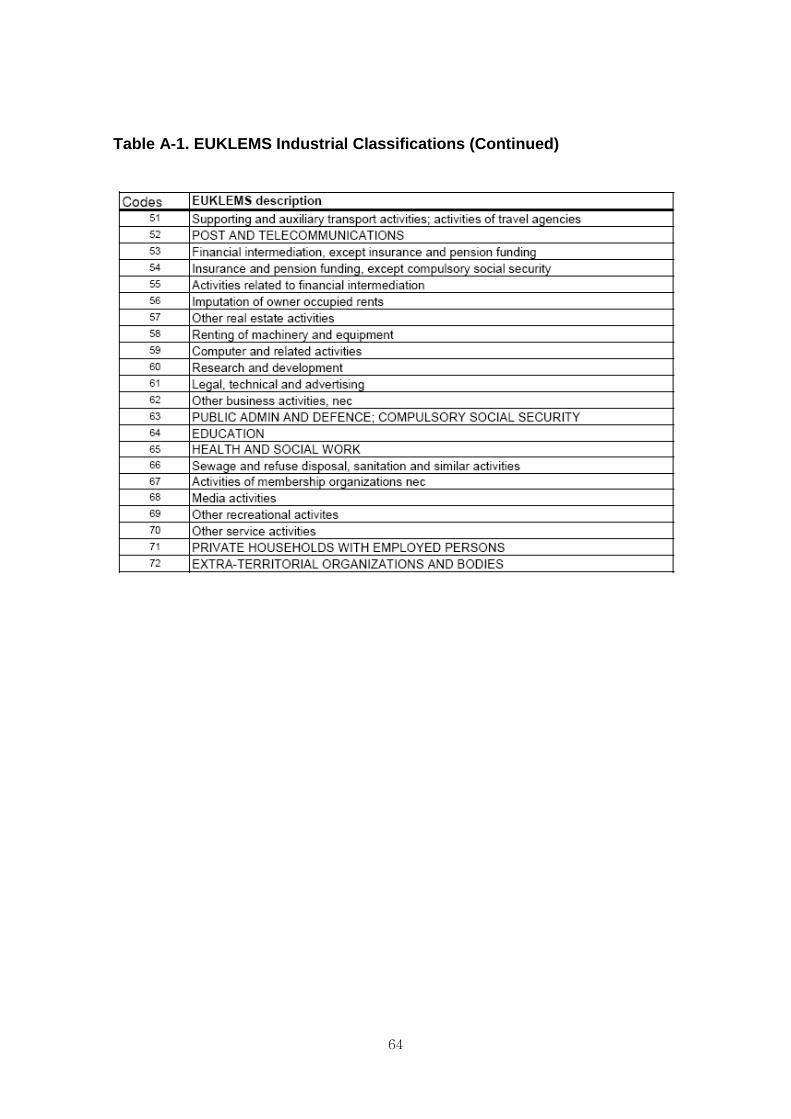
64
Table A-1. EUKLEMS Industrial Classifications (Continued)

65
Table A-2. Reclassification of National Accounts into 72 Industries

66
Table A-3. Nominal Gross Output
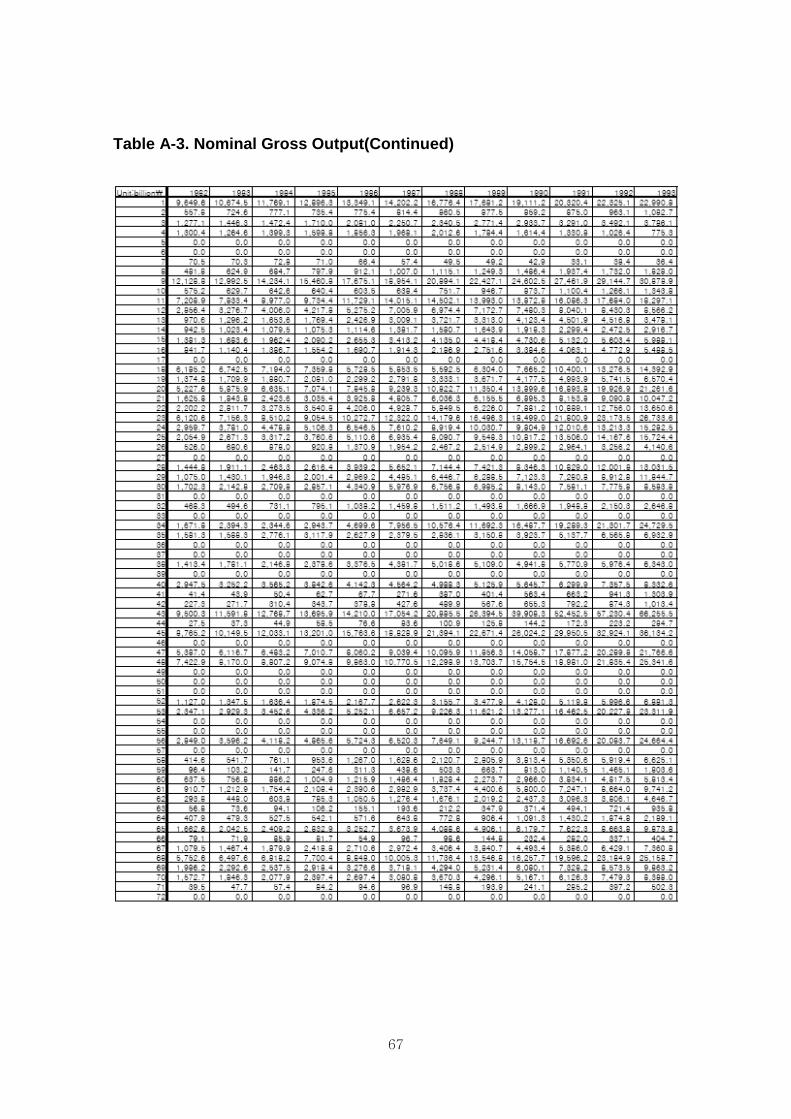
67
Table A-3. Nominal Gross Output(Continued)

68
Table A-3. Nominal Gross Output(Continued)
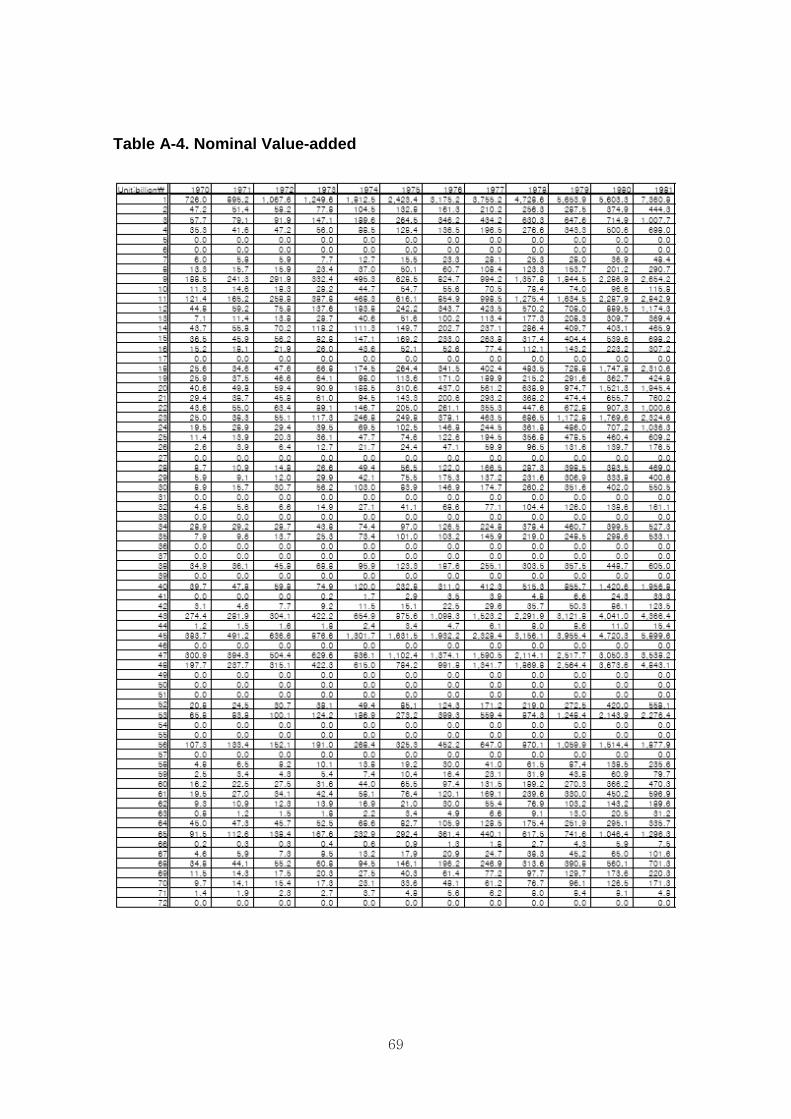
69
Table A-4. Nominal Value-added

70
Table A-4. Nominal Value-added(Continued)
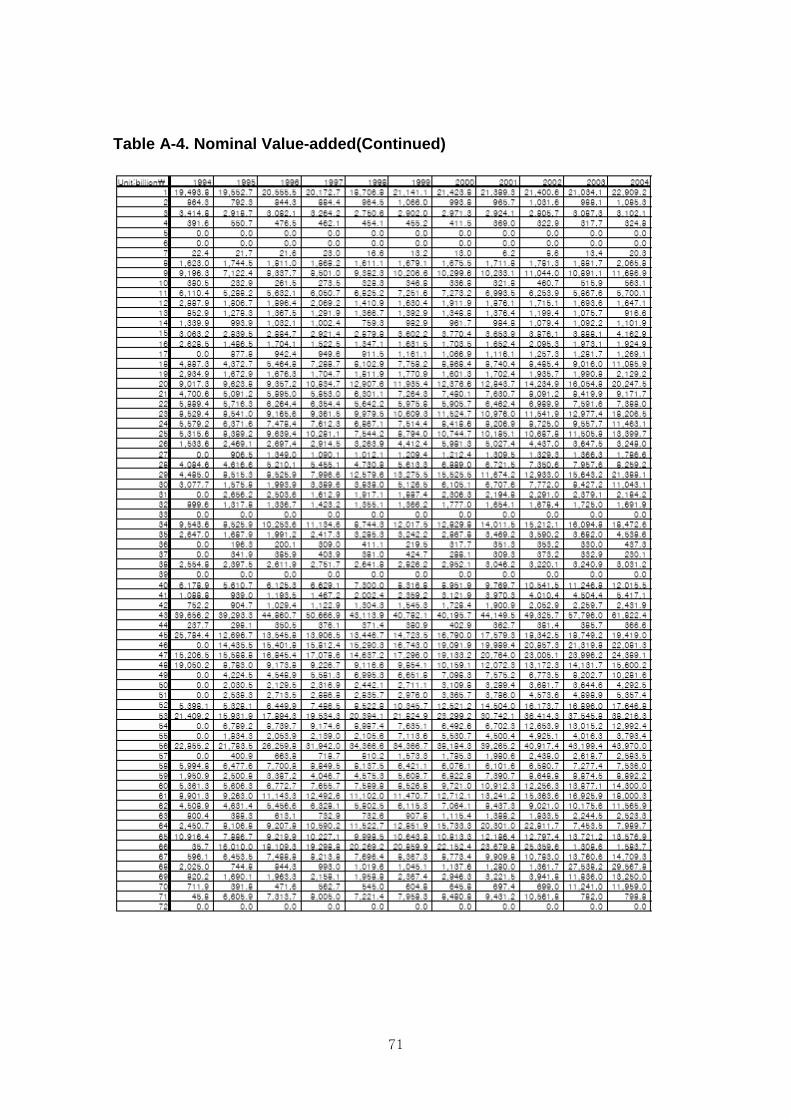
71
Table A-4. Nominal Value-added(Continued)

72
Table A-5. Nominal Share of Labor

73
Table A-5. Nominal Share of Labor(Continued)

74
Table A-5. Nominal Share of Labor(Continued)

75
Table A-6. Nominal Share of Capital

76
Table A-6. Nominal Share of Capital(Continued)

77
Table A-6. Nominal Share of Capital(Continued)

78
Table A-7. Nominal Value of Energy

79
Table A-7. Nominal Value of Energy(Continued)
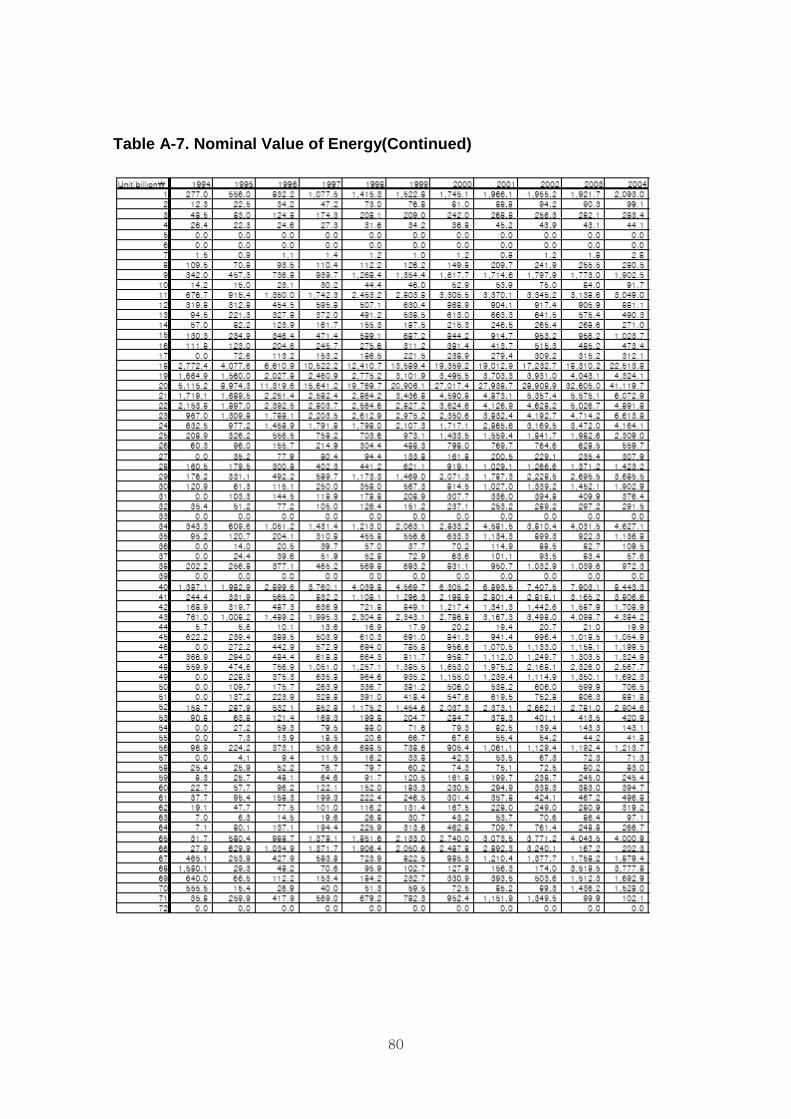
80
Table A-7. Nominal Value of Energy(Continued)

81
Table A-8. Nominal Value of Material

82
Table A-8. Nominal Value of Material(Continued)

83
Table A-8. Nominal Value of Material(Continued)
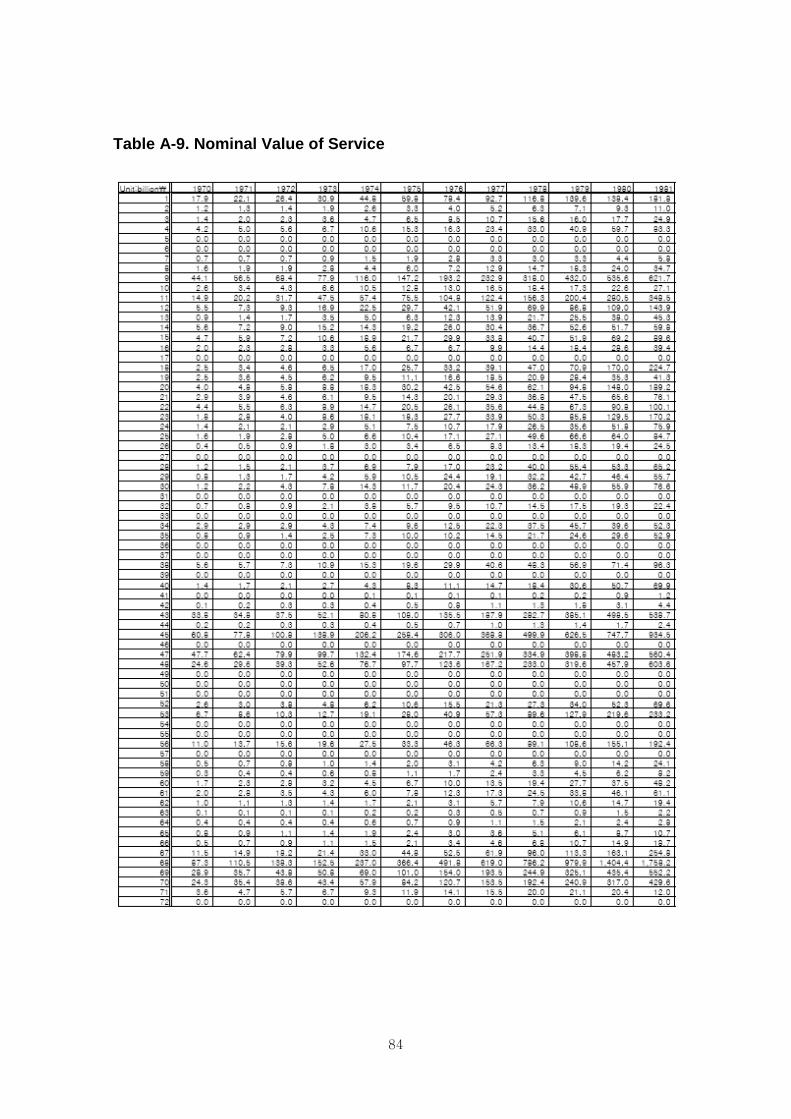
84
Table A-9. Nominal Value of Service

85
Table A-9. Nominal Value of Service(Continued)

86
Table A-9. Nominal Value of Service(Continued)

87
Table A-10. Real Gross Output

88
Table A-10. Real Gross Output(Continued)

89
Table A-10. Real Gross Output(Continued)

90
Table A-11. Real Value-added

91
Table A-11. Real Value-added(Continued)

92
Table A-11. Real Value-added(Continued)
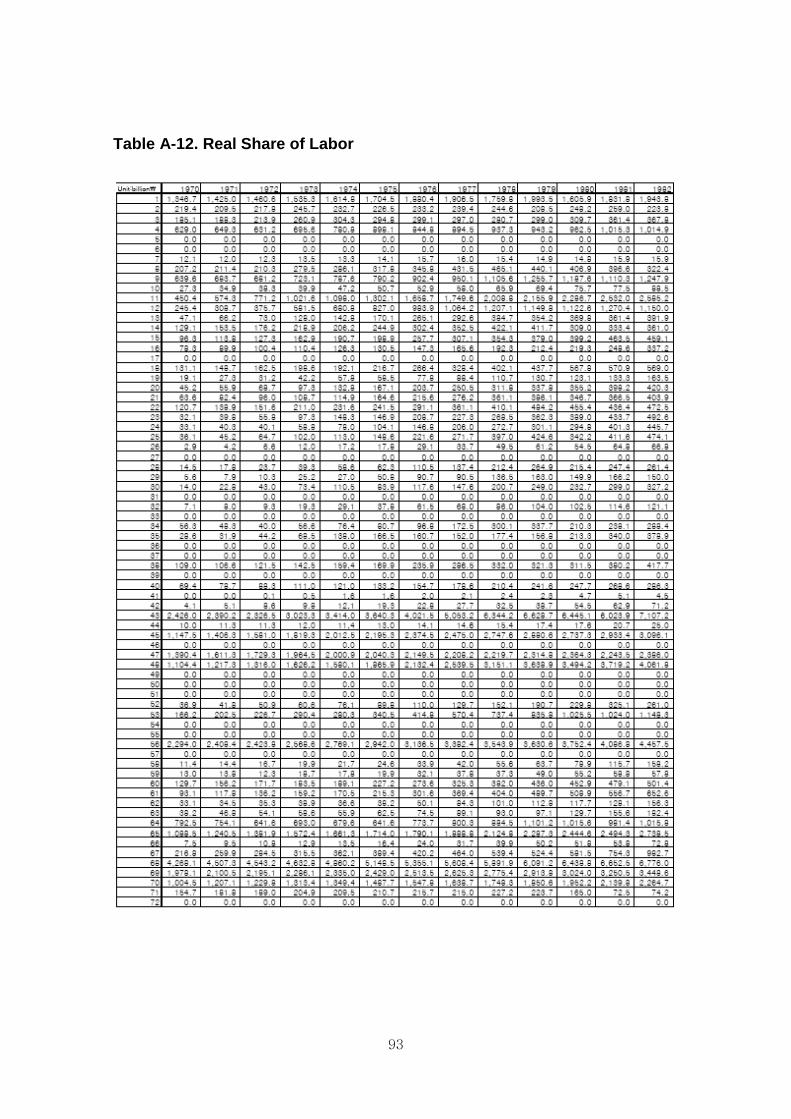
93
Table A-12. Real Share of Labor

94
Table A-12. Real Share of Labor(Continued)

95
Table A-12. Real Share of Labor(Continued)

96
Table A-13. Real Share of Capital

97
Table A-13. Real Share of Capital(Continued)

98
Table A-13. Real Share of Capital(Continued)

99
Table A-14. Real Value of Energy
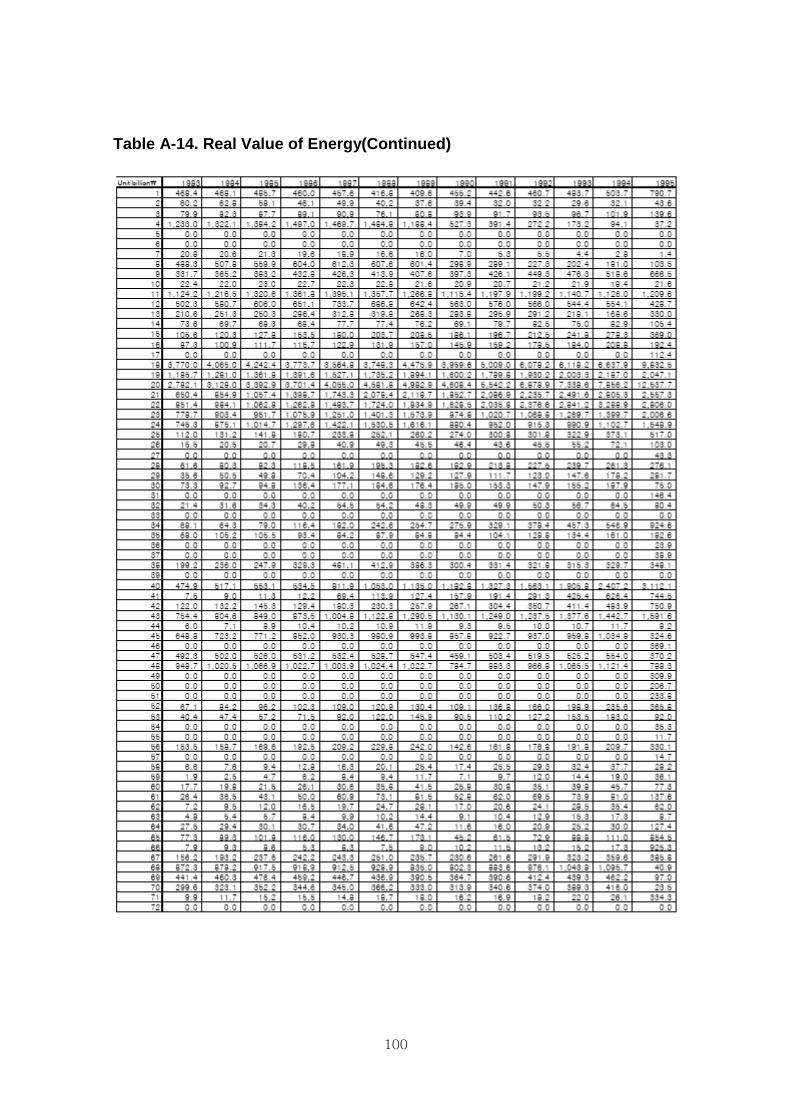
100
Table A-14. Real Value of Energy(Continued)

101
Table A-14. Real Value of Energy(Continued)
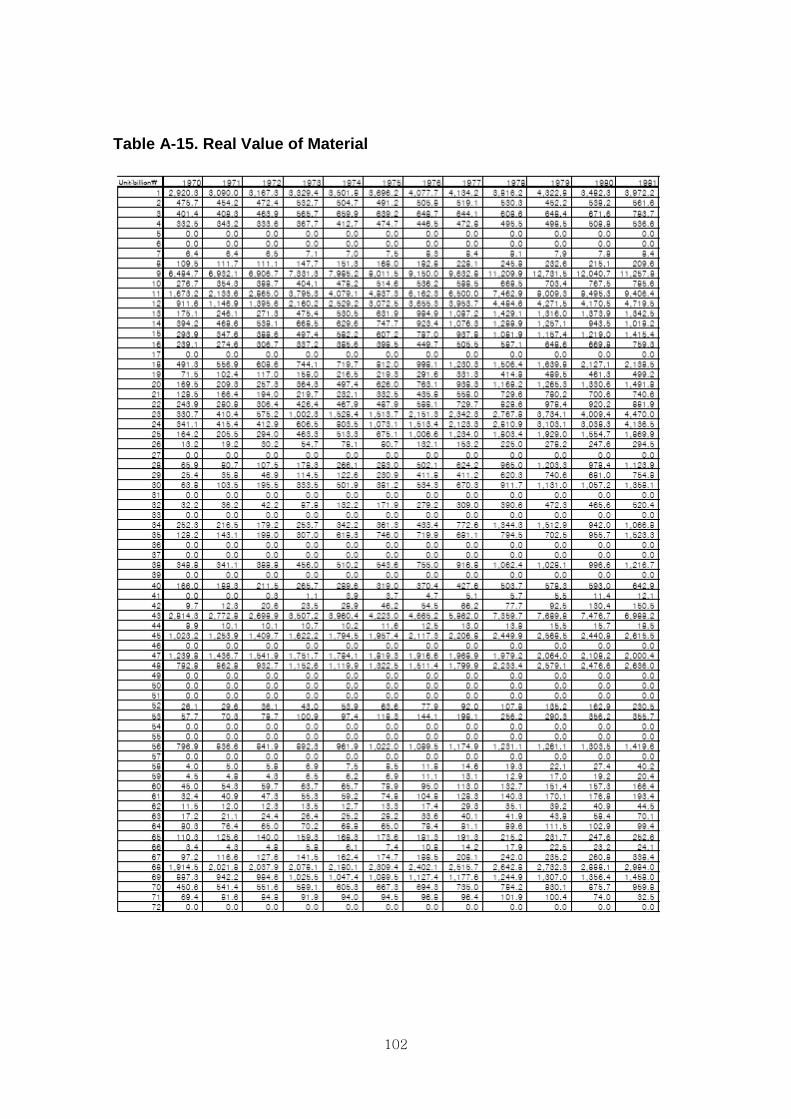
102
Table A-15. Real Value of Material

103
Table A-15. Real Value of Material(Continued)
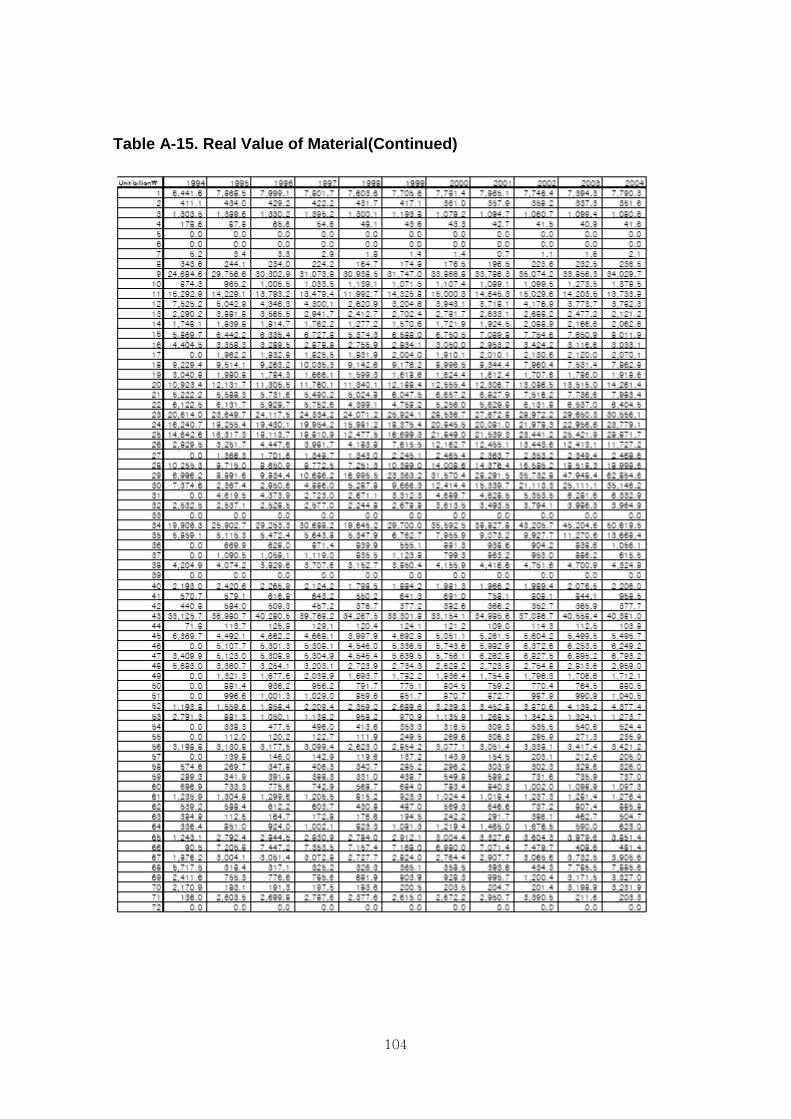
104
Table A-15. Real Value of Material(Continued)

105
Table A-16. Real Value of Service

106
Table A-16. Real Value of Service(Continued)

107
Table A-16. Real Value of Service(Continued)
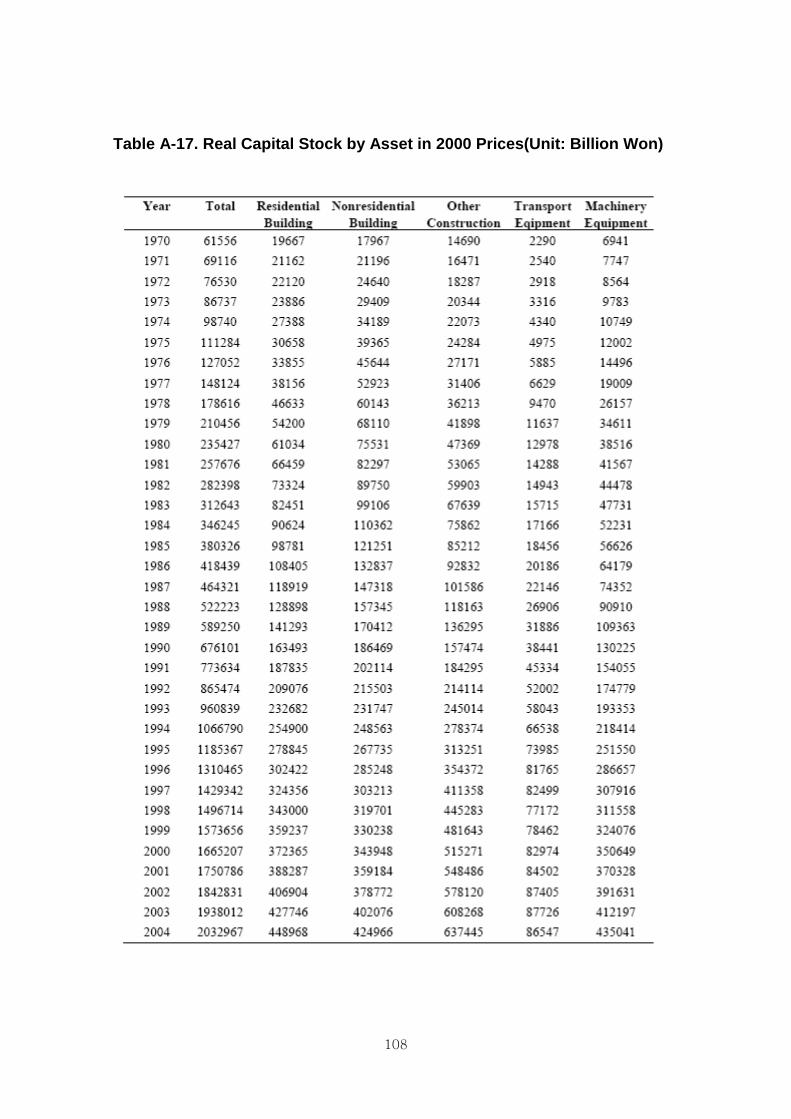
108
Table A-17. Real Capital Stock by Asset in 2000 Prices(Unit: Billion Won)

109
Table A-18. Real Capital Stock by Industry in 2000 Prices(Unit: Billion
Won)

110
Table A-18. Real Capital Stock by Industry in 2000 Prices(Unit: Billion
Won)(Continued)

111
Table A-18. Real Capital Stock by Industry in 2000 Prices(Unit: Billion
Won)(Continued)

112
Table A-19. Employed
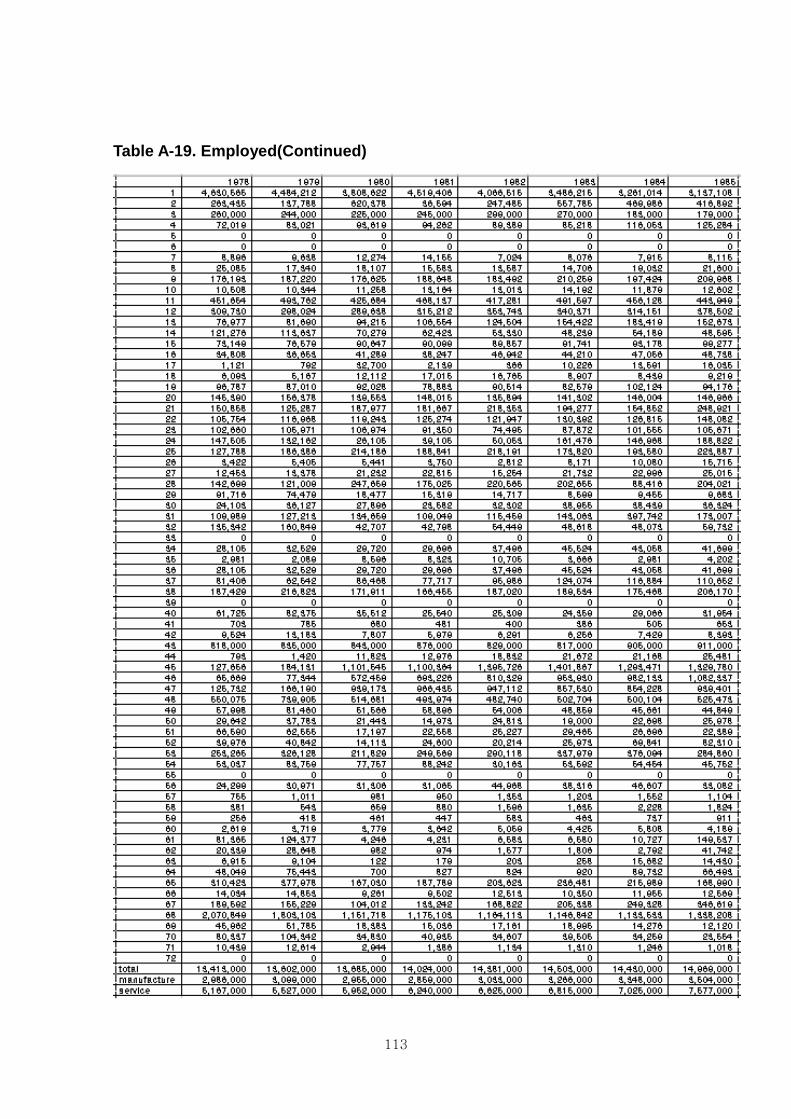
113
Table A-19. Employed(Continued)
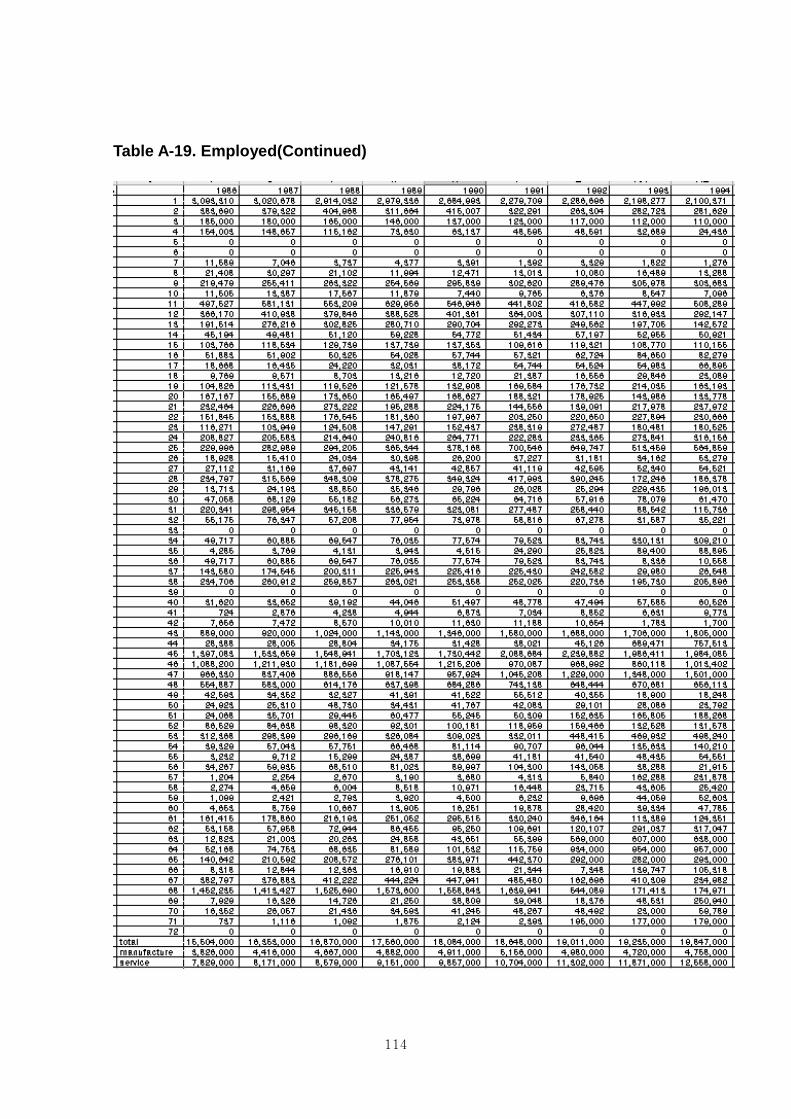
114
Table A-19. Employed(Continued)

115
Table A-19. Employed(Continued)

116
Table A-20 Aggregate Working Hour

117
Table A-20 Aggregate Working Hour(Continued)
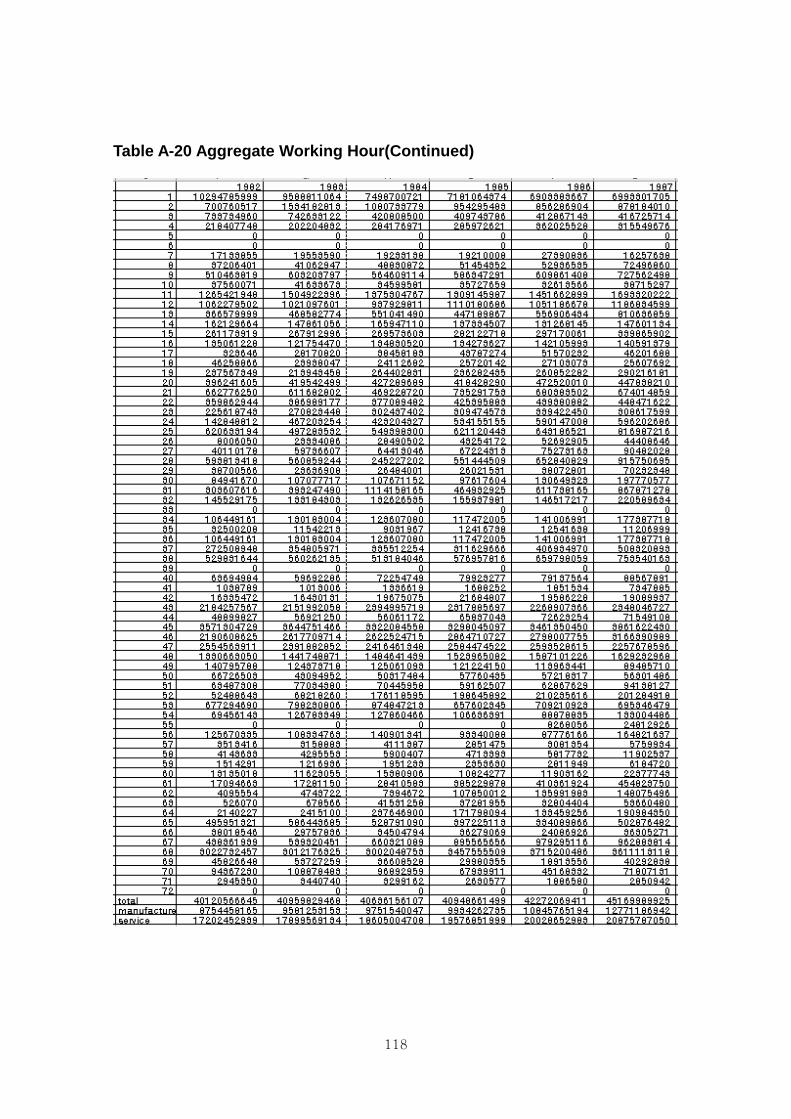
118
Table A-20 Aggregate Working Hour(Continued)
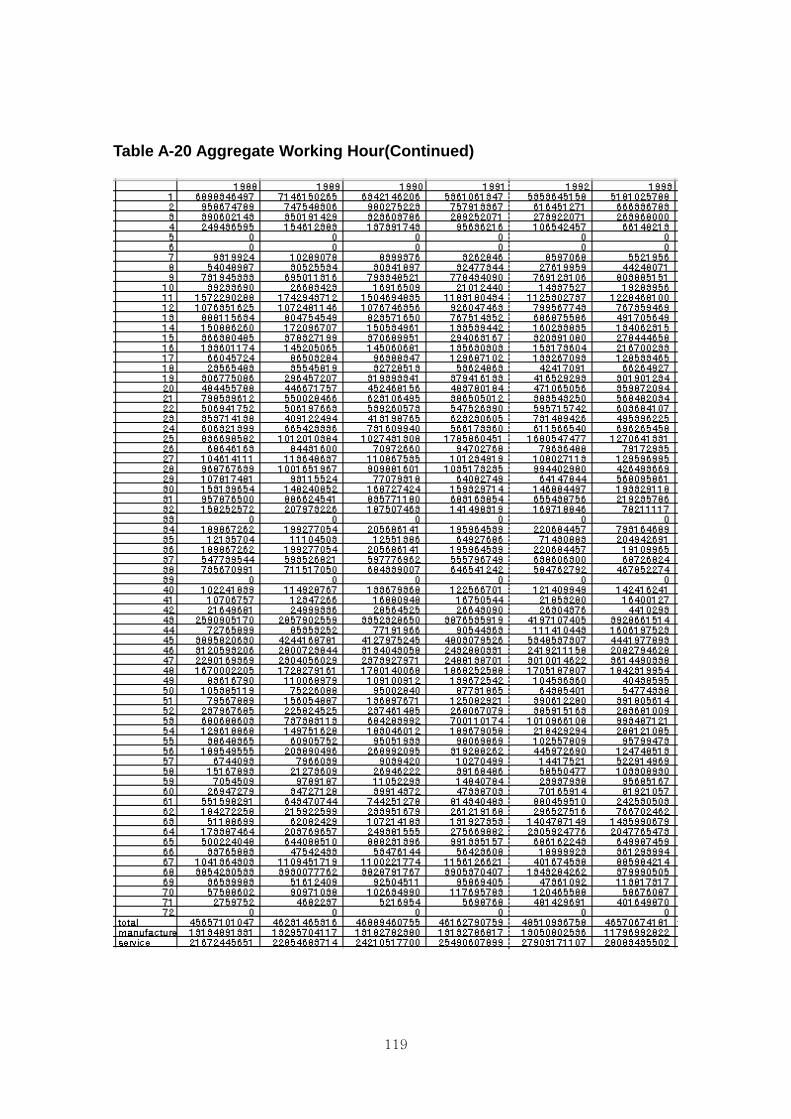
119
Table A-20 Aggregate Working Hour(Continued)
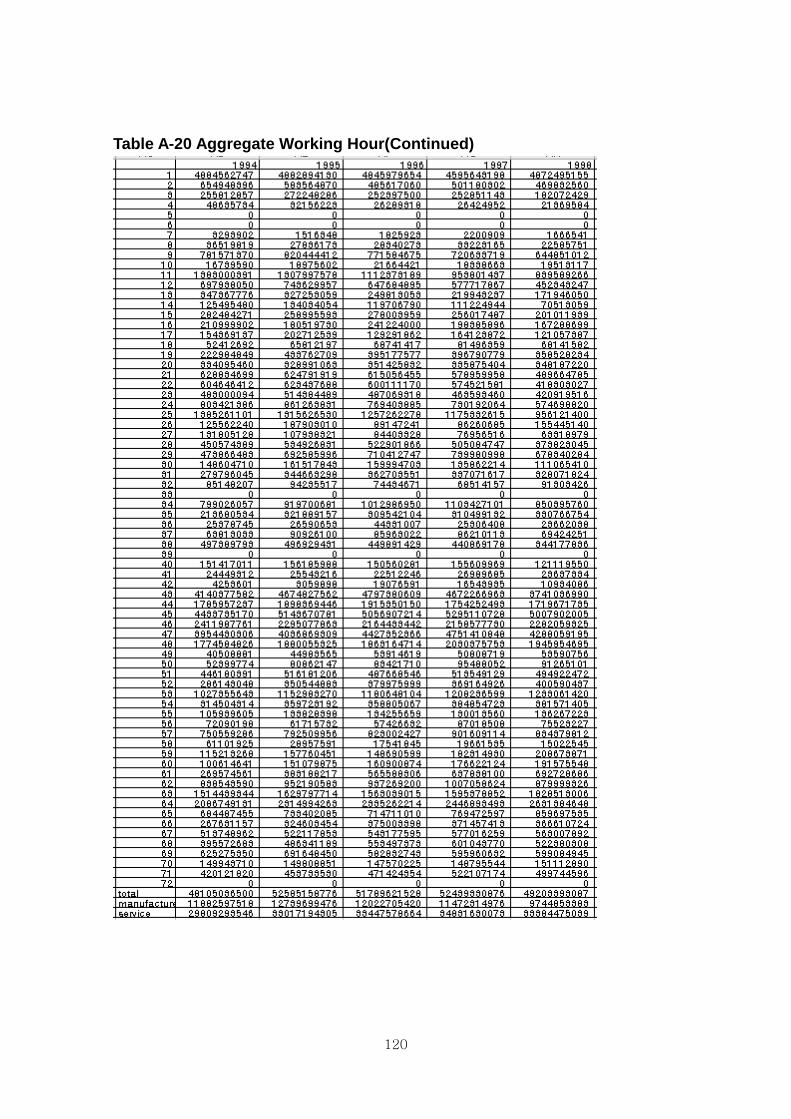
120
Table A-20 Aggregate Working Hour(Continued)

121
Table A-20 Aggregate Working Hour(Continued)
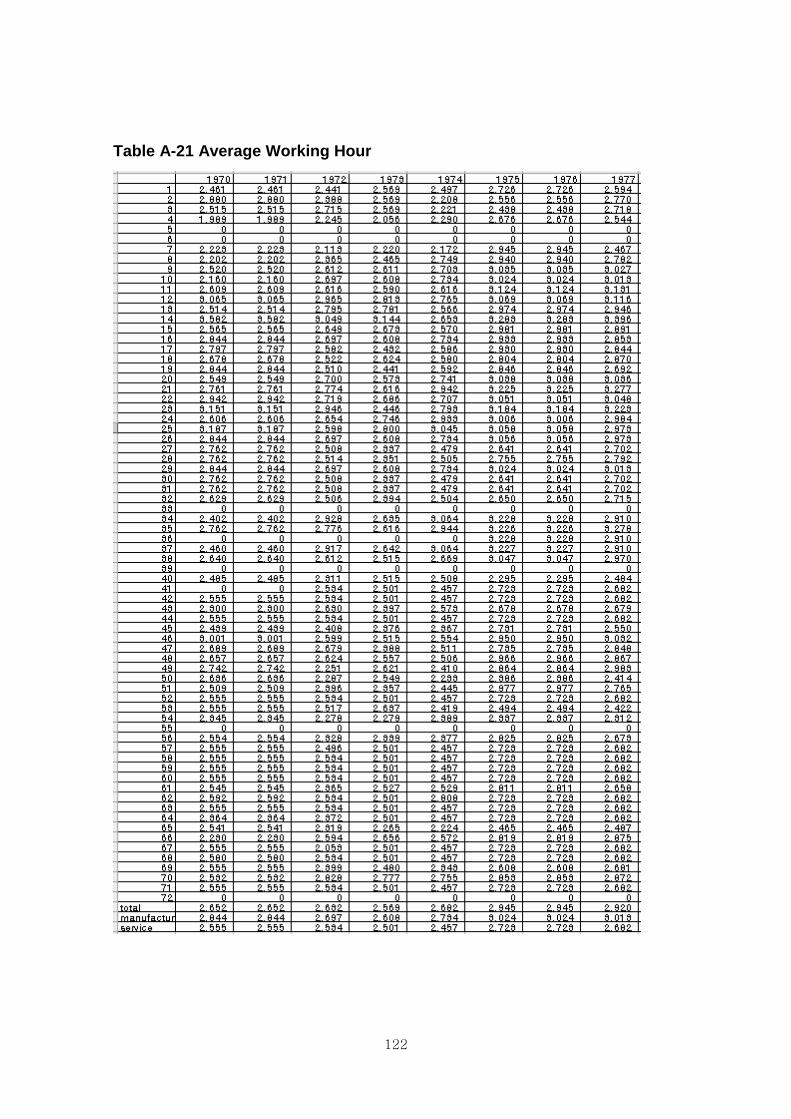
122
Table A-21 Average Working Hour

123
Table A-21 Average Working Hour(Continued)

124
Table A-21 Average Working Hour(Continued)

125
Table A-21 Average Working Hour(Continued)

126
Table A-22 Labor Quantity

127

128

129

130
Table A-23 Labor Quality

131
Table A-23 Labor Quality (Continued)

132
Table A-23 Labor Quality (Continued)

133
Table A-23 Labor Quality (Continued)

134
Table A-24. Labor Growth Rate

135
Table A-24. Labor Growth Rate(Continued)

136
Table A-24. Labor Growth Rate(Continued)
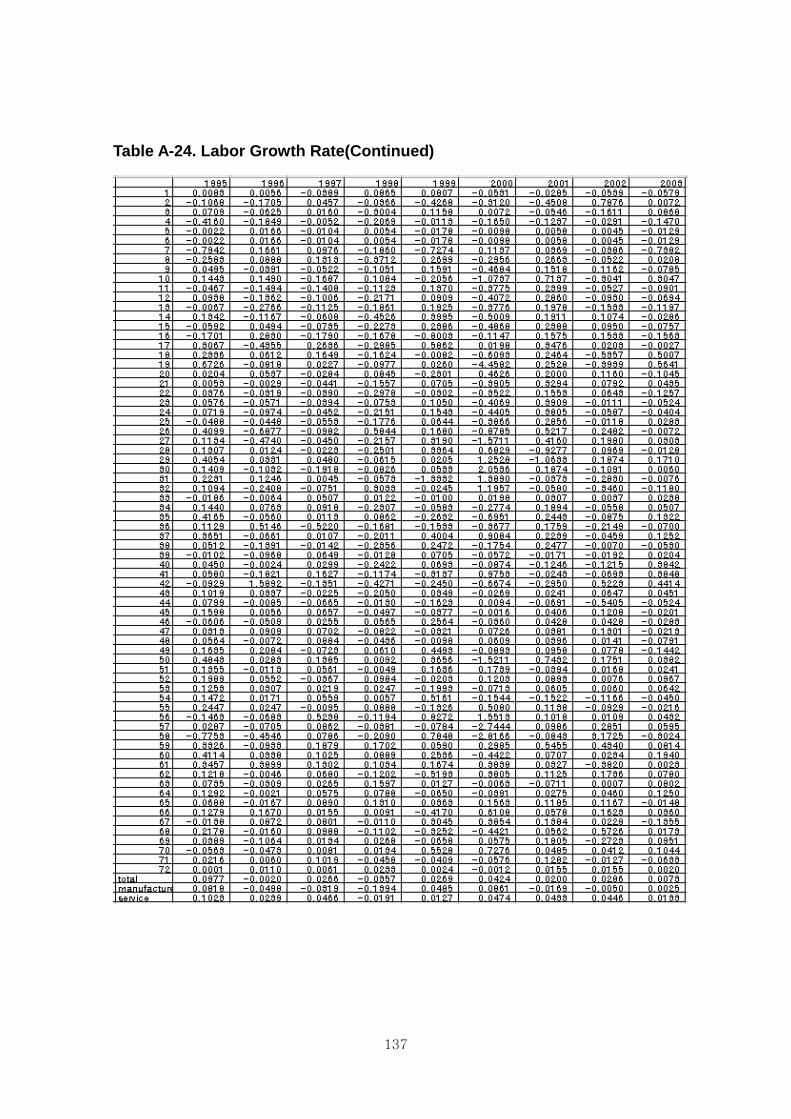
137
Table A-24. Labor Growth Rate(Continued)

138
Recommended