ERG Science Center ERG Science Center
Analysis Tools Developed bythe ERG Science Center
Y. Miyashita1, T. Hori1, Y. Tanaka2,T. Segawa1, K. Keika1, Y. Miyoshi1,
K. Seki1, M. Shoji1,N. Umemura1, I. Shinohara3,
and ERG Science Center Task Team1STEL, 2NIPR, 3ISAS
2015/06/17 Miyashita, et al., GEM Workshop in Snowmass, CO, USA

ERG Science Center Analysis Tools Developed by ERG-SC
ERG plug-in for SPEDAS Github Repository for SPEDAS Plug-In ERG Web Analysis Tool (ERGWAT) with SPEDAS Conjunction Event Finder (CEF) Visualization tool for 3-D distribution function
with SPEDAS

ERG Science Center ERG Plug-In for SPEDAS
Already implemented in SPEDAS (idl/projects/erg/) Geomag (fluxgate):
210 MM, STEL, NIPR, MAGDAS Geomag (induction): STEL SuperDARN common time OMTI All-Sky Imagers
See Hori et al. [J. Space Sci. Info. Jp., JAXA, 2015] for details.
Near Future (the next version) Akebono:
PWS (wave), RDM (high-energy electron)
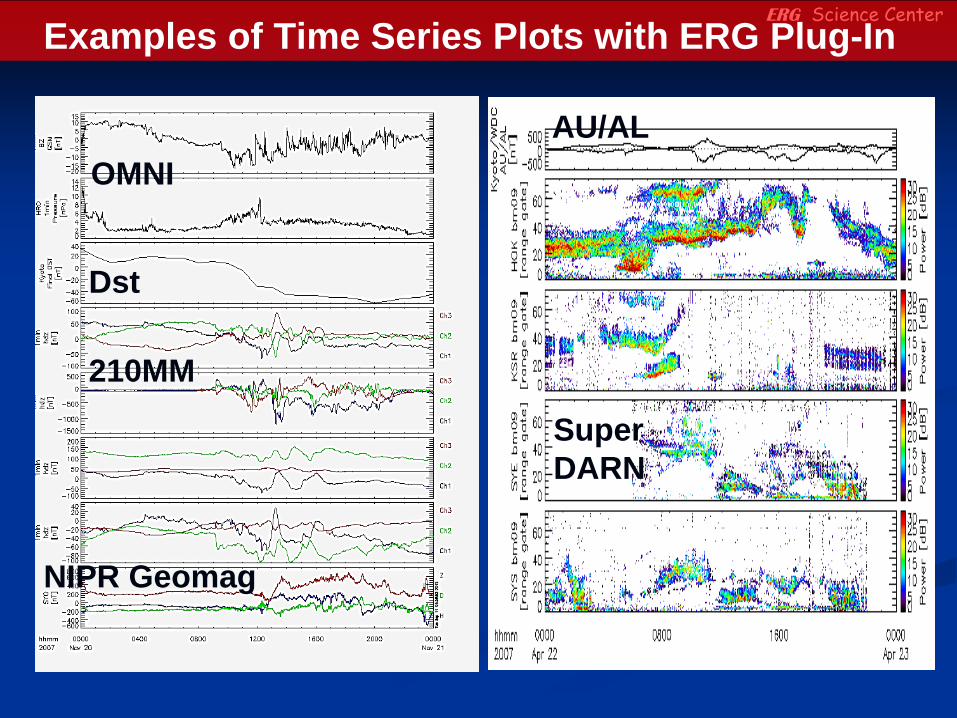
ERG Science Center Examples of Time Series Plots with ERG Plug-In
OMNI
Dst
210MM
NIPR Geomag
AU/AL
SuperDARN

ERG Science Center Examples of 2-D Plots with ERG Plug-In
SuperDARN+ Satellite footprint
SuperDARN + THEMIS ASI

ERG Science Center Github Repository for SPEDAS Plug-In
End Users
SPEDAS Source Tree
download site, bug tracking
bug report, suggestion, pull request, ...
merge into SPEDAS(automatically)
Software portal for end users Interface with the SPEDAS developing team

ERG Science Center ERG Web Analysis Tool (ERGWAT)
http://ergsc.stelab.nagoya-u.ac.jp/analysis/ergwat/ Load and plot data as well as perform simple analysis
with SPEDAS on web browsers Users do not need their own IDL licenses. Registration (or a guest account) is required.
Please contact erg-sc-help at st4a.nagoya-u.ac.jp .

ERG Science Center ERG Web Analysis Tool (ERGWAT)
Satellite data THEMIS (ESA, SST, FGM, SCM, FBK) Akebono (PWS, RDM) GOES (MAG) ACE (MFI, SWE), OMNI
Ground data Geomag (fluxgate):
THEMIS, 210 MM, STEL, MAGDAS, NIPR Geomag (induction): STEL SuperDARN LFRTO, EISCAT (by IUGONET)
We will add more data.(other ground-based data, VAPs, ERG, etc.).

ERG Science Center Example of Time Series Plot with ERGWAT

ERG Science Center Example of 2-D Plot with ERGWAT
SuperDARN data on 2-D map It will be possible to superpose satellite (ERG) footprints.

ERG Science Center Conjunction Event Finder (CEF) for s/c-ground collaboration
Plots of satellite footprints (including MMS and ERG)along with FOVs of all-skycameras and radarson web browser.
Browse one after anothersimply by clicking.
Useful for findingconjunction eventsand planning futurecollaborations betweenSC (ERG, etc.) and GBOs.
Made with SPEDASand ERG plug-in.
http://ergsc.stelab.nagoya-u.ac.jp/cef/orbit.cgi OR

ERG Science Center Conjunction Event Finder (CEF) for s/c-ground collaboration
ERG
MMS
THEMIS
ERG
THEMIS
MMS
Geotail
Geotail
MMSCluster
THEMISVAPs

ERG Science Center Conjunction Event Finder (CEF): Links to QL Plots
http://ergsc.stelab.nagoya-u.ac.jp/cef/cef.cgi
Links to QL plots for various kinds of satellite and ground-based observations for a selected period.
See Miyashita et al. [EPS, 2011]for details.

ERG Science Center Visualization Tool for 3-D Distribution Function
Based on SPEDAS. Visualization routines have been nearly completed:
“Scatter”, “Volume”, “Isosurface”, and “Slice”. We will make load routines for Geotail, THEMIS,
Van Allen Probes, MMS, ERG, etc.in collaboration with these projects.
Scatter Volume
Isosurface Slice
Spectrogram

ERG Science Center Summary
ERG plug-in for SPEDAS Github Repository for SPEDAS Plug-In ERG Web Analysis Tool (ERGWAT) Conjunction Event Finder (CEF) Visualization tool for 3-D distribution function
with SPEDAS
Comments, feedbacks, and your participations are most welcome!
E-mail: erg-sc-help at st4a.nagoya-u.ac.jpERG-SC website: http://ergsc.stelab.nagoya-u.ac.jp/
Recommended