Envision Your Envision Your FutureFuture
Focus on SuccessFocus on Success
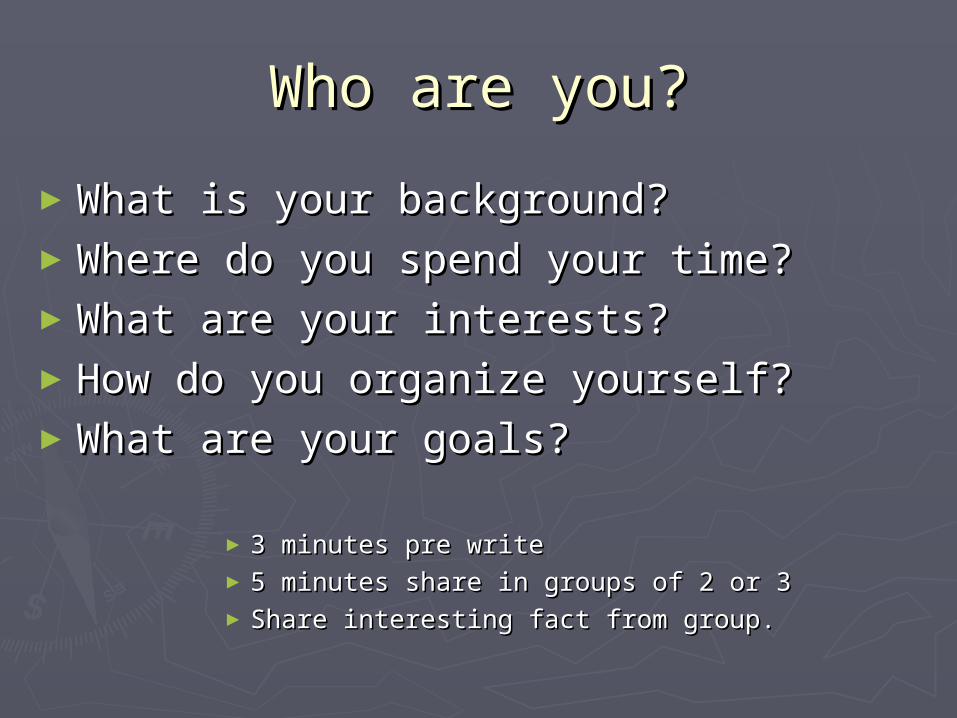
Who are you?Who are you?
►What is your background?What is your background?►Where do you spend your time?Where do you spend your time?►What are your interests?What are your interests?►How do you organize yourself?How do you organize yourself?►What are your goals?What are your goals?
► 3 minutes pre write3 minutes pre write► 5 minutes share in groups of 2 or 35 minutes share in groups of 2 or 3► Share interesting fact from group.Share interesting fact from group.

The StudentThe Student
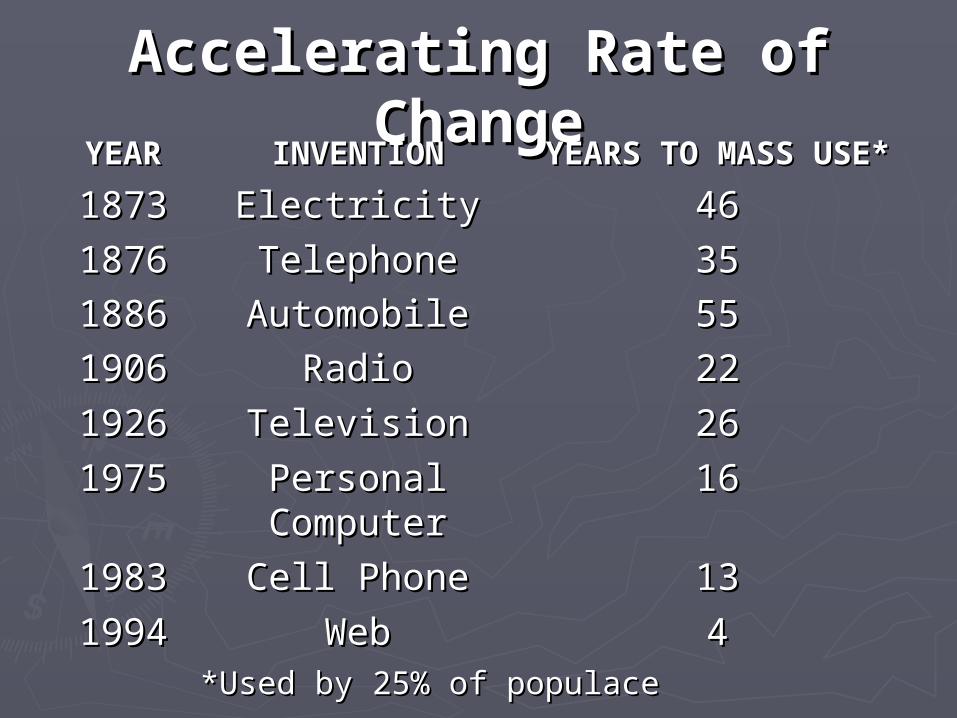
Accelerating Rate of Accelerating Rate of ChangeChange
YEARYEAR INVENTIONINVENTION YEARS TO MASS YEARS TO MASS USE*USE*
18731873 ElectricityElectricity 4646
18761876
18861886TelephoneTelephone
AutomobileAutomobile3535
5555
19061906 RadioRadio 2222
19261926 TelevisionTelevision 2626
19751975 Personal Personal ComputerComputer
1616
19831983 Cell PhoneCell Phone 1313
19941994 WebWeb 44*Used by 25% of populace*Used by 25% of populace

OLD AND NEW COMPUTERSOLD AND NEW COMPUTERS
►
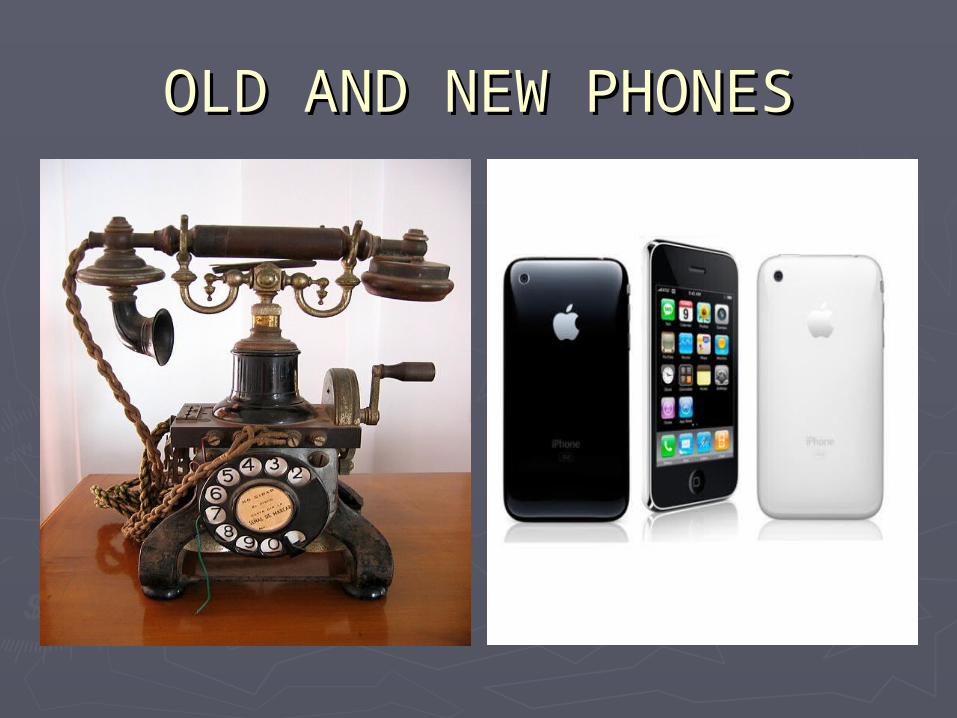
OLD AND NEW PHONESOLD AND NEW PHONES

Social Media and it’s Influence on Society
►http://www.youtube.com/watch?v=lFZ0z5Fm-Ng

WHAT DO YOU THINK??WHAT DO YOU THINK??
►GIVE ME AN IMAGE: GIVE ME AN IMAGE: WHAT WILL THE WHAT WILL THE NEXT COMPUTER OR PHONE LOOK NEXT COMPUTER OR PHONE LOOK LIKE 10 OR 20 YEARS FROM NOW? LIKE 10 OR 20 YEARS FROM NOW?
►RESEARCH:RESEARCH: HOW LONG BEFORE THE HOW LONG BEFORE THE IPOD WAS FOR MASS USE? WHAT IPOD WAS FOR MASS USE? WHAT ABOUT THE IPHONE? CAN YOU THINK ABOUT THE IPHONE? CAN YOU THINK OF ANY OTHER NEW TECHNOLOGY OF ANY OTHER NEW TECHNOLOGY THAT HAS GONE TO MASS USE?THAT HAS GONE TO MASS USE?

Focus on SuccessFocus on Success
How many occupations can the average high school senior name?

Can you believe this?Can you believe this?
80 % of the jobs80 % of the jobs
that today’sthat today’s
kindergartenerskindergarteners
will do, don’twill do, don’t
exist today.exist today.

WHAT JOBS DO YOU WHAT JOBS DO YOU THINK THERE WILL BE IN THINK THERE WILL BE IN
THE FUTURE?THE FUTURE?

Never stop learningNever stop learning

Focus on SuccessFocus on Success
What are What are your…?your…?
InterestsInterestsTalentsTalentsPersonal TraitsPersonal TraitsLifestyleLifestyle

Focus on SuccessFocus on Success
Educational QualificationsEducational QualificationsValuesValuesEmployment OutlookEmployment Outlook

Did you know?Did you know?
►

F R E E W R I T EF R E E W R I T E
►How do you think that having a dream How do you think that having a dream allows you to focus on success? allows you to focus on success? In order to gain employment?In order to gain employment? A college education?A college education?
►What are some of the things you can What are some of the things you can start doing today to be that “on start doing today to be that “on Purpose Person” to obtain that Purpose Person” to obtain that successful future you desire.successful future you desire.
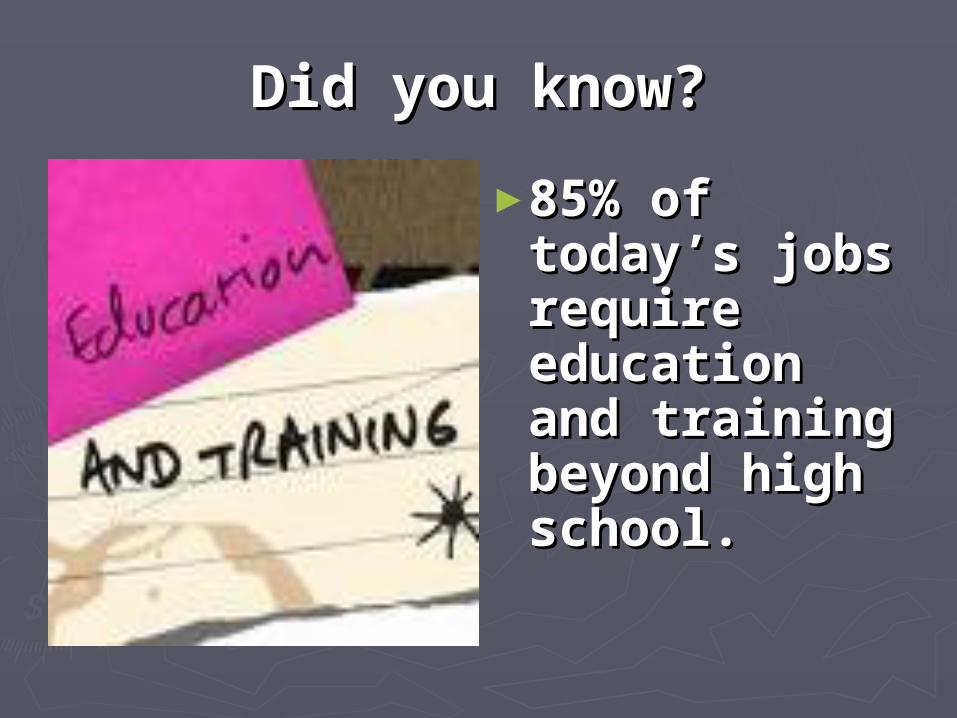
Did you know?Did you know?
►85% of 85% of today’s jobs today’s jobs require require education education and training and training beyond beyond high school.high school.
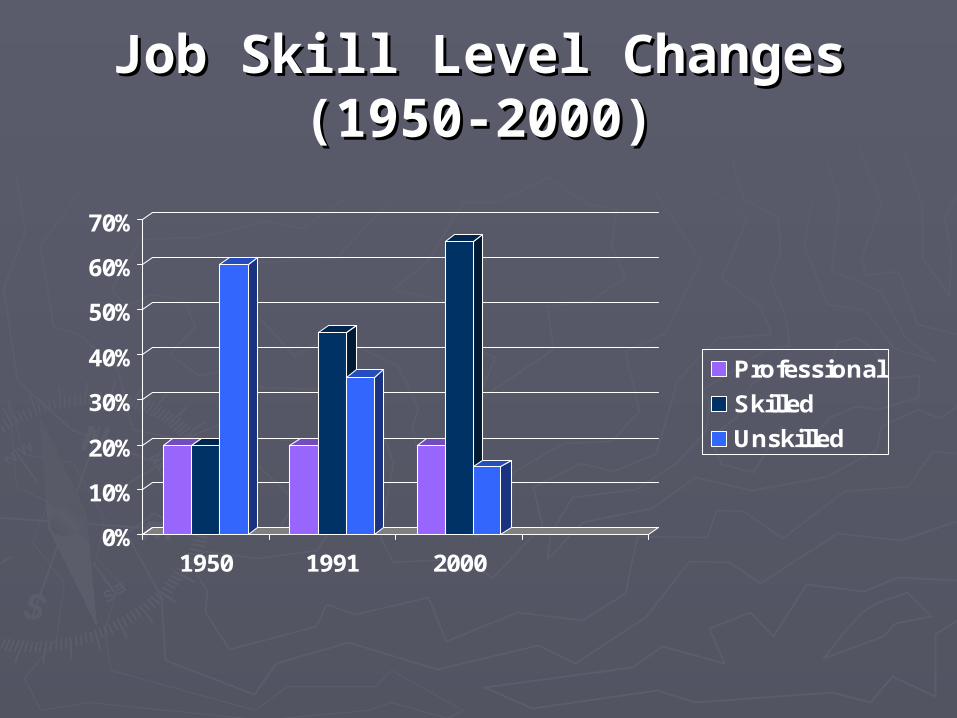
Job Skill Level ChangesJob Skill Level Changes(1950-2000)(1950-2000)
0%
10%
20%
30%
40%
50%
60%
70%
1950 1991 2000
Professional
Skilled
Unskilled

CONVERSATIONCONVERSATION
►WHAT FACT STOOD OUT THE MOST WHAT FACT STOOD OUT THE MOST FOR YOUFOR YOU
►CONSIDER WHAT MIGHT THESE CONSIDER WHAT MIGHT THESE STATISTICS MEAN FOR YOU AND STATISTICS MEAN FOR YOU AND YOUR FUTURE AND DREAMS YOUR FUTURE AND DREAMS


Focus on SuccessFocus on Success
►65-85% of 65-85% of college students college students change majors.change majors.
►The average The average college student college student will change their will change their major an average major an average of 3 times.of 3 times.

Focus on SuccessFocus on Success
►Plan an appropriate, affordable Plan an appropriate, affordable post-secondary educational route.post-secondary educational route. 60% of students take extra time to
complete a degree 40% drop out

WHY COLLEGE STUDENTS DROP WHY COLLEGE STUDENTS DROP
OUT . . OUT . . .. Poor career planning and goal settingPoor career planning and goal setting Financial constraintsFinancial constraints Academic difficulty (37% had GPA’s Academic difficulty (37% had GPA’s aboveabove
2.5)/ -2.5)/ -educational burnouteducational burnout Social motivation/Social motivation/too much funtoo much fun Receptivity to helpReceptivity to help General coping/General coping/homesickhomesick Picking the wrong majorPicking the wrong major Personal-family issues/external demandsPersonal-family issues/external demands

Goals (what sticks out)
Goals
► Name some reasons why you should set goals.
► What is the payoff for setting goals?
► What are some reasons people don’t set goals?
► What percentage of people don’t set goals for
themselves?

AnswerAnswer
►Less than 3 percent of Americans have written goals, and less than 1 percent review and rewrite their goals on a daily basis

F R E E W R I T EF R E E W R I T E►PERSONAL GOALPERSONAL GOAL
AND WHY THIS GOALAND WHY THIS GOAL (EG: GET MORE SLEEP)(EG: GET MORE SLEEP)
►ACADEMIC GOALACADEMIC GOAL AND WHY THIS GOALAND WHY THIS GOAL
(EG: USE AN ACADEMIC PLANNER)(EG: USE AN ACADEMIC PLANNER)
►POSSIBLE CAREER GOALPOSSIBLE CAREER GOAL AND WHY THIS GOALAND WHY THIS GOAL
(EG: HOPE TO WORK WITH AND TEACH (EG: HOPE TO WORK WITH AND TEACH STUDENTS)STUDENTS)
EMAIL: EMAIL: [email protected]
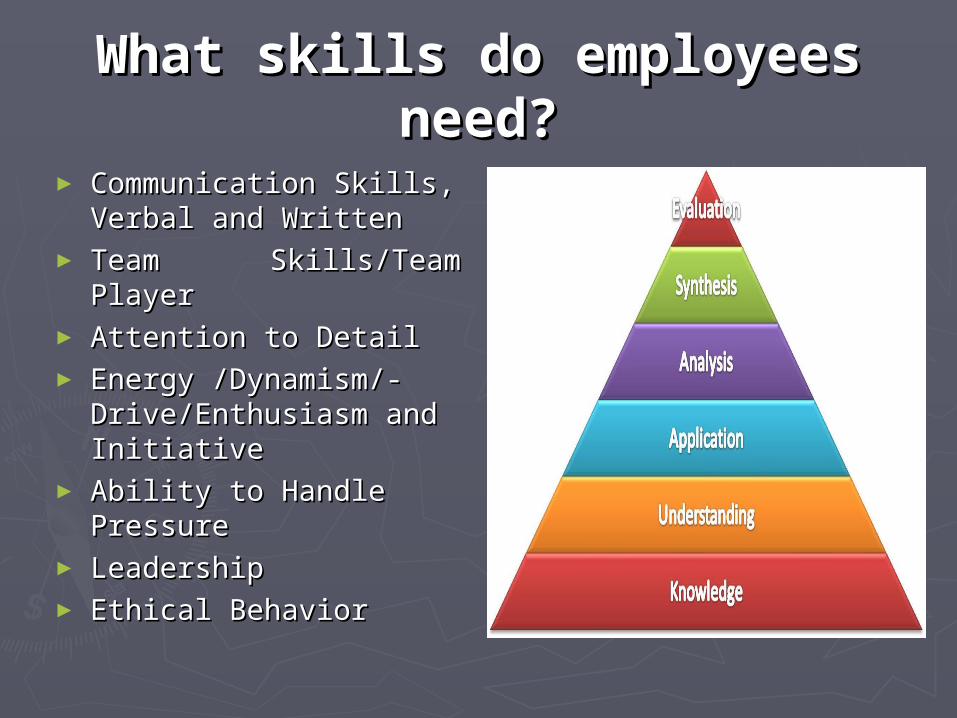
What skills do employees What skills do employees need?need?
► Communication Skills, Communication Skills, Verbal and Written Verbal and Written
► Team Skills/Team Player Team Skills/Team Player ► Attention to Detail Attention to Detail ► Energy /Dynamism/-Energy /Dynamism/-
Drive/Enthusiasm and Drive/Enthusiasm and InitiativeInitiative
► Ability to Handle Ability to Handle Pressure Pressure
► LeadershipLeadership► Ethical BehaviorEthical Behavior
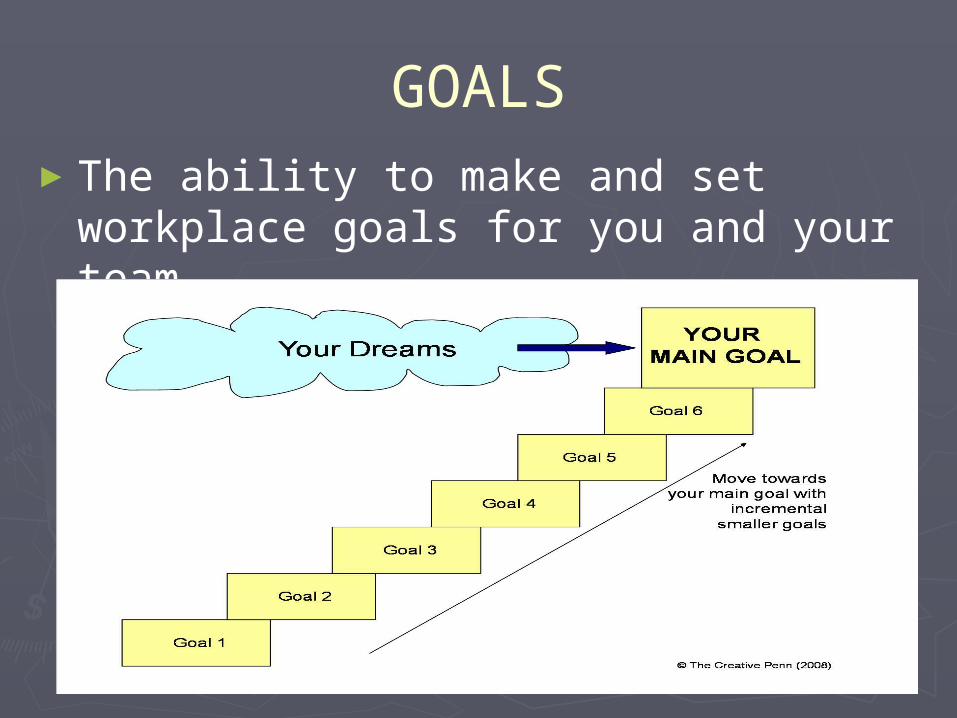
GOALS►The ability to make and set workplace
goals for you and your team.

Maslow’s Hierarchy of Maslow’s Hierarchy of NeedsNeeds

Maine at a Glance (2008 Maine at a Glance (2008 Demographic Information)Demographic Information)
► Population: Population: 1
,318,109
► Labor Force:Labor Force:7
12,000
► Unemployment Rate: Unemployment Rate: 8
.0%
► Median Household IncomeMedian Household Income$
46,419
► Per Capita IncomePer Capita Income$
36,500
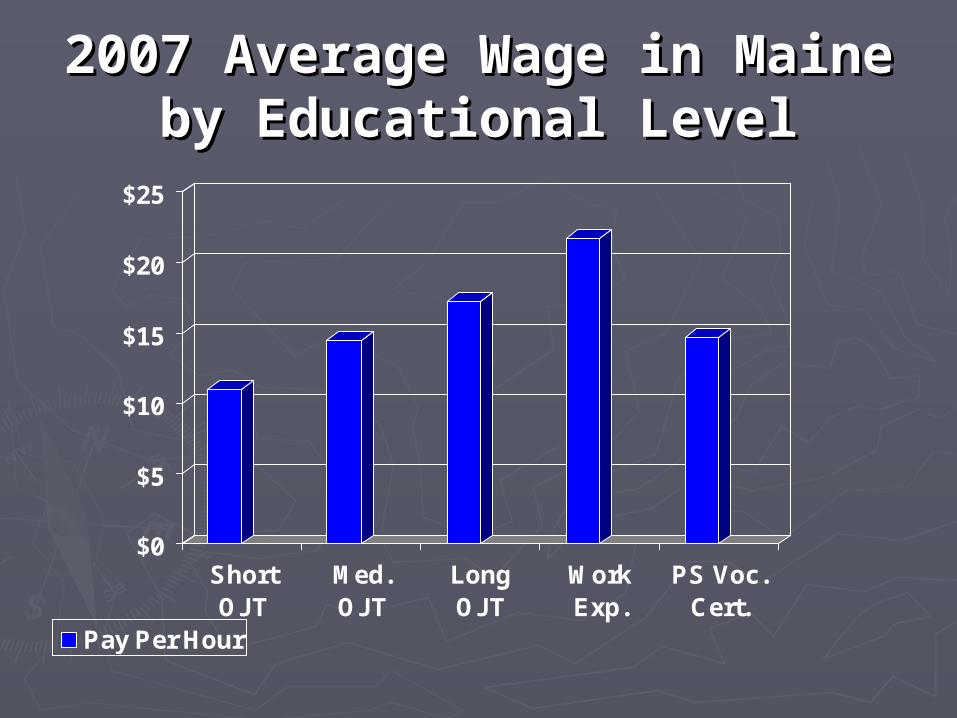
2007 Average Wage in 2007 Average Wage in MaineMaine
by Educational Levelby Educational Level
$0
$5
$10
$15
$20
$25
ShortOJT
Med.OJT
LongOJT
WorkExp.
PS Voc.Cert.
Pay Per Hour
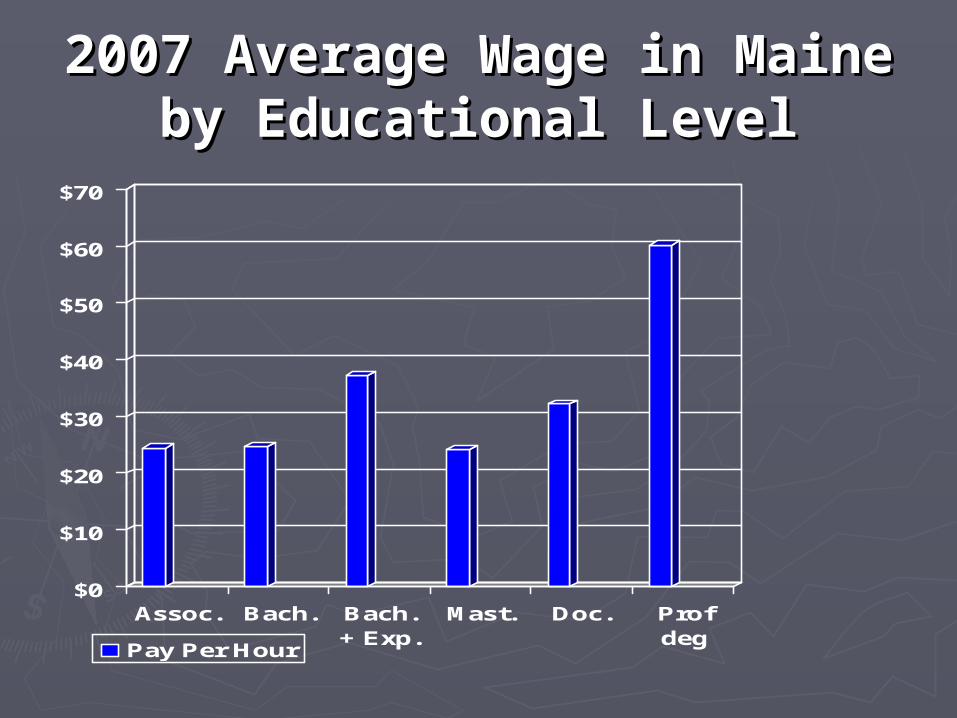
2007 Average Wage in 2007 Average Wage in MaineMaine
by Educational Levelby Educational Level
$0
$10
$20
$30
$40
$50
$60
$70
Assoc. Bach. Bach.+ Exp.
Mast. Doc. Profdeg
Pay Per Hour

Job growth can be viewed in two Job growth can be viewed in two ways:ways:
Percent change Numerical change
Massage TherapistsRegistered Nurses
47.9%
26.7%
193
3,469

Fastest Growing In MaineFastest Growing In Maine OccupationOccupation
EmploymenEmploymentt
20062006
EmploymenEmploymentt
20162016
PercentagPercentage Growthe Growth
1. Network Systems Analysts 800 1,170 47%
2. Gaming/Sports Writers 90 130 47%
3. Instructional Coordinators 360 500 38%
4. Substance/behavior Counselors 660 900 37%
5. Medical assistants 1,950 2,600 34%
6. Pharmacy technicians 1,560 2,070 33%
7. Physical therapist assistants 200 260 33%
8. Computer software engineers 1,050 1,360 30%
9. Medical equipment repairers 110 140 30%
10. Adult/ GED instructors 200 260 28%
11. Personal/home care aids 6,190 7,930 28%
12. Veterinary technologists 530 670 28%
13. Interpreters/translators 310 390 27%
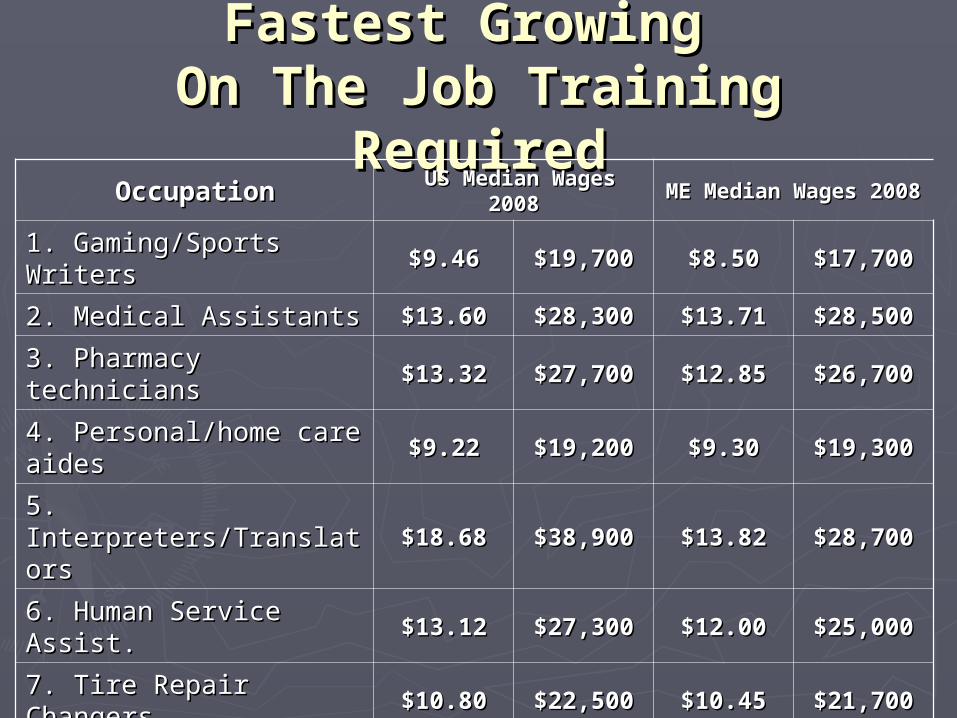
Fastest Growing Fastest Growing On The Job Training On The Job Training
RequiredRequiredOccupationOccupation US Median Wages US Median Wages
20082008ME Median Wages ME Median Wages
20082008
1. Gaming/Sports Writers1. Gaming/Sports Writers $9.46$9.46 $19,700$19,700 $8.50$8.50 $17,700$17,700
2. Medical Assistants2. Medical Assistants $13.60$13.60 $28,300$28,300 $13.71$13.71 $28,500$28,500
3. Pharmacy technicians3. Pharmacy technicians $13.32$13.32 $27,700$27,700 $12.85$12.85 $26,700$26,700
4. Personal/home care 4. Personal/home care aidesaides
$9.22$9.22 $19,200$19,200 $9.30$9.30 $19,300$19,300
5. 5. Interpreters/TranslatorsInterpreters/Translators
$18.68$18.68 $38,900$38,900 $13.82$13.82 $28,700$28,700
6. Human Service Assist.6. Human Service Assist. $13.12$13.12 $27,300$27,300 $12.00$12.00 $25,000$25,000
7. Tire Repair Changers7. Tire Repair Changers $10.80$10.80 $22,500$22,500 $10.45$10.45 $21,700$21,700
8. Physical Therapist 8. Physical Therapist AidesAides
$11.42$11.42 $23,800$23,800 $11.62$11.62 $24,200$24,200
9. Number Control 9. Number Control Program.Program.
$21.30$21.30 $44,300$44,300 -- --
10. Dental Assistants10. Dental Assistants $15.57$15.57 $32,400$32,400 $15.75$15.75 $32,800$32,800
11. Home Health Aides11. Home Health Aides $9.84$9.84 $20,500$20,500 $10.67$10.67 $22,200$22,200
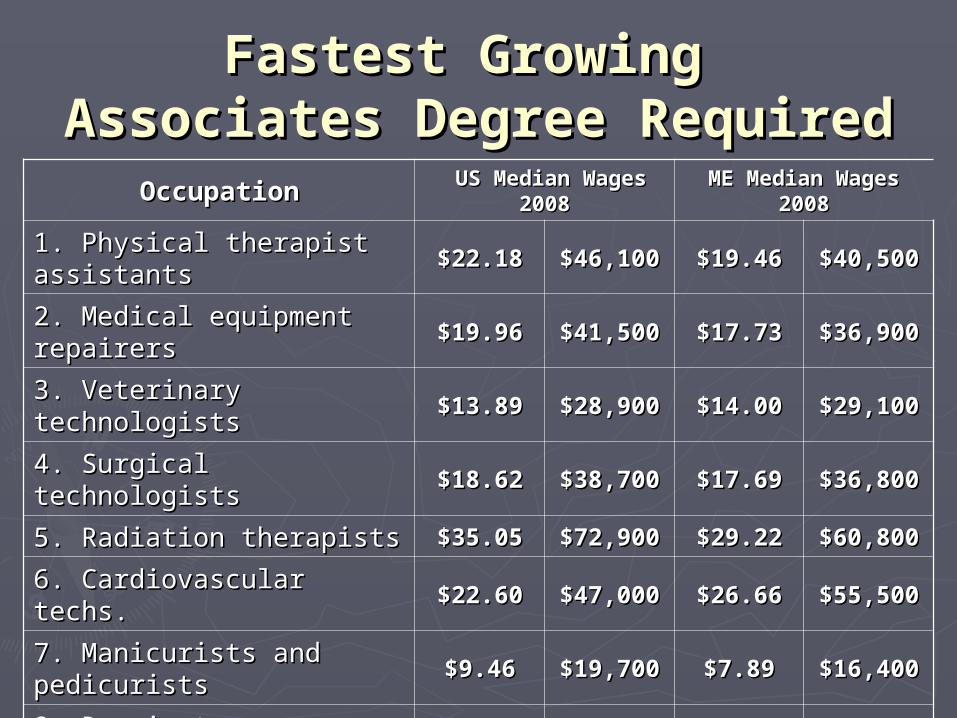
Fastest Growing Fastest Growing Associates Degree RequiredAssociates Degree Required
OccupationOccupation US Median Wages US Median Wages 20082008
ME Median Wages ME Median Wages 20082008
1. Physical therapist 1. Physical therapist assistantsassistants
$22.18$22.18 $46,100$46,100 $19.46$19.46 $40,500$40,500
2. Medical equipment 2. Medical equipment repairersrepairers
$19.96$19.96 $41,500$41,500 $17.73$17.73 $36,900$36,900
3. Veterinary technologists3. Veterinary technologists $13.89$13.89 $28,900$28,900 $14.00$14.00 $29,100$29,100
4. Surgical technologists4. Surgical technologists $18.62$18.62 $38,700$38,700 $17.69$17.69 $36,800$36,800
5. Radiation therapists 5. Radiation therapists $35.05$35.05 $72,900$72,900 $29.22$29.22 $60,800$60,800
6. Cardiovascular techs.6. Cardiovascular techs. $22.60$22.60 $47,000$47,000 $26.66$26.66 $55,500$55,500
7. Manicurists and 7. Manicurists and pedicuristspedicurists
$9.46$9.46 $19,700$19,700 $7.89$7.89 $16,400$16,400
8. Respiratory therapists8. Respiratory therapists $25.10$25.10 $52,200$52,200 $24.78$24.78 $51,500$51,500
9. Registered nurses9. Registered nurses $30.03$30.03 $62,500$62,500 $28.10$28.10 $58,400$58,400
10. Emergency paramedics10. Emergency paramedics $14.10$14.10 $29,300$29,300 $13.13$13.13 $27,300$27,300
11. Dental Hygienists11. Dental Hygienists $32.00$32.00 $66,600$66,600 $29.22$29.22 $60,800$60,800
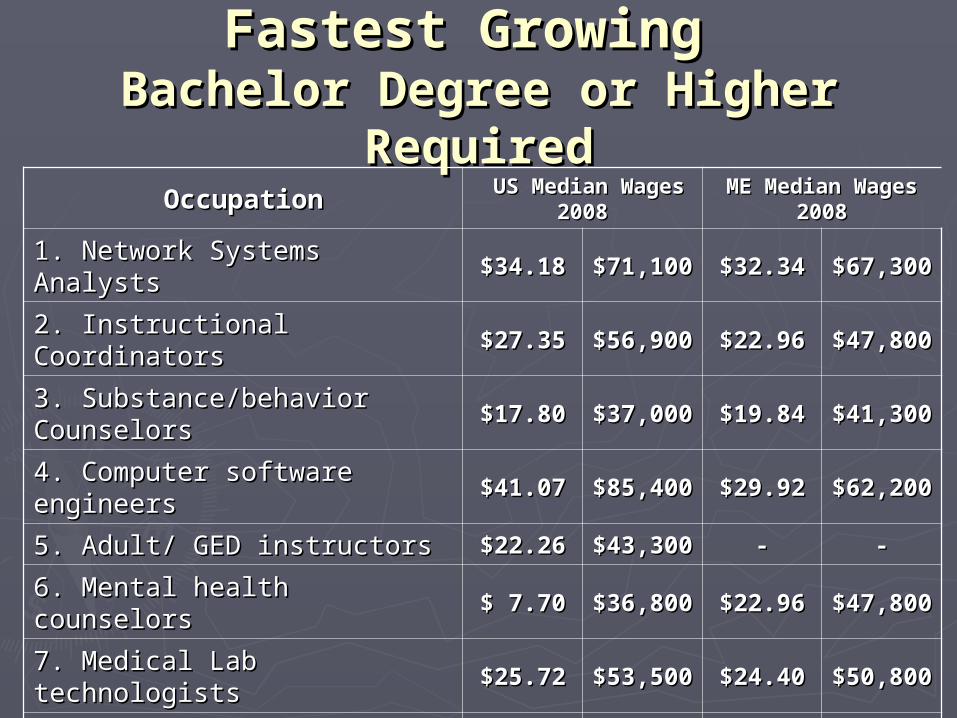
Fastest Growing Fastest Growing Bachelor Degree or Higher Bachelor Degree or Higher
RequiredRequiredOccupationOccupation US Median US Median
Wages 2008Wages 2008ME Median Wages ME Median Wages
20082008
1. Network Systems Analysts1. Network Systems Analysts $34.18$34.18 $71,10$71,1000
$32.34$32.34 $67,30$67,3000
2. Instructional Coordinators2. Instructional Coordinators $27.35$27.35 $56,90$56,9000
$22.96$22.96 $47,80$47,8000
3. Substance/behavior 3. Substance/behavior CounselorsCounselors
$17.80$17.80 $37,00$37,0000
$19.84$19.84 $41,30$41,3000
4. Computer software 4. Computer software engineersengineers
$41.07$41.07 $85,40$85,4000
$29.92$29.92 $62,20$62,2000
5. Adult/ GED instructors5. Adult/ GED instructors $22.26$22.26 $43,30$43,3000
-- --
6. Mental health counselors6. Mental health counselors $ 7.70$ 7.70 $36,80$36,8000
$22.96$22.96 $47,80$47,8000
7. Medical Lab technologists 7. Medical Lab technologists $25.72$25.72 $53,50$53,5000
$24.40$24.40 $50,80$50,8000
8. Veterinarians8. Veterinarians $38.01$38.01 $79,10$79,1000
$36.84$36.84 $76,60$76,6000
9. Health Educators9. Health Educators $21.16$21.16 $44,00$44,0000
$17.79$17.79 $37,00$37,0000
10. Physical Therapists 10. Physical Therapists $35.00$35.00 $72,80$72,8000
$30.24$30.24 $62,90$62,9000
11. Marriage & Family 11. Marriage & Family TherapistsTherapists
$21.44$21.44 $44,60$44,6000
$20.96$20.96 $43,60$43,6000
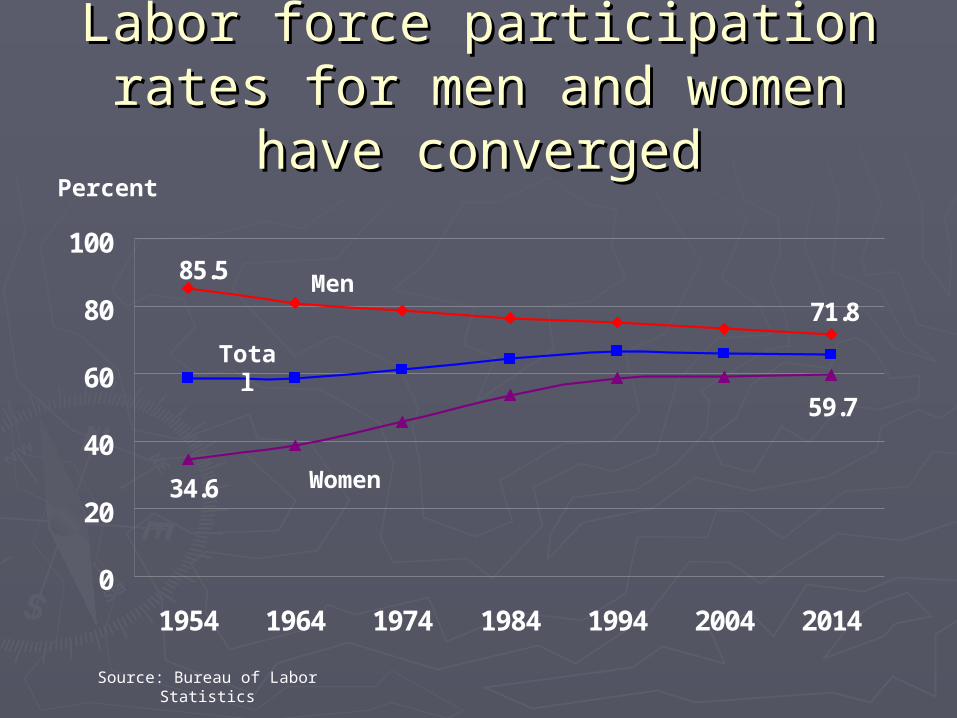
Labor force participation rates Labor force participation rates for men and women have for men and women have
convergedconverged
Source: Bureau of Labor Statistics
Percent
71.8
85.5
59.7
34.6
0
20
40
60
80
100
1954 1964 1974 1984 1994 2004 2014
Total
Men
Women
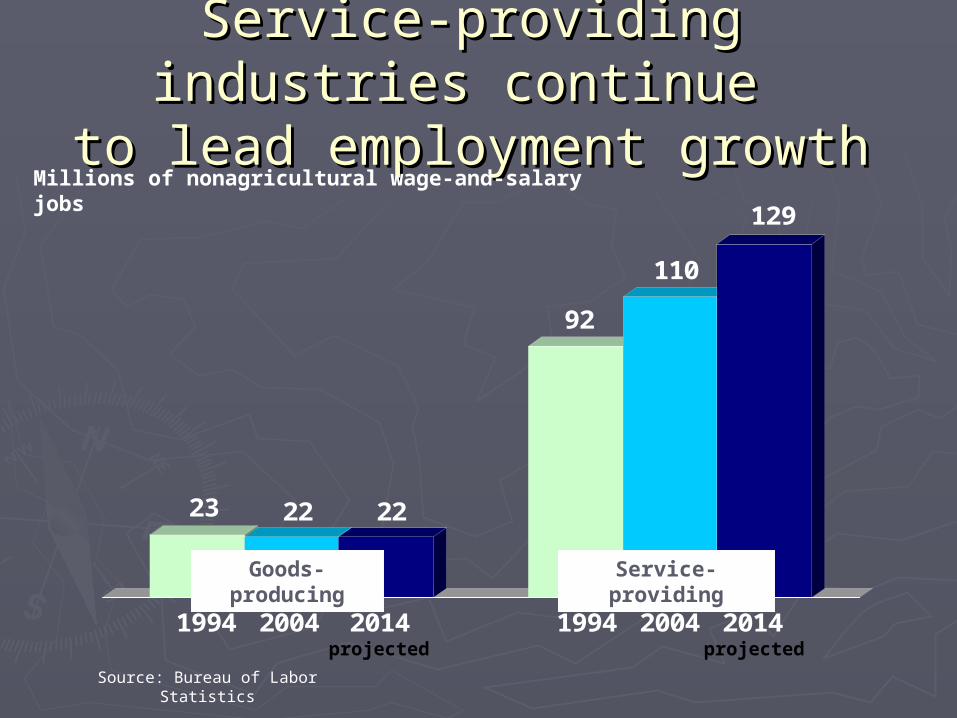
Service-providing industries Service-providing industries continue continue
to lead employment growthto lead employment growth
Source: Bureau of Labor Statistics
Millions of nonagricultural wage-and-salary jobs
23 22 22
92
110
129
1994 2004 2014 1994 2004 2014
Goods-producing
Service-providing
projected projected
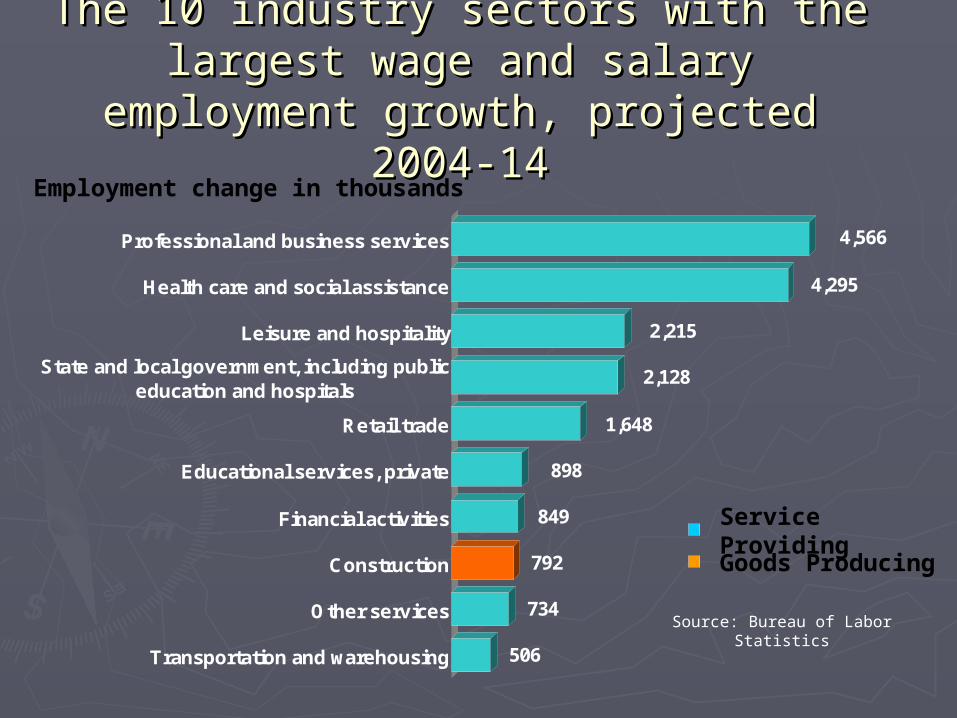
506
734
792
849
898
1,648
2,128
2,215
4,295
4,566
Transportation and warehousing
Other services
Construction
Financial activities
Educational services, private
Retail trade
State and local government, including publiceducation and hospitals
Leisure and hospitality
Health care and social assistance
Professional and business services
The 10 industry sectors with the The 10 industry sectors with the largest wage and salary employment largest wage and salary employment
growth, projected 2004-14growth, projected 2004-14Employment change in thousands
Service ProvidingGoods Producing
Source: Bureau of Labor Statistics
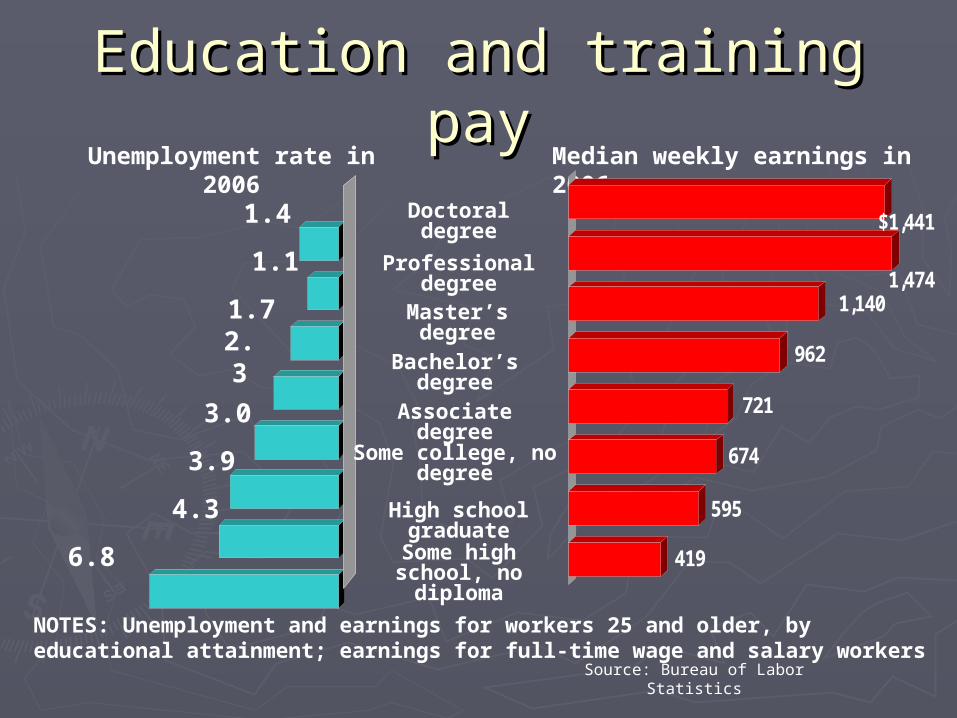
Education and training payEducation and training pay
NOTES: Unemployment and earnings for workers 25 and older, by educational attainment; earnings for full-time wage and salary workers
Unemployment rate in 2006 Median weekly earnings in 2006
Source: Bureau of Labor Statistics
419
595
674
721
962
1,1401,474
$1,441
1.7
2.3
3.0
3.9
4.3
6.8
1.1
1.4
Master’s degree
Bachelor’s degree
Associate degree
Some college, no degree
High school graduate
Some high school, no diploma
Professional degree
Doctoral degree

SourcesSources
►SMCCSMCC►Career Center of MaineCareer Center of Maine►ACINET Career OnestopACINET Career Onestop►YouTubeYouTube
Recommended