March 2012
Engagement of Consultants by
the European Bank for Reconstruction and Development in 2011

ENGAGEMENT OF CONSULTANTS BY EBRD
2011
Consultancy Services Unit Consultancy and Corporate Procurement Department March 2012

EXECUTIVE SUMMARY
• In 2011, the EBRD and its clients awarded 2,797 consultancy contracts with a total value of €169.49 million. Although there was a small decrease overall in both number and value of consultancy contract awards in comparison to 2010 (0.82% and 3.15% respectively), the value and number of contracts remained at a high level.
• Technical Cooperation (TC) Funds including Special Funds, made available through the EBRD’s donor-funded programmes, provided funding for 1,323 contracts totalling €99.04 million, or 47.30% of the total number and 58.43% of the total value of all consultancy contract awards. Included in the TC funded statistics were 387 contracts with a total value of €29.04 million funded from various EU funding programmes, and 323 contracts with a total value of €24.18 million financed from the EBRD Shareholder Special Fund. Approximately one fifth of the contracted TC funds (€20.21 million) carried restrictions on nationality of consultants imposed by the Donors of TC Funds.
• The Bank’s budget was used to finance 1,454 contracts with an aggregate value of €55.36 million. This amounts to 51.98% of the total number and 32.66% of the total value of the 2011 contract awards.
• There were 20 contracts for consultancy services with a total value of €15.09 million funded from public sector loan proceeds and awarded by the Bank’s clients, compared to €16.04 million for 17 contracts in 2010.
• Competitive selection accounted for 72.71% of the value of all contract awards by the Bank and its clients, a marginal decrease compared to 73.99% in the previous year. Within the remaining 27.29% of the value of contracts awarded through direct selection, the share of the value of contract awards under Section 5.9 of the Bank’s Procurement Policies and Rules decreased to 5.92%, from 7.13% in 2010.
• The British consultants were at the top of the consultant nationality list by value of contract awards with €48.27 million for 840 contracts (€44.54 million for 773 contracts in 2010). Italian and Russian consultants were ranked second and third with €16.56 million (166 contracts) and €12.52 million (179 contracts) respectively. Consultancy contract awards to German consultants amounted to €11.83 million for 86 contracts.
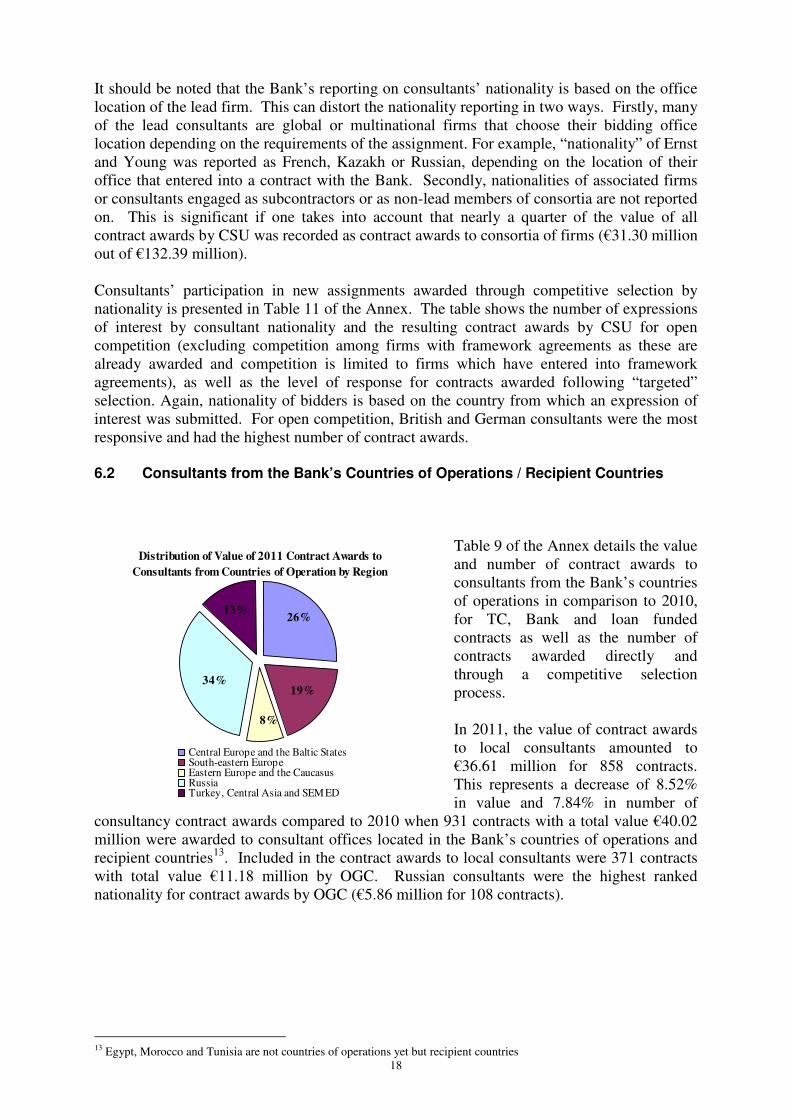
• The value of contracts awarded to consultants from the Bank’s countries of operations totalled €36.61 million for 858 contracts, a decrease in value of 8.53% compared to 2010 (€40.02 million for 931 contracts). Egyptian, Moroccan and Tunisian consultants were added to the list of consultant nationalities as the Bank started technical cooperation activities in the SEMED region.
• In 2011 there was a significant increase in the use of framework contracts and framework agreements as instruments for retention of consultants for repetitive, similar assignments allowing mobilisation of consultants at a short notice.
Abbreviations
BAS Business Advisory Services CAR Consultant Assignment Reporting
CCDP Consultancy and Corporate Procurement Department CSU Consultancy Services Unit EGP Enterprise Growth Programme
ETC Early Transition Countries FI Financial Institution FIDIC International Federation of Consulting Engineers
GEF Global Environmental Facility LTT Legal Transition and Knowledge Management Team MCCF Multilateral Carbon Credit Fund
MDB Multilateral Development Bank MSE Micro and Small Enterprises MSME Micro, Small and Medium-sized Enterprises
NSD Nuclear Safety Department OCCO Office of the Chief Compliance Officer OGC Office of the General Counsel
PCC Procurement Complaints Committee PIP Public Information Policy PP&R Procurement Policies and Rules
SBS Small Business Support Programme SEMED The southern and eastern Mediterranean region SME Small and Medium Enterprise
SSF EBRD Shareholder Special Fund TAM TurnAround Management Programme TC Technical Cooperation
TC Com Technical Cooperation Review Committee

Table of Contents
1. Introduction ....................................................................................................................... 1
2. Overall Results Of Consultancy Contract Awards ............................................................ 1
3. Funding Sources ................................................................................................................ 2
4. Consultant Selection Methods ........................................................................................... 7
5. Consultants Engaged For Operations And Institutional Needs ....................................... 13
6. Nationality Of Consultants .............................................................................................. 16
7. Analysis Of Consultancy Contracts By Contracting Department ................................... 19
8. Contracting Methods ....................................................................................................... 29
9. Performance Of Consultants ........................................................................................... 32
Annex – Tables of Statistics

1
1. Introduction
The Annual Report on Engagement of Consultants by EBRD (the “Report”) provides an overview and analysis of consultancy contract awards by the European Bank for Reconstruction and Development (the “EBRD” or the “Bank”) and its clients during 2011 financed either from the Bank’s budget, public sector loan proceeds, Technical Cooperation (“TC”) funds including Special and Cooperation Funds, and funds managed by the Nuclear Safety Department (“NSD”).
The Report has been prepared by the Consultancy Services Unit (“CSU”) which operates as part of the Consultancy and Corporate Procurement Department (“CCPD”) and is the central unit in the Bank responsible for compliance with respect to engagement of consultants. The Report presents consolidated figures of consultancy contract awards by CSU and the Office of the General Counsel (“OGC”) responsible for selection and engagement of outside counsel. It also includes the statistics on consultancy contract awards for the Small Business Support (“SBS”) team1. Consultancy contracts funded from public sector loan proceeds contracted by the Bank’s borrowers pursuant to the Bank’s Procurement Policies and Rules (“PP&R”) and under the ultimate oversight of the EBRD’s Procurement Department (“PD”) have also been included2. To the extent possible the Report addresses the Audit Committee’s comments on the 2010 Annual Report on Engagement of Consultants. However due to limitations of the IT systems used by the Bank to maintain the details of consultancy contracts it was not always possible to expand on some issues highlighted by the Audit Committee, in particular nationality of sub-contractors and non-lead firms of contracted consortia. It is intended that upon consideration and approval by the Executive Committee and the Audit Committee of the Bank and in accordance with the Bank’s Public Information Policy (“PIP”), the Report will be published on the Bank’s website3. 2. Overall Results of Consultancy Contract Awards
In 2011, the EBRD and its clients awarded 2,797 consultancy contracts with a total value of €169.49 million. The chart illustrates the values and numbers of consultancy contracts awarded by the EBRD between 2007 and 2011. In 2011 the value of contract awards slightly decreased (by 3.15% compared to 2010), however remained well above the
contracted values reported prior to 2010 which was an exceptional year in terms of the value of contracted TC funds. The number of contract awards remained at a similar level in the past three years.
1 TAM/BAS team was renamed to the Small Business Support team in January 2012 2 These contract awards are also reported in the Annual Procurement Review prepared by the Procurement Department 3 Annual Reports “ Engagement of Consultants by EBRD” for previous years are available at http://www.ebrd.com/pages/workingwithus/procurement/consultancy.shtml
Consultancy Contract Awards by EBRD
2007-2011
€136.18m
€175.00m
€137.17m
€120.22m
€169.49m
0
20
40
60
80
100
120
140
160
180
200
2007 2008 2009 2010 2011
Val
ue,
€ m
illi
on
27972377 2434 2821 2820

2
The data includes contract extensions, where contracts have been extended in value with additional scope of work.
3. Funding Sources
The funding sources of consultancy contracts included various technical cooperation funds, Special Funds, the Bank’s budget and public sector loan proceeds. As in previous years, for the purpose of analysis of the funding sources and comparison to previous years, the funding sources are broadly grouped into (a) TC funds, denoting donor funding including Special Funds, such as Shareholder Special Fund, and funds managed by the NSD; (b) the Bank’s budget; and (c) public sector loan proceeds. The data for the Nuclear Safety Department (“NSD”) included in TC funded contract awards is also set out separately in Table 1 of the Annex.
In 2011, TC funding and Special Funds amounted to €99.04 million or 58.43% of the value of all contract awards by the EBRD and its clients. The Bank’s budget amounted to €55.36 million (32.66%), and public sector loan proceeds to €15.09 million or 8.91% of the total value. In 2010, the share of TC funded contracts was 61.81%, the Bank’s budget accounted for 29.02% and loan funds for 8.90% of the value of contracted funds. Details of the value and number of contract awards for contracts funded by TC funds, the Bank’s budget and public sector loan proceeds for the past five years are presented in Table 2 of the Annex.
The charts below illustrate fluctuations in the value of contracted funds by funding source in the past five years.
Value of 2011 Consultancy Contract Awards
by Funding Source
Loan
proceeds,
€15.09m
Bank's
Budget,
€55.36m
TC Funds
and Special
Funds,
€99.04m
TC Funds108.17
99.04
85.66
65.91
54.91
0
20
40
60
80
100
120
2007 2008 2009 2010 2011
Va
lue, €
mil
lio
n
Bank's Budget
55.3650.7948.94
41.38
57.80
2007 2008 2009 2010 2011
Public sector loan proceeds
16.042.57
12.9323.47
15.09
2007 2008 2009 2010 2011

3
3.1 Technical Cooperation Funds In 2011, 1,323 contracts totalling €99.04 million were financed by TC funds made available through the EBRD’s donor-funded programmes, including those for the NSD, EGP/BAS programmes and Special Funds. This represents 47.30% of the total number and 58.43% of the total value of all consultancy contract awards by the EBRD in 2011. Compared to 2010, both the value and number of TC funded contracts decreased, by 8.44% and 13.53% respectively (in 2010, the value and number of TC funded contracts amounted to €108.17 million for 1,530 contracts). For contracts awarded in 2011 TC funding was provided through 84 separate TC contribution agreements, ranging from agreements with single donors for specific projects to programme-wide arrangements involving multiple contributors. Table 12 of Annex lists number and value of consultancy contracts funded by TC and special donor funds including NSA by respective funding agreement. In 2011 the European Union (EU), the Bank’s largest donor of TC funds, provided funding for 387 contracts with a total value €29.04 million, notably through the SME Finance Facility, Private Sector Support Facilities for Turkey and Western Balkans, the EU Neighbourhood Facility.
Year
Value, €
million
Number The table shows that the value and number of consultancy contracts funded from various EU funding programmes has substantially increased in the past two years. Historically, the level of contracted EU funding was at its highest in 1997 with over €50 million worth of EU funded consultancy contract awards financed primarily from EU-EBRD Tacis and Phare Programmes.
2007 14.09 430
2008 10.70 414
2009 15.35 354
2010 25.33 280
2011 29.04 387
Another significant source of funding for contract awards in 2011 was the Global Environment Facility (“GEF”), channelled through the World Bank. The GEF funds provided financing for 25 contracts worth €5.45 million (there were four GEF funded contracts for €6.43 million in 2010). The EBRD Shareholder Special Fund (“SSF”) which was established in 2008, endowed with the resources of the Bank's net income, financed 323 contracts with a total value €24.18 million or 24.41% of the value of TC funds contracted in 2011. The SSF, which was initially established to complement TC funds provided by other donors using the principle of matching, is now recognised as a complementary facility to the donor funds, and provides funding for projects which do not fit the donors' priorities, covering funding gaps in some sectors and countries for which other TC funds cannot be found. The table below details the value and number of consultancy contract awards financed by the SSF since its establishment in 2008.
Year Value, €
million
% of Total Value
of contracted SSF Number
The EBRD’s Board of Directors has recently agreed to release up to €50 million from the SSF for use on the Bank’s strategic priorities in partnership with donors during 2012.
2008 6.81 8.28% 123
2009 23.72 28.86% 430
2010 27.49 33.44% 483
2011 24.18 29.42% 323
82.20 100% 1,359

4
The Early Transition Countries Fund4 financed by Canada, Finland, Germany, Ireland, Japan, Korea, Luxembourg, the Netherlands, Norway, Spain, Sweden, Switzerland, Taipei China and the United Kingdom provided funding for 80 contracts with a total value €4.85 million, a decrease compared to 2010, when the number and value of ETC funded contracts amounted to 135 and €8.02 million respectively.
Donor Country Value, € Number The table lists countries that were bilateral donors of TC funds contracted in 2011. Among bilateral donors, the highest contracted values, provided through one or more TC contribution agreements, were by Austria, Sweden, Czech Republic, Korea, Germany, Italy, Japan, Switzerland, Finland, France, and Slovak Republic. The highest value individual consultancy contracts funded by bilateral donors were financed by Korea (Assignment: Kazakhstan National Green Growth Plan, Consultant: Global Green Growth Institute, Korea Contract Value: €1,500,000, Funding
Source: Korean Assistance and Cooperation Fund); and Switzerland (Assignment: Kyrgyz Republic: Osh And Jalalabad Water Rehabilitation - PIU Support Including Engineering, Design And Contracts Supervision, Consultant: Ernst Basler Partner Ltd, Switzerland, Contract Value: €1,497,150, Funding Source: Swiss TC Fund - Osh and Jalalabad Projects).
Austria 4,496,357 24 Belgium 22,422 2 Canada 31,260 2 Czech Republic 3,462,024 9 Denmark - 2 Finland 1,644,162 10 France 1,242,436 5 Germany 2,134,703 33 Greece 23,541 5 Ireland 57,000 1 Italy 1,948,398 50 Japan 1,910,635 134 Korea 2,602,091 32 Luxembourg 846,918 34 Netherlands 593,747 21 Norway 473,500 5 Portugal 244,163 6 Slovak Republic 1,101,623 5 Spain 337,284 17 Sweden 2,850,564 17 Switzerland 1,651,700 20 Taiwan 952,210 38 United Kingdom 90,000 1
TC funds were used to finance consultants carrying out services on behalf of the Bank or its clients in support of the Bank’s overall mandate of promoting transition towards open market-oriented economies including implementation of the Bank’s key programmes, facilities and initiatives such as sustainable energy, climate finance, environmental infrastructure, support for small businesses, local currency and capital market development. TC funds were also used to finance various preparation and implementation assistance in relation to specific operations, including capacity building initiatives for the Bank’s clients. In 2001, 90.35% of the value of contracted TC funds (€89.48 million for 1,252 contracts) was either for project preparation or implementation, or in relation to the Bank’s key programmes carried out by the Banking department. Table 10 of Annex details value and number of 2011 TC funded consultancy contract awards by respective Banking teams. The remaining €9.56 million for 71 contracts, or 9.65% of the value of contracted TC funds, were for contract awards by the EBRD’s non-banking departments, to finance projects directly relevant to the transition process (see Table 10 of the Annex).
4 ETC countries: Armenia, Azerbaijan, Belarus, Georgia, Kyrgyz Republic, Moldova, Mongolia, Tajikistan, Turkmenistan and Uzbekistan

5
TC funds were used by the OGC’s Legal Transition and Knowledge Management Team (“LTT”) aimed at furthering policy dialogue and quality and effectiveness of the laws most directly relevant to the transition process5. 2011 TC funded contract awards by the LLT included the Diagnostics and Update of Laws - EBRD-UNCITRAL Initiative on Public Procurement in CIS and Mongolia (Consultant: Crown Agents, UK, Contract
Value: €1,600,000, Funding Source: SSF, Communications Policy & Regulatory Development in Georgia (Consultant: J. Kanervisto Consulting, Finland, Contract
Value: €494,075, Funding Source: Ministry of Foreign Affairs Finland - EBRD TC Fund), Extractive Industries Transparency Initiative Implementation Support in Mongolia (Consultant: Adam Smith International, UK , Contract Value: €425,850, Funding Source: ETC Fund), Public Procurement Policy Development and Regulatory Capacity Building in Ukraine (Consultant: Wolf Theiss Rechtsanwälte GmbH, Austria, Contract Value: €372,360, Funding Source: SSF), Commercial Courts Restructure and Retraining Programme in Moldova (Consultant: Wolf Theiss, Czech Republic, Contract Value: €345,000, Funding Source: Czech Republic ODA TC fund), and others. The Environmental and Sustainability Department which is part of the Operation Policies Vice Presidency used TC funds for consultancy services related to ecological, environmental, and health and safety assessments and initiatives. Some studies carried out by the Office of the Chief Economist (“OCE”) were TC funded, such as the Business Environment and Enterprise Performance Survey V in Russia (Consultant: Centre for Economic & Financial Research, Russia, Contract Value: €485,140, Funding Source: SSF). The number and value of the 2011 contract awards for the NSD funds and included within the TC funded contract statistics for the VP, Operational Policies, amounted to 12 contracts and €0.48 million, an increase from 2010 (four NSD contracts for €0.28 million). In 2009 there were 12 NSD contracts totalling €0.90. The three contracts under Finance Vice Presidency were for the Treasury Department, namely for the assistance to reform TRLIBOR, Turkish money-market index (Consultant: Minima Danismanlik Hizmetleri Ltd. Sti., Turkey, Contract Value: €135,000, Funding Source: SSF), and delivery of the treasury risk management workshops in Georgia & Croatia (Consultant: Moody’s Analytics UK Ltd, Contract Values: €14,750 & €13,550 respectively, Funding
Source: SSF). A comprehensive review of the donors’ TC funding is prepared by Official Co-financing Unit (“OCU”) and published in the Bank’ Annual TC Donor Report6.
5 These TC projects are contracted by CSU 6 See: http://www.ebrd.com/downloads/research/donor/dr11e.pdf
2011 TC Funded Consultancy Contracts
by Non-Banking Departments
Finance,
€163,310
Evaluation
Department,
€75,792
Office of the
General Counsel,
€6,985,905
VP, Operation
Policies,
€1,049,014
Office of the
Chief
Economist ,
€802,203
VP, Risk and
Resources,
€484,522

6
3.2 Bank’s Budget
In 2011, the number and value of consultancy contract awards financed from the Bank’s budget amounted to 1,454 contracts for €55.36 million (51.98% of the total number and 32.66% of the total value of contract awards). Compared to the previous year, both number and value of Bank funded contract awards increased by 14.22% and 9.00% respectively (in 2010 there were 1,273 contracts for €50.79 million financed from the Bank’s budget). The Bank’s budget was used at pre- and post-signing phases of a project (transaction) cycle in order to finance project preparation, such as various due diligence assignments, e.g. legal, financial, technical, environmental, as well as project monitoring, such as lender supervisors and board nominee assignments on investee companies. The Bank’s budget is also used to engage consultants for various non-Banking departments required to enable these departments to discharge their functions for the necessary operations of the Bank, e.g. the Evaluation Department, Office of the Chief Economist, Office of the Chief Compliance Officer and others (see Table 10 of Annex). All contract awards for retention of outside counsel contracted by OGC (571 contracts with aggregate value €17.91 million) in response to the needs of the Banking Department, Administration, Human Resources and Treasury were funded from the Bank’s budget. 3.3 Loan Proceeds in Public Sector Operations
In 2011, there were 20 consultancy contracts with an aggregate value of €15.09 million funded by loan proceeds of public sector operations and awarded by the Bank’s borrowers directly. These operations were 100% financed by the Bank. In 2010, there were 17 consultancy contracts totalling €16.04 million funded by loan proceeds in public sector operations with the Bank’s financing amounting to 94.72%. CSU is not involved in the selection of consultant services to be financed with the proceeds of Bank loans. Such selection is carried out by borrowers subject to the Bank’s PP&R and under the ultimate oversight of the PD. The number and value of public sector loan funded consultancy, although small, is dependent on the type of projects being financed by the Bank’s loans in public sector operations. In 2011, in addition to the loan funded consultancy contracts above, the PD reported 10 contracts for consultant services with a total value of €47.21 million funded with EU Cohesion Funds that are structural funds and part of the Community budget available to EU Member states whose GNI (Gross National Income) is lower than 90% of the EU average. These contracts and projects are co-financed by the Bank and allow for procurement in accordance with national law (aligned to the EU Procurement Directive) on exceptional basis7. The Commission is involved in programme monitoring, commits and pays out approved expenditure and verifies the control systems. As the Bank’s involvement in these contracts for consultancy services is limited to monitoring they are not included in the overall count of the consultancy contract awards by EBRD and its borrowers presented in this Report.
7 Section 2.4 of the Bank’s Procurement Policies and Rules

7
4. Consultant Selection Methods Consultant selection is carried out by the EBRD in accordance with the Bank’s Procurement Policies and Rules (“PP&R”)8. The PP&R stipulate9 that for consultancy contracts estimated to cost less than €75,000 with individuals or firms, a qualified consultant may be selected directly, without the requirement to prepare a short list. This consultant selection method is referred to as “direct selection”. For contracts estimated to cost €75,000 or more with individuals, selection is made on the basis of an evaluation of short-listed, qualified candidates and the rationale for the choice is recorded. For contracts with firms that are estimated to cost €75,000 or more and less than €300,000, a short list of qualified firms is prepared. The selection is based on an evaluation of the short-listed firms’ proven experience and current expertise related to the assignment, without a requirement that the firms submit specific proposals for carrying out the assignment. This consultant selection method is referred to as “selection from shortlist”. Major contracts with firms estimated to cost €300,000 or more normally follow a competitive procedure based on invited proposals from a short list of three to six qualified firms. This selection method is based on formal “evaluation of proposals”. Section 5.9 of the Bank’s PP&R also stipulate that whereas competition through a short list is preferred, in some circumstances it may be necessary or advantageous to engage or continue with a specific consultant, where:
(a) the consultant has unique expertise or experience; or (b) the consultant has been or is involved in the early phases of the project
such as feasibility or design and it has been determined that continuity is necessary and no advantage would be gained from following competitive procedures; or
(c) additional services not included in the original contract have, through
unforeseen circumstances, become necessary for the performance of the contracted services, on condition that those additional services cannot be technically or economically separated from the original contract without major inconvenience to the contracting authorities or when such services, although separable from the performance of the original contract, are strictly necessary for its completion.
In such cases the consultant in question may be invited to submit a proposal and a contract negotiated directly. Table 3 of the Annex details the numbers and values of consultancy contracts and extensions by consultant selection method (direct selection, direct selection under Section 5.9 (a), (b) and (c) of the PP&R, selection from shortlist and evaluation of proposals) for TC funded contracts, Bank funded contracts and contracts funded by loan proceeds of public sector operations awarded in 2011.
8 The revised version of the Bank’s PP&R was approved by the Board of Directors on 6 May 2009 9 See Section 5.3 of the Bank’s PP&R available at http://www.ebrd.com/pages/research/publications/policies/procurement.shtml

8
In 2011, the number and value of contracts awarded following a competitive consultant selection process (either evaluation of proposals or selection from shortlist) amounted to 680 contracts for €123.23 million, or 24.31% of the number and 72.70% of the value of all contract awards. Further 2,117 contracts with an aggregate value €46.26 million were awarded through direct selection, including 154 contracts for €10.02 million under Section 5.9 of the Bank’s PP&R. Contracts awarded through direct selection amounted to 75.69% of the total number and 27.29% of the total value of the 2011 contract awards. The overall picture is similar to the previous year as shown in the charts below.
Value of Consultancy Contract Awards by Consultant Selection Method
The table below provides a detailed breakdown of the values and numbers of contract awards by selection method for the past three years. In comparison to 2009 and 2010, there was a decrease in the share of value of contracts awarded under Section 5.9 (a), (b) & (c) of the Bank’s PP&R and an increase in the value and share of value of contracts awarded following a selection from shortlist procedure.
2011 2010 2009
Value, €
% of
Total
Value
No
Value, €
% of
Total
Value
No Value, €
% of
Total
Value
No
Direct Selection 36,239,958 21.38% 1,963 33,039,306 18.88% 1,884 34,080,262 24.85% 1,983
Direct Selection
under Section 5.9 10,022,704 5.91% 154
12,471,838 7.13% 219 11,400,337 8.31% 208
Selection from Shortlist 43,936,086 25.93% 544 41,758,735 23.86% 545 29,058,307 21.18% 475
Evaluation of Proposals 79,291,812 46.78% 136 87,729,637 50.13% 172 62,629,959 45.66% 155
169,490,560 100% 2,797 174,999,516 100% 2,820 137,168,865 100% 2,821
The two tables over leaf show the share of value of the 2011 and 2010 contract awards by selection method for TC and Bank funded contracts. 20 contracts for consultancy services with a total value of €15,089,286 funded from public sector loan proceeds were awarded following either direct selection or evaluation of proposals processes (see Table 3 of the Annex for details).
Direct
Selection,
€36.24m Evaluation of
Proposals,
€79.29mDirect
Selection
Section 5.9
(a), (b) & (c),
€10.02m Selection
from Shortlis t,
€43.94m
Direct
Selection,
€33.04m
Evaluation of
Proposals ,
€87.73mDirect
Selection
Section 5.9
(a), (b) & (c),
€12.47m
Selection from
Shortlist,
€41.76m
20102011

9
TC Funded Contract Awards by Consultant Selection Method
2011 2010
Value, €
% of Total
Value Number
Value, €
% of Total
Value Number
Direct Selection 14,957,880 15.10% 999 14,067,122 13.01% 1,097
Direct Selection
under Section 5.9 5,471,598 5.52% 67
6,440,271 5.95% 121
Selection from Shortlist 15,931,013 16.08% 153 18,634,657 17.23% 185
Evaluation of Proposals 62,678,172 63.30% 104 69,027,319 63.81% 127
99,038,663 100% 1,323 108,169,369 100% 1,530
Bank Funded Contract Awards by Consultant Selection Method
2011 2010
Value, €
% of Total
Value Number
Value, €
% of Total
Value Number
Direct Selection 20,965,739 37.87% 959 18,972,184 37.35% 787
Direct Selection
under Section 5.9 4,551,106 8.22% 87
6,031,567 11.88% 98
Selection from Shortlist 28,005,074 50.59% 391 22,732,558 44.76% 357
Evaluation of Proposals 1,840,693 3.32% 17 3,052,489 6.01% 31
55,362,612 100% 1,454 50,788,798 100% 1,273
The distribution of value comparing 2011 and 2010 contract awards by consultant selection method for contracts funded by TC funds and the Bank’s budget (excluding loan proceeds) is also presented in the charts below.
The increase in the value of consultancy contracts funded from the Bank’s budged and awarded following selection from shortlist was due to a large number of extensions10. In 2011, there were 201 such extensions totalling €14.40 million compared to 161 for €9.81 million in 2010. A significant number of high value extensions were for various IT projects, such as Trading and Risk Systems Project Manager - Summit Upgrade, Risk Systems Integration Specialist, GEF Project Support Consultant, various SAP specialists and others. 4.1 Analysis of Contract Awards Based on Tied/Untied TC Funds
The Bank’s Procurement Policies and Rules require open international competition in selecting consultants. For consultancy contracts financed with Technical Cooperation Funds, the Bank’s policies are followed to the extent that they do not conflict with agreements reached with the donors for the use of such funds.
10 Foreseen contract extensions to previous contracts awarded following Selection from shortlist
Value of Contract Awards financed by TC Funds
by Selection Methods, in 2011 & 2010
14.965.47
15.93
62.68
6.44
14.07 18.63
69.03
0
10
20
30
40
50
60
70
80
Direct
Selection
Section 5.9 (a),
(b) & (c)
Selection from
Shortlist
Evaluation of
Proposals
Val
ue,
€ m
illi
on
2011
2010
Value of Contract Awards financed from Bank's
budget by Selection Methods, in 2011 & 2010
20.97
4.55
28.01
1.84
6.03
18.98 22.73
3.05
0
10
20
30
40
50
60
Direct
Selection
Section 5.9
(a), (b) & (c)
Selection
from Shortlist
Evaluation of
Proposals
Val
ue,
€ m
illi
on
2011
2010

10
TC funds that carry no nationality eligibility restrictions on consultant participation are referred to as “untied” funds. TC contribution agreements carrying only broad nationality restrictions or those with restrictions applied to a portion of the funds provided (thus including both tied and untied elements) are referred to as “semi-untied” funds. “Tied” funding has eligibility requirements, restricting its use to financing consultants of the donor’s nationality. Tied funding normally allows for local consultants (i.e. consultants from the country of operation where the project takes place, or from any of the Bank’s country of operations) to participate in the assignments by allocating a proportion of the funds, either in consortium with a firm of the nationality of the donor or on a stand-alone basis. The proportion varies between 10% and 50%.11 The analysis in this section presents a breakdown of TC funded consultancy contract awards in 2011 by their status based on the respective funding agreement, i.e. “untied”, “semi-untied” and “tied”. In 2011, there were 1,323 contract awards with a total value of €99.04 million financed by TC funds. The table below presents a breakdown of the TC funded contracts for tied, untied and semi-untied TC funding, in comparison to 2010 and 2009.
2011 2010 2009
Value, €
% of
Total
Value
No
Value, €
% of
Total
Value
No Value, €
% of
Total
Value
No
Untied 78,822,588 79.59 1,100 91,506,505 84.60% 1,265 67,952,016 79.32% 1,123
Semi-Untied 2,892,304 2.92 53 4,103,541 3.79% 38 2,850,853 3.33% 241
Tied 17,323,771 17.49 170 12,559,323 11.61% 227 14,860,399 17.35% 223
99,038,663 100% 1,323 108,169,369 100% 1,530 85,663,268 100% 1,587
The value of “untied” funding, provided through 53 different contribution agreements, amounted to €78.82 million or 79.59% of all contracted TC funds. Among bilateral donors that provided untied funding were Austria, Canada, Denmark, Germany, Japan, Korea, Netherlands, Norway, Sweden, Switzerland and others. All multi-donor funds including Clean Technology Fund, ETC Fund, SSF, Russia Small Business Fund, Southern and Eastern Mediterranean Trust Fund, Western Balkans Fund, EBRD Water Fund, Kozoloduy International Decommissioning Support Fund and others, provided financing on an untied basis. All EU funds were untied. “Semi-untied” funds i.e. those combining “tied” and “untied” components where nationality restrictions applied to a portion of the funds provided funding of €2.89 million for 53 contracts (2.92% of the total value of contracted TC funds). It should be noted that in the previous reports on the Annual Engagement of Consultants by EBRD “semi-untied” funds also included those with broad nationality eligibility requirements such as some of the EU funds that were open to consultants from the EU and recipient countries, or the Northern Dimension Environmental Partnership Support Fund (“NDEP”). The EU has since untied all their funding and there were no contract awards financed from other funds with broad nationality eligibility restrictions in 2011.
11 This classification of TC Donor funding agreements is provided by the Official Co-financing Unit

11
The list of “semi-untied” TC funds and the respective value and number of contract awards in 2011 are provided in the table below:
“Semi-untied” funding: TC Fund Name Value, € No
Japan Japan-SEI TC Fund 220,730 6 Spain Spanish SEI Fund II ODA Fund 222,214 8 Switzerland Swiss TC Fund for Osh and Jalalabad Projects 1,497,150 1 Taiwan Taiwan Business - EBRD TC Fund 952,210 38
2,892,304 53
In 2011, all of 53 consultancy contracts funded from the “semi-untied” funds listed above were awarded using their tied components, i.e. either to consultants of the respective donor nationality or nationals of the EBRD’s countries of operations as per the donor eligibility requirements. For contracts awarded through competitive selection specific consultant nationalities were targeted. For example, in case of the consultancy assignment funded from the Swiss TC Fund for Osh and Jalalabad Projects (see page 4 for details), the consultant selection process was open only to firms registered in Switzerland providing experts of Swiss nationality, with up to 50% of the value of the contract permitted to be utilised on subcontractors or consortium partners from the Bank’s countries of operations. In 2011, “tied” funding financed 170 consultancy contracts with an aggregate value of €17.32 million or 17.49% of the total value of contracted TC funds. 16 donors through 27 different contribution agreements provided TC funding on a tied basis. Jointly, “tied” and “semi-untied” with applicable nationality eligibility restrictions accounted for 20.41% of the total value of TC funded contracts awarded in 2011. The distribution of “tied” TC funds contracted in 2011 by the donor country and TC funding agreement is presented in the below table.
“Tied” funding: TC Fund Name Value, € No
Austria
Austrian Fund for Municipal Infrastructure 2,880,421 7
Austrian Technical Assistance Co-operation Fund 815,215 7
Austria-EBRD Ukraine Energy Efficiency Programme 440,000 3
Belgium Walloon Technical Cooperation Fund 22,422 2
Czech Republic Czech Republic ODA TC fund 3,462,024 9
Finland
Ministry of Foreign Affairs Finland - EBRD TC Fund 993,747 3
Finnish Ministry of Employment and the Economy TC Fund 644,695 5
Finnish Technical Cooperation Fund 5,720 2
France France Technical Cooperation -Treasury 1,174,700 4
France Technical Cooperation - Foreign Affairs 67,736 1
Germany Germany II Technical Cooperation Fund 1,668,355 7
Greece Hellenic Technical Cooperation 23,541 5
Ireland Ireland-European Bank Cooperation 57,000 1
Italy
Italian Technical Co-operation 706,258 23
Central European Initiative - Ministry of Foreign Affairs 494,915 3
EBRD-ICF-PSD in Western Balkans 426,900 2
Central European Initiative 216,545 21
EBRD Italian TC Fund Albanian Water Resources Study 103,780 1
Luxembourg Luxembourg - ODA Technical Co-operation Fund 743,559 26
Luxembourg - European Bank Technical Co-operation 103,359 8
Netherlands Netherlands Technical Assistance Co-operation 355,815 3
Portugal Portuguese Technical Cooperation Fund 2008 244,163 6
Slovak Republic EBRD - Slovak Republic TC Fund 1,101,623 5
Spain EBRD-ICEX Technical Co-operation 115,070 9

12
Sweden Sweden (SIDA) - EBRD Technical Cooperation Fund - Phase II 408,722 2
Switzerland Switzerland-EBRD FYR Macedonia MEAP Grant Fund 25,000 1
Swiss Technical Co-operation 22,486 4
17,323,771 170
4.2 Targeted Selection For competitively awarded assignments funded by TC funds where the donors of TC funds confirm their decision to provide funding prior to the commencement of the consultant selection process, the Bank ensures economy, efficiency, transparency and donor visibility by stating the source of TC funding and applicable requirements in the procurement notice inviting expressions of interest. Unrestricted open consultant selection process refers to assignments that open to consultants of all nationalities without restrictions in participation. For “tied” TC funds, in order to ensure participation of consultants from the countries that are donors of TC funds and the recipient countries, the consultant selection process is targeted at consultants from these countries as specified under the relevant contribution agreement with the donors of TC funds. This is reflected in consultant procurement notices under the “Eligibility Requirements” section. The competitive selection process which is open only to consultants from the donor country is referred to as “targeted” selection. There were 193 TC funded contracts with a total value of €62.68 million (excluding extensions) awarded in 2011 following a new competitive consultant selection process. This number includes 14 call-off notices totalling €2.26 million which were awarded following competition among consultants contracted under framework agreements. The breakdown of the remaining 179 contracts into open / targeted consultant selection is presented below:
Open competition Targeted competition Total
Value, € Number Value, € Number Value, € Number
Evaluation of Proposals 37,217,524 54 9,219,474 21 46,436,998 75
Selection from Shortlist 8,199,997 75 5,785,653 29 13985,650 104
Total 45,417,521 129 15,005,127 50 60,422,648 179
129 contracts totalling €45.42 million were awarded following unrestricted or open consultant selection process. This number included 23 framework agreements with potential value of €9.50 million (value of framework agreements is recorded as zero and financial commitments are made at the call-off notice award level). The remaining 50 contracts for an aggregate amount of €15.00 million were awarded as the result of consultant selection processes targeted specifically at consultants from the countries specified in contribution agreements with the donors of TC funds, including six framework agreements under three framework facilities with potential value of €1.08 million. Therefore approximately one in four new consultant selection processes that resulted in a contract award in 2011 was targeted at consultants of one of the following nationalities: Austrian, Czech, Finnish, French, German, Italian, Japanese, Dutch, Portuguese, Slovak, Spanish, Swedish, Swiss, or Taiwanese.

13
The chart shows a split of new consultancy contract awards financed with TC funds, excluding extensions classified into open / targeted consultant selection processes as described above for the past five years.
The contract values shown in the chart exclude potential value of framework agreements. 5. Consultants Engaged for Operations and Institutional Needs 5.1 Consultancy Contracts in relation to the EBRD’s Operations
Contracts included in this section are either in relation to specific loan / investment operations, from project preparation by the Bank to project implementation loan/transaction assistance to the Bank’s clients, or for assistance with implementation of the Bank’s key programmes, facilities and initiatives promoting transition in the Bank’s countries of operations, such as sustainable energy investment and climate change. In 2011, out of all consultancy contract awards by the EBRD and its borrowers, 84.77% of the total number (2,371) and 87.80% of the total value (€148.82 million) were for the Bank’s operational needs, i.e. consultancy contracts in relation either to specific operations, including project preparation and project implementation loan/transaction assistance to the Bank’s clients, or for assistance with implementation of the Bank’s key programmes, facilities and initiatives promoting transition in the Bank’s countries of operations, such as sustainable energy investment and climate change. These figures included 1,307 contracts for €97.59 million financed by TC funds, 20 contracts for €15.09 million funded by loan proceeds in public sector operations, and 1,044 contracts for €22.97 million funded from the Bank’s budget including retention of outside counsel by OGC (522 contracts totalling €17.13 million by OGC were for the needs of the Banking Department).
In terms of sector distribution, consultancy contract awards to support in the financial institutions / bank lending / SME sector had the highest share of the value but the actual values decreased compared to the previous two years. The value of consultancy contracts to support projects in the municipal infrastructure and power and energy sectors also decreased compared to
2010, whereas the value of contracts in the agribusiness sector has gone up.
Competitively Awarded TC Funded Consultancy Contracts
by "Open" / "Targeted" approach to consultant selection
27.60
44.26 45.42
21.76
68.16
7.99
15.0010.506.96 9.28
0
10
20
30
40
50
60
70
80
2007 2008 2009 2010 2011
€ m
illi
on
Open competition Targeted at specific consultant nationality
88*37*
100*
32*
157*
28*
202*
40*
129*
50*
*Number of consultant
selection processes
31.55
38.37
31.5629.92
32.95
23.61
16.54
3.38 3.22
20.59
25.75
14.9
0
5
10
15
20
25
30
35
40
45
2011 2010 2009
Financial Inst itut ions / SM Es Infrastructure / Transport
Industry Commerce and Agribusiness Power and Energy / Energy Eff iciency

14
Among the Bank’s 29 countries of operations, the largest value of contract awards for operational needs were in Russian Federation with €28.99 million worth of contracts (an increase compared to €17.34 million worth of contracts in 2010), followed by projects in Ukraine (€16.62 million compared to €8.86 million in 2010), and Turkey (€10.80 million). Consultancy contracts supporting the Bank’s activities in the SEMED region amounted to €0.91 million, including, among others, Market Demand Study of Sustainable Energy Investment potential in Morocco (Consultant: Mattig Management Partners, Austria, Contract Value: €277,890, Funding Source: Neighbourhood Investment Facility - EC SEMED Project Preparation Framework). 5.2 Consultants Engaged for the Bank’s Institutional Needs
In 2011, 426 contracts totalling €20.67 million were for consultancy assignment related to the Bank’s institutional needs (15.23% of the total numbers and 12.21% of the total value of contract awards). In 2010 CSU reported 414 contracts with a total value of €22.89 million for the Bank’s institutional needs, and in 2009, there were 337 such contracts totalling €20.51 million. Contracts for the Bank’s institutional needs included, among others, contracts for EBRD retirement scheme investment consultancy services, IT development, staff training and coaching, executive searches for Human Resources, assistance with the Bank’s publications, advice in relation to the Bank’s new resident offices in Morocco, Egypt and Tunisia, etc. Economic studies by the Office of the Chief Economist Office, such as the Implementation of the Business Environment and Enterprise Performance Survey V in Russia, have been included in the contract count for the Bank’s institutional needs. Within contracts for the Bank’s institutional needs are those awarded to internal consultants either for provision of specialised expertise or to supplement human resources requirements. The value of contract awards to consultants retained for the Bank’s IT systems development, upgrade and maintenance amounted to €11.32 million for 133 contracts, compared to €10.37 million for 134 contracts in 2010 and €13.75 million for 117 contracts in 2009. Contracts for the needs of the following departments were classified as for the Bank’s institutional needs - the Office of the Chief Economist, the Office of the Chief Compliance Officer, the Evaluation Department. A summary of consultancy contract awards for all non-Banking departments are presented in Table 10 of the Annex. Out of 426, 410 contracts with an aggregate value of €19.22 million were funded from the Bank’s budget. The remaining 16 contracts for €1.45 million were financed from TC funds, out of which 13 contracts were financed from the EBRD Shareholder Special Fund (such as the Implementation of the Business Environment and Enterprise Performance Survey V in Russia, and the European Infrascope Index 2012 Country Readiness and Capacity Index for Public Private Partnerships Study) and the remaining three TC funded contract were financed by Luxembourg (the Evaluation of EBRD's Legal Transition Programme implemented during 2001-2010) and Japan (two Research Assistant for the Diversification of the Russian Economy Study). Out of 426 contracts with a total value of €20.67 million, 250 contracts for €16.54 million, or 58.68% of all contracts for the Bank’s institutional needs, were awarded to the British consultants. Among other consultant nationalities engaged for the Bank’s institutional needs were American (19 contracts for €0.79 million), Russian (eight contracts for €0.74 million), and Australian consultants (eight contracts for €0.60 million). Overall, the Bank awarded

15
contracts for its institutional needs to 34 consultant nationalities, including Albanian, Argentinean, Bosnian, Bulgarian, Egyptian, Macedonian and Tunisian consultants.
Internal Consultants
Internal consultants are defined as those required to perform services at the Bank’s Headquarters or its Resident Offices, under the guidance and supervision of Bank staff, and for no less than six consecutive calendar months or 60 consecutive working days. Proposed engagement of internal consultants is jointly reviewed by CSU and Human Resources in order to ensure that there are no other options of engagement (including contracts of employment) and costs (including “least cost” option, taking into account the administrative support costs to the Bank) preferable to the Bank. If the period of the services is expected to exceed 12 months, internal approvals from the Executive Committee member of the department requesting the engagement and the Vice President of Operational Policies are also required. In 2011, among 166 contracts totalling €13.20 million to internal consultants there were 153 contract for individual services, and 13 contracts awarded to five firms for provision of services based at the Bank’s Headquarters, such as Willis Ltd that were contracted under a framework agreement for provision of advice in relation to insurance advisory services. The 153 contracts for €12.48 million for individual services were awarded 108 individual consultants and included 112 contract extensions. The table overleaf presents a breakdown of consultancy contract awards to internal consultants (individuals only) by respective team in the Bank. Out of 153, 110 contracts and extensions totalling €9.35 million were to British consultants. Among other internal consultants nationalities were Australian, Indian and American consultants.
EBRD Team Number Value, € Information Technology 119 10,881,000 Manufacturing & Services 2 330,568 Information & Communications Technology 3 294,183 Office of the General Counsel 2 198,623 Small Business Support Programme 1 178,000 Transport Team 2 123,915 Communications 8 106,260 Nuclear Safety 2 90,150 Office of the Chief Economist 6 73,976 Resident Offices Support Division 1 61,298 Risk Management Front Office 1 49,813 TEECCA Front Office 1 43,310 Consultancy Services Unit 1 35,610 Financial Institutions 1 8,536 Office of the Secretary General 2 6,767 Central & South Eastern Front Office 1 2,400
The Internal Audit’s recommendation for additional reference checks to be carried out on internal consultants to minimise risks to the Bank has been addressed. Systems have been put in place in order to ensure that all internal consultants requiring access to the Bank’s IT systems have now their references checked.

16
6. Nationality of Consultants 6.1 Overall Results
The list of consultant nationalities engaged by the Bank expanded from 67 in 2010 to 69 in 2011 and included consultants from the SEMED region. Table 7 details the ranking of consultant nationalities12 engaged by the Bank in 2011 by value of contract awards, for TC funded, Bank budget and loan funded contracts. Table 8 of the Annex provides details of contracts for 69 consultant nationalities awarded through direct selection vs. competitive selection, for TC funds and Bank’s budget. The table below highlights the share of the value of consultancy contracts funded from the Bank’s Budget awarded to British consultants. As described in Section 5 British consultants were engaged for the Bank’s institutional needs and as internal consultants due to their proximity to the Bank’s Headquarters.
British consultants had the highest value of contract awards with €48.27 million for 840 contracts. In 2010, contract awards to British consultants amounted to €44.54 million for 773 contracts. In 2011 the British consultants’ share of the contracted value amounted to 28.48%, which is higher than 25.45% in 2010. Out of €48.27 million of contracts awarded to British consultants, more than half were funded from the Bank’s budget (€28.43 million). Among the 840 contracts, 560 for €13.64 million (or 28.26% of the value of contract awards to British consultants) were awarded by direct selection. The remaining 280 contracts with a total value of €34.63 million (including contract extensions and competitively awarded call-off notices under existing framework agreements) were awarded through competitive selection. British consultants’ expertise ranged from information technology, financial, accounting, legal, engineering, environmental, procurement, integrity, marketing across all sectors including financial institutions, SME, energy efficiency, power and energy, transport and manufacturing.
12 Only nationality of the lead firm is recorded
2011 Consultancy Contract Awards by Consultant Nationality
0
5,000,000
10,000,000
15,000,000
20,000,000
25,000,000
30,000,000
Brit
ish
Italia
n
Rus
sian
Ger
man
Aus
trian
Fren
ch
Swed
ish
Swiss
Dut
ch
Cze
ch
Am
erican
Finn
ish
Rom
anian
Dan
ish
Oth
ers
€
TC Funded Contracts Bank budget Loan funds

17
Italian consultants were ranked second with €16.56 million (a 9.77% share) for 166 contracts. 22 contracts for a total of €14.23 million or 85.92% of the value of consultancy contract awards to the Italian consultants were awarded following a competitive selection process. Approximately two thirds (66.6%) of €16.56 million were TC funds, 29.74% were public sector loan proceeds, and only 3.67% were Bank budget. A significant portion of the TC funded contract awards were in the sustainable energy investment sector, including the highest value contract award for the EBRD/UNIDO Energy Management System and Systems Optimization Capacity Building for Large Industry in Russian Federation (Consultant: MWH S.p.A., Italy, Contract Value: €2,595,000, Funding Source: The Global Environmental Facility II Fund). The other areas of expertise were in a wide range of sectors, including power and energy, transport, municipal infrastructure, SME, manufacturing, telecommunications, legal reforms etc. Included in the statistics on contract awards to the Italian consultants were four contracts with a total value €4.93 million funded from public sector loan proceeds awarded by the Bank’s clients following competitive selection as follows:
• Assignment: Serbia: EPS Metering Consultants Services Consultant: CESI S.p.A., Italy Contract Value: €1,890,140, Funding Source: Loan proceeds
• Assignment: Moldova Road Rehabilitation Project – Supervision of Works (lot 1) Consultant: IRD Engineering, Italy Contract Value: €1,161,100, Funding Source: Loan proceeds
• Assignment: Montenegro EPCG Metering and Distribution Project PIU Consultant Consultant: SESI S.p.A., Italy Contract Value: €949,982, Funding Source: Loan proceeds
• Assignment: Ukraine Pan-European Corridors - Consulting Services for Supervision of Works Consultant: IRD Engineering, Italy Contract Value: €925,640, Funding Source: Loan proceeds
In 2011 Russian consultants were ranked third with 179 contracts with a total value of €12.52 million representing a 7.39% share of the value of all contract awards. For comparison, in 2010 Russian consultants won 191 contracts totalling €15.39 million. The Bank’s budget financed 61.40% of the total value of contract awards to the Russian consultants. Out of 179 contracts, 116 for €4.19 million (33.48% of the value of contract awards to Russian consultants) were awarded by direct selection. The main areas of expertise were in the municipal infrastructure, property and tourism, MSME and sustainable energy sectors, including the consultancy services in relation to Improving Energy Efficiency in Russian Public Buildings Project (Phase 1) (Consultant: The Institute for Urban Economics, Russia, Contract Value: €2,176,240, Funding Source: The Global Environmental Facility II Fund). Many of the Russian consultants engaged by the Bank were Russian offices of international firms such as KPMG, COWI, Ernst & Young, Roland Berger and others. Consultancy contract awards to German consultants amounted to €11.83 million (a 6.98% share) for 86 contracts. There was a considerable drop in value of contract awards to German Consultants compared to the previous years (€24.92 million in 2010 and €17.83 million in 2009). Out of €11.83 million worth of contracts awarded to the German consultants, 93.66% were TC funded, and 86.75% (€10.26 million for 32 contracts) were awarded following a competitive selection process. The main industry sectors that German consultants excelled in included MSME, financial institutions, power and energy and municipal infrastructure.
18
It should be noted that the Bank’s reporting on consultants’ nationality is based on the office location of the lead firm. This can distort the nationality reporting in two ways. Firstly, many of the lead consultants are global or multinational firms that choose their bidding office location depending on the requirements of the assignment. For example, “nationality” of Ernst and Young was reported as French, Kazakh or Russian, depending on the location of their office that entered into a contract with the Bank. Secondly, nationalities of associated firms or consultants engaged as subcontractors or as non-lead members of consortia are not reported on. This is significant if one takes into account that nearly a quarter of the value of all contract awards by CSU was recorded as contract awards to consortia of firms (€31.30 million out of €132.39 million). Consultants’ participation in new assignments awarded through competitive selection by nationality is presented in Table 11 of the Annex. The table shows the number of expressions of interest by consultant nationality and the resulting contract awards by CSU for open competition (excluding competition among firms with framework agreements as these are already awarded and competition is limited to firms which have entered into framework agreements), as well as the level of response for contracts awarded following “targeted” selection. Again, nationality of bidders is based on the country from which an expression of interest was submitted. For open competition, British and German consultants were the most responsive and had the highest number of contract awards. 6.2 Consultants from the Bank’s Countries of Operations / Recipient Countries
Table 9 of the Annex details the value and number of contract awards to consultants from the Bank’s countries of operations in comparison to 2010, for TC, Bank and loan funded contracts as well as the number of contracts awarded directly and through a competitive selection process. In 2011, the value of contract awards to local consultants amounted to €36.61 million for 858 contracts. This represents a decrease of 8.52% in value and 7.84% in number of
consultancy contract awards compared to 2010 when 931 contracts with a total value €40.02 million were awarded to consultant offices located in the Bank’s countries of operations and recipient countries13. Included in the contract awards to local consultants were 371 contracts with total value €11.18 million by OGC. Russian consultants were the highest ranked nationality for contract awards by OGC (€5.86 million for 108 contracts).
13 Egypt, Morocco and Tunisia are not countries of operations yet but recipient countries
Distribution of Value of 2011 Contract Awards to
Consultants from Countries of Operation by Region
19%
8%
34%
26%13%
Central Europe and the Baltic StatesSouth-eastern EuropeEastern Europe and the CaucasusRussiaTurkey, Central Asia and SEMED

19
The 2011 highlights of contract awards to consultants from the Bank’s countries of operations included:
• Assignment: Kyrgyz Republic: Bishkek Solid Waste - Feasibility Study Consultant: Cemi Szolgaltato Korlatolt Felelossegu Tarsasag, Hungary Contract Value: €548,630, Funding Source: Early Transition Countries Fund
• Assignment: Polish SME Sustainable Energy Financing Consultant: Enviros, s.r.o, Czech Republic14 Contract Value: €397,704, Funding Source: EC-SME Finance Facility.
Analysis of consultancy contract awards to consultants from countries of operations shows that they are bidding and winning contracts not only in their own countries i.e. in domestic markets thereby showing participation in international markets / cross border and in the Bank’s other countries of operations. In 2011 consultants from the Russian Federation, Czech Republic, Romania and Hungary had the highest share of the value of contract awards among local consultants. The list of local consultants expanded with contract awards to consultants from Egypt, Morocco and Tunisia (12 consultancy contracts totalling €474,745 were awarded to consultants from these countries). It should be noted that the real participation of local consultants is wider than appears from this data, as the Bank’s reporting on nationality does not include local consultants that were sub-contracted by the lead firms directly engaged by the Bank and its clients, or those participating in the Bank’s assignments as non-lead members of consortia. The Audit Committee noted that the statistics may gain in informative value by including the nationality of subcontracting, as local consultants’ participation is estimated to be wider than reported. However it is not currently possible to capture participation of sub-contractors that are non-lead firms in consortia or subcontractors due to the limitations in CCS/TCS system. 7. Analysis of Consultancy Contracts by Contracting Department
The distribution of the contract awards by each respective department in 2011 in comparison to 2010 is presented in Table 1 of the Annex. In 2011, CSU was responsible for contracting 78.18% of the total value of consultancy contract awards by the Bank. CSU’s statistics include consultancy contracts for the SBS Team. The SBS consultancy contracts reported in Table 1 of the Annex and shown in the chart on the left are those issued prior to August 2011. With effect from August 2011, in line with the recommendation of
Internal Audit and subsequent TC Com discussion, the responsibility for contracting of consultants for the EGP Team was transferred from the SBS team to CSU. Contracting of BAS programme consultants and market development consultants providing services directly to the BAS Programme15 was transferred to CSU in 2009.
14 Czech Republic is the first country to graduate from the EBRD’s countries of operations and is no longer the country of operation however the Bank continues to monitor its portfolio in this country 15 Contracting of BAS project consultants advising clients is done by BAS clients, who are beneficiaries of business advisory services, through TC funded grant agreements that are prepared in the BAS Offices
Share of Value of Consultancy Contract
Awards by Contracting Department
CSU
78.18%
OGC
10.58%
SBS Team
2.34% Loans
8.91%

20
7.1 Consultancy Contracts Awarded by Consultancy Services Unit
In 2011, 1,787 contracts with a total value of €132.53 million were awarded through CSU, including 12 contracts totalling €0.48 financed from the NSA contracted for the Nuclear Safety Department. The CSU statistics for 2011 also includes 472 consultancy contract awards with a total value of €6.68 for the SBS Team.
In 2010, CSU awarded 1,566 contracts with a total value €135.74 million. Compared to 2010, the number of contract awards by CSU increased by 14.11% and the value of contract awards decreased by 2.36%. The increase in number of contracts was due to the SBS contracts being transferred to CSU and included in CSU’s statistics. Without the SBS team’s contracts issued by CSU in 2011, a year on year comparison in number and value of contract shows a decrease of 19.09% and 7.39% respectively. 1,210 new contracts amounted to €98.06 million, whereas 577 contract extensions (in value with additional scope of work) amounted to €34.47 million. Among contract awards by CSU, there were 904 contracts totalling €95.08 million financed with TC funds, and 883 contracts with total value of €37.45 million financed with the Bank’s budget. The two tables below and overleaf show the distribution of TC and Bank funded contract awards by consultant selection methods in 2011, 2010 and 2009.
CSU Contract Awards: TC Funds
2011 2010 2009
Value, €
% of Total
Value No Value, €
% of Total
Value No Value, €
% of Total
Value No
Direct Selection 11,141,572 11.74% 581 7,576,031 7.45% 369 7,110,820 9.43% 296 Direct Selection Section 5.9 5,327,634 5.61% 66 6,440,271 6.33% 121 5,844,814 7.75% 99 Selection From Shortlist 15,793,718 16.63% 153 18,634,657 18.33% 185 8,337,618 11.06% 107 Evaluation of Proposals 62,678,172 66.02% 104 69,027,319 67.89% 127 54,106,018 71.76% 134
94,941,096 100% 904 101,678,278 100% 802 75,399,270 100% 636
The increase in the number and value of directly awarded TC funded contracts is explained by the transfer of consultancy contracts from SBS team to CSU.
Consultancy Contract Awards by CSU
including NSD, 2007-2011
€132.53m
€88.97m€81.72m
€110.70m
€135.74m
0
20
40
60
80
100
120
140
160
2007 2008 2009 2010 2011
Val
ue,
€ m
illi
on
17871063 1100 1409 1566

21
CSU Contract Awards: Bank’s Budget
2011 2010 2009
Value, €
% of Total Value
No Value, € % of Total Value
No Value, € % of Total Value
No
Direct Selection 11,252,570 30.05% 498 9,246,767 27.15% 375 9,548,962 27.05% 397 Direct Selection Section 5.9 3,299,815 8.81% 54 4,444,547 13.05% 70 4,064,960 11.52% 62 Selection From Shortlist 21,059,263 56.23% 314 17,314,483 50.84% 288 15,677,408 44.41% 299 Evaluation of Proposals 1,840,693 4.91% 17 3,052,489 8.96% 31 6,009,430 17.02% 15
37,452,341 100% 883 34,058,286 100% 764 35,300,760 100% 773
The increase in the number and value of directly awarded Bank funded contracts is explained by the increase in the Bank’s business volume. Consultant Selection Methods for Individuals and Firms
Among the 1,787 contracts awards by CSU, there were 797 contracts with a total value of €25.83 million for individual services, and 990 contracts for €106.56 million with firms and lead firms of consortia. The two tables below compare the value and number of contract awards by selection methods for individual and consulting firms, for 2011 and 2010. Selection from shortlist is the most competitive method used for selecting individual consultants. The increase in the number and value of directly awarded contracts to individual consultants is explained by inclusion of SBS Team’s contracts into CSU’s statistics.
Individual Consultants*
2011 2010
Value, € % of Total
Value No Value, €
% of Total Value
No
Direct Selection 6,124,900 23.71% 461 3,508,374 15.12% 233 Direct Selection Section 5.9 3,869,685 14.98% 89 4,854,235 20.91% 153 Selection From Shortlist 15,835,508 61.31% 247 14,846,874 63.97% 253
25,830,093 100% 797 23,209,483 100% 639 * Including individuals engaged through firms, whereas consultant selection was made based on the individual consultant’s qualifications and experience.
Firms/Consortia of Firms*
2011 2010 Value, €
% of Total Value
No Value, € % of Total
Value No
Direct Selection 16,269,243 15.25% 618 13,311,635 11.83% 510 Direct Selection Section 5.9 4,757,764 4.46% 31 6,033,372 5.36% 39 Selection From Shortlist 21,017,473 19.82% 220 21,102,267 18.75% 220 Evaluation of Proposals 64,518,864 60.47% 121 72,079,807 64.06% 158
106,563,344 100% 990 112,527,081 100% 927 * Lead Firm is contracted
In 2011, CSU published 183 procurement notices inviting expression of interest in consultancy assignments on the Bank’s website; compared with 176 in 2010, 172 in 2009, 147 in 2008, and 177 in 2007 (not all of them resulted in a contract award in the same year). CSU continued to prepare grant agreements for consultancy funded by Investment Cooperation Funds.

22
Multiple Contract Awards
The 1,787 consultancy contracts totalling €132.53 million awarded by CSU included stand alone contracts and extensions in value, as well as framework agreements and call-off notices under existing framework agreements. Framework agreements are instruments used by the Bank for retaining of consultants for performance of similar or repetitive assignments. Following competitive selection, consultants are awarded framework agreements which contain broad terms of reference defining the nature and scope of services that may be required and applicable fee rates. Only as and when the Bank identifies the requirement for specific services, an individual call-off notice is awarded. For the purposes of analysis of multiple contract awards in this section, framework agreements, as instruments for contracting consultants for multiple repetitive assignments, and call-off notices have been separated from other contract awards. The 1,457 consultancy contracts, excluding framework agreements and call-off notices, were awarded to 980 consultants (either individuals or firms). Regional offices of multinational consulting firms located in different countries are reported by CSU as separate contracting entities. Out of 980 consultants, 880 had one or two contract awards each, 55 consultants had three contract awards each, 21 consultants had four contract awards each and the remaining 24 consultants had five or more contract awards. Among the 24 consultants with five or more contract awards, there were seven individual consultants (six of which were EGP team coordinator and one external board nominee director), and 17 consultancy firms.
The table below lists 17 consultancy firms with five or more contract awards (excluding call-off notices and framework agreements) by consultant selection method.
Number of Contracts Value, €
Area of expertise Direct
Selection
Competitiv
e Selection Total
Direct
Selection
Competitiv
e Selection Total
The Risk Advisory Group Plc, UK Pre-employment screening 12 0 12 113,195 0 113,195
Ascentia, UK Training and Coaching 7 2 9 93,501 60,153 153,654
Mott Macdonald Ltd, UK Engineering and Environmental
5 2 7 146,631 2,501,399 2,648,030
Studio Legale Tributario Associato (DLA Piper Milan), Italy
Legal 7 0 7 227,000 0 227,000
Act Partnership, Turkmenistan Legal 6 0 6 69,850 0 69,850
D’Appolonia S.p.A., Italy Energy Efficiency 3 3 6 106,000 1,334,070 1,440,070
WS Atkins International Ltd, UK Industry & Manufacturing 3 3 6 151,684 298,294 449,978
AF-Consult Ltd, Finland Engineering 1 4 5 72,965 395,079 468,044
Arcadis, UK Property Management 5 0 5 205,914 0 205,914
COWI A/S, Denmark Engineering & Environmental
2 3 5 68,000 1,165,218 1,233,218
FPC, Belgium Fire & Safety 5 0 5 33,937 0 33,937
IC Consulenten Ziviltechniker Gesmbh, Austria
Engineering 0 5 5 0 2,316,866 2,316,866
Keystone Resilience Limited, UK Business Continuity 5 0 5 80,605 0 80,605
Metro Consulting Services, Taipei China
Municipal Infrastructure 3 2 5 115,530 270,450 385,980
MWH Spa, Italy Energy Efficiency 2 3 5 75,300 5,068,210 5,143,510
PJR Management Pty Ltd, Australia Engineering and Environmental
2 3 5 45,507 150,635 196,142
Seaspan Shipping Ltd, UK Shipping 5 0 5 160,370 0 160,370

23
The table below lists multiple awards to the 17 consultancy firms with five or more contract awards by funding source.
TC Funds Bank Budget TOTAL
Number Value, € Number Value, € Number Value, €
The Risk Advisory Group Plc, UK 0 0 12 113,195 12 113,195
Ascentia, UK 0 0 9 153,654 9 153,654
Mott Macdonald Ltd, UK 1 2,252,620 6 395,410 7 2,648,030
Studio Legale Tributario Associato (DLA Piper Milan), Italy 7 227,000 0 0
7 227,000
Act Partnership, Turkmenistan 6 69,850 0 0 6 69,850
D’Appolonia S.p.A., Italy 5 1,405,670 1 34,400 6 1,440,070
WS Atkins International Ltd, UK 0 0 6 449,978 6 449,978
AF-Consult Ltd, Finland 2 272,965 3 195,079 5 468,044
Arcadis, UK 0 0 5 205,914 5 205,914
COWI A/S, Denmark 3 1,165,218 3 68,000 5 1,233,218
FPC, Belgium 5 33,937 0 0 5 33,937
IC Consulenten Ziviltechniker Gesmbh, Austria 5 2,316,866 0 0
5 2,316,866
Keystone Resilience Limited, UK 0 0 5 80,605 5 80,605
Metro Consulting Services, Taipei China 5 385,980 0 0 5 385,980
MWH Spa, Italy 2 5,043,210 3 100,300 5 5,143,510
PJR Management Pty Ltd, Australia 0 0 5 196,142 5 196,142
Seaspan Shipping Ltd, UK 0 0 5 160,370 5 160,370
Consultancy firms with the highest number of multiple awards by each of the banking teams are listed below. For the reason described above call-off notices and framework agreements have been excluded from this analysis.
Banking Team Consultant Name, Nationality Number Value, €
Financial Institutions including Group for Small Business
IPC – Internationale Projekt Consult GmBH, Germany 3 3,979,840
DAI Europe Ltd, UK 3 3,732,924
Frankfurt School of Finance & Management, Germany 4 250,000
Energy and Natural Resources PJR Management Pty, Ltd, Australia 3 115,347
Morning Star, USA 2 191,311
Energy Efficiency & Climate Change
Economic Consulting Associates, UK 4 2,049,741
MWH S.p.A., Italy 4 2,595,000
WS Atkins International Ltd, UK 3 0
Industry, Commerce and Agribusiness (excluding SBS Group)
Jones Lang Lasalle LLC 3 68,721
Birgli AG 3 214,000
WS Atkins International Ltd, UK 3 180,949
Infrastructure
D’Appolonia S.p.A., Italy 5 615,070
Metro Consulting Services, Taiwan 5 385,980
Seaspan Shipping Ltd, UK 5 160,370
Turkey, Eastern Europe, Caucasus and Central Asia
Act Partnership 6 69,850
Akhmedov, Azizov, Abdulhamidov, Attorneys (Simple Partnership)
4 29,156
Avesta Investment Group LLC 4 36,058
Central and South Eastern Europe
Studio Legale Tributario Associato (DLA Piper Milan), Italy
4 150,000
Studio Legale Associato In Associazione Con Linklaters LLP, Italy
2 89,975

24
Framework Contracts/Agreements and Call-Off Notices Analysis
Framework Contracts
The details of seven framework contracts awarded in 2011 are listed in Section 8 of the Report. The total value of the six TC funded and one Bank funded framework contracts amounted to €6,810,212. Call-off notices issued under the framework contracts are not included in the consultancy contract statistics to avoid double counting. The maximum number of call-off notices under a framework contract awarded in 2011 was to MWH S.p.A. for the Mid-size Sustainable Energy Financing Facility Extension (a total of 12 call-off notices were issued). Framework Agreements
Table 6 of the Annex details the 15 framework facilities with their respective potential values and lists consultants awarded framework agreements in 2011. These included 10 TC funded framework facilities with potential value of €10 million approved by the donors, and five Bank funded framework facilities which do not have a maximum value. The 46 framework agreements awarded in 2011 included 12 framework agreements to the EGP team coordinators. All framework agreements are recorded with zero value as financial commitments are made at the call-off notice award level. In 2011 there were 283 call-off notices with a total value €9.84 million awarded under framework agreements. 222 call-off notices were awarded to consultancy firms, and 61 to individual consultants. The table below provides the names of individual consultants with call-off notices awarded in 2011. The list of firms excluding individuals with respective number and value of call-off notice awards by funding source in 2011 is presented in the table overleaf. All framework agreements with individuals are awarded for EGP Team Coordinators. For transparency the table below lists the number of call-off notices and extensions awarded to the EGP coordinators that were previously highlighted as an area of concern.
Type of Services Number of Call-off
Notices in 2011
Atena Duicu EGP Team Coordinator 1 Brian Ballingall EGP Team Coordinator 3 Robin Drewett (EMD Skills Ltd) EGP Team Coordinator 2 Chris Rudd (Fineco Ltd) EGP Team Coordinator 4 Frederic Giovannetti Environmental Services 7 Harmut Voelkl EGP Team Coordinator 5 John Emanuel EGP Team Coordinator 4 John Eskebaek EGP Team Coordinator 5 John Gore EGP Team Coordinator 6 Ozren Tosic EGP Team Coordinator 11 Bernand Keim (Pegasos UG) EGP Team Coordinator 4 Tetsuo Fukuyama (Truspire Co., Ltd) EGP Team Coordinator 1 Vasilis Kyriakou EGP Team Coordinator 5 Vittorio Mattiuzzi EGP Team Coordinator 3
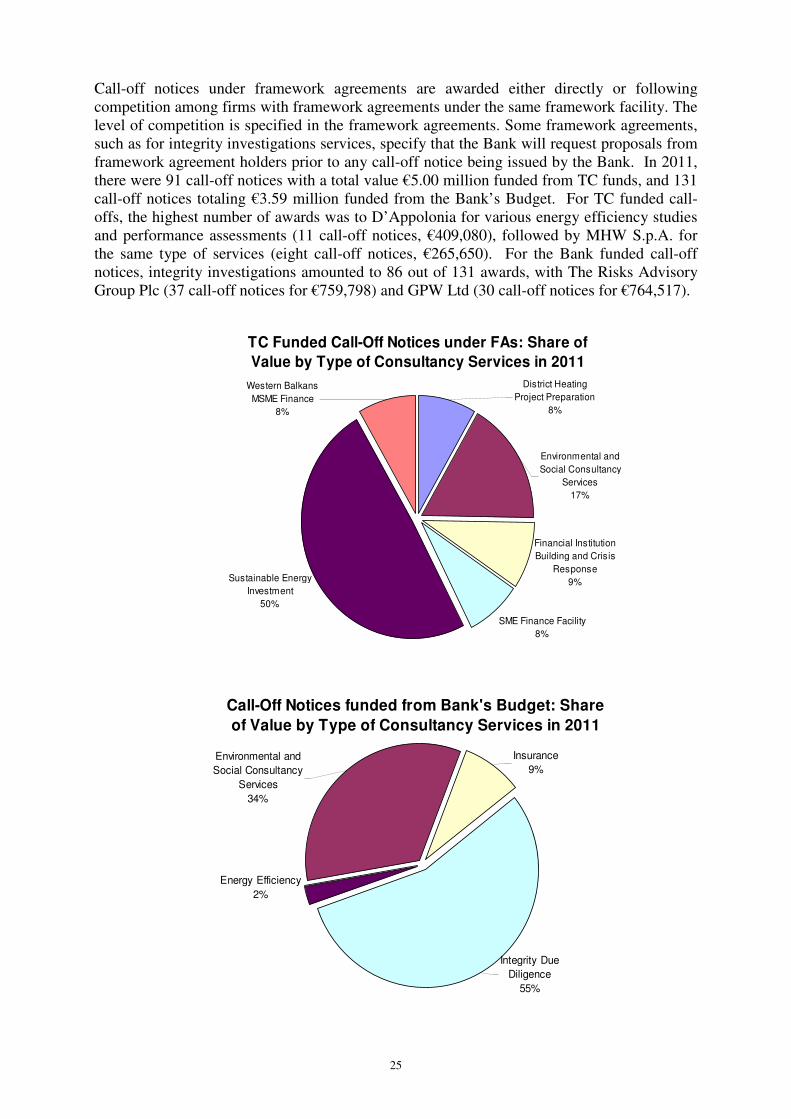
Depending on type of services provided under framework agreements, the Bank’s budget is used to finance services where the Bank is the beneficiary of the services such as integrity investigations and environmental due diligence, whereas TC funds financed services for the benefit of the Bank and its clients. To mitigate risks associated with provision of the services to the Bank’s clients, the clients are asked to exclude the Bank from any liability and waive any conflict of interest.
25
Call-off notices under framework agreements are awarded either directly or following competition among firms with framework agreements under the same framework facility. The level of competition is specified in the framework agreements. Some framework agreements, such as for integrity investigations services, specify that the Bank will request proposals from framework agreement holders prior to any call-off notice being issued by the Bank. In 2011, there were 91 call-off notices with a total value €5.00 million funded from TC funds, and 131 call-off notices totaling €3.59 million funded from the Bank’s Budget. For TC funded call-offs, the highest number of awards was to D’Appolonia for various energy efficiency studies and performance assessments (11 call-off notices, €409,080), followed by MHW S.p.A. for the same type of services (eight call-off notices, €265,650). For the Bank funded call-off notices, integrity investigations amounted to 86 out of 131 awards, with The Risks Advisory Group Plc (37 call-off notices for €759,798) and GPW Ltd (30 call-off notices for €764,517).
TC Funded Call-Off Notices under FAs: Share of
Value by Type of Consultancy Services in 2011
Financial Institution
Building and Crisis
Response
9%
SME Finance Facility
8%
Sustainable Energy
Investment
50%
Environmental and
Social Consultancy
Services
17%
Western Balkans
MSME Finance
8%
District Heating
Project Preparation
8%
Call-Off Notices funded from Bank's Budget: Share
of Value by Type of Consultancy Services in 2011
Energy Efficiency
2%
Environmental and
Social Consultancy
Services
34%
Insurance
9%
Integrity Due
Diligence
55%

26
7.2 Contracts awarded by OGC In 2011, OGC awarded 571 contracts with a total value €17.91 million. This represents a 12.18% increase in numbers and a 7.05% increase in value of OGC contract awards compared to 2010 (509 contracts for €16.73 million). Out of 571, 461 contracts with a total
value of €9.71 million were awarded by direct selection from the OGC database of registered law firms. Further 33 contract extensions with an aggregate value of €1.25 million were awarded directly under Section 5.9 of the Bank’s PP&R. The remaining 77 contracts totalling €6.95 million were awarded following competitive selection. 522 contracts totalling €17.13 million were for the needs of the Banking Department. The remaining 49 contracts for €0.78 million were for the needs of non-Banking departments. Analysis of contracts by country of operation were project was located shows that 37.98% of the value of all consultancy contract awards by OGC were for the projects in Russian Federation (€6.80 million for 138 contracts), followed by 10.91% related to the projects in Ukraine (€1.95 million for 67 contracts), and 6.88% for projects in Turkey (€1.23 million for 26 contracts). In terms of consultant nationality, law firms based in the Russian Federation had a 32.72% share of the value of OGC contract awards (€5.86 million, 108 contracts), closely followed with 32.62% share by law firms based in UK (€5.84 million, 159 contracts). The remaining 43 nationalities of law firms by location of office contracted by OGC had a much smaller share of value of contract awards (with Poland being the highest at 4.21%). The table below lists the ten law firms, regardless of location, with the highest aggregate value of contracts awards by OGC in 2011, in each case also indicating the number of contacts. In almost all cases the Bank contracted offices of the listed firms in more than one country.
Number Value, €
Linklaters 16 1,945,924 White & Case 26 1,667,066 Allen & Overy 21 1,157,408 Gide Loyrette Nouel 29 1,119,716 Clifford Chance 21 983,180 Salans 19 962,786 Bird & Bird 26 760,066 CMS Cameron McKenna 22 690,918 Baker Botts 20 579,079 Radu Tărăcilă Pădurari Retevoescu SCA 20 518,000
Retention of Outside Counsel by OGC, 2007-2011
€16.73m€14.52m €13.64m
€17.91m€14.66m
0
5
10
15
20
2007 2008 2009 2010 2011
Val
ue
392 346 454 509 571

27
The next table lists the ten law firms, regardless of location, with the highest number of contracts awarded in 2011, in each case also indicating the aggregate contract value. Again, most cases the Bank engaged offices of the listed firms in more than one country.
Number Value (€)
Gide Loyrette Nouel 29 1,119,716
Bird & Bird 26 760,066
White & Case 26 1,667,066
CMS Cameron McKenna 22 690,918
Allen & Overy 21 1,157,408
Cleary Gottlieb Steen & Hamilton LLP 21 184,998
Clifford Chance 21 983,180
Baker Botts 20 579,079
Radu Tărăcilă Pădurari Retevoescu SCA 20 518,000
Salans 19 962,786
It will be noted that some firms appear on both lists, while others feature in only one of the lists. Most assignments for these firms are separate retentions of offices in the Bank’s countries of operations, including e.g. Moscow, Kiev, Warsaw and Bucharest. These assignments relate primarily to Banking operations in the respective countries, where the number of firms able to assist within significant cross-border financial transactions remains limited. The London-based Bird & Bird also appears on the lists as it has been engaged for various lower-value assignments averaging some Euro 30,000 per assignments, for providing English law advice in the context of specific Banking operations. In the case of Cleary Gottlieb, the assignments related to borrowing transactions in the form of debt securities placed with US investors. In implementing Paragraph 5.6 of the Procurement Policies and Rules, OGC applies competitive procedures for assignments estimated to cost €75,000 or above. The shortlists of firms to be invited to compete for individual assignments above that value are constructed from among firms that have responded to an invitation posted on the Bank's website for expressions of interest in all appropriate assignments by EBRD falling in their particular areas of expertise and have been registered in the "OGC Database of Registered Law Firms". While in the case of non-legal assignments invitations for expressions of interest are posted for each specific assignment, the general invitation of expressions of interest for legal assignments on ebrd.com and registration of responding firms on the "OGC Database of Registered Law Firms" takes account of the following special considerations:
• A public invitation for expressions of interest for each specific legal assignment would require the disclosure of confidential or commercially sensitive client information and hence would not be compatible with the Bank's obligation to preserve the confidentiality of such information.
• OGC's reliance on its OGC Database of Registered Firms serves to streamline the competitive selection of outside counsel. It also makes best use of OGC's expertise regarding the capabilities of firms and practitioners operating in the Bank's countries of operations and other significant jurisdictions.
Notwithstanding these variations from the Bank’s selection process for non-legal assignments, the OGC approach serves the same fundamental objectives by ensuring that a large number of firms have the opportunity to be considered for each assignment.

28
The costs of engagement of outside counsel by OGC for operations, funded from the Bank’s budget, are mainly recoverable from the clients as part of transaction costs.
7.3 Consultancy Contracts for the Small Business Support (SBS) Team
In January 2012, the TAM/BAS team was renamed the Small Business Support (SBS) team in line with the Strategic Plan which was Board approved at the end of 2010. The TAM programme has been renamed the Enterprise Growth Programme (EGP) and the name of Business Advisory Services (BAS) Programme remained unchanged. Following the Internal Audit’s recommendation and subsequent TC Com discussion, the responsibility for contracting EGP coordinators was transferred to CSU with effect from August 2011. From January to August 2011, there were 419 contract awards with a total value €3,960,272 to EGP consultants by the SBS team. In addition, CSU issued 472 consultancy contracts with a total value of €6,676,819 for the SBS Team, bringing the combined total
number and value of 2011 consultancy contracts for the SBS team to 891 and
€10,637,091 respectively. This figure includes contracts for EGP Coordinators as well as BAS programme consultants and market development contracts (the responsibility for BAS contracts was transferred to CSU in 2009). The main sources of funding for SBS team’s contracts were SSF (198 contracts totalling €2,097,383), Japan Technical Cooperation Fund (121 contracts, €1,561,888), and various EU funding programmes, most notably EU TAM/BAS Programme in Eastern Partnership Countries (57 contracts, €1,251,571) and EU Support for Business Development in Kosovo through TAM (94 contracts, €812,277). Among other bilateral TC fund donors providing financing for the SBS team were Austria, Belgium, Italy, Finland, Germany, Greece, Korea, Luxemburg, the Netherlands, Portugal, Sweden, Switzerland and Taiwan. Out of 891 contracts, 835 with a total value €9,231,536 were recorded as awarded through direct selection, with further 56 contracts totalling €1,405,555 awarded through selection from shortlist. It should be noted that SBS team has two permanent procurement notices on the Bank’s website offering opportunities for experienced international directors, industry experts and financial specialists (for EGP) and local consultants (for BAS) to register with the Bank16.
Value, €
% of Total
value Number
SBS team’s consultants represented 51 different nationalities with British, Japanese and Danish consultants having the highest share of the value of contract awards. The table provides consultant nationality breakdown for the top ten consultant nationalities with respective value and number of contract awards.
British 1,335,382 12.55% 116 Japanese 1,079,479 10.15% 95 Danish 722,592 6.79% 75 Italian 649,165 6.10% 99 Greek 455,791 4.28% 37 Canadian 421,071 3.96% 25 Irish 415,779 3.91% 32 German 355,621 3.34% 29 Kazakh 309,217 2.91% 13 Austrian 284,337 2.67% 37 Other 4,608,657 43.34% 333
10,637,091 100% 891
It should be noted that contracting of BAS Project consultants is done by BAS clients, i.e. beneficiaries of business advisory services. Grant agreements for part payments of TC funds are prepared by BAS Programme consultants in BAS Offices in countries of operations. In
16 http://www.ebrd.com/pages/workingwithus/sbs/work.shtml

29
2011, 1,324 Grant agreements were signed by the Bank for BAS projects for a total value of €6.2m. The total net value of the underlying consultancy assignments amounts to €11.4m of which the remaining €5.2m were paid by BAS clients (46% of the total value of the assignments as client contributions). Client cost sharing is the BAS business model. 7.4 Loan Funded Contracts
In 2011, there were 20 consultancy contracts with an aggregate value of €15.09 million funded by loan proceeds of public sector operations and awarded by the Bank’s borrowers directly. These operations were 100% financed by the Bank. In 2010, there were 17 consultancy contracts totalling €16.04 million funded by loan proceeds in public sector operations with the Bank’s financing amounting to 94.72%. The number and value of public sector loan funded consultancy, although small, is dependent on the type of projects being financed by the Bank’s loans in public sector operations. The loan funded contracts are also reported in the Annual Procurement Review prepared by Procurement Department. 8. Contracting Methods Table 5 of the Annex summarises the value and number of contract awards by contract type. 1,335 contracts with a total value €85.58 million (or 49.52% of value of all contract awards) were awarded as CSU stand alone standard contracts with the Bank as the contracting party, which is at a similar level as in the previous year when there were 1,212 stand alone contracts worth €88.35 million (or 50.49% of value of the 2010 contract awards).
Client contracting refers to TC funded consultancy assignments which are managed by the clients, as an important instrument in the provision of TC assistance. The Bank’s clients, as beneficiaries of services are able to select, engage and manage consultants in accordance with the Bank’s PP&R and donor requirements. CSU advises and assists the clients on all aspects of management of TC assignments and ensures compliance with the Bank’s PP&R and the necessary procedures, including provision of any necessary specimen documents, assistance in formulation of terms of reference for selecting and contracting consultants, drafting and publishing procurement notices, issuing requests for proposals, preparing consultancy contracts and funding agreements, monitoring the quality of the services provided and coordinating the administration of consultancy contracts. The Bank also makes payments
directly to consultants upon receipt of a statement of approval signed by the clients. This structure provides for avoidance of conflict of interest for the Bank as the lender and the party managing consultants during project implementation. It also enables capacity building as most often TC funded assignments are implemented prior to procurement of contracts under loan proceeds, resulting in a “learning curve”/ training of new clients, greater “ownership”
of the assignment and thus adding to the transition impact and capacity building.
Client
Original invoice
Payment of InvoicesConsultantBank
Grant Agreement
Copy invoice
Contract for
Consultancy ServicesStatement of
Approval
Client
Original invoice
Payment of InvoicesConsultantBank
Grant Agreement
Copy invoice
Contract for
Consultancy ServicesStatement of
Approval

30
In 2011, there were 104 consultancy assignments contracted and managed by the Bank’s clients. The total value of these consultancy contracts was €29.96 million (or 17.36% of the value of all contracts). In 2010, there were 134 such contracts totalling €36.36 million (or 20.78% of the value of all contract awards in 2010).
Number of Grant Agreements
Value, € million
The numbers and values of client contracted consultancy assignments in the past five years are provided in the table, generally showing an increase in the value of contracts where the clients were the beneficiaries and recipients of consultancy services.
2007 66 10.22 2008 89 17.45 2009 109 27.79 2010 134 36.36 2011 104 29.96
To address concerns raised in relation to increased dependency of the Bank’s clients on TC funds, on 18 January 2011 the Board of Directors approved the Donor Fees and Cost Sharing Policy (BDS10-249 (Rev 2)), and guidelines have been developed for operation leaders of
EBRD projects to ensure that cost sharing with the Bank’s clients is applied where appropriate. Increasingly grant agreements signed with the Bank’s clients stipulate financial and other contributions by the clients such as provision of office space, telephone lines, workshop venues etc. CSU’s records show that in 2011 nine grant agreements included a cost
sharing element with defined financial contributions from the clients ranging from 10% to 50%. Further six grant agreements detailed contributions in kind, e.g. use of computers, interpreters and airport transfers. Client Contracting by Country of Operation in 2011
Number Value, €
Ukraine 9 5,876,930 Russian Federation 16 3,978,221 Kazakhstan 9 2,484,353 Georgia 6 2,453,997 Kyrgyz Republic 3 2,145,770 FYR Macedonia 7 2,087,947 Moldova 7 1,998,636 Serbia 9 1,664,425 Tajikistan 7 1,190,774 Mongolia 3 1,113,290 Romania 3 1,069,430 Montenegro 4 867,680 Turkey 4 833,440 Croatia 3 603,000 Armenia 6 599,524 Bosnia & Herzegovina 2 538,565 Turkmenistan 2 248,224 Albania 3 195,512 Bulgaria 1 6,550
104 29,956,268
2011 Client Contracting by Banking Team
Transport:
16 contracts
€6.13m
Financial
Institutions:
17 contracts,
€2.60m
Others:
26 contracts,
€6.77m
Municipal and
Environmental
Infrastructure:
45 contracts,
€14.46m

31
CSU’s analysis of the client contracted consultancy assignments in 2011 shows that a large number of these contracts were in relation to the projects in the Early Transition Countries. In 2011, CSU increased its involvement in overseeing all aspects of client managed TC assignments, including oversight of consultant selection process, client training and attendance of evaluation meetings. The EBRD’s Guidelines for Clients Managing TC funded consultancy assignments were revised and published on the Bank’s website in English and Russian.17 CSU is developing a training programme for the Bank’s clients to enable further capacity building and training of the Bank’s clients. Framework contracts and framework agreements
18 are used by the Bank as instruments for retention of consultants for repetitive, similar assignments requiring same / similar expertise. Following competitive selection, consultants are awarded framework agreements with broad terms of reference defining the nature and scope of the services that may be required. The consultants are only mobilised as and when the Bank identifies the requirement for a specific assignment and awards a call-off notice (either directly or following evaluation of proposals submitted by consultants with framework agreements) which contains the specific terms of reference and budget for the assignment.
Number of Framework
Contract awards Number of Framework
Agreement awards
In 2011, the EBRD awarded 46 framework agreements and seven framework contracts, showing a marked increase in use of these instruments by the Bank.
2006 1 22 2007 2 35 2008 1 27 2009 1 19 2010 3 32 2011 7 46
The seven framework contracts and extensions were as follows:
Facility Consultant Value, € Funding Source
Mid-size Sustainable Energy Financing Facility Extension
MHW S.p.A., Italy 2,022,475 EU Private Sector Support Facility for Turkey
Diagnostics and Update of Laws - EBRD-UNCITRAL Initiative on Public Procurement in CIS and Mongolia
Crown Agents, UK 1,600,000 Shareholder Special Fund
Belarus: Implementation of the Belarus Sustainable Energy Finance Facility
KPMG Ceska Rebublic, S.R.O.
1,458,335 Czech Republic ODA TC Fund
Regional: Western Balkans Sustainable Energy Direct Financing Facility ("WeBSEDFF") - Institutional Capacity Building – Extension
Economic Consulting Associates Ltd, UK
1,200,000 Shareholder Special Fund
Western Balkans Sustainable Energy Direct Financing Facility Institutional Capacity Building – Extension
Economic Consulting Associates Ltd, UK
300,000 The New Norway Cooperation Fund
Regional: Quick Assessment of Energy Performance within the Built Environment
ENSI Energy Saving International AS, Norway
150,000 The New Norway Cooperation Fund
Appian Application Support Framework Contract Appian Corporation, US 79,402 Bank budget
Table 6 of the Annex details the framework facilities values and lists the consultants awarded framework agreements in 2011. In 2011, there were 283 call-off notices totalling €9.84 million awarded under existing framework agreements out of which 94 for €4.48 million were awarded following competition amongst consultants with framework agreements. In 2010, there were 180 call-off notices
17 http://www.ebrd.com/pages/workingwithus/procurement/consultancy.shtml 18 The distinction between a framework agreement and a framework contract is that a framework agreement does not have a committed budget (ceiling on value) when the framework agreement is entered into. For the majority of Bank funded framework facilities there are no upper limits on the value of framework agreements; for framework agreements funded from TC/Special Funds an overall facility amount is referred to during selection processes. The value of framework agreements is reported as zero for both Bank funded and TC funded assignment and values of call-off notices, therefore, depend on the budget for specific assignments as per call-off notices.

32
totalling €9.32 million awarded under existing framework agreements, out of which 98 for €6.48 million were awarded following competition amongst consultants with framework agreements. Pre-selected panels of experts allow the users of consultancy services to mobilise experts in various fields, such as board nominees, industry specialists, water and urban transport specialists and institution building experts, at short notice. 9. Performance of Consultants The Bank maintains a Consultant Assignment Reporting (“CAR”) system which is designed as a tool for reporting on TC and Bank funded consultancy assignments. CAR is a database containing information provided by operation leaders throughout the Bank on consultants’ performance. The CAR TC Funded Module is used to generate reports for the donors of TC funds. CAR reports for consultancy contracts funded from the Bank’s budget are reviewed by CSU and are intended to be used to provide feedback information on consultants’ performance to users of consultancy services across the Bank as and when required. CAR is an important tool in ensuring value for money from consultancy assignments, and provides the Bank with feedback to ensure that user departments are informed of any instances where a proposed consultant may have performed sub-standard work on a previous assignment. The chart presents ratings of consultants’ performance for contracts funded from the Bank’s budget by year of contract award for which CAR reports have been completed by the Bank’s operation leaders to date. The chart presents ratings of consultant’s performance for contracts funded form the Bank’s budget by year of contract award for which CAR reports have been completed by the Bank’s operations leaders to date. CSU’s objective is to enhance monitoring of the evaluation of consultants’ performance through CAR application (Bank-funded module) more closely and enforce completion of CAR reports by the Bank’s operation leaders which will be used to guide the possible future selection and engagement of the same consultant and discuss any performance issues identified during the review of CAR report with the relevant users.
Ratings of Consultants Performance
for Contracts funded from the Bank's Budget
0%
20%
40%
60%
80%
100%
2007 2008 2009 2010 2011
Unsatisfactory
Marginal
Satisfactory
Good
Excellent

33
ANNEX - TABLES OF STATISTICS
Table 1 Total Value and Number of Consultancy Contract Awards by Contracting Department
Table 2 Total Value and Number of Consultancy Contract Awards by Funding Source (Technical Cooperation Funds, Bank Budget and Loan Funded)
Table 3 2011 Consultancy Contract Awards by Consultant Selection Method (Value and Number)
Table 4 2011 Consultancy Contract Awards by Country of Operations (Value and Number)
Table 5 Consultancy Contract Awards by Contract Type
Table 6 Framework Agreements Awarded in 2011
Table 7 2011Consultancy Contract Awards by Consultant Nationality (Value and Number)
Table 8 2011 Consultancy Contract Awards by Consultant Nationality and Selection Method (Value and Number)
Table 9 Consultants from EBRD Countries of Operations in 2011 and 2010
Table 10 2011 Consultancy Contract Awards by EBRD Department (Value and Number)
Table 11 Consultants’ Participation in Competitive Selection by Bidders’ Nationality for Consultancy Contract Awards by CSU in 2011
Table 12 2011 Consultancy Contract Awards funded by Technical Cooperation and Special Funds by Funding Agreement

34
Table 1 Total Value and Number of Consultancy Contract Awards by Contracting Department
* Contracted by CSU
** From August 2011 the responsibility for consultancy contracts for EGP (formerly Turnaround Management or TAM)
Coordinators and industry advisors was transferred to CSU. The statistics for the Small Business Support Team detailed separately
above are contracts by the SBS team awarded between January and August 2011
*** Contracted by the Bank’s borrowers
Value (€m) Number % of Total Value
2011 2010 2011 2010 2011 2010
Consultancy Services Unit 132.05 135.46 1,775 1,562 77.91% 77.53%
Nuclear Safety Department* 0.48 0.28 12 4 0.28% 0.16%
Office of the General Counsel 17.91 16.73 571 509 10.57% 9.51%
Small Business Support Team** 3.96 6.49 419 728 2.34% 3.69%
Loans *** 15.09 16.04 20 17 8.90% 9.11%
169.49 175.0 2,797 2,820 100% 100%

35
Table 2 Total Value and Number of Consultancy Contract Awards by Funding Source (Technical Cooperation, Bank Budget and Loan Funded)
TC Funded
Bank Budget Loan Funded TOTAL
Value
(€m)
(A)
Number
(B)
Value
(€m)
(C)
Number
(D)
Value
(€m)
(E)
Number
(F)
Value (€m)
(A)+(C)+(E)
% Yr/Yr
Value
Increase
/Decrease
Number
(B)+(D)+(F)
% Yr/Yr
Number
Increase /
Decrease
2005 50.22 963 42.74 925 8.33 11 101.29 -14.71% 1,899 17.22%
2006 68.25 1,100 51.96 964 14.84 13 135.05 33.33% 2,077 9.37%
2007 54.91 1,239 57.80 1,102 23.47 36 136.18 0.84% 2,377 14.44%
2008 65.91 1,331 41.38 1,087 12.93 16 120.22 -11.72% 2,434 2.40%
2009 85.66 1,587 48.94 1,227 2.57 7 137.17 14.10% 2,821 15.90%
2010 108.17 1,530 50.79 1,273 16.04 17 175.00 27.58% 2,820 -0.04%
2011 99.04 1,323 55.36 1,454 15.09 20 169.49 -3.15% 2,797 -0.82%

36
Table 3 2011 Consultancy Contract Awards by Consultant Selection Method (Value and Number)
Selection Method
Original
Contracts /
Extensions to
Previous
Contract
TC Funded Bank Budget Loan Funded TOTAL
(TC, Bank Budget and Loan Funded Contracts)
Value (€m)
(A)
Number
(B)
Value (€m)
(C)
Number
(D)
Value (€m)
(E)
Number
(F)
Value (€m)
(A)+(C)+(E)
% of
Total
Value
Number
(B)+(D)+(F)
% of
Total
Number
Direct Selection (< € 75K)
Original 12,574,229 626 19,105,636 801 316,338 5 31,996,204 18.88% 1432 51.20%
Extensions* 2,383,652 373 1,860,103 158 0 0 4,243,754 2.50% 531 18.98%
Direct Selection (> € 75K as per Section 5.9 (a), (b) & (c) of the Bank’s PP&R)
Original 3,080,485 10 1,153,184 9 0 0 4,233,668 2.50% 19 0.68%
Extensions** 2,391,113 57 3,397,923 78 0 0 5,789,036 3.42% 135 4.83%
Selection from Shortlist Original
14,724,765 111 13,604,063 190 0 0 28,328,828 16.71% 301 10.76%
Extensions*** 1,206,248 42 14,401,011 201 0 0 15,607,259 9.21% 243 8.69%
Evaluation of Proposals Original
48,091,796 82 993,977 12 14,772,947 15 63,858,720 37.68% 109 3.90%
Extensions*** 14,586,376 22 846,716 5 0 0 15,433,091 9.11% 27 0.97%
Total 99,038,663 1323 55,362,612 1454 15,089,285 20 169,490,560 100.00% 2797 100.00%
* Aggregate value of a previous contract and a contract extension did not exceed € 75K
** Aggregate value of a previous contract and an unforeseen contract extension exceeded € 75K and was justified on the basis of Section 5.9 (a), (b) or (c) of the Bank’s PP&R
*** Foreseen contract extensions to previous contracts awarded by Selection from Shortlist or Evaluation of Proposals

37
Table 4 2011 Consultancy Contract Awards by Country of Operations (Value and Number)
Contract Value (€) Number of Contracts % of Total Value
Russian Federation 28,995,082 375 17.11%
Regional* 16,997,767 267 10.03%
Ukraine 16,617,466 193 9.80%
Turkey 10,801,497 105 6.37%
Romania 9,958,836 95 5.88%
Kazakhstan 7,830,527 107 4.62%
Georgia 7,324,558 75 4.32%
Serbia** 5,863,891 117 3.46%
Moldova 4,953,800 69 2.92%
Mongolia 4,662,839 157 2.75%
Poland 4,399,663 26 2.60%
Bosnia and Herzegovina 4,292,484 72 2.53%
Kyrgyz Republic 4,003,952 72 2.36%
FYR Macedonia 3,592,720 85 2.12%
Armenia 2,992,091 82 1.77%
Bulgaria 2,815,029 34 1.66%
Montenegro 2,767,336 39 1.63%
Tajikistan 2,582,747 74 1.52%
Belarus 2,486,660 51 1.47%
Croatia 2,340,317 69 1.38%
Turkmenistan 1,276,727 53 0.75%
Albania 1,261,898 58 0.74%
Kosovo 1,144,270 105 0.68%
Azerbaijan 813,099 60 0.48%
Egypt 452,853 10 0.27%
Morocco 410,890 4 0.24%
Lithuania 277,789 9 0.16%
Slovak Republic 183,250 2 0.11%
Uzbekistan 134,116 13 0.08%
Latvia 122,732 3 0.07%
Czech Republic*** 115,643 5 0.07%
Tunisia 47,939 6 0.03%
Slovenia 23,784 2 0.01%
Hungary 18,046 1 0.01%
Estonia 7,508 2 0.00%
152,569,803 2497 90.01%
* Where more than one country of operations was the beneficiary of the services
** Including Kosovo
*** Effective 31st December 2007 the Bank’s operations in the Czech Republic is considered to have graduated. However, the Bank continues to manage its portfolio of projects in the Czech Republic.
EBRD HQ Related Assignments
Contract Value (€) Number of Contracts % of Total Value
of all Contracts
United Kingdom 16,920,754 300 9.99%

38
Table 5 2011 Consultancy Contract Awards by Contracting Structure (Value in € and Number)
* Framework Agreements are recorded as zero value
**The values and numbers of Call-Off Notices under Framework Contracts are not included in the total value of contracts to avoid double
counting (the values are recorded under Framework Contracts).
*** TAM contracts include awards up to the 5th August 2011, after this period CSU took over responsibility for TAM consultancy contract
awards (TAM renamed Small Business Support Team on 1st January 2012)
Contract Type
Value (€m) Number % of Total Value
2011 2010 2011 2010 2011 2010
CSU Standard Stand-alone Contracts (including BAS contracts)
85.44 88.35 1335 1212 49.43% 50.42%
Contracts signed directly by the Bank’s borrowers with use of public sector loan proceeds
15.09 16.04 20 17 8.73% 9.05%
Retention of Outside Counsel by OGC
17.91 16.73 571 509 10.36% 9.44%
Grant Agreements with the Bank’s Client (Consultancy Contracts are signed by the Bank’s Clients)
29.96 36.36 104 134 17.33% 20.52%
Call-Off Notices under Framework Agreements**
9.84 9.32 283 180 5.69% 5.26%
Call-Off Notices under Framework Contracts**
3.20 1.19 29 16 1.85% 0.67%
TAM Contracts*** 3.96 6.49 419 728 2.29% 3.66%
Nuclear Safety Department 0.48 0.28 12 4 0.28% 0.16%
Framework Contracts 6.81 1.36 7 3 4.03% 0.77%
Netherlands Emissions Reductions Cooperation Fund
0 0.06 0 1 0.00% 0.03%
Framework Agreements* 0 0 46 32 0.00% 0.00%
Total 172.84 176.19 2826 2836 100% 100%

39
Table 6 Framework Agreements Awarded in 2011
Framework Facility Name Funding Source Overall
Facility Value
Name /Nationality of Consultants awarded Framework
Agreements Duration
Regional: Framework on Energy
Performance Assessment & Corporate
Policy Support for Built Environment
Japan Technical
Cooperation Fund €428,800
• Hannah Consulting Ltd, Japan
• Padeco Co Ltd, Japan Two years
Russian Federation: Russia Small Business
Fund (RSBF) TC Programme
Russia Small Business
Fund $7,500,000
• Business and Finance Consulting GmbH, Germany
• DAI Europe Ltd, UK
• Frankfurt School of Finance and Management, Germany
4.5 years
Turkey and the Caucasus Sustainable
Energy Programme (TCSEP)
Spanish SEI Fund II ODA
Fund €530,600
• Gas Natural Fenosa Engineering (formerly Socoin
Ingeniería y Construcción Industrial), Spain
• Heymo Ingeniería S.A (Pöyry Management Consulting),
Spain
• Mercados - Energy Markets International S.A., Spain
Two years
Russian Federation: EBRD/UNIDO process
integration and process innovation support
for large industry - Pulp and Paper
Global Environmental
Facility €450,000
• AF Industry AB, Sweden
• Poyry Finland Oy, Finland
• WS Atkins International Limited, UK
Two years
Russian Federation: EBRD/UNIDO process
integration and process innovation support
for large industry – Machine Building
Global Environmental
Facility €450,000
• Agiplan GmbH, Germany
• MWH S.p.A., Italy
• Ove Arup and Partners International Ltd, UK
• WS Atkins International Limited, UK
Two years
Russian Federation: EBRD/UNIDO process
integration and process innovation support
for large industry - Cement
Global Environmental
Facility €450,000
• A TEC Production and Services GmbH, Germany
• MWH S.p.A., Italy
• WS Atkins International Limited, UK
Two years
Russian Federation: EBRD/UNIDO process
integration and process innovation support
for large industry - Ferrous Metals
Global Environmental
Facility €450,000
• MWH S.p.A., Italy
• Tebodin Eastern Europe BV, Russian Federation
• WS Atkins International Limited, UK
Two years
Russian Federation: EBRD/UNIDO process
integration and process innovation support
for large industry - Chemicals
Global Environmental
Facility €450,000
• KBC Process Technology Ltd, UK
• Jacobs Consultancy, UK
• Tebodin Eastern Europe BV, Russian Federation
Two years
Romania: EU Cohesion Funds Water Co-
financing Framework - Environmental and
Social Due Diligence
Spanish EBRD-ICEX
Technical Co-operation €125,100 • IDOM S.A., Spain One year

40
Table 6 (cont.) Framework Agreements Awarded in 2011
Framework Facility Name Funding Source
Overall
Facility
Value
Name /Nationality of Consultants awarded Framework
Agreements Duration
Ukraine MSME Technical Co-operation
Programme
• NIF Trust: Financial
Sector Institution
Building & Crisis
Response
• The Danish Rural
Financial Services
TC Fund
€1,250,000 • Frankfurt School of Finance and Management, Germany (x 2)
• IPC - Internationale Projekt Consult GMBH, Germany (x2) Three years
Regional: TurnAround Management Team
Coordinators (TTCC / EGP Coordinators) Bank Budget As required
• Brian Ballingall, Canada
• Robin Drewett (EMD Skills Ltd), UK
• John Emanuel, UK
• John Eskebaek, Denmark
• Tetsuo Fukuyama, Japan
• John Gore, UK
• Bernhard Keim, Germany
• Vasilis Kyriakou, Greece
• Vittorio Mattiuzzi, Italy
• Chris Rudd (Fineco Ltd), UK
• Ozren Tosic, Ireland
• Hartmut Voelkl, Germany
Three years
Regional: Insurance Consultancy Services Bank Budget As required • Willis, Ltd., Project Finance, UK Two years
Regional: Environmental and Social Due
Diligence Training of EBRD's Financial
Intermediaries
Bank Budget As required • PricewaterhouseCoopers LLP, UK One year
Georgia: Paravani Hydro Power Plant -
Lender's Engineer Bank Budget As required • Mott Macdonald Ltd, UK Five years
Regional: Integrity Investigation Services -
Expansion Bank Budget As required
• Alaco Ltd, UK
• AXIS & Co, France One year

41
Table 7 2011 Consultancy Contract Awards by Consultant Nationality (Value and Number)
Ranking Consultant Nationality TC Funds
€
% of Total
Value of TC
Funds
Bank
Budget
€
% of Value
of Bank
Budget
Loan Funds
€
Total Value
€
% of
Total
Value
Total
Number
1. BRITISH 16,141,053 16.30% 28,434,408 51.44% 3,695,498 48,270,959 28.48% 840 2. ITALIAN 11,030,213 11.14% 607,656 1.10% 4,926,862 16,564,731 9.77% 166 3. RUSSIAN 4,834,186 4.88% 7,688,415 13.89% 0 12,522,601 7.39% 179 4. GERMAN 11,075,192 11.18% 693,132 1.25% 59,430 11,827,754 6.98% 86 5. AUSTRIAN 7,125,164 7.19% 264,201 0.48% 0 7,389,365 4.36% 73 6. FRENCH 5,150,638 5.20% 946,721 1.71% 1,200,300 7,297,659 4.31% 48 7. SWEDISH 2,103,868 2.12% 172,530 0.31% 2,963,450 5,239,848 3.09% 23 8. SWISS 3,567,550 3.60% 367,143 0.66% 1,154,872 5,089,565 3.00% 31 9. DUTCH 4,014,322 4.05% 485,939 0.88% 267,762 4,768,023 2.81% 46 10. CZECH 3,977,668 4.02% 489,158 0.88% 0 4,466,826 2.64% 25 11. AMERICAN 1,685,092 1.70% 2,434,467 4.31% 0 4,119,559 2.43% 68 12. FINNISH 3,435,603 3.47% 660,473 1.19% 0 4,096,076 2.42% 51 13. ROMANIAN 2,935,988 2.96% 852,490 1.54% 230,800 4,019,278 2.37% 54 14. DANISH 3,491,545 3.53% 130,660 0.24% 0 3,622,205 2.14% 89 15. INTERNATIONAL** 2,026,403 2.05% 0 0.00% 0 2,026,403 1.20% 4 16. HUNGARIAN 670,208 0.68% 711,952 1.29% 359,788 1,741,948 1.03% 13 17. NORWEGIAN 1,339,280 1.35% 350,000 0.63% 0 1,689,280 1.00% 7 18. KAZAKHSTANIAN 1,439,917 1.45% 221,186 0.40% 0 1,661,103 0.98% 28 19. UKRAINIAN 379,559 0.38% 1,017,599 1.84% 51,784 1,448,941 0.85% 66 20. AUSTRALIAN 8,200 0.01% 1,407,520 2.54% 0 1,415,720 0.84% 24 21. SPANISH 1,319,608 1.33% 80,609 0.15% 0 1,400,217 0.83% 23 22. SLOVAK 1,348,173 1.36% 3,250 0.01% 0 1,351,423 0.80% 6 23. TURKISH 517,190 0.52% 788,628 1.42% 0 1,305,818 0.77% 36 24. JAPANESE 1,300,209 1.31% 0 0.00% 0 1,300,209 0.77% 101 25. POLISH 198,264 0.20% 976,948 1.76% 0 1,175,212 0.69% 34 26. IRISH 1,045,339 1.06% 92,059 0.17% 0 1,137,398 0.67% 40 27. SERBIAN* 424,011 0.43% 664,704 1.12% 0 1,088,715 0.64% 57 28. CANADIAN 705,651 0.71% 342,290 0.62% 0 1,047,941 0.62% 39 29. GREEK 995,367 1.01% 11,574 0.02% 0 1,006,941 0.59% 45 30. TAIPEI CHINA 885,472 0.89% 1 0.00% 0 885,473 0.52% 29 31. BELGIAN 403,847 0.41% 190,450 0.34% 0 594,297 0.35% 28 32. BULGARIAN 292,750 0.30% 291,456 0.53% 0 584,206 0.34% 21 33. CROATIAN 221,136 0.22% 314,135 0.57% 0 535,271 0.32% 29 34. BOSNIAN 237,713 0.24% 200,124 0.36% 74,625 512,462 0.30% 20 35. KYRGYZ 362,691 0.37% 118,780 0.21% 11,065 492,535 0.29% 41 36. GEORGIAN 128,939 0.13% 250,587 0.45% 93,050 472,576 0.28% 25 37. ARMENIAN 215,352 0.22% 198,908 0.36% 0 414,260 0.24% 24 38. INDIAN 0 0.00% 398,494 0.72% 0 398,494 0.24% 5 39. EGYPTIAN 85,000 0.09% 288,189 0.52% 0 373,189 0.22% 6 40. MONGOLIAN 101,257 0.10% 246,625 0.45% 0 347,882 0.21% 26 41. FYR MACEDONIAN 214,179 0.22% 80,348 0.15% 0 294,527 0.17% 23 42. NEW ZEALANDER 0 0.00% 281,628 0.51% 0 281,628 0.17% 4 43. MOLDOVAN 83,206 0.08% 187,474 0.34% 0 270,680 0.16% 21 44. TAJIK 161,303 0.16% 102,505 0.19% 0 263,808 0.16% 27 45. PORTUGESE 229,001 0.23% 5,000 0.01% 0 234,001 0.14% 5 46. SOUTH KOREAN 218,643 0.22% 0 0.00% 0 218,643 0.13% 19 47. BELORUSSIAN 60,900 0.06% 131,800 0.24% 0 192,700 0.11% 6 48. SOUTH AFRICAN 0 0.00% 187,532 0.34% 0 187,532 0.11% 4 49. CHINESE 97,492 0.10% 77,958 0.14% 0 175,450 0.10% 4 50. ALBANIAN 132,497 0.13% 37,500 0.07% 0 169,997 0.10% 15 51. ESTONIAN 17,570 0.02% 138,970 0.25% 0 156,540 0.09% 9 52. TURKMAN 137,265 0.14% 18,350 0.03% 0 155,615 0.09% 10 53. AZERI 66,882 0.07% 84,306 0.15% 0 151,188 0.09% 20 54. LUXEMBOURGEOIS 141,738 0.14% 0 0.00% 0 141,738 0.08% 14 55. CYPRIOT 0 0.00% 123,835 0.22% 0 123,835 0.07% 12 56. MONTENEGRIN 105,750 0.11% 8,800 0.02% 0 114,550 0.07% 10 57. UZBEK 73,125 0.07% 38,840 0.07% 0 111,964 0.07% 12 58. ZIMBABWEAN 0 0.00% 92,088 0.17% 0 92,088 0.05% 1 59. LITHUANIAN 0 0.00% 84,530 0.15% 0 84,530 0.05% 6 60. SINGAPOREAN 0 0.00% 79,966 0.14% 0 79,966 0.05% 2 61. MOROCCAN 60,000 0.06% 0 0.00% 0 60,000 0.04% 1 62. LEBANESE 0 0.00% 57,747 0.10% 0 57,747 0.03% 2 63. TUNISIAN 0 0.00% 41,555 0.08% 0 41,555 0.02% 5 64. ARGENTINIAN 0 0.00% 35,610 0.06% 0 35,610 0.02% 1 65. MAURITIAN 0 0.00% 29,385 0.05% 0 29,385 0.02% 1 66. ISRAELI 7,715 0.01% 19,733 0.04% 0 27,448 0.02% 2 67. SLOVENIAN 11,779 0.01% 14,400 0.03% 0 26,179 0.02% 3 68. CAYMAN ISLANDS 0 0.00% 5,500 0.01% 0 5,500 0.00% 1 69. BRITISH VIRGIN ISLS 0 0.00% 3,792 0.01% 0 3,792 0.00% 1
99,038,663 100% 55,362,612 100% 15,089,285 169,490,560 100% 2,797 *including Kosovan **International organisations: International Law Development Organisation is an international organisation based in Italy, Global Green Growth Institute is an international organisation based in South Korea.
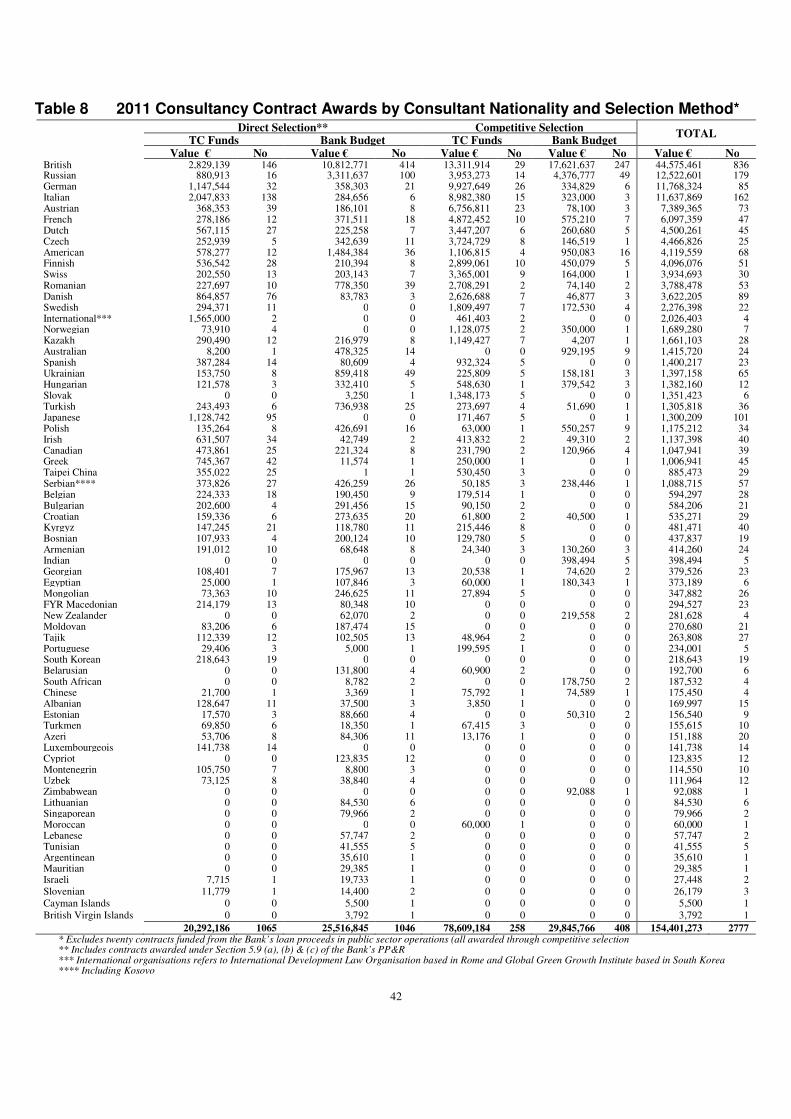
42
Table 8 2011 Consultancy Contract Awards by Consultant Nationality and Selection Method*
Direct Selection** Competitive Selection
TOTAL TC Funds Bank Budget TC Funds Bank Budget
Value € No Value € No Value € No Value € No Value € No British 2,829,139 146 10,812,771 414 13,311,914 29 17,621,637 247 44,575,461 836 Russian 880,913 16 3,311,637 100 3,953,273 14 4,376,777 49 12,522,601 179 German 1,147,544 32 358,303 21 9,927,649 26 334,829 6 11,768,324 85 Italian 2,047,833 138 284,656 6 8,982,380 15 323,000 3 11,637,869 162 Austrian 368,353 39 186,101 8 6,756,811 23 78,100 3 7,389,365 73 French 278,186 12 371,511 18 4,872,452 10 575,210 7 6,097,359 47 Dutch 567,115 27 225,258 7 3,447,207 6 260,680 5 4,500,261 45 Czech 252,939 5 342,639 11 3,724,729 8 146,519 1 4,466,826 25 American 578,277 12 1,484,384 36 1,106,815 4 950,083 16 4,119,559 68 Finnish 536,542 28 210,394 8 2,899,061 10 450,079 5 4,096,076 51 Swiss 202,550 13 203,143 7 3,365,001 9 164,000 1 3,934,693 30 Romanian 227,697 10 778,350 39 2,708,291 2 74,140 2 3,788,478 53 Danish 864,857 76 83,783 3 2,626,688 7 46,877 3 3,622,205 89 Swedish 294,371 11 0 0 1,809,497 7 172,530 4 2,276,398 22 International*** 1,565,000 2 0 0 461,403 2 0 0 2,026,403 4 Norwegian 73,910 4 0 0 1,128,075 2 350,000 1 1,689,280 7 Kazakh 290,490 12 216,979 8 1,149,427 7 4,207 1 1,661,103 28 Australian 8,200 1 478,325 14 0 0 929,195 9 1,415,720 24 Spanish 387,284 14 80,609 4 932,324 5 0 0 1,400,217 23 Ukrainian 153,750 8 859,418 49 225,809 5 158,181 3 1,397,158 65 Hungarian 121,578 3 332,410 5 548,630 1 379,542 3 1,382,160 12 Slovak 0 0 3,250 1 1,348,173 5 0 0 1,351,423 6 Turkish 243,493 6 736,938 25 273,697 4 51,690 1 1,305,818 36 Japanese 1,128,742 95 0 0 171,467 5 0 1 1,300,209 101 Polish 135,264 8 426,691 16 63,000 1 550,257 9 1,175,212 34 Irish 631,507 34 42,749 2 413,832 2 49,310 2 1,137,398 40 Canadian 473,861 25 221,324 8 231,790 2 120,966 4 1,047,941 39 Greek 745,367 42 11,574 1 250,000 1 0 1 1,006,941 45 Taipei China 355,022 25 1 1 530,450 3 0 0 885,473 29 Serbian**** 373,826 27 426,259 26 50,185 3 238,446 1 1,088,715 57 Belgian 224,333 18 190,450 9 179,514 1 0 0 594,297 28 Bulgarian 202,600 4 291,456 15 90,150 2 0 0 584,206 21 Croatian 159,336 6 273,635 20 61,800 2 40,500 1 535,271 29 Kyrgyz 147,245 21 118,780 11 215,446 8 0 0 481,471 40 Bosnian 107,933 4 200,124 10 129,780 5 0 0 437,837 19 Armenian 191,012 10 68,648 8 24,340 3 130,260 3 414,260 24 Indian 0 0 0 0 0 0 398,494 5 398,494 5 Georgian 108,401 7 175,967 13 20,538 1 74,620 2 379,526 23 Egyptian 25,000 1 107,846 3 60,000 1 180,343 1 373,189 6 Mongolian 73,363 10 246,625 11 27,894 5 0 0 347,882 26 FYR Macedonian 214,179 13 80,348 10 0 0 0 0 294,527 23 New Zealander 0 0 62,070 2 0 0 219,558 2 281,628 4 Moldovan 83,206 6 187,474 15 0 0 0 0 270,680 21 Tajik 112,339 12 102,505 13 48,964 2 0 0 263,808 27 Portuguese 29,406 3 5,000 1 199,595 1 0 0 234,001 5 South Korean 218,643 19 0 0 0 0 0 0 218,643 19 Belarusian 0 0 131,800 4 60,900 2 0 0 192,700 6 South African 0 0 8,782 2 0 0 178,750 2 187,532 4 Chinese 21,700 1 3,369 1 75,792 1 74,589 1 175,450 4 Albanian 128,647 11 37,500 3 3,850 1 0 0 169,997 15 Estonian 17,570 3 88,660 4 0 0 50,310 2 156,540 9 Turkmen 69,850 6 18,350 1 67,415 3 0 0 155,615 10 Azeri 53,706 8 84,306 11 13,176 1 0 0 151,188 20 Luxembourgeois 141,738 14 0 0 0 0 0 0 141,738 14 Cypriot 0 0 123,835 12 0 0 0 0 123,835 12 Montenegrin 105,750 7 8,800 3 0 0 0 0 114,550 10 Uzbek 73,125 8 38,840 4 0 0 0 0 111,964 12 Zimbabwean 0 0 0 0 0 0 92,088 1 92,088 1 Lithuanian 0 0 84,530 6 0 0 0 0 84,530 6 Singaporean 0 0 79,966 2 0 0 0 0 79,966 2 Moroccan 0 0 0 0 60,000 1 0 0 60,000 1 Lebanese 0 0 57,747 2 0 0 0 0 57,747 2 Tunisian 0 0 41,555 5 0 0 0 0 41,555 5 Argentinean 0 0 35,610 1 0 0 0 0 35,610 1 Mauritian 0 0 29,385 1 0 0 0 0 29,385 1 Israeli 7,715 1 19,733 1 0 0 0 0 27,448 2 Slovenian 11,779 1 14,400 2 0 0 0 0 26,179 3 Cayman Islands 0 0 5,500 1 0 0 0 0 5,500 1 British Virgin Islands 0 0 3,792 1 0 0 0 0 3,792 1
20,292,186 1065 25,516,845 1046 78,609,184 258 29,845,766 408 154,401,273 2777 * Excludes twenty contracts funded from the Bank’s loan proceeds in public sector operations (all awarded through competitive selection ** Includes contracts awarded under Section 5.9 (a), (b) & (c) of the Bank’s PP&R *** International organisations refers to International Development Law Organisation based in Rome and Global Green Growth Institute based in South Korea **** Including Kosovo

43
Table 9 Consultants from EBRD Countries of Operations* in 2011 and 2010
Value of Contract Awards (€) in 2011 Number of Contract Awards in
2011
Total Value of
Contracts (€) in
2011
(A)+(B)+(C)
Total Number
of Contracts in
2011
(D)+(E)
Value of
Contracts (€)
awarded
in 2010
Number of
Contracts
awarded
in 2010
TC Funds
(A)
Bank Budget
(B)
Loan
Funds
(C)
Direct
Selection
(D)
Competitive
Procedure
(E)
Russian 4,834,186 7,688,415 0 116 63 12,522,601 179 15,388,789.00 191 Czech*** 3,977,668 489,158 0 16 9 4,466,826 25 1,680,594.00 20 Romanian 2,935,988 852,490 230,800 49 5 4,019,278 54 2,632,124.00 42 Hungarian 670,208 711,952 359,788 8 5 1,741,948 13 64,360.00 6 Kazakh 1,439,917 221,186 0 20 8 1,661,103 28 1,954,391.00 39 Ukrainian 379,559 1,017,599 51,784 58 8 1,448,941 66 1,397,373.00 57 Slovak 1,348,173 3,250 0 1 5 1,351,423 6 415,272.00 3 Turkish 517,190 788,628 0 31 5 1,305,818 36 867,657.00 32 Polish 198,264 976,948 0 24 10 1,175,212 34 1,331,749.00 36 Serbian** 424,011 664,704.11 0 53 4 1,088,715 57 1,803,969.00 58 Bulgarian 292,750 291,456 0 19 2 584,206 21 3,775,671.00 31 Croatian 221,136 314,135 0 26 3 535,271 29 2,590,578.00 29 Bosnian 237,713 200,124 74,625 15 5 512,462 20 939,381.00 24 Kyrgyz 362,691 118,780 11,065 32 9 492,535 41 385,181.00 37 Georgian 128,939 250,587 93,050 21 4 472,576 25 805,582.00 34 Armenian 215,352 198,908 0 18 6 414,260 24 1,217,827.00 53 Egyptian**** 85,000 288,189 0 4 2 373,189 6 0.00 0 Mongolian 101,257 246,625 0 21 5 347,882 26 536,293.00 43 FYR Macedonian 214,179 80,348 0 23 0 294,527 23 272,829.00 20 Moldovan 83,206 187,474 0 21 0 270,680 21 227,438.00 24 Tajik 161,303 102,505 0 25 2 263,808 27 407,934.00 29 Belarusian 60,900 131,800 0 4 2 192,700 6 252,119.00 14 Albanian 132,497 37,500 0 14 1 169,997 15 97,193.00 22 Estonian 17,570 138,970 0 7 2 156,540 9 72,539.00 4 Turkmen 137,265 18,350 0 7 3 155,615 10 79,780.00 10 Azeri 66,882 84,306 0 19 1 151,188 20 220,668.00 28 Montenegrin 105,750 8,800 0 10 0 114,550 10 118,900.00 6 Uzbek 73,125 38,840 0 12 0 111,964 12 261,979.00 27 Lithuanian 0 84,530 0 6 0 84,530 6 104,900.00 7 Moroccan**** 60,000 0 0 0 1 60,000 1 0.00 0 Tunisian**** 0 41,555 0 5 0 41,555 5 0.00 0 Slovenian 11,779 14,400 0 3 0 26,179 3 23,950.00 2 Latvian 0 0 0 0 0 0 0 93,000.00 3
19,494,457 16,292,511 821,112 688 170 36,608,080 858 40,020,020 931
* Location of the contracted consultant ** including Kosovo *** Czech Republic has graduated **** Recipients countries

44
Table 10 2011 Consultancy Contract Awards by EBRD Department* (Value in € and Number)
Department / Team
TC Funded Contracts Bank Funded Contracts TOTAL
(TC and Bank Funded Contracts)
Value (€) Number Value (€) Number Value (€) % of the
Total
Value of
Contracts
Number
(A) (B) (C) (D) (A)+(C) (B)+(D)
Banking
Turkey, Eastern Europe, Caucasus and Central Asia (TEECCA)
1,081,590 60 60,899 3 1,142,489 0.74% 63
Central and South Eastern Europe
441,428 15 2,400 1 443,828 0.29% 16
Industry, Commerce and Agribusiness
10,017,170 477 6,518,963 177 16,536,133 10.71% 654
TAM Programme (Member of Industry, Commerce and Agribusiness Group)
3,960,272 419 0 0 3,960,272 2.56% 419
Financial Institutions 29,429,051 72 2,116,305 51 31,545,356 20.43% 123
Infrastructure 26,069,796 101 3,847,831 137 29,917,627 19.38% 238
Energy and Natural Resources 2,554,062 4 1,875,625 36 4,429,687 2.87% 40
Russia 19,990 1 86,783 3 106,773 0.07% 4
Other/Contingency 15,904,558 103 3,130,493 91 19,035,501 12.33% 194
Evaluation Department 75,792 1 432,303 17 508,095 0.33% 18
Finance 163,310 3 448,229 6 611,539 0.40% 9
Retention of Outside Counsel (contracts awarded by OGC)
0 0 17,910,271 571 17,910,271 11.60% 571
VP, Risk and Resources (including IT) 484,522 12 15,115,993 227 15,600,515 10.10% 239
Office of the Chief Economist 802,203 7 801,165 41 1,603,368 1.04% 48
Office of the General Counsel 6,985,905 34 695,620 9 7,681,525 4.98% 43
VP, Operation Policies 1,049,014 14 1,701,760 52 2,750,773 1.78% 66
Compliance Department 0 0 359,200 12 359,200 0.23% 12
Communications Department 0 0 116,624 11 116,624 0.08% 11
Office of the Secretary General 0 0 132,058 8 132,058 0.09% 8
Internal Audit 0 0 10,090 1 10,090 0.01% 1
Total: 99,038,663 1323 55,362,612 1454 154,401,725 100% 2777
* By cost centre allocation excluding contracts funded from public sector loan proceeds

45
Table 11 Consultants’ Participation in Competitive Selection by Bidders’ Nationality for Consultancy Contract Awards by CSU in 2011
Open Competition Targeted19 Competition
Expressed Interest Contracts Awarded Expressed Interest Contracts Awarded Armenia 15 4 Australia 11 4 Austria 75 8 41 10 Azerbaijan 4 0 Barbados 1 1 Belarus 10 2 Belgium 28 1 Bosnia & Herzegovina 11 2 Bulgaria 20 2 Canada 32 2 China 3 1 1 1 Croatia 13 2 Cyprus 2 0 Czech Republic 22 2 23 6 Denmark 42 3 Egypt 3 2 Estonia 2 0 Finland 36 9 6 2 France 93 10 12 3 FYR Macedonia 8 0 Georgia 2 0 Germany 170 17 41 7 Greece 26 2 Hungary 22 1 Iceland 2 0 India 11 0 Iran 1 0 Ireland 17 2 Israel 8 0 Italy 82 8 28 4 Japan 9 1 2 2 Jordan 2 0 Kazakhstan 15 2 Korea 7 0 Kyrgyz Republic 4 0 Latvia 2 0 Lebanon 2 0 Lithuania 2 0 Moldova 1 0 Mongolia 14 2 Morocco 2 1 Netherlands 61 4 6 1 New Zealand 1 0 Norway 3 2 Philippines 4 0 Poland 20 3 Portugal 4 0 8 1 Romania 31 2 Russian Federation 118 17 Serbia incl. Kosovo 34 3 Singapore 1 0 Slovak Republic 4 1 17 4 Slovenia 1 0 Spain 71 1 18 4 Sweden 29 5 1 1 Switzerland 74 11 5 1 Taipei China 15 0 3 3 Tajikistan 7 2 Tunisia 1 0 Turkey 31 3 Turkmenistan 21 2 Ukraine 25 1 United Kingdom 719 79 United States 99 8 Uzbekistan 1 0 2188 235 212 50
Note: Includes contracts awarded by Consultancy Services Unit following competitive selection process. Contracts awarded pursuant to Direct
Selection <75K and Section 5.9 (a), (b) & (c) of the Bank’s PP&R, extensions and competitively awarded call-off notices under existing
framework agreements are excluded
19 Assignments targeted specifically at consultants from TC donor country
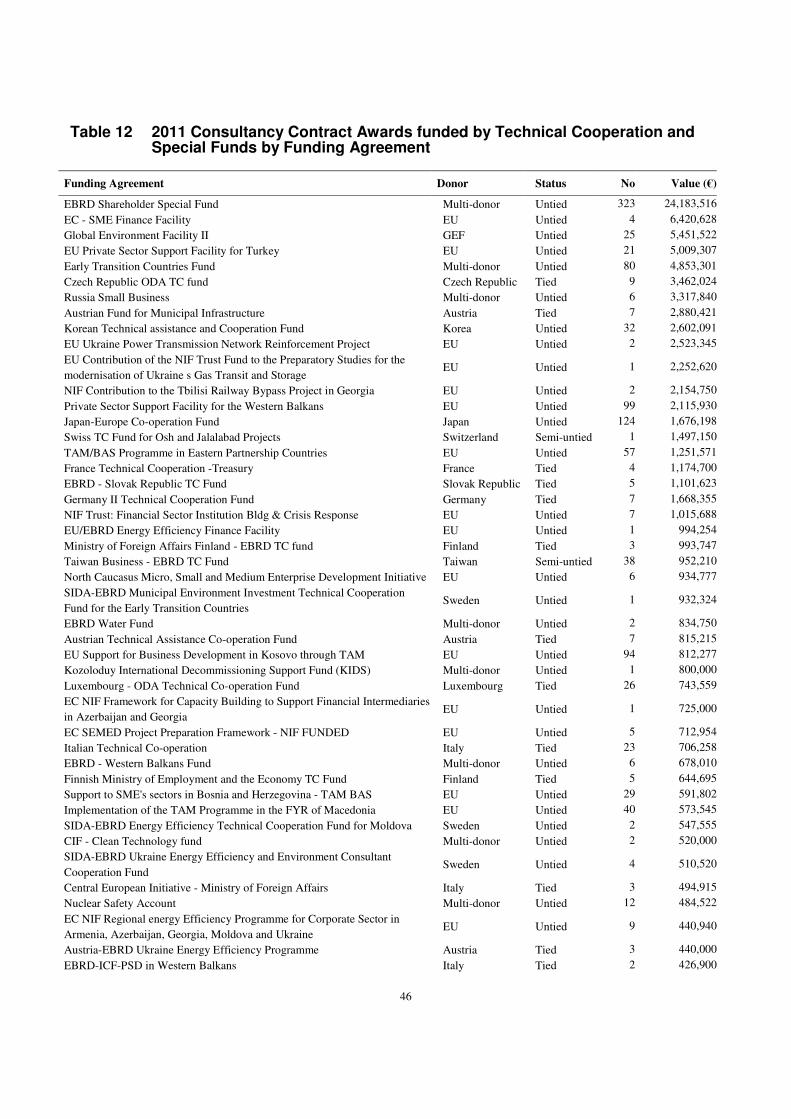
46
Table 12 2011 Consultancy Contract Awards funded by Technical Cooperation and Special Funds by Funding Agreement
Funding Agreement Donor Status No Value (€)
EBRD Shareholder Special Fund Multi-donor Untied 323 24,183,516
EC - SME Finance Facility EU Untied 4 6,420,628
Global Environment Facility II GEF Untied 25 5,451,522
EU Private Sector Support Facility for Turkey EU Untied 21 5,009,307
Early Transition Countries Fund Multi-donor Untied 80 4,853,301
Czech Republic ODA TC fund Czech Republic Tied 9 3,462,024
Russia Small Business Multi-donor Untied 6 3,317,840
Austrian Fund for Municipal Infrastructure Austria Tied 7 2,880,421
Korean Technical assistance and Cooperation Fund Korea Untied 32 2,602,091
EU Ukraine Power Transmission Network Reinforcement Project EU Untied 2 2,523,345
EU Contribution of the NIF Trust Fund to the Preparatory Studies for the
modernisation of Ukraine s Gas Transit and Storage EU Untied 1 2,252,620
NIF Contribution to the Tbilisi Railway Bypass Project in Georgia EU Untied 2 2,154,750
Private Sector Support Facility for the Western Balkans EU Untied 99 2,115,930
Japan-Europe Co-operation Fund Japan Untied 124 1,676,198
Swiss TC Fund for Osh and Jalalabad Projects Switzerland Semi-untied 1 1,497,150
TAM/BAS Programme in Eastern Partnership Countries EU Untied 57 1,251,571
France Technical Cooperation -Treasury France Tied 4 1,174,700
EBRD - Slovak Republic TC Fund Slovak Republic Tied 5 1,101,623
Germany II Technical Cooperation Fund Germany Tied 7 1,668,355
NIF Trust: Financial Sector Institution Bldg & Crisis Response EU Untied 7 1,015,688
EU/EBRD Energy Efficiency Finance Facility EU Untied 1 994,254
Ministry of Foreign Affairs Finland - EBRD TC fund Finland Tied 3 993,747
Taiwan Business - EBRD TC Fund Taiwan Semi-untied 38 952,210
North Caucasus Micro, Small and Medium Enterprise Development Initiative EU Untied 6 934,777
SIDA-EBRD Municipal Environment Investment Technical Cooperation
Fund for the Early Transition Countries Sweden Untied 1 932,324
EBRD Water Fund Multi-donor Untied 2 834,750
Austrian Technical Assistance Co-operation Fund Austria Tied 7 815,215
EU Support for Business Development in Kosovo through TAM EU Untied 94 812,277
Kozoloduy International Decommissioning Support Fund (KIDS) Multi-donor Untied 1 800,000
Luxembourg - ODA Technical Co-operation Fund Luxembourg Tied 26 743,559
EC NIF Framework for Capacity Building to Support Financial Intermediaries
in Azerbaijan and Georgia EU Untied 1 725,000
EC SEMED Project Preparation Framework - NIF FUNDED EU Untied 5 712,954
Italian Technical Co-operation Italy Tied 23 706,258
EBRD - Western Balkans Fund Multi-donor Untied 6 678,010
Finnish Ministry of Employment and the Economy TC Fund Finland Tied 5 644,695
Support to SME's sectors in Bosnia and Herzegovina - TAM BAS EU Untied 29 591,802
Implementation of the TAM Programme in the FYR of Macedonia EU Untied 40 573,545
SIDA-EBRD Energy Efficiency Technical Cooperation Fund for Moldova Sweden Untied 2 547,555
CIF - Clean Technology fund Multi-donor Untied 2 520,000
SIDA-EBRD Ukraine Energy Efficiency and Environment Consultant
Cooperation Fund Sweden Untied 4 510,520
Central European Initiative - Ministry of Foreign Affairs Italy Tied 3 494,915
Nuclear Safety Account Multi-donor Untied 12 484,522
EC NIF Regional energy Efficiency Programme for Corporate Sector in
Armenia, Azerbaijan, Georgia, Moldova and Ukraine EU Untied 9 440,940
Austria-EBRD Ukraine Energy Efficiency Programme Austria Tied 3 440,000
EBRD-ICF-PSD in Western Balkans Italy Tied 2 426,900

47
Table 13 (cont.) 2011 Consultancy Contract Awards funded by Technical Cooperation and Special Funds by Funding Agreement
Funding Agreement Donor Status No Value (€)
Sweden (SIDA) - EBRD Technical Cooperation Fund - Phase II Sweden Tied 2 408,722
EBRD-Germany Non ODA Sustainable Energy Initiative Project Germany Untied 16 373,966
SIDA-EBRD Municipal Environment and Climate Programme Fund Sweden Untied 1 358,565
Netherlands Technical Assistance Co-operation Netherlands Tied 3 355,815
The New Norway Cooperation Fund Norway Untied 5 336,205
Portuguese Technical Cooperation Fund 2008 Portugal Tied 6 244,163
Spanish SEI Fund II ODA Fund Spain Semi-untied 8 222,214
Japan-SEI TC Fund Japan Semi-untied 6 220,730
Central European Initiative Italy Tied 21 216,545
EC Municipal Finance Facility TC Special Fund EU Untied 2 204,940
EBRD-Austria Fund for Improving the Energy Performance of Buildings in
Russian Federal Districts Austria Untied 1 198,000
Support to SME Development in Mongolia EU Untied 2 188,080
Austria BAS Fund Austria Untied 5 151,903
EBRD-Romania Micro Credit Facility Multi-donor Untied 1 120,000
Implementation of the BAS Programme in the FYR of Macedonia EU Untied 5 115,215
EBRD-ICEX Technical Co-operation Spain Tied 9 115,070
EBRD Italian TC Fund Albanian Water Resources Study Italy Tied 1 103,780
Luxembourg - European Bank Technical Co-operation Luxembourg Tied 8 103,359
SIDA-EBRD TAM/BAS Energy Efficiency Fund for Moldova Sweden Untied 7 92,878
German Federal Ministry for the Environment (ODA) Sustainable Energy
Initiative Project Account Germany Untied 10 92,382
EBRD-DFID Sustainable Energy Initiative Fund United Kingdom Untied 1 90,000
EBRD Business Advisory Services (BAS) programme Kosovo Netherlands Untied 5 88,771
EBRD Business Advisory Services (BAS) programme Serbia Netherlands Untied 6 83,143
France Technical Cooperation - Foreign Affairs France Tied 1 67,736
EBRD Business Advisory Services (BAS) programme Montenegro Netherlands Untied 7 66,018
Switzerland-SECO/BAS Fund Switzerland Untied 13 61,564
Ireland-European Bank Cooperation Ireland Tied 1 57,000
Seco-EBRD Secured Transactions and Creditors rights Fund Switzerland Untied 1 45,500
Southern and Eastern Mediterranean Trust Fund Multi-donor Untied 4 40,000
EBRD - Canadian Technical Cooperation Fund 2006-2009 Canada Untied 2 31,260
Switzerland-EBRD FYR Macedonia MEAP Grant Fund Switzerland Tied 1 25,000
Hellenic Technical Cooperation Greece Tied 5 23,541
Swiss Technical Co-operation Switzerland Tied 4 22,486
Walloon Technical Cooperation Fund Belgium Tied 2 22,422
Japan Fund for Post-Conflict Support Japan Untied 4 13,707
OeEB - EBRD Technical Cooperation Fund Austria Untied 1 10,819
Finnish Technical Cooperation Fund Finland Tied 2 5,720
TAM/BAS Community Project in the South Gobi Region Energy Resources
LLC Untied 1 840
The Danish Rural Financial Services Technical Cooperation Fund Denmark Untied 2 -
TOTAL 1323 98,901,368
Recommended


![District heating [EBRD - Evaluation]](https://img.dokumen.tips/doc/110x75/613d1035736caf36b758e10a/district-heating-ebrd-evaluation.jpg)