Energy Storage Industrial
Acceptance Area: Lessons,
Methods, and Models Resulting from
Recent Experience
Patrick Balducci
Chief Economist
Other team members: V. Viswanathan, J. Alam, A. Somani, D. Wu, K. Mongird, Y. Yuan, V. Fotedar,
R. Fan, and A. Crawford
DOE OE Energy Storage Peer Review
Santa Fe, New Mexico
September 25, 2018

Energy Storage Projects Being Evaluated by
Pacific Northwest National Laboratory
2
Industrial Acceptance Thrust Areas
3
Economics Control Systems
Cost and Performance Characterization Distribution System Integration

Taxonomy of Energy Storage Services
4

Energy Storage Holds Tremendous Value
Source: Balducci, P., J. Alam, T. Hardy, and D. Wu. 2018. Assigning Value to Energy Storage Systems at Multiple Points in an
Electrical Grid. Energy Environ. Sci., 2018, Advance Article. DOI: 10.1039/C8EE00569A. Available online at
http://pubs.rsc.org/en/content/articlelanding/2018/ee/c8ee00569a#!divAbstract. 5

Results from Recent PNNL Valuation Studies:
Present Value Benefits and Costs over
Economic Life of Energy Storage Systems
*Reliability benefits are based on assessments of the value of lost load to customers, thus expanding the benefits to include those
accruing to both the utility and the customers it serves.
6

Orcas Power & Light Co-Op – CEF II
Energy Storage & Community Solar
Total 20-year value of photovoltaics (PV) and energy storage system (ESS) operations at $3.3
million in present value terms, while present value costs are $2.9 million for a benefit-cost ratio
(BCR) of 1.13, including outage mitigation raises BCR to 1.25
Benefits largely driven by transmission deferral benefit at $2.0 million in present value terms
Cable replacement deferral estimated to be 3.65 years
$-
$500,000
$1,000,000
$1,500,000
$2,000,000
$2,500,000
$3,000,000
$3,500,000
Benefits Costs
Load Shaping Charge Reduction Demand Charge Reduction Transmission Charge Reduction
Volt-VAR/CVR Transmission Deferral Energy Losses
Energy Storage System Rate Impacts Lost Revenue Gen Set Cost Avoidance
Outage Mitigation PV Energy Production
7
Submarine Transmission
Cables
Mainland Washington
Cable 5 and Energy Storage System (ESS) site at Decatur Substation in the OPALCO Single Line Diagram (upper); Cable 5
Cross Section (lower)

8
Shell Energy North America (SENA) Small,
Modular Pumped Storage Hydro – Market
Assessment
SENA hydro battery costs are
roughly comparable to those in
the marketplace for electro-
chemical batteries at $743/kWh
Several hydro battery
characteristics outlined by SENA
are tremendously valuable
the ability to act as load and
generation
the ability to follow a regulation
signal
the ability to provide 14 MW of
regulation up/down capacity
the spinning reserve mode
enables grid synching to improve
project economics
Benefits exceed costs under the base case in the Pacific NW, Hawaii, and two NYISO
regions. Under the mature cost method, positive BCRs are obtained in all regions with
the exception of one CAISO sub-region
Economic viability of the SENA hydro battery is highly dependent on locational factors
Regulation, capacity, and frequency response are the most valuable use cases.
9
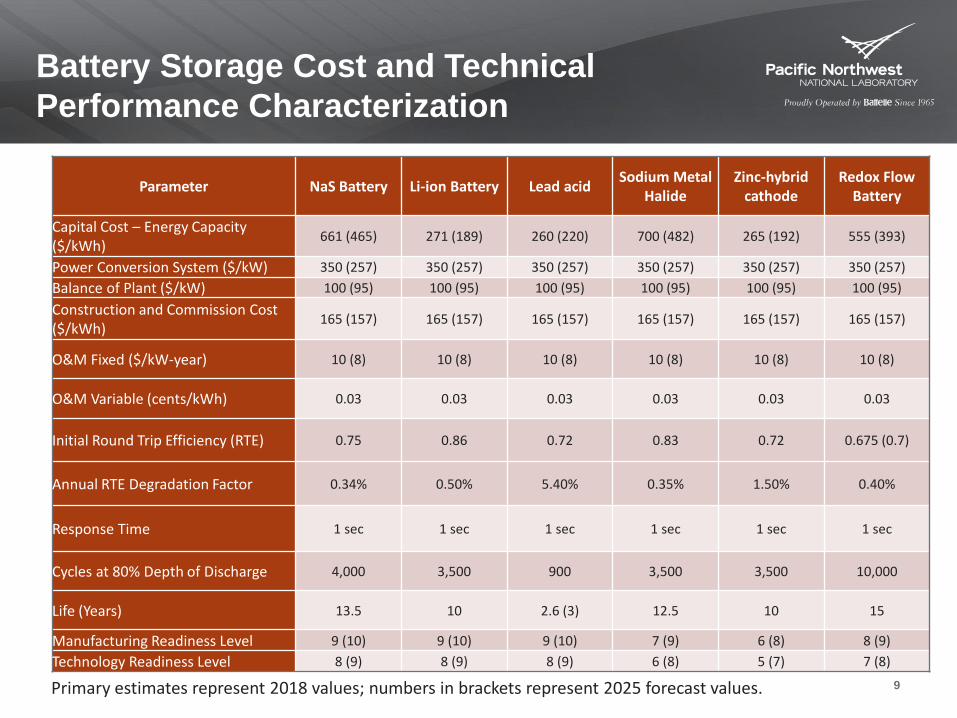
Battery Storage Cost and Technical
Performance Characterization
Parameter NaS Battery Li-ion Battery Lead acidSodium Metal
HalideZinc-hybrid
cathodeRedox Flow
Battery
Capital Cost – Energy Capacity ($/kWh)
661 (465) 271 (189) 260 (220) 700 (482) 265 (192) 555 (393)
Power Conversion System ($/kW) 350 (257) 350 (257) 350 (257) 350 (257) 350 (257) 350 (257)
Balance of Plant ($/kW) 100 (95) 100 (95) 100 (95) 100 (95) 100 (95) 100 (95)
Construction and Commission Cost ($/kWh)
165 (157) 165 (157) 165 (157) 165 (157) 165 (157) 165 (157)
O&M Fixed ($/kW-year) 10 (8) 10 (8) 10 (8) 10 (8) 10 (8) 10 (8)
O&M Variable (cents/kWh) 0.03 0.03 0.03 0.03 0.03 0.03
Initial Round Trip Efficiency (RTE) 0.75 0.86 0.72 0.83 0.72 0.675 (0.7)
Annual RTE Degradation Factor 0.34% 0.50% 5.40% 0.35% 1.50% 0.40%
Response Time 1 sec 1 sec 1 sec 1 sec 1 sec 1 sec
Cycles at 80% Depth of Discharge 4,000 3,500 900 3,500 3,500 10,000
Life (Years) 13.5 10 2.6 (3) 12.5 10 15
Manufacturing Readiness Level 9 (10) 9 (10) 9 (10) 7 (9) 6 (8) 8 (9)
Technology Readiness Level 8 (9) 8 (9) 8 (9) 6 (8) 5 (7) 7 (8)
Primary estimates represent 2018 values; numbers in brackets represent 2025 forecast values.

Siting/Sizing Energy Storage
Broad Set of Use Cases
Regional Variation
Utility Structure
Battery Characteristics
What We Have Learned – Need a Detailed
Methodology for Assessing an Energy
Storage System’s Value Proposition
Ability to aid in the siting of energy storage systems by
capturing/measuring location-specific benefits
Measure benefits associated with bulk energy, transmission-
level, ancillary service, distribution-level, and customer
benefits at sub-hourly level
Differentiate benefits by region and market structures/rules
Define benefits for different types of utilities (e.g., public
utility districts, co-ops, large utilities operating in organized
markets, and vertically integrated investor-owned utilities
operating in regulated markets)
Accurately characterize battery performance, including round
trip efficiency rates across varying states of charge and
battery degradation caused by cycling.
10

Acknowledgments
Dr. Imre Gyuk - Energy Storage Program Manager, Office of Electricity
Delivery and Energy Reliability, U.S. Department of Energy
Bob Kirchmeier - Senior Energy Policy Specialist, Clean Energy Fund
Grid Modernization Program, Washington State Energy Office
11
Recommended