Outlines
Introduction
Energy Efficient Distillations
Motivation and Challenging Problems
New Retrofit Approach for Refinery Distillation Units
Case Study
Results and Discussion
Conclusions and Future Work
Introduction Energy is a fundamental driver of economic growth
Distillation industry contributes significantly to operation costs and is environmentally challenging
Crude distillation is energy intensive; it consumes approximately an equivalent of 2% of the crude oil processed
Building new refinery units is very costly Therefore, many retrofit projects on existing
installations are considered to increase the production capacity, improve profit and minimise the energy consumption
i.e. energy is expensive and its efficiency is very low for typical distillations
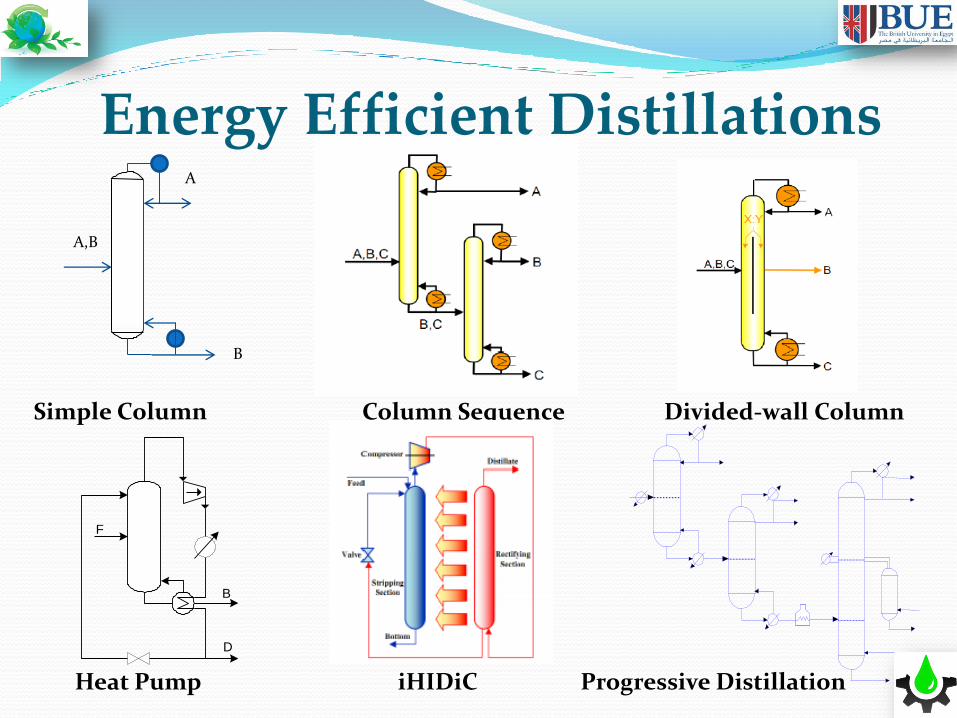
Energy Efficient Distillations
Heat Pump
Divided-wall Column
A,B
B
A
Simple Column Column Sequence
B
D
F
iHIDiC Progressive Distillation
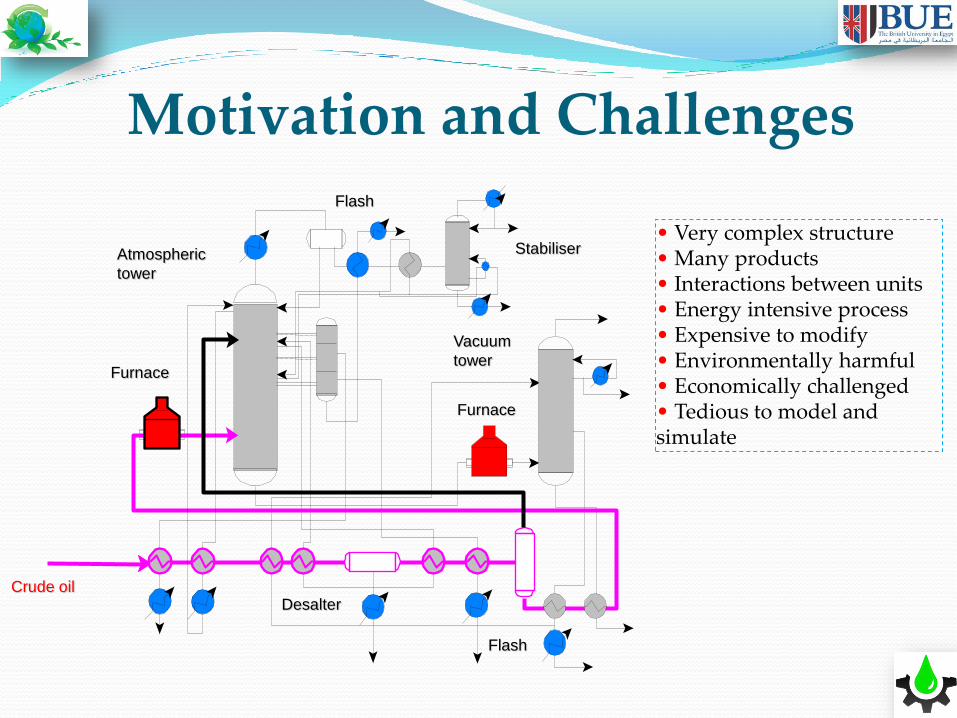
Motivation and Challenges
• Very complex structure • Many products • Interactions between units • Energy intensive process • Expensive to modify • Environmentally harmful • Economically challenged • Tedious to model and simulate
Atmospheric
tower
Vacuum
tower
Stabiliser
Flash
Furnace
Furnace
Flash
Desalter Crude oil
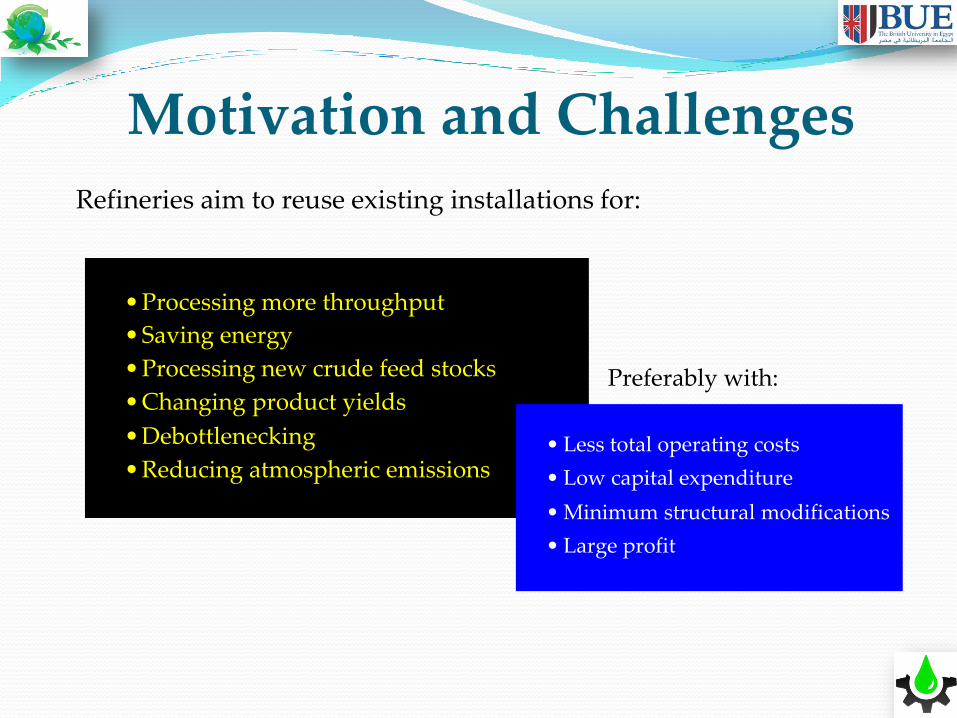
Refineries aim to reuse existing installations for:
• Processing more throughput
• Saving energy
• Processing new crude feed stocks
• Changing product yields
• Debottlenecking
• Reducing atmospheric emissions • Less total operating costs
• Low capital expenditure
• Minimum structural modifications
• Large profit
Preferably with:
Motivation and Challenges
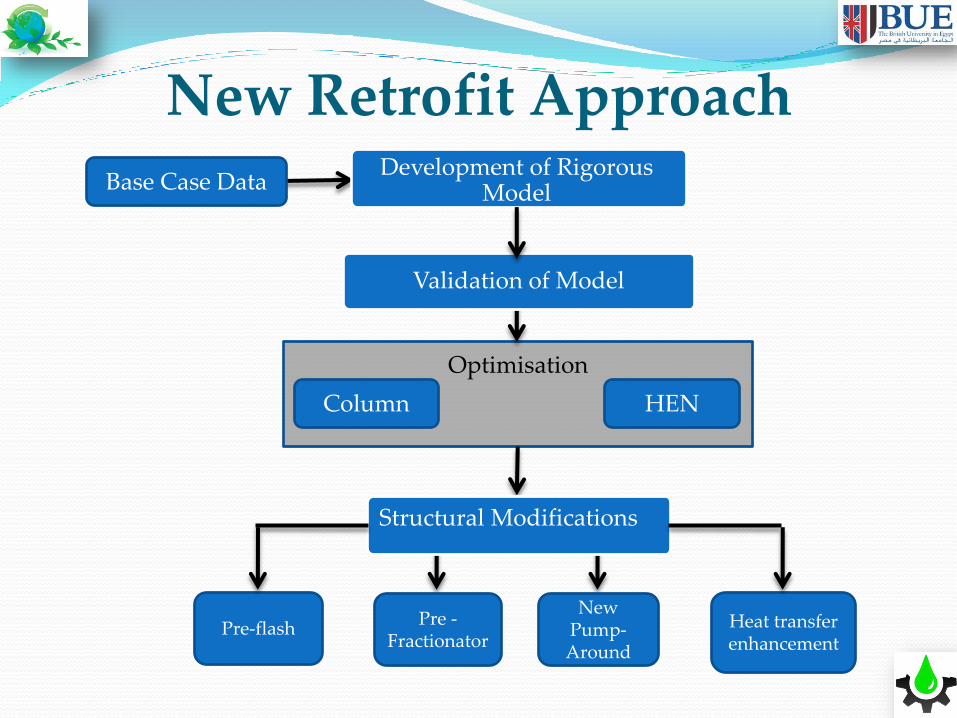
New Retrofit Approach
Optimisation
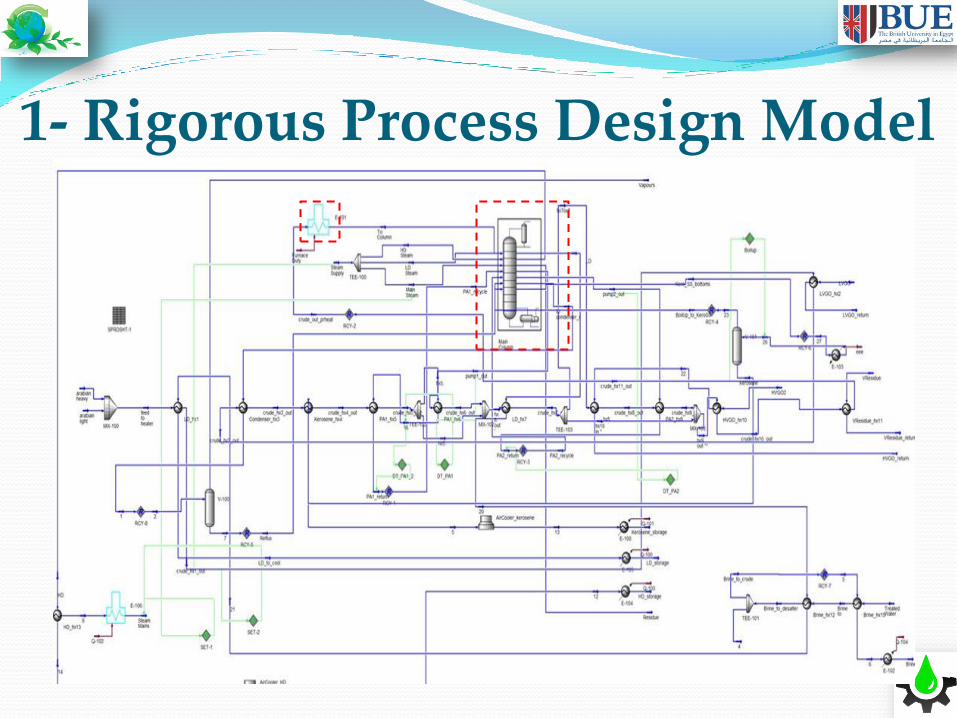
Development of Rigorous Model
Validation of Model
Structural Modifications
Column
Pre-flash Pre -
Fractionator
New Pump-Around
Heat transfer enhancement
HEN
Base Case Data
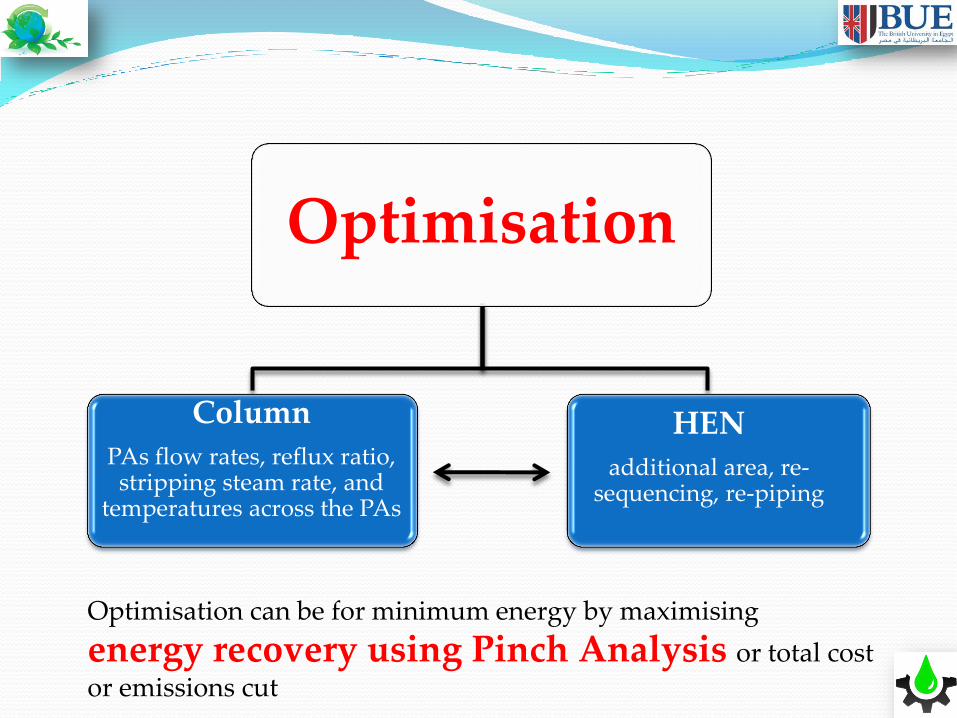
Optimisation
Optimisation can be for minimum energy by maximising
energy recovery using Pinch Analysis or total cost
or emissions cut
HEN
additional area, re-sequencing, re-piping
Column
PAs flow rates, reflux ratio, stripping steam rate, and
temperatures across the PAs
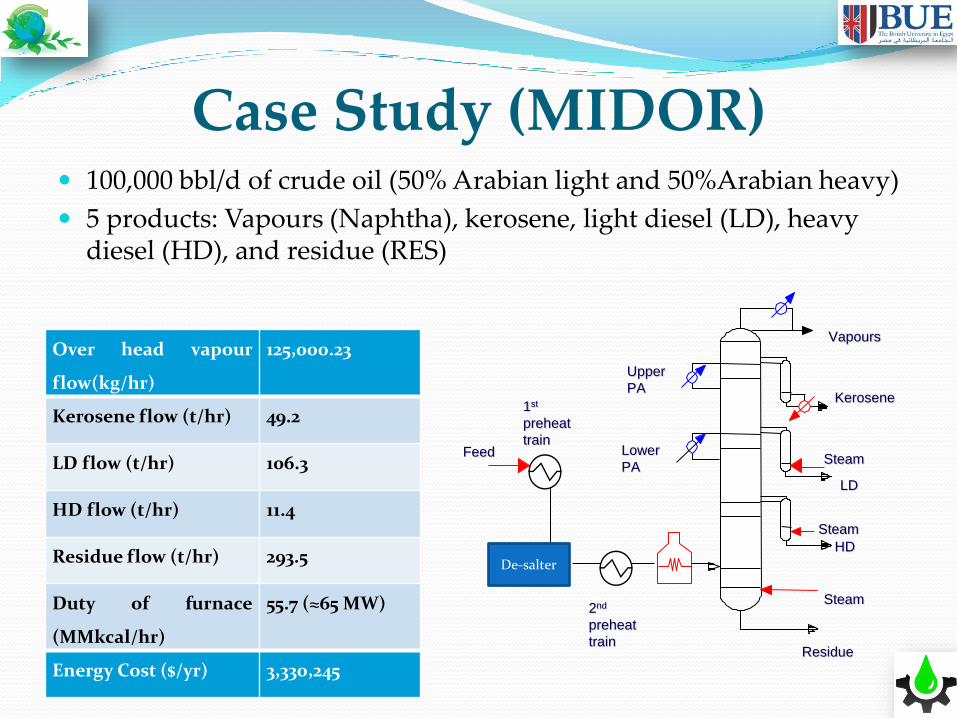
Case Study (MIDOR) 100,000 bbl/d of crude oil (50% Arabian light and 50%Arabian heavy)
5 products: Vapours (Naphtha), kerosene, light diesel (LD), heavy diesel (HD), and residue (RES)
Over head vapour
flow(kg/hr)
125,000.23
Kerosene flow (t/hr) 49.2
LD flow (t/hr) 106.3
HD flow (t/hr) 11.4
Residue flow (t/hr) 293.5
Duty of furnace
(MMkcal/hr)
55.7 (≈65 MW)
Energy Cost ($/yr) 3,330,245
Vapours
HD
Kerosene
LD
Residue
Steam
Steam
Steam
Upper
PA
Feed
Lower
PA
De-salter
2nd
preheat
train
1st
preheat
train
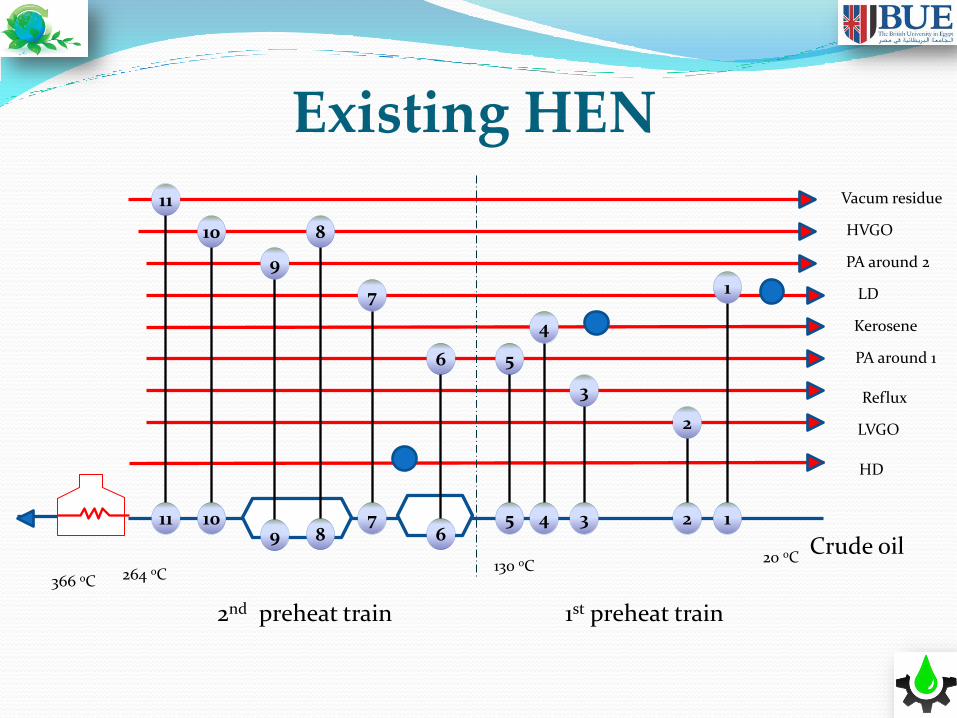
Existing HEN
1 2 3 4 5 6
7 8 9
10 11
1
2
3
4
5 6
7
8
9
10
11
PA around 1
LVGO
Kerosene
LD
Reflux
HVGO
Vacum residue
Crude oil
1st preheat train 2nd preheat train
264 oC 130 oC
20 oC
366 oC
PA around 2
HD
Case Study Objectives
Development of a rigorous process design model for the existing refinery distillation plant
Increasing the energy efficiency
Optimisation of the current operating conditions to minimise energy consumption and total costs
......
..........capacity.....
.......different feed stocks...
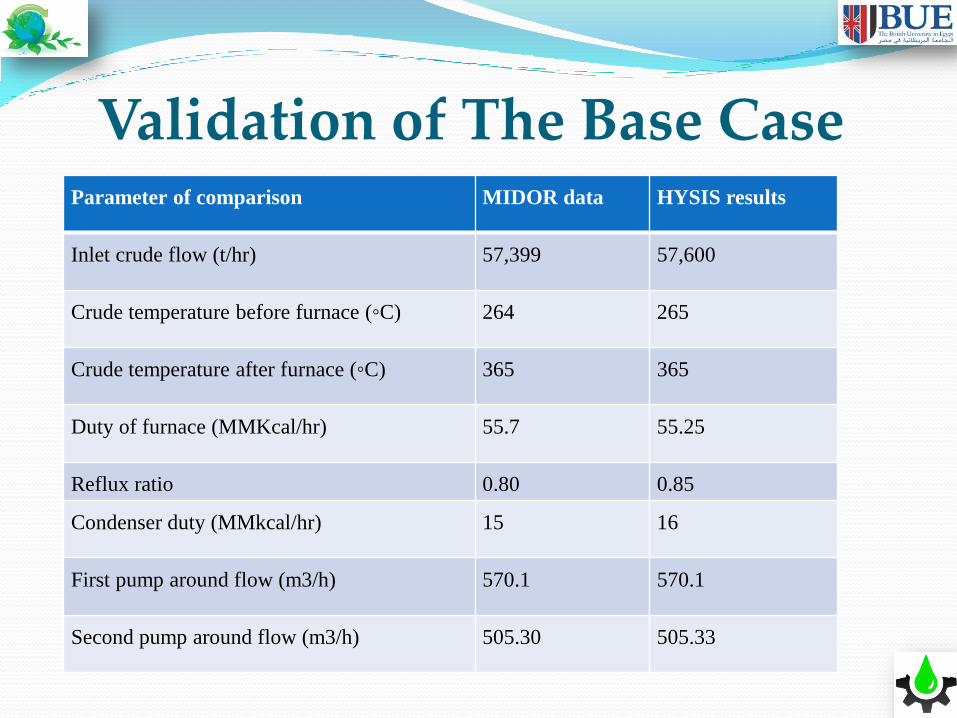
Validation of The Base Case
Parameter of comparison MIDOR data HYSIS results
Inlet crude flow (t/hr) 57,399 57,600
Crude temperature before furnace (◦C) 264 265
Crude temperature after furnace (◦C) 365 365
Duty of furnace (MMKcal/hr) 55.7 55.25
Reflux ratio 0.80 0.85
Condenser duty (MMkcal/hr) 15 16
First pump around flow (m3/h) 570.1 570.1
Second pump around flow (m3/h) 505.30 505.33
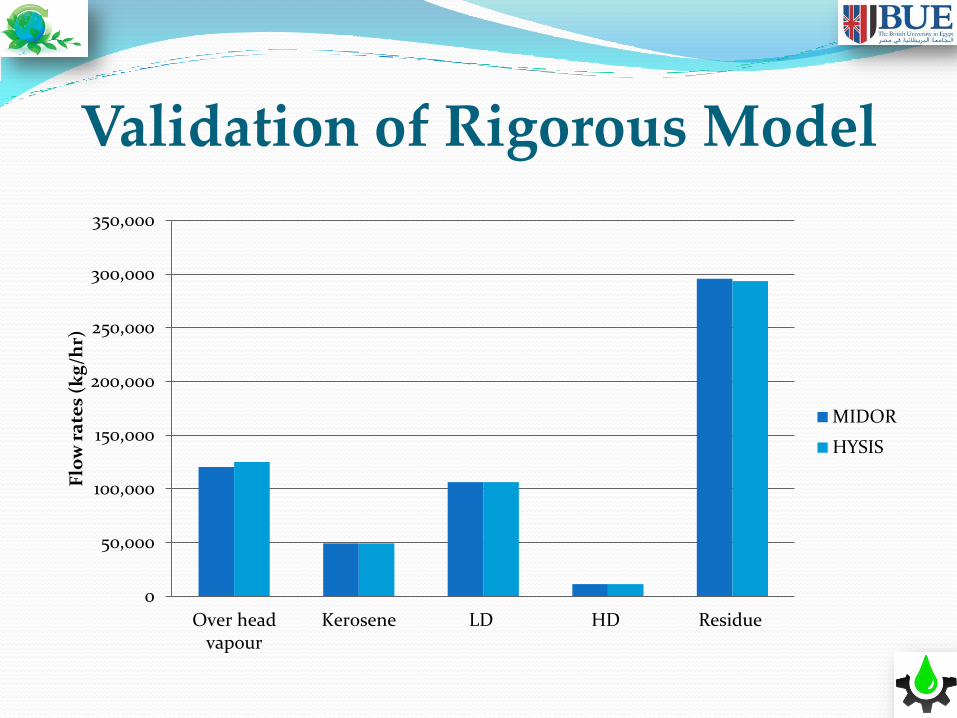
Validation of Rigorous Model
0
50,000
100,000
150,000
200,000
250,000
300,000
350,000
Over headvapour
Kerosene LD HD Residue
Flo
w r
ate
s (k
g/h
r)
MIDOR
HYSIS
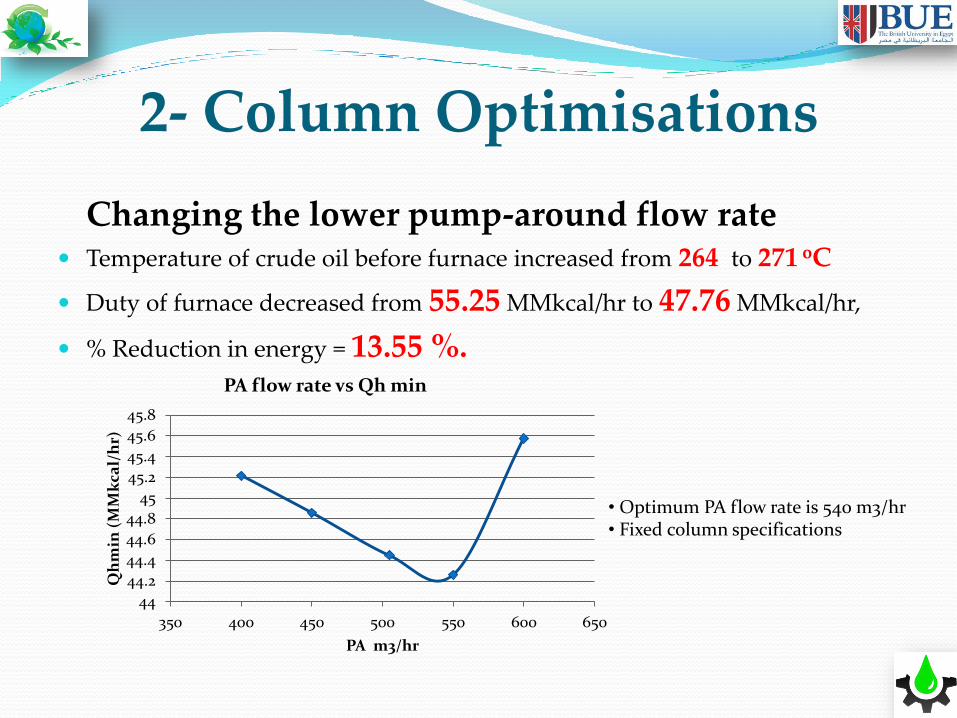
2- Column Optimisations
Changing the lower pump-around flow rate Temperature of crude oil before furnace increased from 264 to 271 oC
Duty of furnace decreased from 55.25 MMkcal/hr to 47.76 MMkcal/hr,
% Reduction in energy = 13.55 %.
44
44.2
44.4
44.6
44.8
45
45.2
45.4
45.6
45.8
350 400 450 500 550 600 650
Qh
min
(M
Mk
cal/
hr)
PA m3/hr
PA flow rate vs Qh min
• Optimum PA flow rate is 540 m3/hr • Fixed column specifications
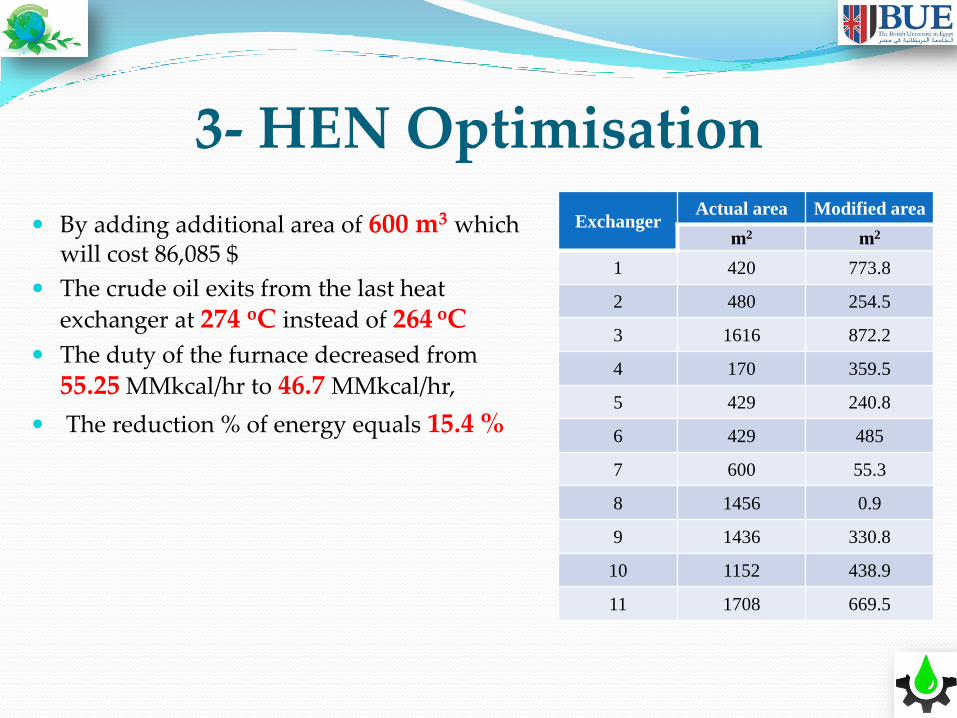
3- HEN Optimisation
By adding additional area of 600 m3 which will cost 86,085 $
The crude oil exits from the last heat
exchanger at 274 oC instead of 264 oC
The duty of the furnace decreased from
55.25 MMkcal/hr to 46.7 MMkcal/hr,
The reduction % of energy equals 15.4 %
Exchanger Actual area Modified area
m2 m2
1 420 773.8
2 480 254.5
3 1616 872.2
4 170 359.5
5 429 240.8
6 429 485
7 600 55.3
8 1456 0.9
9 1436 330.8
10 1152 438.9
11 1708 669.5
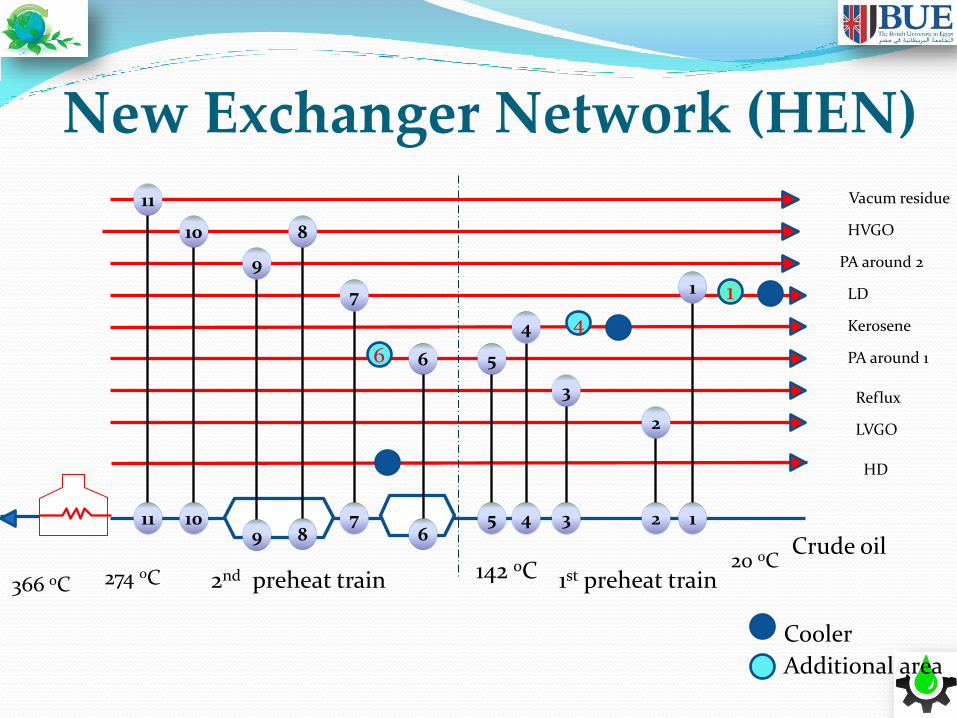
New Exchanger Network (HEN)
1 2 3 4 5 6
7 8 9
10 11
1
2
3
4
5 6
7
8
9
10
11
PA around 1
LVGO
Kerosene
LD
Reflux
HVGO
Vacum residue
Crude oil
1st preheat train 2nd preheat train 274 oC 142 oC 20 oC 366 oC
PA around 2
1
4
6
Additional area
HD
Cooler
4- Simultaneous Optimisation in
both Column and HEN
By simultaneously applying both column and HEN optimisations
The temperature of crude oil before the furnace increased to be 278.3 oC instead of 264 oC
The duty of the furnace decreased from 55.25 MMkcal/hr to 44.98 MMkcal/hr.
The reduction % of energy equals 18.58 %.
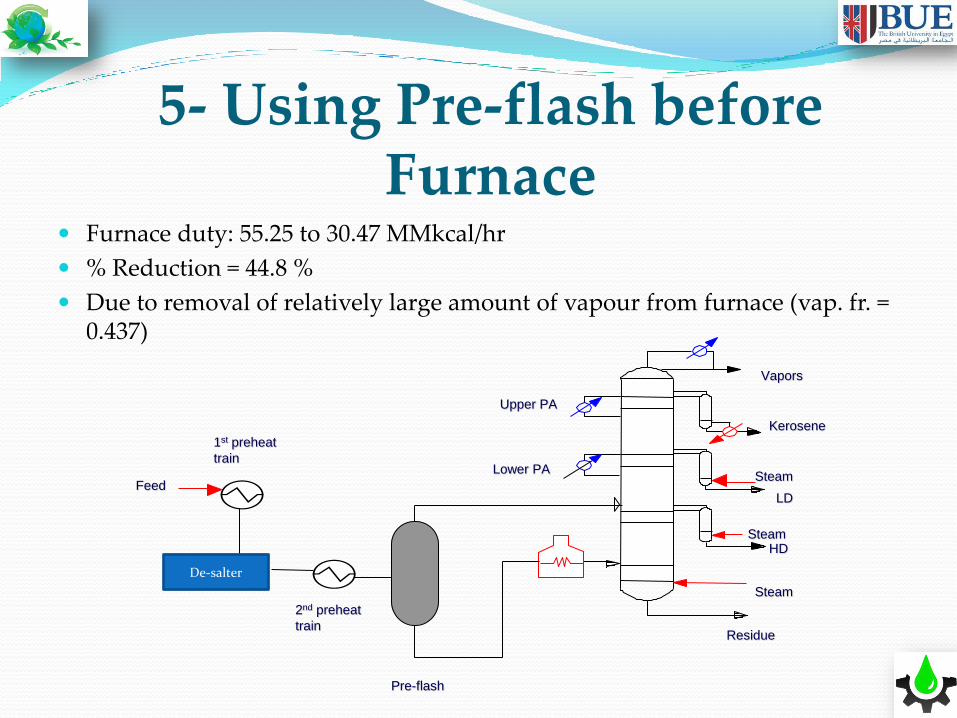
5- Using Pre-flash before Furnace
Furnace duty: 55.25 to 30.47 MMkcal/hr
% Reduction = 44.8 %
Due to removal of relatively large amount of vapour from furnace (vap. fr. = 0.437)
Vapors
HD
Kerosene
LD
Residue
Steam
Steam
Steam
Upper PA
Lower PA
2nd preheat
train
Feed
De-salter
1st preheat
train
Pre-flash
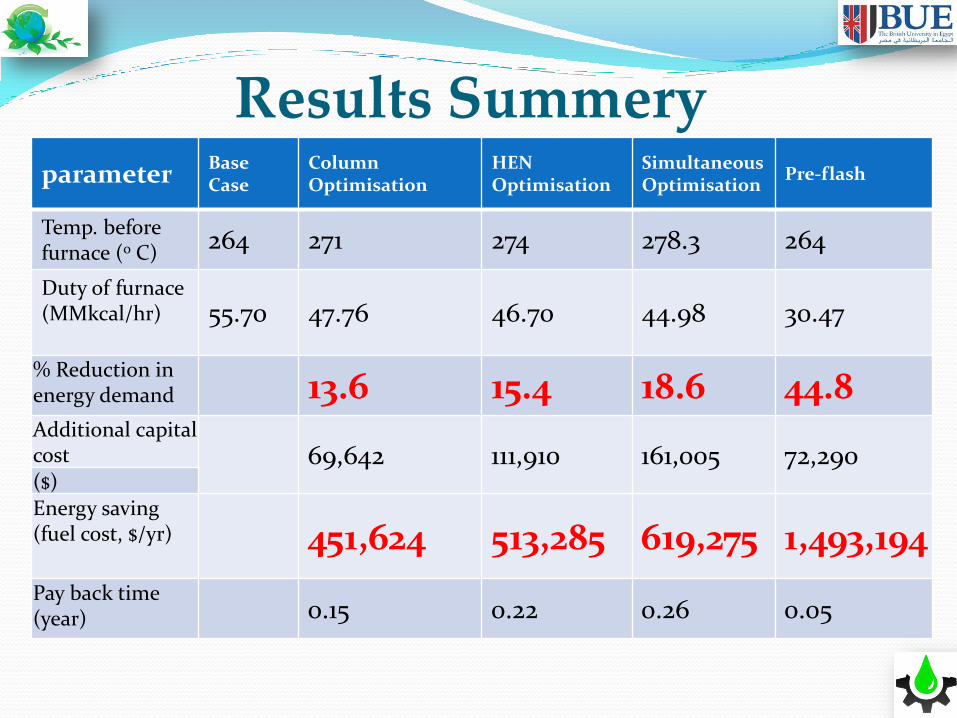
Results Summery parameter
Base Case
Column Optimisation
HEN Optimisation
Simultaneous Optimisation
Pre-flash
Temp. before furnace (o C)
264 271 274 278.3 264
Duty of furnace (MMkcal/hr) 55.70 47.76 46.70 44.98 30.47
% Reduction in energy demand 13.6 15.4 18.6 44.8 Additional capital cost 69,642 111,910 161,005 72,290 ($) Energy saving (fuel cost, $/yr) 451,624 513,285 619,275 1,493,194
Pay back time (year) 0.15 0.22 0.26 0.05
Conclusion and Future Work
New retrofit approach is applicable to existing refinery distillation units
Rigorous process models are of great significance in retrofit studies
Energy can be reduced substantially with optimisation
Column and HEN can be dealt with simultaneously
Structural modifications improve energy efficiency further
energy and fuel costs can be reduced by up to 44%
Automation of optimisation algorithm
Recommended