186 E N E • F A R M F u E l C E l l S y S t E M S F o R R E S i d E N t i A l u S E
Koizumi actively promoted the commercialisation
and deployment of fuel cells. Demonstration
research projects of stationary fuel cell systems
were per formed at 55 sites between 2002 and
2004 under a national policy, and the first two
commercial units manufactured by Matsushita
Electric Industrial Co., Ltd (presently Panasonic)
and Ebara Ballard Corporation (a joint venture of
Ebara and Ballard that has since been dissolved),
respectively, were installed in the Prime Minister’s
official residence in March 2005. Subsequently,
field tests prior to commercialising the systems
were started in house holds under actual operating
conditions to evaluate their performance.
Fuel cell cars and hydrogen stations
In 2002, the first hydrogen refuelling station was
built on the site of Tokyo Gas Senju Techno Station
as part of the government-sponsored “Major
Demonstration Projects for Hydrogen Fuel Cell
Systems”. This hydrogen station was jointly con-
structed by Tokyo Gas and Nippon Sanso
Corporation for verifying hydrogen purification,
supply technology, operational know-how, and so
forth through actual operations and supply to fuel
In a world first, gas companies in Japan started
selling fuel cell systems for residential use in May
2009. These fuel cell systems generate electricity
and hot water through a chemical reaction
between oxygen in the atmosphere and hydrogen
extracted from city gas1, LPG or kerosene, and are
expected to play a key role in combating global
warming by reducing CO2 emissions from the
residential sector.
The systems were developed through demon-
stration research projects conducted by the gov-
ern ment, manufacturers and energy utilities start-
ing in fiscal 2002, and underwent government-
sponsored major demonstration projects from
fiscal 2005. The fuel cell systems for residential
use are expected to greatly reduce CO2 emissions
from energy consumption in the residential sector,
and thus become a major countermeasure against
global warming. In this article, I will describe these
fuel cell systems, and the process from
development to marketing.
l Fuel cells as national policy
Installation of commercial units in the Prime
Minister’s official residence
Fuel cells are expected to play a dominant role in
the new energy policies of the Japanese govern-
ment as urgent countermeasures for global warm-
ing. In particular, fuel cell systems for residential
use, which substantially reduce CO2, have
attracted the attention of various sectors who
would like the systems to be put into practical use
as soon as possible. The Japanese government
was ahead of other countries in introducing fuel
cell cars, and the then Prime Minister Junichiro
1 City gas is the gas supplied by gas utilities through reticulated pipeline networks.
ENE•FARM Fuel Cell Systems for Residential useBy Shunichi Eguchi
Shunichi Eguchi: fuel cell systems for residential use are expected to greatly reduce CO2 emissions.
187E N E • F A R M F u E l C E l l S y S t E M S F o R R E S i d E N t i A l u S E
and used various fuels such as city gas, LPG and
kerosene (see Table 1 over). Of 16 energy supply
companies, the five city gas utilities of Tokyo Gas,
Osaka Gas, Toho Gas, Saibu Gas and Hokkaido
Gas participated in this project. Japan is the only
cell cars, and attracted much interest from dele-
gates at the 22nd World Gas Conference in 2003.
Meanwhile, Tokyo Gas has been working on
developing and commercialising hydrogen energy
and fuel cell systems, such as high-efficiency
technology for purifying hydrogen by reforming
city gas methane, in order to spread hydrogen-
based infrastructure and pave the way for the
hydrogen society of the future. If the infrastructure
for delivering hydrogen to ordinary households
can be established, then stationary fuel cell sys-
tems will be simplified considerably.
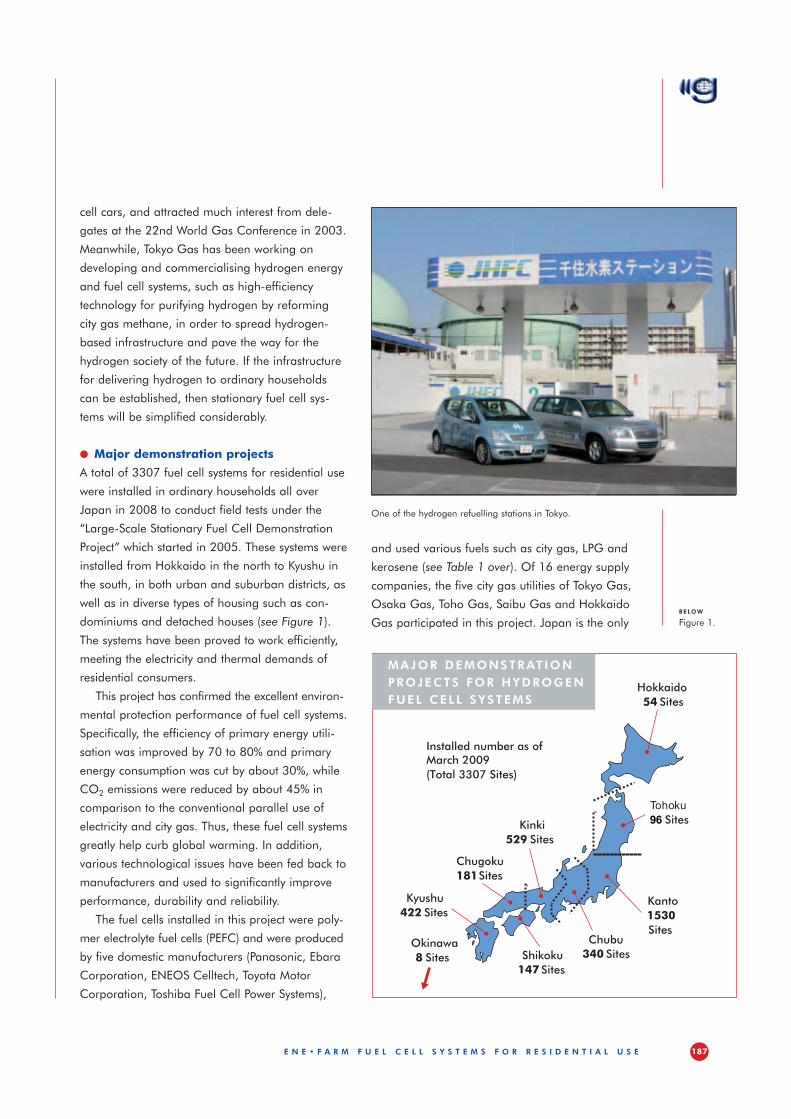
l Major demonstration projects
A total of 3307 fuel cell systems for residential use
were installed in ordinary households all over
Japan in 2008 to conduct field tests under the
“Large-Scale Stationary Fuel Cell Demonstration
Project” which started in 2005. These systems were
installed from Hokkaido in the north to Kyushu in
the south, in both urban and suburban districts, as
well as in diverse types of housing such as con-
dominiums and detached houses (see Figure 1).
The systems have been proved to work efficiently,
meeting the electricity and thermal demands of
residential consumers.
This project has confirmed the excellent environ-
mental protection performance of fuel cell systems.
Specifically, the efficiency of primary energy utili-
sation was improved by 70 to 80% and primary
energy consumption was cut by about 30%, while
CO2 emissions were reduced by about 45% in
comparison to the conventional parallel use of
electricity and city gas. Thus, these fuel cell systems
greatly help curb global warming. In addition,
various technological issues have been fed back to
manufacturers and used to signifi cantly improve
performance, durability and reliability.
The fuel cells installed in this project were poly-
mer electrolyte fuel cells (PEFC) and were produced
by five domestic manufacturers (Panasonic, Ebara
Corporation, ENEOS Celltech, Toyota Motor
Corporation, Toshiba Fuel Cell Power Systems),
Hokkaido 54 Sites
Tohoku 96 Sites
Kanto
1530 Sites
Chubu
340 Sites Shikoku 147 Sites
Kinki 529 Sites
Chugoku 181 Sites
Kyushu 422 Sites
Okinawa 8 Sites
Installed number as of March 2009 (Total 3307 Sites)
MAjoR dEMoNStRAt ioN PRojECtS FoR HydRogEN FuEl CEll SyStEMS
One of the hydrogen refuelling stations in Tokyo.
below
Figure 1.

188 E N E • F A R M F u E l C E l l S y S t E M S F o R R E S i d E N t i A l u S E
l Start of general sales of fuel cell systems
for residential use
Unified name of “ENE•FARM”
The Fuel Cell Commercialisation Conference of Japan
(FCCJ), which comprises firms and organi sations
including fuel cell manufacturers and gas utilities,
decided to unify the names of fuel cell systems under
the “ENE•FARM” brand, and held a press conference
in June 2008, which was attended by representatives
from various companies, mini stries and agencies,
as well as journalists repre sen ting more than 40
companies including three TV broadcasting
stations. The term “ENE•FARM” comes from “energy”
and “farm”. Generating electricity and heat from
hydrogen and oxygen is similar to growing crops from
water and soil, so the word conveys the futuristic
concept of creating our own energy. The logo (see
Figure 2) expresses the environmental friendliness
of fuel cell systems for residential use and
symbolises a tree providing new energy and
benefits to people and the earth. The fruits of the
tree represent various values including electricity,
hot water, comfort and environmental protection,
provided by fuel cell systems for residential use.
country where fuel cell systems for residential use
are being used on such a scale.
l Activities at the Hokkaido Toyako Summit
– zero-emission house and fuel cell systems
In July 2008, the G8 Summit – dubbed the
Environmental Summit – was held in Toyako in
Hokkaido. On the sidelines of this summit, the
Japan Gas Association (JGA) organised various
acti vities to showcase Japan’s energy policy for
cogeneration and other technologies including
residential fuel cells with the cooperation of the
International Energy Agency, as well as to help
increase awareness and knowledge of the latest city
gas technologies among many visitors from abroad.
The zero-emission house was a futuristic house
constructed by the Japanese Ministry of Economy,
Trade and Industry near the International Media
Centre, which was used by journalists from all
over the world. The JGA built a footbath in the
house, which was powered by a fuel cell unit for
residential use which included other types of fuel,
in partnership with the New Energy Foundation.
This footbath was particularly popular with visitors,
including the leaders of the summit countries, the
first ladies, aides and journalists. The footbath,
which enabled visitors to warm their feet in hot
water, was an excellent way of increasing their
understanding of fuel cell systems for residential use.
Manufacturer Number of fuel cells Fuel type Number of fuel cells
ENEOS Celltech 1253 LPG (propane) 1614
Toshiba Fuel Cell Power Systems 748 City gas 1379
Ebara Corporation 710 Kerosene 314
Panasonic 520
Toyota 76
TOTAL 3307 TOTAL 3307
BREAKdoWN oF RES idENt iAl FuEl CEllS iN jAPAN By MANuFACtuRER ANd FuEl
Figure 2.
right
Table 1.

189E N E • F A R M F u E l C E l l S y S t E M S F o R R E S i d E N t i A l u S E
companies cost from ¥3.2 million ($33,000) to
¥3.465 million ($35,800); the rated output of the
Panasonic unit is 1 kW and the ENEOS Celltech
unit is 750 W.
The Ministry of Economy, Trade and Industry
started a support programme which subsidises
half the cost of equipment and installation, up to
¥1.4 million ($14,460) per unit in fiscal 2009.
The project’s budget for the first year is more than
¥10 billion ($103 million).
The six companies are now engaged in
extensive marketing with the aim of selling 2.5
million units2 by 2030, which is the government’s
forecast, thus making ENE•FARM a standard
feature of Japanese homes in the future.
Shunichi Eguchi is Deputy General Manager of the
Business Operating Department of the Japan Gas
Association (www.gas.or.jp).
2 The number of residential CHP systems, including residential fuel cells, in 2030, as forecasted by the Long-Term Energy Supply and Demand Outlook.
Full-scale marketing of “ENE•FARM” fuel cell
systems for residential use
The six companies of Tokyo Gas, Osaka Gas,
Toho Gas, Saibu Gas, Nippon Oil (ENEOS) and
Astomos Energy held a ceremony in January 2009
to mark the start of marketing ENE•FARM fuel cell
systems for residential use, and signed a joint
declaration in which they declared they would
totally commit themselves to widespread marketing
of ENE•FARM under the joint slogan “ENE•FARM
– Helping to Establish an Environmentally
Advanced Nation”. The joint declaration also
expressed the companies’ expectations that
ENE•FARM will be widely used as an important
means for achieving a low-carbon society, and
will help establish Japan as the world’s leading
environmentally advanced nation.
Currently, three of the companies, Panasonic,
ENEOS Celltech and Toshiba Fuel Cell Power
Systems, are mass-producing fuel cell systems,
and they launched full-scale general sales in May
2009. The ENE•FARM systems sold by the six
Presidents of the six companies and Director-General Ishida of the Agency for Natural Resources and Energy, shaking hands following the signing of the joint declaration

Ultrasound technology from SICK: ... reliable even in CO2-rich gasesUntil now ultrasonic gas flow meters only worked to a limited extent in gases with a high carbon dioxide content. In order to tackle the high acoustic attenu-ation of such gases, SICK – leader in ultrasound techno logy – dev-eloped innovative sensors, path concepts and signal processing methods. The result: the FLOWSIC600 ultrasonic gas flow meters can be used reliably and with long-term stability in prac-tically any gas compo sition – including gases rich in CO2. And they are less costly and more reliable, as they require less maintenance and offer many diverse diagnostic possibilities.
The use of unconventional gas reserves brings with it increasingly com plicated metering situ ations. One particular challenge here is the increasing levels – up to 100% – of CO2 content in the gas, as, for example is usual when storing or reinjecting CO2 into underground reservoirs or declining oilfields. The storage of gas involves huge flow volumes that have to be reliably recorded. In order to make ultra sound technology usable for CO2 applications as well, SICK not only systema tically developed the stacked sensor design but also optimized it for this measurement.
v Longitudinal oscillators inject signals betterModern sensor technology has moved away from bimorph wideband sensors, which always had to battle with overlaying frequencies that impaired the quality of the measurement as a whole. By contrast, sensors with resonance converters – socalled ‘stacked ultrasonic transducers’ – work within a welldefined frequency range (see chart 1) and do not transmit any unwanted signals. Even with signals of short duration, it is possible to achieve the greatest possible amplitude. They permit relatively short acoustic pulses with high spectral purity. Furthermore, SICK is able to manufacture minia turised sensors for very small pipe diameters, e.g. probes with an 8mm diameter, as used in 2“ DN50 gas flow pipes.
The measurement path in gases with a high CO2 content has to be as
short as possible. The measured signal strength reduces over the path length. Where the signal to noise ratio for a direct path measurement is still good (see chart 2), the ratio could be too low for a reliable measurement with an increased path length. In a highly attenuating gas, the only pathlayout that comes into question is therefore a direct layout with no reflection of the signal on the pipe wall (see chart 2).
Disturbances caused by pressure regulator noises are minimized through the use of electric amplifiers with minimal inherent noise and optimized signal processing methods. They reliably rule out any corruption of the measurement results even when used in carbon dioxide.
v Outstanding results even without calibrationThrough optimal path layout, coupling of the ultrasonic signal via stacked ultrasonic transducers and the use of electronic equipment with minimal inherent noise, SICK has been able to take measurements reliably in CO2 despite its attenuating effect. Test installations in a CO2 reinjection project (8“, CO2 content of 62%) show that ultrasonic meters are extremely well suited for applications in high CO2 concentrations.
frequency
acou
stic
pre
ssur
e le
vel
105 k Hz 305 k Hz
Typical gas composition in %
CO2 CH4 C2H6 C3H8 N2
62,1 37 0.3 0.1 0.5
l[dB
]
Signal Level Chart
reflection loss
A
B
210
rel.
sign
alle
ve
rel. path length
noise level
Signal to Noise Ratiodirect path
Signal to Noise Ratiosingle bounced path
C
D
E
direct path
single bounced path
Chart 3: Typical gas composition at the reinjection of natural gas with a high CO2rate
Chart 2: Signal level chart
Chart 1: Frequency range of a ultrasonic sensor with resonance converter

SICK MAIHAK GmbH | Reute | Germany | www.sick.com
The new are gas ow measurement device
Life’s never dull in are stacks. In no time, a gentle ow can become a hurricane. That’s when you need a superior ow meter – the FLOWSIC 100 FLARE. It was just counting individual molecules, now it has switched to maximum measurement. Its unique measurement probe has an optimized pro le shape, designed to prevent turbulence at ow rates of up to 120 m/s. So the FLOWSIC 100 FLARE is durable and keeps measuring under all conditions. What did you expect? It’s made by SICK.
www. owsic100 are.com
FFFFFFFFFFFLOWSIC 100 FLARE
a4_flare_e.indd 1 23.04.2009 16:59:19 Uhr

192 N o R t H A M E R i C A g A S M A R K E t i N t E g R A t i o N : S t A t u S A N d S t E P S
US-Mexican market and identify benefits of further
collaboration in US-Mexican market dev elopment.
The Canadian, US and Mexican natural gas
markets have evolved differently over the years
with a much higher degree of interaction between
the US and Canadian markets. That interaction is
generally seen as having a favourable impact on
all segments of the markets. There are several
factors that have contributed to this success and
which, if replicated in US-Mexican interactions,
could further Mexico’s contribution to the North
American gas marketplace.
l Background
It is useful to first examine some demographic and
natural gas facts concerning each of the three
countries in 2008 (see Table 1).
Additionally, there are wide differences in the
natural gas supply/demand balance as shown in
Table 2.
In Canada, supply is greater than demand,
whereas in Mexico and the US it is reversed. As a
result, both the US and Mexico are dependent on
imports of natural gas to augment domestic
production, Mexico somewhat more so at 20%
versus the US at 15%. These could be either
supplies from one of the other three countries or
imported LNG.
There are almost twice as many physical inter-
connections between the US and Canada than
between the US and Mexico: 31 physical intercon-
ec tions along the US-Canadian border compared
to 16 along the US-Mexican border (see Figure 1).
This leads to the fact that more gas flows bet-
ween the US and Canada than between the US
and Mexico. In 2008, the relationship was over
10 times greater between the United States and
Canada (see Table 3).
Reinforcing the ability to move gas between the
US and Canada, the US-Canadian interconnects
have a combined capacity of nearly 19 bcf/d
spread across four major access routes, spaced
almost evenly across the length of the US-Canadian
Gas market integration is the focus of Strategic
Guideline 3 of the 2006-2009 Triennium and work
in this area has been coordinated by a special Task
Force. Past issues of the IGU Magazine have inc-
luded papers on the energy relationship between
Russia and Germany, cooperation between Qatar
Petroleum and ExxonMobil, South America’s
Southern Cone and the Iran-Pakistan-India pipeline
project. In this issue we have three more case
studies and the first looks at North America.
The main objective of this paper is to compare the
integration of the US-Canadian market with the
North America gas Market integration: Status and Steps
Country Population GDP Land Mass Proven Gas (millions)¹ (US$ billions)¹ (million square Reserves (tcf)² kilometres)
USA 307 14,330 9 238
Mexico 111 1,143 2 18
Canada 33 1,564 10 58
1 Source: CIA World Factbook 2008.
2 Source: BP Statistical Review of World Energy, June 2009.
BACKgRouNd FACtS
2007 2008
Country Supply Demand Supply Demand (bcf/d) (bcf/d) (bcf/d) (bcf/d)
US 52.3 63.1 56.2 63.4
Mexico 5.2 6.1 5.3 6.5
Canada 17.8 9.4 16.9 9.7
Source: BP Statistical Review of World Energy, June 2009.
NAtuRAl gAS SuPPly/dEMANd BAlANCE
below
Table 1. Table 2.

193N o R t H A M E R i C A g A S M A R K E t i N t E g R A t i o N : S t A t u S A N d S t E P S
l Sector development in the three
countries
A number of factors have influenced the develop-
ment and utilisation of natural gas in the three
countries. Among the most important factors are
contract and market structure, governmental
regulation, infrastructure and exploration and
development.
Historically, the US and Canadian experience
with natural gas has been similar, and different
than Mexico’s. These different evolutionary paths
help explain why the US and Canadian markets
are highly integrated today. In recognising the
benefits of the US and Canadian markets, there
is incentive for Mexico to consider similar
border. By contrast, US-Mexican capability is more
constrained with only one major interconnect, at
about 0.5 bcf/d, along with a variety of pipeline
laterals that provide some additional capacity.
P i PEl iNE iNtEgRAt ioN
Source: US Energy Information Administration, Office of Oil and Gas, Natural Gas Division, Imports/Export Points Database.
Flows in million cubic Mexico Canada feet per day (2008)
US imports from: 117 9,953
US exports to: 991 1,534
Total flows to/from 1,108 11,487
Source: BP Statistical Review of World Energy, June 2009.
gAS FloWSleft
Table 3.
left
Figure 1.
194 N o R t H A M E R i C A g A S M A R K E t i N t E g R A t i o N : S t A t u S A N d S t E P S
Commission (FERC). As to the physical contract
structure between parties, many parties prefer to
use a standard form contract developed by NAESB
(North American Energy Standards Board). By
contrast, the structure of financial contracts is often
governed by the ISDA (International Swaps and
Derivatives Association) standard structure.
Besides approving a pipeline’s rates and
services, FERC also has jurisdiction over requests
to build interstate pipelines. Pipelines that do not
cross state boundaries (i.e., are intrastate in
nature) generally fall under the jurisdiction of the
local state public utilities commission. As a result,
FERC’s decisions have more influence on the
development of a national gas market.
Any customer may purchase pipeline capacity,
subject to being creditworthy. The delivery points
might be to a local gas distribution company
(LDC) for redelivery to LDC customers such as
residences and commercial businesses, industrial
customers or natural gas burning electric gener-
parameters in order to potentially enjoy similar
benefits.
United States
The US market structure has evolved to what could
be characterised as a liberal or decentralised
level. In the gas value chain, exploration and
production (E&P) is open to all interested parties, a
function of the private monetary capital parties are
willing to commit. Market share among producers
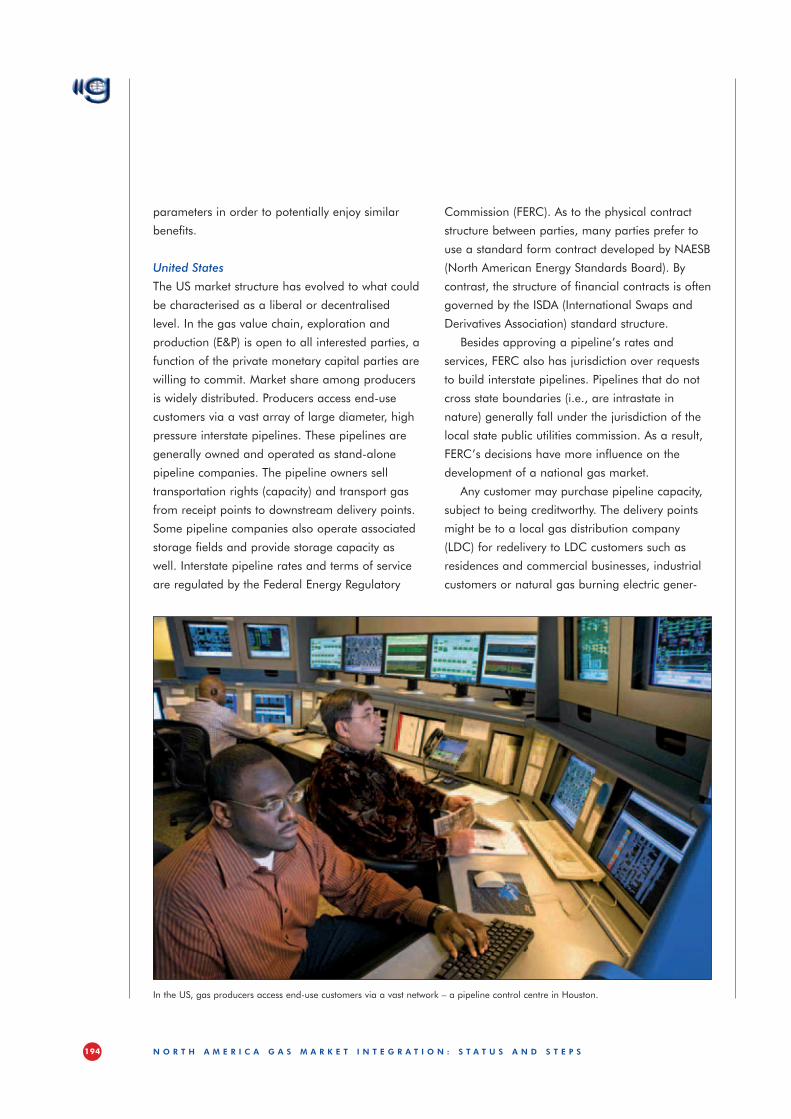
is widely distributed. Producers access end-use
customers via a vast array of large diameter, high
pressure interstate pipelines. These pipelines are
generally owned and operated as stand-alone
pipeline companies. The pipeline owners sell
transportation rights (capacity) and transport gas
from receipt points to downstream delivery points.
Some pipeline companies also operate associated
storage fields and provide storage capacity as
well. Interstate pipeline rates and terms of service
are regulated by the Federal Energy Regulatory
In the US, gas producers access end-use customers via a vast network – a pipeline control centre in Houston.

195N o R t H A M E R i C A g A S M A R K E t i N t E g R A t i o N : S t A t u S A N d S t E P S
Canada
The Canadian market, similar to the US market,
has also evolved to what could be termed a
liberalised or decentralised level.
As with the US, exploration and production
is open to all interested parties with numerous
producers active in both the US and Canadian
E&P business. Pipelines are operated as open
access transportation companies, separate
from the E&P business. Canada has fewer large
diameter pipelines than the US, but sufficient
capacity to move gas from the production basins,
largely in western Canada, to eastern Canada
and to the US. In Canada, the government
controls much of the land on which drilling
can occur, and receives royalty payments tied
to production.
LDCs in Canada function similarly to those
in the US, with emphasis on procurement and
delivery of supply for commercial and residential
customers. They may also serve industrial and
natural gas-fired electric generation load.
Canada’s first LNG import terminal at St John
received its first cargo in June 2009 and another
is planned (see Table 5).
ation power plants. Generally, industrial and
natural gas electric generation customers purchase
their own natural gas supplies, while LDCs obtain
supplies for commercial and residential customers
and are regulated at the state level. By rule,
pipeline companies are not directly involved in the
commodity segment of the natural gas business,
just transportation and storage.
Another factor affecting natural gas develop-
ment is the natural gas liquids market. To some
extent, producers can assess the relative economic
value of treating and removing for sale the heavier
hydrocarbons instead of leaving them in the nat-
ural gas stream. This affects the quantity of energy
contained in the natural gas delivered downstream
to end use customers and can affect the gas
quality. Generally, pipelines and their customers
have found ways to address changing gas quality
but some issues remain, often dependent on local
circumstances and the historical gas quality of the
particular geographic area.
LNG is playing a growing role in the US
although recent reductions in natural gas prices
have resulted in lower imports in 2008 and 2009.
There are currently nine operational receiving
terminals with plans for several more (see Table 4)
as well as one export facility (Kenai, Alaska). LNG
comprised about 2% of total US consumption in
2008 and about 9% of total imports. Two different
federal agencies have permitting authority over
terminals (FERC and the US Coast Guard), dep-
ending on whether the project is located onshore
or offshore.
The price of natural gas is not controlled by
regulation but is determined in the open market
place, with physical and financial alternatives
available. The market is characterised by high
liquidity, that is, a number of trading points where
buyers and sellers can ascertain market prices in
a transparent manner, with publishers issuing
reports on pricing activity within 24 hours. Terms
of sales can be anywhere from a day or less to a
year or more.
Name Location Capacity (bcf/d)
Everett Boston, Massachusetts 1.0
Cove Point Cove Point, Maryland 1.8
Elba Island Elba Island, Georgia 1.2
Lake Charles Lake Charles, Louisiana 2.1
Gulf Gateway Energy Bridge Offshore, Louisiana 0.5
Northeast Gateway Offshore, Massachusetts 0.8
Sabine Pass Cameron Parish, Louisiana 2.6
Freeport Freeport, Texas 1.5
Cameron Hackberry, Louisiana 1.5
Source: Federal Energy Regulatory Commission.
uS lNg RECE iV iNg tERMiNAlS
above
Table 4.

The best of both worlds. By ROSEN Europe Inspection Technologies highly accurate detection of metal loss and pipeline wall features with a single inspection tool combining Magnetic Flux Leakage (MFL) and Ultrasonic Testing (UT)
v IntroductionThough an important technology used to detect many different types of defects in pipelines, Magnetic Flux Leakage (MFL) is not the ideal method for identifying certain geometries, notably large uniformly corroded areas and twodimensional midwall discontinuities such as laminations. Similarly, Ultrasonic Testing (UT) tends not to reveal small corrosion pits and internal defects covered by wax and other deposits. In response to these limitations, ROSEN Inspection Technologies has developed RoCorr·UT (see Figure 1), a new Combo tool in which the two inspection methods ideally complement each other.
v Integrating different inspection methods In the presence of internal or external metal loss, the magnetic flux created as part of the MFL method “leaks” out of the pipeline. Since this leakage is recorded by halleffect sensors, the location of defects as well as the depth, length and width of the recorded metal loss can be accurately inferred. MFL technology is especially suitable for detecting even very small pitting defects. This strength of MFL technology is at the same time the weakness of the UT inspection method which cannot, as a general rule, detect anomalies smaller than 1020mm.
The strength of the UT method is direct measurement of twodimensional features, notably pipe wall thickness. Taking into account relevant factors such as
the velocity of ultrasound in the coupling fluid and in the pipe wall, UT inspections measure the time of flight of ultrasonic signals reflected from the internal and external surfaces of the pipe wall as a basis for determining both metal loss and wall thickness.
Capable of compensating for the weaknesses of each technology used on its own, the combination of MFL and UT provides highest accuracy in length, depth and width measurements for exact defect shapes and precise information on general wall thinning. The detailed defect shapes provided not only result in improved defect classification which in turn translates into fewer false alarms, but they also enable sophisticated asset profiles for RSTRENG (Remaining Strength of Corroded Pipe) and other assessment methods. Inspection tools combining both methods furthermore show excellent detection performance for numerous metal loss flaws (e.g. pitting, axial grooving, circumferential grooving), midwall features (e.g. lamination, inclusions, blisters), weld features (e.g. girth welds, longitudinal welds, spiral welds), geometry features (e.g. dents, ovalities, misalignments), and other features (e.g. valves, fittings, bends). Last but not least, the RoCorr·UT tool combining MFL and UT can be used in both liquid and gas pipelines and achieves exceptionally high probability of detection (POD) and probability of identification (POI) rates.
v ConclusionAmalgamating the advantages of the two nondestructive testing methods Magnetic Flux Leakage and Ultrasonic Testing, ROSEN’s new RoCorr·UT combo tool is capable of traversing pipelines between 6 and 56”, negotiating a minimum bend radius of 1.5 D, and conducting uninterrupted inspections of up to 300 km. As shown during numerous runs, the integrated tool detects common defects such as corrosion pitting and irregular general corrosion, accurately sizes large uniformly corroded areas and laminations, and even measures pipeline wall thickness to an accuracy of ± 1mm. RoCorr·UT therefore not only makes an invalu able contribution to integrity management, but also significantly reduces both inspection costs and operational risk, since all data is gathered in a single run.
Figure 1: The new RoCorr·UT tool consists of an MFL and a UT unit and is available in sizes ranging from 6 to 40”.

INNOVATION.In its quest for ideal solutions for the oil and gas industry, ROSEN designs, develops and
manufactures its inspection instruments in-house.www.roseninspection.net
EMPOWERED BY TECHNOLOGY
Innovation_A4_20090622.indd 1 22.06.2009 10:10:43

198 N o R t H A M E R i C A g A S M A R K E t i N t E g R A t i o N : S t A t u S A N d S t E P S
There are numerous market participants, with
commercial relationships developed over years.
The commodity market, like the US, is deregu-
lated, with natural gas commodity prices a function
of an open market. Canadian suppliers also tend to
utilise similar contractual arrangements as in the US.
Mexico
The Mexican natural gas industry has evolved
much differently than in the US and Canada. Until
1995, virtually the entire Mexican natural gas
industry was exclusively controlled by the federal
government, including pricing. Today, exploration,
production and processing remains closed to
The liquids market plays a large role in the
Canadian natural gas business with liquids
projects often as important, if not more important,
to developers than a single focus on extraction of
natural gas.
At the federal level, the National Energy Board
(NEB) serves as the FERC equivalent and regulates
the inter-provincial pipelines. What characterises
both the US and Canadian market is a stable
regulatory environment in which governmental
and regulatory policy promotes transparent, non-
discriminatory market participation and environ-
mental protection. Infrastructure investment is
encouraged and market forces drive development.
Name Location Capacity (bcf/d) Consortium
Canaport (operational) St John, New Brunswick 1 Irving Oil/Repsol
CacounaEnergy (planned) Rivière-du-Loup, Québec 0.5 TransCanada/PetroCanada
Source: Federal Energy Regulatory Commission.
CANAdiAN lNg RECE iV iNg tERMiNAlS
Canaport, Canada’s first LNG receiving terminal, started up in June 2009.
right
Table 5.

Nature invented skin
Perfection in Pipe protectionA smart, flexible and economical solution
www.pipeprotection.comExperienced partners in pipe protection
BlueJetty®
In natural gas transport andliquified gas transmission
systems certain pipes requirespecial protection. In order
to fulfil these requirements inan economically effective and
durable way, a new and flexibleprotection system has been
introduced on the gas marketby Dutch specialists.
Over 30 years of experience in research,engineering and development of glassfibre reinforced products laid thefoundation of Blue Jetty, a uniquesystem of top quality pipe protection.The system protects pipes:for insulation of hot or cryogenictransmission systems (LNG),mechanically for horizontal directionaldrilling (HDD),or for the prevention of corrosion (CP).
Mill applied GRP and GREThe principle of this new pipe protectionsystem, named Blue Jetty, is smart.A spray winding machine movesgradually alongside a rotating pipe toapply one or more layers of glassreinforced composites homogeneouslyon to the pipe.The various combinations of glass fibre,resins and special fillers determine,together with the thickness of theapplied layers, the technical propertiesof the mechanical, insulation or anticorrosion protection.
•
•
•The Blue Jetty GRP/GRE systemguarantees a constantly superb qualityof the required protection properties.
Cryogenic applications demand a highfire retardancy and thermal performance.The GRP protection layers applied bythe Blue Jetty are highly recommendedfor temperatures down to –165ºC(–265ºF).
MobilityThe Blue Jetty is a mobile unit, i.e. themachine is transported by containerand can easily be installed on locationsaround the world, where skilledspecialists operate the machine.
The unit can protect pipes witha diameter up to 56”, a length of20 meter and a weight of 20 ton.
PiPr0707advertentie:Opmaak 1 05-07-2007 15:53 Pagina 1

200 N o R t H A M E R i C A g A S M A R K E t i N t E g R A t i o N : S t A t u S A N d S t E P S
other hydrocarbon products is not fully developed.
Natural gas transportation and storage are
open to private investment but do not provide a
clear open access schema, as US and Canadian
pipelines do. Both activities are regulated by the
Comisión Reguladora de Energía (CRE), the
Mexican federal equivalent of the US FERC and
the Canadian NEB. A large diameter, high pressure
pipeline system is partially developed on a local-
ised basis with a combination of both privately
sponsored projects and government sponsored
projects, but there is not a long-term planned
national transmission system.
LNG has been encouraged in Mexico, parti cu larly
by the Comisión Federal de Electricidad (CFE) to
support natural gas-fired electric power gener-
ation, with two operational projects (Altamira and
Costa Azul), one approved project under construc-
tion (Manzanillo) and other projects under study,
such as Puerto Libertad and Lazaro Cardenas (see
Table 6). Several other sites have been identified for
potential development. The main reason for this
development for a producer country such as Mexico
is the lack of supply and transportation capacity, a
reflection of constitutional restrictions permitting only
PEMEX, and no private companies, to invest in E&P.
The liquids market is only marginally developed
but has the potential to grow substantially.
l Conclusions
The US and Canada enjoy the benefits of virtually
full integration between the two countries with
positive effects on flexibility, availability and net-
work development. There are numerous physical
interconnections that allow the movement of nat-
ural gas in either direction between the countries.
Governmental regulation is similar in both coun-
tries with the general goal being the prudent
development of the natural resource for the benefit
of all consumer segments: residential, commercial,
industrial and power generation. Further, natural
gas prices are established in the marketplace; they
are not government regulated. A national trans-
private investment, in accordance with the federal
constitution, with the federal agency, PEMEX, the
only entity allowed to own the resources. Revenues
received by PEMEX are mainly used to support the
federal government budget.
Pricing policy varies. Natural gas is generally
priced in the US open market using a few Texas
indices such as Houston Ship Channel, Texas
Eastern STX or Tennessee Zone 0, while prices for
other hydrocarbons such as gasoline, diesel and
LPG and electricity are under government control.
This variation in pricing policy creates a distortion
in customer consumption behaviour and imposes
an obstacle to a higher degree of integration with
Mexico’s neighbours.
The primary focus of service has been self con-
sumption in PEMEX for the oil industry accounting
for more than 40% of the total volume. Second in
importance is power generation with around 35%
followed by the industrial sector, with these last two
sectors being the primary driver for developing the
transmission and distribution network.
LDCs mainly serve the residential and commer-
cial sectors, and LDCs are usually owned by multi-
national European and US corporations. However,
service to the residential and commercial sectors is
not as widespread as it could be, as local munici-
palities have sometimes opposed the expansion of
natural gas due to pre-existing support for LPG. As
a result, competition between natural gas and
Name Location Capacity (bcf/d)
Terminal de LNG de Altamira Altamira 0.75
Energía Costa Azul Ensenada 1
Terminal KMS de GNL (due for 2011 completion) Manzanillo 1
Puerto Libertad Under study NA
Lazaro Cardenas Under study NA
Source: Natural Gas Market Outlook 2008-2017, SENER (Ministry of Energy, Mexico).
MEX iCAN lNg RECE iV iNg tERMiNAlS
below
Table 6.

cleaner-burning natural gas goes a long way. our technology makes it go even further.Natural gas is one of the world’s cleanest fuels. But it’s often found far from where it’s needed most. The solution? Supercool it to a liquid, transport it by ship, and then “regasify” it at its destination for delivery to local homes and power plants. Until recently this ingenious technology was only practical across shorter distances. But ExxonMobil’s scientists and engineers have transformed the scale on which natural gas can be safely and ef-ficiently liquefied and transported. So we can now carry 80% more liquefied natural gas across vast oceans and make more cleaner-burning energy available to more people the world over.
The story continues atexxonmobil.com
“Natural gas produces a lot less CO2 emissions than coal. That’s why its use in European power generation is growing so rapidly.”
Ferah Çakmak, Economist
Untitled-1.indd 1 2/6/09 11:09:23 AM

202 N o R t H A M E R i C A g A S M A R K E t i N t E g R A t i o N : S t A t u S A N d S t E P S
ability to accept flexible contractual delivery terms.
Mexico is in the enviable position of having sub-
stantial undeveloped natural gas resources. It can
choose to more efficiently further develop these
resources in an environmentally responsible
manner for the ultimate betterment of all its citi zens.
To achieve the maximum benefit, the Mexican
government needs to substantially reduce its control
over natural gas and allow private investment. By
recognising the benefits of partner ing with private
enterprise, the Mexican govern ment can become a
far more significant and effec tive participant in the
North American natural gas market place, and at
the same time, better meet the needs of its citizens.
In closing, here are key action steps Mexico
needs to take now, in order to more fully integrate
itself into the North American market:
l For contracting purposes, indicate support for
use of the NAESB and ISDA contract structures;
l Reduce PEMEX’s obligation to support the
federal budget;
l Open E&P to all interested parties; and
l Improve coordination between regulators to
develop joint energy policies.
If Mexico follows the steps mentioned above,
the North American natural gas market would be
strengthened by integrating all three countries
instead of just two. Accomplishing such integration
will require a major effort of coordination between
Mexican energy authorities, the Secretaría de
Energía (SENER) and CRE, and their counterparts
in the US and Canada.
Fortunately, Mexico has begun to take steps to
further open its gas industry. President Felipe
Calderón approved new energy reforms in April
2008 which focused on greater autonomy for
PEMEX. Although the reforms do not achieve full
autonomy for PEMEX, it is a first step and could
help other institutions (CRE, PEMEX, CFE and
SENER) increase the degree of integration. This
would allow Mexico to enjoy more of the benefits
of a multinational integrated market, including
greater market flexibility and security of supply.
portation grid exists, with transportation companies
moving natural gas from producing areas to areas
of consumption.
Mexican consumers could benefit from further
evolution along the lines of the US and Canadian
experiences. Currently, one of the strongest limit-
ing factors in the growth of the Mexican market is
the restriction on development, with E&P controlled by
the government and indirectly by PEMEX’s restrictions.
A related obstacle is that natural gas produc tion
is seen as a tool to support other objectives of the
federal government, not as a natural resource that
is evaluated and managed on its own merits in
the context of a North American market place.
If the Mexican government were to follow the US
and Canadian models, the government would
place more emphasis on infrastructure develop-
ment, both domestically and cross border, wel-
come privately funded E&P and free PEMEX of the
obligation to support the bud get; instead it would
invest. Such investment could lead to more oppor-
tunities to serve customers currently without access
to natural gas. Moreover, the government would
remove itself from setting natural gas prices and
instead recognise the efficiency of the existing
open market in the US and Canada.
Mexico can also look to Europe for additional
guidance as to how central governments can
gradually move to embrace and support open
markets. European governments endorse the
concept of multiple suppliers, and while many
purchasers still desire long-term contracts for
supply security, there is growing latitude in con-
tractual terms concerning prices and delivery/
purchase obligations. Often, prices paid for nat-
ural gas are linked in some manner to the price of
oil. By contrast, Asian markets, and in particular
Japan, have evolved somewhat differ ently. Asia
imports most of its natural gas as LNG, and with-
out its own domestic production or physical pipe-
line access to other countries with domestic pro-
duc tion, places great emphasis on supply security,
tending to favour long-term contracts with less

WE GET TO YOU.
We are the company that operates the longest pipeline system in our country. Our 8,000 kilometers of pipeline transport the gas that over ten million Argentinians use every day.
We are also there, behind that appetizing mate, driving the energy for life, driving towards the future.
Size: A4 297 x 210 mm.Bleed 6mm.

204 t H E t R A N S - A S E A N g A S P i P E l i N E
and adherence to the principles of the United
Nations Charter.
On December 15, 1997, at the 2nd ASEAN
Informal Summit held in Kuala Lumpur, Malaysia,
the ASEAN Heads of State adopted the ASEAN
Vision, which amongst other issues, called for
cooperation to “establish inter-connecting arrange-
ments for electricity and natural gas within ASEAN
through the ASEAN Power Grid and Trans-ASEAN
Gas Pipeline”. The objective was to enhance
security of energy supply for ASEAN while forging
greater economic cooperation amongst Member
Countries.
The Heads of ASEAN Power Utilities and
Authorities (HAPUA) were entrusted to lead the
ASEAN Power Grid while the ASEAN Council on
Petroleum (ASCOPE) was entrusted to spearhead
the Trans-ASEAN Gas Pipeline (TAGP). These two
major initiatives constitute the Trans-ASEAN Energy
Network.
The ASEAN Vision 2020, adopted by the ASEAN
leaders on the Association’s 30th anniversary, also
agreed on a shared vision of ASEAN as an
assembly of South East Asian nations, outward
looking, living in peace, stability and prosperity,
bonded together in partnership in dynamic dev-
elopment and in a community of caring societies.
ASEAN Member Countries have adopted the
following fundamental principles in their relations
This is the second of the case studies by the Task
Force looking at Gas Market Integration to be
presented in this issue of the IGU Magazine.
To formalise the spirit of cooperation among the
countries within South East Asia, the Association of
South East Asian Nations (ASEAN) was established
on August 8, 1967 in Bangkok by the five original
Member Countries, namely, Indonesia, Malaysia,
Philippines, Singapore and Thailand. Brunei
Darussalam joined on January 8, 1984, Vietnam
on July 28, 1995, Lao PDR and Myanmar on July
23, 1997, and Cambodia on April 30, 1999.
The objectives of ASEAN, as per the ASEAN
Declaration, state the aims and purposes of the
Association as being to:
l Accelerate economic growth, social progress
and cultural development in the region; and
l Promote regional peace and stability through
abiding respect for justice and the rule of law in
the relationship among countries in the region
the trans-ASEAN gas Pipeline – Accelerating gas Market integration within the ASEAN Region
An ASCOPE delegation visited the ASCOPE Gas Centre in Bangi, Malaysia, in November 2008.

205t H E t R A N S - A S E A N g A S P i P E l i N E
l Provide assistance to each other in the form
of training, the use of research facilities and
services in all phases of the petroleum industry;
l Facilitate the exchange of information which will
promote methodologies leading to success ful
achievements in the petroleum industry and which
may help in formulating policies within the industry;
l Conduct petroleum conferences on a periodical
basis; and
l Maintain close and beneficial cooperation
with existing international and regional organi-
sations with similar aims and purposes.
l Trans-ASEAN Gas Pipeline
The Trans-ASEAN Gas Pipeline (TAGP) project is an
ASEAN project based on the ASEAN Vision 2020.
The 17th ASEAN Ministers of Energy meeting
in Bangkok, Thailand in 1999 requested ASCOPE
with one another, as contained in the Treaty of
Amity and Cooperation in South East Asia (TAC):
l Mutual respect for the independence,
sovereignty, equality, territorial integrity and
national identity of all nations;
l The right of every state to lead its national
existence free from external interference,
subversion or coercion;
l Non-interference in the internal affairs of
one another;
l Settlement of differences or disputes by
peaceful manner;
Renunciation of the threat or use of force; and
Effective cooperation among themselves.
As of 2008, the ASEAN region has a
population of about 580 million, a total area of
4.44 million square kilometres, a combined GDP
of approximately $1500 billion and a total trade
of about $1700 billion.
l ASEAN Council on Petroleum
The ASEAN Council on Petroleum (ASCOPE) was
established on October 15, 1975, as an “instru-
ment for regional cooperation among Member
Countries of ASEAN”. Member Countries are repre-
sented in ASCOPE by their respective National Oil
Companies (NOCs) or, in cases where the country
does not have an NOC, by the authority in charge
of petroleum matters (see Table 1 and Figure 1).
In 1999, ASCOPE’s Vision, based on its initial
objectives of establishment was agreed upon as
follows: “ASCOPE shall be globally competitive in
an open international market by creating and
facilitating synergistic business opportunities while
actively engaging in the petroleum and petroleum
related business.”
As stipulated in the ASCOPE Declaration, the
Council’s Objectives shall be to:
l Promote active collaboration and mutual assis-
tance in the development of the petroleum
resources in the region through joint endeavours
in the spirit of equality and partnership;
l Collaborate in the efficient utilisation of petroleum;
Founding members
Pertamina for Indonesia
Petronas for Malaysia
Philippine National Oil Company (PNOC)
Singapore (later Singapore Petroleum Co. Ltd)
Thailand (later Petroleum Authority of Thailand)
Other members
For Brunei Darussalam, the Petroleum Unit of the Prime Minister’s Department joined in 1985. It was later replaced by PetroleumBrunei
PetroVietnam joined on November 5, 1996
Myanmar Oil and Gas Enterprise (MOGE) joined on February 14, 2001
The Cambodian National Petroleum Authority (CNPA) also joined on February 14, 2001
The Ministry of Energy and Mines for Lao PDR became the 10th member in 2006
MEMBERS oF ASCoPEleft
Table 1.

206 t H E t R A N S - A S E A N g A S P i P E l i N E
l Completion of the conceptual masterplan study
for the TAGP project in 2000, which was
approved by the ASCOPE Council in 2001. The
masterplan identified seven new possible gas
pipeline inter-connections in ASEAN and it ser-
ved as a useful guide in the long-term develop-
ment of the Trans-ASEAN Energy Network;
l Formation of the ASEAN Gas Consultative
Council (AGCC) in July 2003. AGCC was
created comprising representatives from the
ASEAN governments/authorities and ASCOPE
to address cross-border issues relating to gas
market integration and to facilitate the imple-
mentation of the TAGP project;
l Formulation and finalisation of the ASEAN MoU
on the TAGP in June 2004. The MoU provides
a broad framework for the ASEAN Member
Countries to cooperate towards the realisation
of the TAGP project to help ensure greater
regional energy security;
l Establishment of the ASCOPE Gas Centre
(AGC) in Malaysia that serves as the strategic,
technical and commercial information resource
and capacity building centre in facilitating the
implementation of the TAGP project; and
l Completion of the model TAGP Gas Sale and
Purchase Agreement and the Gas Transportation
Agreement.
The TAGP Task Force’s on-going activities
include the following:
l Creation of the Joint Venture Company (JVC);
and
l Conducting discussions on “Unaccounted-for
Gas Guideline”, “Emergency Pipeline Repair”
and “Corrosion Management”.
Progress of the TAGP infrastructure
The existing and planned cross-border gas
pipeline inter-connections in ASEAN are shown in
Figure 2.
The first cross-border gas pipeline inter-
connection was built in 1991 between Malaysia and
Singapore. Achievements from 1999-2006 were:
l 1999 – a 470-kilometre cross-border pipeline
to undertake the TAGP project. The conceptual
TAGP masterplan was completed in 2000 and the
ASEAN Memorandum of Understanding (MoU) on
the TAGP project was signed by all the ASEAN
Ministers of Energy on July 5, 2002 in Bali,
Indonesia. In June 2004, the MoU came into force.
Various bilateral agreements have been signed
between Petronas of Malaysia and Pertamina of
Indonesia, between Singapore and Malaysia and
between Singapore and Indonesia on the sale and
purchase of gas. New initiatives to implement the
MoU, such as the ASCOPE Gas Centre in Malaysia
and the establishment of the ASEAN Gas Consul-
tative Council, have been put in place.
With strong political will and support from the
ASEAN Ministers of Energy and the cooperation
of the ASEAN senior energy officials, the TAGP
project is being pursued collectively.
Activities undertaken by TAGP Task Force
Since its formation in 1999, the TAGP Task Force
has completed various activities to facilitate the
realisation of the TAGP.
To ensure smooth implementation of the above
activities, several Expert Working Groups (EWGs)
were established under the TAGP Task Force. The
EWGs were assigned to cover the main issues and
challenges in implementing the TAGP and their
activities include the following:
l Formulating a conceptual masterplan for the
TAGP infrastructure project;
l Facilitating the completion of a conceptual
project feasibility study;
l Identifying and addressing issues relating to
institutional, legal, financial/commercial,
health, safety and environmental, technical and
management matters; and
l Facilitating the execution and realisation of the
TAGP infrastructure project.
Key achievements of the TAGP Task Force
The key activities undertaken and completed by
the TAGP Task Force are as follows:

207t H E t R A N S - A S E A N g A S P i P E l i N E
COUNCIL
NATIONALCOMMITTEES
ASCOPESECRETARIAT
GOVERNINGCOUNCIL
ASEAN MINISTERSON ENERGY
MEETING (AMEM)
SENIOR OFFICIALSMEETING ON
ENERGY (SOME)
TAGP TASKFORCE
3 BUSINESSDEVELOPMENTCOMMITTEES
TECHNOLOGY & SERVICESCOMMITTEE
ASCOPE GASCENTRE
ASEAN GASCONSULTATIVE
COUNCIL
EWG 5 EWG 7 EWG 9 JVC
oRgANiSAt ioNAl StRuCtuRE oF ASCoPE
CRoSS -BoRdER gAS P i PEl iNE iNtER- CoNNECt ioNS iN ASEANleft
Figure 2.
left
Figure 1.

208 t H E t R A N S - A S E A N g A S P i P E l i N E
Myanmar in 2007 and 2008. New projects
underway or proposed are shown in Table 2.
Some of the additional initiatives planned to be
undertaken in the near future towards fully
implementing and realising the TAGP project are
updating the TAGP masterplan as well as
formulating harmonised principles for gas transit,
tariffs, technical specifications and taxation.
l Impact of the TAGP on gas market
integration in ASEAN
Currently, the TAGP is not fully integrated; but it is
being undertaken on a step-by-step approach
based on bilateral inter-connections, evolving
towards more integrated cross-border gas pipeline
inter-connections.
The TAGP infrastructures are being planned to
partly address the emerging and growing supply-
demand gas gaps in the region, in addition to the
from Yadana, Myanmar to Ratchaburi,
Thailand;
l 2000 – a 340-kilometre cross-border pipeline
from Yetagun, Myanmar to Ratchaburi,
Thailand;
l 2001 – a 660-kilometre cross-border pipeline
from West Natuna, Indonesia to Singapore;
l 2001 – a 100-kilometre cross-border pipeline
from West Natuna, Indonesia to the Duyong
field of Peninsular Malaysia;
l 2003 – a 470-kilometre cross-border pipeline
from South Sumatera, Indonesia to Singapore;
l 2005 – a 270-kilometre cross-border pipeline
from the Malaysia-Thailand Joint Development
Area to Peninsular Malaysia via Songkla; and
l 2006 – a 4-kilometre cross-border pipeline
from Malaysia to Singapore.
In addition to the above, several domestic gas
pipelines were completed in Vietnam and
Indonesia is ASEAN’s biggest producer and consumer of gas – its West Natuna gas field supplies Singapore via a pipeline opened in 2001.

209t H E t R A N S - A S E A N g A S P i P E l i N E
gas import from outside ASEAN, dampening
the external effect relating to energy/gas supply
uncertainties and gas price volatilities.
Nevertheless, the extent of the benefits depends
on the state of the economy of each country
(whether it is a net gas exporter or importer) and it
varies from one country to another due to country
specific factors such as the energy mix, energy
diversity, availability of domestic gas production,
contribution of gas revenue to the nation’s GDP
and others.
Security of energy supply and diversity
The issue on security of energy/gas supply and
diversity are more pronounced for gas importing
countries. In ASEAN, the major net gas importers
are Singapore and Thailand. For net gas impor-
ting countries, gas importation diversifies their
energy mix. Instead of relying on one energy
source such as oil or coal, these countries have
access to gas as an alternative source of energy.
Gas market integration via the TAGP allows gas to
be imported from different supply sources that
may emerge as the gas market develops.
In the case of Singapore, gas is imported from
both Malaysia and Indonesia. Previously, Singapore
relied on oil for its energy needs. Singapore
planned LNG imports by countries such as
Thailand and Singapore.
The impact of the TAGP on the regional gas
market
The TAGP has significant impact on the gas
market integration efforts in ASEAN. Generally, the
TAGP has helped to enhance the overall integration
between the various gas markets within the region.
There are numerous benefits derived from gas
market integration, as summarised below:
l Augment energy supply security and promote
energy diversification to reduce dependence on
oil;
l Monetise and maximise value of excess
indigenous natural gas resources in the region
(e.g. Myanmar and Indonesia);
l Enhance foreign income earnings for gas
exporting countries (e.g. for Myanmar and
Indonesia);
l Create local gas infrastructure/market and
other spin-off to industrialise the economies in
the region;
l Promote the use of natural gas which is a more
environmental friendly fuel; and
l Promote regional cooperation to enhance
energy security and reduce reliance on energy/
Country Pipelines and LNG Terminals
Thailand Proposed fourth Arthit to Rayong pipeline in Thailand Proposed 5 mtpa LNG terminal
Indonesia Proposed Cirebon to Semarang pipeline and Semarang to Gresik pipeline Proposed Kalimantan to Java pipeline Proposed LNG terminal
Singapore Proposed 3 mtpa LNG terminal
Malaysia Proposed Sabah to Sarawak gas pipeline
Philippines Proposed Batman 1 pipeline Proposed 1.5 mtpa LNG terminal
Vietnam Proposed Block B to O Mon pipeline
NEW PRojECtSleft
Table 2.

Platts has international gas markets coveredThe link between geopolitics and gas has always been close: the long-term nature of the business, the distance the gas travels, and the need for transit countries all distinguish it from oil, whose ease of transport makes it a relatively short-term business. However, this year has been marked by quite extraordinary developments: starting with the January gas crisis between Ukraine and Russia – which saw some countries in southern and eastern Europe almost completely cut off from imports for a fortnight and forced to rely on limited storage or some contractual reverse flows – and followed by the signing of the intergovernmental agreement for the European Union’s Nabucco pipeline project, in mid-July.
The European Union has been seeking to reduce its reliance on Russian gas for some years – Nabucco took over seven years to reach even this preliminary stage – but finding alternative sources in any serious volume has always been difficult. The Caspian region, historically and physically tied to Moscow, is torn
between the desire to find other markets and the knowledge that Russia could outbid European companies trying to market gas so far away from central Asia.
Liquefied natural gas is an obvious solution, but Iran’s pursuit of nuclear energy has so far ruled out this giant gas reserve holder from joining the gas exporters’ community. Qatar has imposed a moratorium on further developments at its North Field. Nigeria remains riven by internal conflict, and the new big producer, Australia, is the other side of the world from the EU, and is cultivating buyers in Asia, in particular the huge growth markets of India and China.
Keeping an eye on all these developments is a full-time job. Platts, by its robust coverage of prices for gas in Asia, the US and Europe, and its authoritative market commentaries, shows the global pattern of trade, and the underlying politics, as never before.
w w w . n a t u r a l g a s . p l a t t s . c o m
More information can be found in Platts Newsletters - International Gas Report, European Gas Daily and LNG Daily. Please contact Platts at Tel +44-(0)20-7176-6111 or www.Platts.com
($/MMBtu)
2
4
6
8
10
AugustJulyJuneMayAprilMarFebJan
Korea LNGJapan LNGUK NBPUS Henry Hub
Source: International Gas Report
Platts_IntlGas_article.indd 1 7/29/2009 10:52:49 AM

For the last 100 years, Platts has been the world’s leading energy information provider, and we will continue charting the path through tomorrow’s markets.
w w w . n a t u r a l g a s . p l a t t s . c o m
O i l E l E c t r i c P O w E r N a t u r a l G a s c O a l N u c l E a r M E t a l s r E N E w a b l E s P E t r O c h E M i c a l s
If you’re there, we’re there.
Platts_NaturalGas_A4.indd 1 7/23/2009 8:46:26 AM

212 t H E t R A N S - A S E A N g A S P i P E l i N E
with the hope of integrating its local gas market
with both the regional and global gas markets
and at the same time further improving its gas
supply diversity and gas supply security.
Malaysia is the only country in the region that
enjoys the benefits of both exporting and impor-
ting gas. Malaysia has been a major LNG exporter
to Japan, South Korea and Taiwan and gas is also
exported to Singapore via pipeline. By importing
gas via pipeline from Indonesia, Malaysia is able
to supplement its indigenous gas production, pro-
longing its indigenous gas reserve life.
Monetise excess gas resources and augment
local gas infrastructure/market
For exporting countries such as Myanmar and
Indonesia, one of the benefits of cross-border
pipelines is to monetise the excess gas (beyond
domestic requirements) and to earn foreign
exchange from the exports of excess gas. The
export contracts provide some level of certainty on
the volumes (via an annual or monthly contract
quantity) and prices (fixed, formula based or a
combination of the two) for the gas being supplied
to the buyer countries. This is important to ensure
the long-term viability of gas production value
chain, which includes upstream development and
production as well as the supporting downstream
infrastructure – particularly the cross-border gas
pipelines. The foreign earnings received from gas
exportation can be used in many ways to enhance
the local economies. This is particularly true for
both Myanmar and Indonesia.
In the case of Malaysia, exporting gas helped
to enhance gas transmission and related infra-
struc ture while at the same time augment the local
gas market. Malaysia also enjoys foreign earnings
from gas exportation and channels a substantial
portion of the earnings to strengthen its gas-
related infrastructure and operations.
In addition to the above, the development of a
gas transmission system would encourage the
development of stranded gas fields whose smaller
diversified its energy sources and improved energy
supply security when it started to import gas from
Malaysia in 1991. Singapore subsequently enhanced
its energy diversity and security of supply when it
imported gas from West Natuna, Indonesia, in
2001. This situation was further improved when
Singapore imported gas from another source in
Indonesia i.e. South Sumatra in 2003. Moving
forward, Singapore is in the process of developing
an LNG terminal to augment its energy security.
The LNG terminal is expected to be completed in
2012 and it will definitely increase Singapore’s
integration with the regional and global gas
markets while at the same time boosting its
supply security.
For Thailand, domestic oil and gas production
was insufficient to meet its fast growing demand.
Hence, Thailand decided to import gas from
Myanmar in 1999 to ensure availability of suffi-
cient energy, diversifying supply sources and
enhancing security of gas supply. To enhance its
gas source diversity and security of gas supply,
Thailand imported gas from the Malaysia Thailand
Joint Development Area (MTJDA) in 2005. Moving
ahead, Thailand is developing an LNG terminal
Thailand is one of the biggest gas consumers in ASEAN – a gas-fired power station in Khanom.

213t H E t R A N S - A S E A N g A S P i P E l i N E
moni sation of rules and regulatory frameworks,
standards and procedures etc.
Singapore probably has the most advanced
gas market in the region with a fully market-based
approach. Gas markets in some countries in the
region such as Cambodia and Laos are non-
existent whereas other countries are between the
two extremes. This situation, at times, makes
market access challenging.
The different economic conditions amongst
ASEAN countries results in varying levels of pur-
chasing power and hence, gas prices and
subsidies. The diversity in gas pricing structures,
formulae and commercial terms affects, to a
certain extent, the pace of gas market integration
within the region.
One of the pre-requisites for gas market
integration is the development of supporting
infrastructure such as gas pipelines. The
infrastructure requires substantial upfront
investment which needs to be financially viable.
Unlike the gas markets in Europe which are
more developed and with greater economies
of scale, the developing gas markets in South
East Asia are relatively small and will take time
to be developed into more integrated and
matured gas markets. This affects the ability to
secure an attractive financing package for the
TAGP implementation. Additionally, the recent
banking crisis and global economic slowdown
make the task of securing attractive financing
package even more challenging.
Availability of substantial gas reserves within
the region is critical to ensure the long-term
sustainability of the TAGP. In ASEAN, most of the
prospective blocks in gas exporting countries such
as Indonesia, Malaysia and Myanmar have been
explored. Generally, recent gas discoveries within
the region have been relatively remote in terms of
location and smaller in size. Nonetheless, the
general outlook for gas reserve addition within the
region is still positive. Deep water exploration acti-
vities have just started and recent gas discoveries
size may not be commercially attractive without
such infrastructure. This is particularly true for
gas exporting countries such as Indonesia
and Malaysia.
Promote usage of cleaner fuel and regional
cooperation
Through cross-border pipelines, more environ-
mental friendly fuel is made available to the end
customers within the region. Hence, over the
years, gas demand within the region has been
increasing steadily. To a certain extent, the avail-
ability of gas provides the ability for end customers
to switch to a cleaner source of fuel. The power
sector has been very responsive in capitalising on
the availability of a more efficient and cleaner
fuel and has emerged as the main gas user in
the region.
The development of the TAGP is an initiative
that requires extensive cooperation between
relevant parties at all levels. Due to its strategic
importance, it has been collectively recognised as
a regional initiative. Hence, the implementation of
the TAGP has assisted in enhancing regional
cooperation particularly on regional energy
security (in terms of energy availability and price)
and sustainability.
In addition to the country specific benefits, the
ASEAN region as a whole has benefited in terms
of enhanced regional cooperation, creation of
jobs, capability development and the associated
economic spill-over benefits arising from the cross-
border pipeline projects.
l Challenges in implementing gas market
integration in ASEAN
The challenges facing efforts such as the TAGP
The main challenge in integrating the ASEAN gas
markets relates to the different stages of market
development within the region. Some countries are
quite advanced in terms of market structure, regu-
lation and operation, whereas some countries are
lagging behind. The situation calls for the har-

214 t H E t R A N S - A S E A N g A S P i P E l i N E
Myanmar, Thailand and Vietnam. The uneven
distribution of the gas customer mix to a certain
extent hinders the gas demand growth, which
in turn, affect the pace of gas infrastructure
development.
Thus, some of the key challenges faced in
implementing gas market integration efforts with
ASEAN can be summarised as follows:
l Different states of the economy and gas market
development within the region;
l Different levels of purchasing power and
varying gas prices and subsidies in some of the
countries in ASEAN;
l Project funding/financing, particularly the need
to incur substantial upfront investment and to
secure an attractive financing package;
l Rather limited sources of regional gas supply
except for in Indonesia and Myanmar. The
major gas supply source in Indonesia’s East
Natuna field has a high CO2 content. The gas
supply needs to be developed at a gas price
that is affordable and competitive to the alter-
native fuels such as coal or fuel oil. Future
alternatives may include coal-bed methane gas
and renewables; and
l Uneven distribution of the gas customer mix
affects overall gas demand growth and, hence,
the pace of gas infrastructure development.
The future challenges in making the TAGP
a reality
In ASEAN, most of the existing cross-border pipe-
lines were undertaken on a bilateral basis. Hence,
the next challenge would be to connect all these
cross-border pipelines into an integrated system.
In doing so, there are numerous issues relating to
harmonisation that need to be resolved. In par-
ticular, harmonisation in terms of:
l Technical specifications on the inter-connection
of gas pipelines that include gas quality;
l Specifications and standards during the
development, construction and operation
phases, and for maintenance procedures; and
in deep water blocks in Malaysia and Myanmar
are very encouraging. The main gas reserve in the
region is the East Natuna field which is located in
Indonesia. The gas field contains about 220 tcf
(6.16 tcm) but it has an exceptionally high percen-
tage of CO2. Despite the technolo gical challenges
in handling the high percentage of CO2, efforts to
develop the East Natuna field at a gas price that is
affordable and competitive to the alternative fuels
such as coal or fuel oil have been initiated.
Unlike countries in temperate climates where
gas usage is almost evenly distributed between
the power, industrial (as feedstock or for indus-
trial processes) and residential sectors (for space
heating), in the tropical countries of ASEAN,
gas is used primarily for power generation.
Usage of gas by industrial users is growing but
growth is quite limited for the residential sector
where gas is mainly use for cooking. Within the
region, space heating is generally not necessary
except for cooler parts of countries in Lao PDR,
In the ASEAN residential sector gas is primarily used for cooking although space heating is needed in parts of the region such as Hanoi in winter.

215t H E t R A N S - A S E A N g A S P i P E l i N E
investment, maintain predictable and consistent
application of policies and, at the same time,
create healthy competition amongst the players
to attain industry-wide operational efficiency and
cost effectiveness.
l Lessons learned from gas market
integration efforts in ASEAN
Although the gas market in ASEAN is yet to be
fully integrated, there are some lessons that can
be learned from gas market integration efforts in
ASEAN that can be adopted and customised in
developing gas markets in other regions of the
world. These include the rather unique model and
positive roles performed by the governments, the
NOCs or the authorities in charge of petroleum
and the industry gas players and pipeline
operators in ASEAN towards fully realising the
aspiration to enhance regional cooperation and
energy security as follows.
Role of governments
The 10 ASEAN governments have provided a very
clear message and demonstrated strong political
will towards establishing regional economic and
energy cooperation, amongst others, recognising
the importance of energy security and the need to
enhance regional energy security collectively
through the Trans-ASEAN Energy Network, com-
prising both the TAGP infrastructure and the
ASEAN Power Grid.
Role of NOCs and authorities in charge of
petroleum
At the industry level, the NOCs or, in cases
where the country does not have an NOC,
by the authority in charge of petroleum matters,
were instrumental in spearheading and facili-
tating the aspiration of the ASEAN governments
towards implementing and realising the
TAGP infrastructures.
Several building blocks have been put in place
besides the eight cross-border gas pipeline inter-
l Cross-border issues relating to more
harmonised regulations on health, safety, the
environment, company formation, transit
principles, open access or third party access,
taxes and tariff setting.
The above issues are mainly related to inte-
gration and harmonisation efforts that require
extensive cooperation of all the industry players
including gas buyers and sellers, regulators,
authorities and statutory bodies.
l Policy options to enhance gas market
integration in ASEAN
To address some of those challenges highlighted,
energy policymakers and relevant authorities in
ASEAN will have to examine the issues and
challenges carefully with high-level energy policy
responses to minimise the barriers that hinder
regional gas market integration in ASEAN. Some
of these policy options are highlighted below
as a possible way forward to enhance gas
market integration:
l Liberalising the gas market in stages to attract
more gas players to compete in the market;
l Gas pricing that is market-oriented, with
gradual elimination of subsidies;
l Open access or third party access to gas
pipelines for common gas carriers, supporting
the “gas highway concept” to attract more
upstream players to explore new gas resources
and utilise these infrastructure to monetise the
discovered gas;
l Gas transit principles or protocol have to be
put in place to enable cross-border gas pipe-
lines to be built and to ensure smooth transpor-
tation of gas through transit countries; and
l Tax incentives and fair tariff structures that
promote gas market integration.
Extensive study needs to be carried out to
determine the most suitable policies as well as the
potential impact of adopting them. Regardless of
the eventual policies adopted, it is important to
maintain a stable business environment to attract

216 t H E t R A N S - A S E A N g A S P i P E l i N E
aspects of other pipelines through the sharing
of experiences and knowledge; and
l Develop a database of key owners/operators in
the region to enable companies to seek infor-
mation (non confidential) in a timely manner
and benefit from the experiences from their
industry peers.
Coordination, diligence and resolve
It is an accepted fact that any integration efforts
require extensive communication between the
relevant parties at all levels and excellent
coordination. In implementing the TAGP, structured
communication channels were established to
ensure uninterrupted flow of clear messages so
that actions are well coordinated. This is essential
to minimise confusion and disruption.
Additionally, relevant industry players,
regulators and authorities were engaged from the
early stages of the TAGP and they continue to be
extensively involved not only in formulating
implementation strategies and plans but also in
the actual execution of the strategies and plans.
In selecting the policies and formulating the
implementation plans for the TAGP, due consider-
ation is given to options available as well as to
the potential impact of adopting such policies
or plans. Once the policies and implementation
plans for the TAGP have been collectively
agreed upon, there is a conscious effort to
ensure consistent and predictable application
of policies as well as the execution of imple-
mentation plans.
Due to its strategic importance, the TAGP has
been collectively recognised as a high priority
regional initiative. From its inception, ASEAN
Member Countries have displayed the political will
and resolve not only to initiate but also to execute
the TAGP implementation plans.
In summary, all the above are key ingredients
that allow the TAGP to progress smoothly and can
be used as guidance in integrating gas markets in
other regions.
connections. These include obtaining the gov-
ern ments’ support and approval to ratify the
ASEAN MoU on the TAGP, and the setting up of
AGC and AGCC as the appropriate institutional
instruments to facilitate the implementation and
realisation of the TAGP project.
Currently, both AGC and AGCC are develop-
ing appropriate guidelines to address cross-
border issues relating to amongst others,
the following:
l Technical specifications on the inter-connection
of gas pipelines that include gas quality;
l Specification and standards during the
development, construction and operation
phases, and for maintenance procedures;
l Cross-border issues relating to more
harmonised regulations on health, safety, the
environment, company formation, transit
principles, open access or third party access,
taxes and tariff setting; and
l Unbundling of costs, etc.
Role of other gas industry players and pipeline
operators
Pipelines are an essential part of the gas delivery
system, and within the ASEAN region there are
several companies that own and/or operate nat-
ural gas pipelines. Additionally, there are companies
involved in the transport of oil and petroleum
products that face many of the same operational
issues as natural gas pipeline companies.
AGC has taken the initiative to facilitate the
creation of the South East Asia Pipeline Operators
Group (SEAPOG) to, amongst other factors:
l Enable participants to gain a comprehensive
understanding of operational best practices
employed around the region and to benchmark
their practices accordingly;
l Promote discussion on pipeline incidents and
safety alerts with their peers, enabling partici-
pants to exchange views and lessons learned
from one another;
l Educate pipeline operators on the operational

Recommended