Bull Earthquake EngDOI 10.1007/s10518-013-9461-4
ORIGINAL RESEARCH PAPER
Empirical ground-motion models for point- andextended-source crustal earthquake scenariosin Europe and the Middle East
S. Akkar · M. A. Sandıkkaya · J. J. Bommer
Received: 19 December 2012 / Accepted: 30 May 2013© Springer Science+Business Media Dordrecht 2013
Abstract This article presents the latest generation of ground-motion models for the predic-tion of elastic response (pseudo-) spectral accelerations, as well as peak ground accelerationand velocity, derived using pan-European databases. The models present a number of novel-ties with respect to previous generations of models (Ambraseys et al. in Earthq Eng Struct Dyn25:371–400, 1996, Bull Earthq Eng 3:1–53, 2005; Bommer et al. in Bull Earthq Eng 1:171–203, 2003; Akkar and Bommer in Seismol Res Lett 81:195–206, 2010), namely: inclusion ofa nonlinear site amplification function that is a function of VS30 and reference peak groundacceleration on rock; extension of the magnitude range of applicability of the model down toMw 4; extension of the distance range of applicability out to 200 km; extension to shorter andlonger periods (down to 0.01 s and up to 4 s); and consistent models for both point-source(epicentral, Repi, and hypocentral distance, Rhyp) and finite-fault (distance to the surfaceprojection of the rupture, RJB) distance metrics. In addition, data from more than 1.5 timesas many earthquakes, compared to previous pan-European models, have been used, leadingto regressions based on approximately twice as many records in total. The metadata of theserecords have been carefully compiled and reappraised in recent European projects. Theseimprovements lead to more robust ground-motion prediction equations than have previouslybeen published for shallow (focal depths less than 30 km) crustal earthquakes in Europe andthe Middle East. We conclude with suggestions for the application of the equations to seismichazard assessments in Europe and the Middle East within a logic-tree framework to captureepistemic uncertainty.
Electronic supplementary material The online version of this article (doi:10.1007/s10518-013-9461-4)contains supplementary material, which is available to authorized users.
S. Akkar (B) · M. A. SandıkkayaDepartment of Civil Engineering, Earthquake Engineering Research Center,Middle East Technical University, K6 Building, 06800 Ankara, Turkeye-mail: [email protected]
J. J. BommerCivil and Environmental Engineering, Imperial College London, London SW7 2AZ, UK
123
Bull Earthquake Eng
Keywords Ground-motion prediction equations · Seismic hazard assessment · Pan-European strong-motion database · 5 % acceleration spectral ordinates · PGA · PGV
1 Introduction
The evolution of strong ground-motion recording and modeling in Europe has always beensome way behind that in the western United States. The first accelerogram recorded inEurope was obtained more than 30 years after the first strong-motion recordings from the1933 Long Beach earthquake in California, and the first set of ground-motion predictionequations (GMPEs) for response spectral ordinates in Europe was derived about 20 yearsafter the first models in the United States. With time, however, the gap has been graduallyclosing and in this article we present a set of new GMPEs derived from European and MiddleEastern strong-motion data for crustal earthquakes that are comparable with the equationsproduced by the PEER Center Next Generation of Attenuation (NGA) project (Power et al.2008). The continuous development in the field of ground-motion modeling means that justas this study brings pan-European GMPEs in line with the NGA models—now referred to asthe NGA-West models to distinguish that endeavor from the on-going NGA-East project todevelop new GMPEs for the Central and Eastern United States—the NGA-West2 models arebeing presented (Bozorgnia et al. 2012). As discussed later, the question arises as to whetherefforts will continue to close the gap or whether the move will now be towards global GMPEsfor regions of shallow crustal earthquakes.
The article begins with a brief overview of the evolution of ground-motion models inEurope and the Middle East, highlighting the new features of the models presented herein.The strong-motion database is then described, followed by a description of the selectionof the functional form for the models, including the selection and definition of explanatoryvariables. The article then presents the regressions to obtain the coefficients of the equationsand the associated sigma values, after which the new predictions are explored for a numberof scenarios, and also compared with previous models.
2 A new generation of European ground-motion models
The historical development of ground-motion recording and prediction for the pan-Europeanregion is recounted by Bommer et al. (2010). Globally, there are more GMPEs for peak groundacceleration (PGA) than for elastic response spectral accelerations (Douglas 2003, 2011),although GMPEs are now generally derived for spectral ordinates and PGA simultaneously.The first equations for response spectral ordinates using strong-motion records from acrossEurope and the Middle East were those of Ambraseys et al. (1996), and these have undergone anumber of revisions and improvements, as summarized in Table 1. In parallel, recent GMPEshave been produced for individual European countries such as Greece, Italy and Turkey (e.g.,Danciu and Tselentis 2007; Bindi et al. 2010; Akkar and Çagnan 2010), but the focus herein isexclusively on models derived for all seismically-active regions bordering the MediterraneanSea and extending to the Middle East. This excludes those models derived for this regionusing indigenous datasets supplemented by recordings from other regions such as Californiaand Japan (e.g., Berge-Thierry et al. 2003; Fukushima et al. 2003).
Table 1 summarizes the evolution of GMPEs for the prediction of spectral ordinates inEurope and the Middle East, and Table 2 lists key characteristics of the same equations. Themodels included are the following, together with the codes used to identify them in the tables:
123
Bull Earthquake Eng
Table 1 Evolution of GMPEs for spectral ordinates for Europe and the Middle East
GMPE Feature ASB96 BDS03 Aetal05 Betal07 AB10 This study
Three site classesStyle-of-faultingWithin- and between-event variabilityMagnitude-dependent attenuationNonlinear magnitude scalingParallel model for PGVExplicit inclusion of VS30
Nonlinear site responseConsistent models for point and extended sourcesAnelastic attenuationa
Dark grey cells indicate an effect in final model. Light grey cells indicate an effect investigated but not retainedin the final model either because not statistically significant or coefficients non-physicala It should be noted that the expression ‘anelastic attenuation’ is only strictly valid for GMPEs for Fourieramplitudes and not response spectral ordinates
Table 2 Characteristics of GMPEs for spectral ordinates for Europe and the Middle East; each model alsoincludes an equation for PGA
GMPE feature ASB96 BDS03 Aetal05 Betal07 AB10 This study
Number of earthquakes 157 157 135 289 131 221
Number of records 422 422 595 997 532 1041
Horizontal component Larger Larger Larger GM GM GM
Minimum response period (s) 0.10 0.10 0.05 0.05 0.05 0.01
Maximum response period (s) 2.0 2.0 2.5 0.5 3.0 4.0
Magnitude scale Ms Ms Mw Mw Mw Mw
Minimum magnitude 4.0 4.0 5.0 3.0 5.0 4.0
Maximum magnitude 7.9 7.9 7.6 7.6 7.6 7.6
Maximum distance (km) 260 260 99 100 99 200
Number of free coefficients 6 8 10 10 10 11
Number of earthquakes and records reported for spectral acceleration at 0.1 s. GM Geometric mean of the twohorizontal components
ASB96—Ambraseys et al. (1996); BDS03—Bommer et al. (2003); Aetal05—Ambraseyset al. (2005); Betal07—Bommer et al. (2007); AB10—Akkar and Bommer (2010). Theequations for spectral displacement ordinates by Akkar and Bommer (2007a) are not includedbecause these were superseded by Akkar and Bommer (2010) but would have identical entriesto the latter in Tables 1 and 2.
Table 2 does not include a row for the distance metric because all of these models havebeen based on Joyner-Boore distance, RJB, which is the horizontal distance to the closestpoint on the surface projection of the fault rupture (Joyner and Boore 1981). A predictivemodel that is based on the closest distance to fault rupture, Rrup, is not developed because thecurrent pan-European strong-motion databases lack sufficiently detailed information aboutmost causative fault ruptures to allow determination of this distance metric for most events.
Following the suggestion of Bommer and Akkar (2012) that GMPEs should be derivedin pairs, one based on a point-source measure for use with area sources (at least for areasources other than the host zone containing the site, for which the simulation of virtual faults
123
Bull Earthquake Eng
is an unnecessary computational effort) and another using an extended-source metric forfault sources, in this study additional models based on hypocentral distance, Rhyp, and onepicentral distance, Repi, are also presented. The reason for providing equations in terms ofboth point-source distance metrics is that hypocentral distance is considered to be a bettermetric, not least because studies have shown that the hypocenter is often located close toregions of large slip (Mai et al. 2005; Manighetti et al. 2005). Additionally, in performinginversions to obtain equivalent stochastic parameters for empirical GMPEs, Scherbaum et al.(2006) found that regardless of the distance metric used in the GMPE, hypocentral distancefrequently yielded the best results (in terms of minimized misfit) for the stochastic parameters.However, the use of GMPEs based on Rhyp for PSHA requires integration over the depthdistributions—which should not be achieved through the addition of logic-tree branches withalternative depths (Bommer and Scherbaum 2008), although it is legitimate to have brancheswith alternative depth distributions—with the attendant onus to determine depth distributionsand the consequent computational penalty. The use of an Repi-based model can bypass theseissues. Additionally, the model based on epicentral distance allows direct comparison withthe RJB model, which may offer some advantages, including assurance about the behaviorof the point-source distance-based equations.
From Table 1, the evolution of the complexity of the models is immediately apparent. TheAmbraseys et al. (1996) equations were of a rather simple functional form and in additionto linear dependence on surface-wave magnitude, Ms, and geometric spreading as a functionof RJB, the only other explanatory variable were two dummy variables representing thevariations in ground motions amongst three site classes. These classes (rock, stiff soil andsoft soil) were nominally defined in terms of ranges of 30 m shear-wave velocities, VS30, butat the time the equations were derived shear-wave velocity measurements were available forvery few European strong-motion accelerograph sites (e.g., Rey et al. 2002).
The equations derived by Bommer et al. (2003) used the same database, explanatory vari-ables and functional form as Ambraseys et al. (1996), but added two additional terms asfunctions of dummy variables to include the influence of reverse, normal or strike-slip fault-ing. This model also presented separately the within-event and between-event components ofthe aleatory variability (Al Atik et al. 2010); although Ambraseys et al. (1996) used the two-stage regression approach of Joyner and Boore (1981), they only reported total sigma values.
The model of Ambraseys et al. (2005) represented a major advance in European ground-motion modeling, adopting a more complex functional form for the equation that includedthe magnitude-dependence of the geometric spreading. Table 2 also records other notableadvances embodied in this GMPE, including the move to moment magnitude, Mw, (the pre-ferred choice for state-of-the-art hazard assessments) instead of Ms, and, through carefulprocessing of the accelerograms, an extension of the range of response periods for whichpredictive equations were derived. Another important advance, which may not be immedi-ately apparent from the information in Table 2, is that the database used for this study wasconsiderably improved with respect to that of Ambraseys et al. (1996), including having amuch larger average number of records per event and more complete metadata (e.g., centroidmoment tensors). Although the total number of records is not much larger, it must be notedthat the minimum magnitude was larger: Mw 5, which corresponds to roughly Ms 4.8 usingthe Ms–Mw relation of Scordilis (2006), rather than Ms 4. Moreover, although the maximummagnitude and distance ranges covered by Ambraseys et al. (1996) appear impressive, theyactually correspond to a single recording from a large earthquake; the maximum event cov-ered by the remainder of the database was Ms 7.3. All but one of the records were obtainedat distances of less than 200 km, and below Ms 6.5, only four accelerograms were recordedat distances beyond 100 km.
123
Bull Earthquake Eng
The Bommer et al. (2007) equations were derived only to explore the influence of themagnitude range in the database and were not intended for use in seismic hazard assessments(for which they would be hampered by the very limited period range that they cover). TheGMPE of Akkar and Bommer (2010) was based on the same database as used by Ambraseyset al. (2005)1, but the individual re-processing of all the records to determine the maximumusable period (Akkar and Bommer 2006), enabled the maximum response period to beextended to 3 s; this is still much shorter than would be desirable but is a consequence ofthe large proportion of the database obtained on analogue accelerographs. The functionalform adopted for this equation was similar to that adopted by Ambraseys et al. (2005) butadditionally included a quadratic term in magnitude. This model also included a modelfor peak ground velocity, PGV, which had previously been derived separately (Akkar andBommer 2007b); this is noteworthy since although most engineering design applicationsmake use of response spectra, there are a number of uses for PGV (Bommer and Alarcón2006). As noted in Table 2, this study also adopted the more widely-used convention of thegeometric mean of the horizontal components rather than the larger of the two.
The new models presented in this article constitute a new generation of predictive equationsrather than an incremental development. As discussed in the next section, the database hascontinued to expand in size, but more importantly there have been very significant improve-ments regarding the metadata associated with the accelerograms. One particular benefit of thisis that for the first time the pan-European models include VS30 explicitly as an explanatoryvariable rather than generic site classes. The new models also include the influence of non-linear soil response; in deriving a predictive equation for PGV, Akkar and Bommer (2007b)searched without success for empirical evidence for soil nonlinearity in European strong-motion data. In this respect the new equations represent a departure from purely empiricalfitting, with the use of externally developed models to constrain the influence of nonlinearsoil response.
Another development envisaged regarding the functional form is the inclusion of an anelas-tic attenuation term to accommodate extrapolation of the equations beyond the 200 km limitof the dataset, which is almost inevitable in probabilistic seismic hazard analysis (PSHA).In passing we note that the use of the term ‘anelastic attenuation’ is not strictly correct sinceit applies to Fourier amplitude spectra (FAS) rather than response spectra, but the terms inGMPEs involving ln(R) and R are modeled after the geometric spreading and apparent atten-uation (scattering plus anelastic) of FAS. However, it is noted that in almost all cases thecoefficients on this term were found to be positive, so none of the final equations includes thiseffect. As noted in Table 1, two previous European GMPEs explored the inclusion of suchterms but their authors also omitted them from the final models, suggesting that the Europeandataset is not currently sufficient to constrain both contributions to the decay of amplitudewith distance, at least with a constant geometrical spreading model and not accounting forthe Moho bounce effect. It may be the case that data recorded over a much wider range ofdistances would be needed to constrain such terms in the predictive models.
The derivation of these new equations also addresses a problem identified by Bommeret al. (2007), namely that empirical GMPEs, even if their functional form includes non-linear magnitude scaling, tend to over-estimate ground-motion amplitudes at the lowerlimit of their magnitude range. This observation has been subsequently confirmed forthe NGA models by Atkinson and Morrison (2009) and Chiou et al. (2010). Douglas andJousset (2011) discuss the reasons for this over-estimation using stochastic models. The new
1 63 records used by Ambraseys et al. (2005) were not available in unprocessed form so they were not usedby Akkar and Bommer (2010).
123
Bull Earthquake Eng
models address this issue by extending the lower magnitude limit of the dataset to Mw 4.This means that when the models are applied at Mw 5 (often the lower end of integrationwithin PSHA) they should not over-predict ground motions, unlike GMPEs that only usedata down to Mw 5. We emphasize that the original motivation was not to provide modelsthat can be used with confidence at Mw 4, but rather to remove the bias in the models atthe commonly used lower limit of Mw 5 in PSHA, following the recommendation byBommer et al. (2007) to include data to one magnitude unit lower than the minimum thresholdin PSHA integrations. However, we conclude that the new models can be used for magnitudesas small as Mw 4.
Another innovation in these new equations is the extension of the range of periods atthe shorter end, following new insights into the relatively low sensitivity of short-periodordinates to the high-frequency filtering of accelerograms (Douglas and Boore 2011; Akkaret al. 2011). Bommer et al. (2012) provided coefficients at short periods as an extension ofthe model of Akkar and Bommer (2010), as well as exploring the options for interpolatingmissing coefficients at short periods; the new models presented in this article include 62spectral ordinates starting from the period of 0.01 s. The models presented here are reliablefor structural periods up to 4 s, a longer period than previous generations of GMPEs for thispart of the world (Table 2)2.
3 Strong-motion database
The database compiled for this study is a subset of Reference Database for Seismic Ground-Motion in Europe (RESORCE) developed for the SeIsmic Ground Motion Assessment(SIGMA) project (Akkar et al. 2013). The databank is the extended and updated versionof the pan-European strong-motion databases compiled under the Seismic HArmonizationin Europe (SHARE) project (Yenier et al. 2010). In this study our database consists only ofrecords from those stations with measured VS30. The majority of stations have VS30 valuesthat classify them as Eurocode 8 (Comité Européen de Normalisation 2004) classes B andC sites, i.e. VS30 ≤ 800 m/s. There are few rock stations (VS30 > 800 m/s) classified basedon measured VS30 values in the database. This is similar to the NGA database compiled byChiou et al. (2008) and the majority of strong-motion databases worldwide.
When deriving the NGA GMPEs the developer teams accounted for possible differences inground motions from main shocks and aftershocks by either excluding data from aftershocksor by including terms to model these differences, which for short-period motions were foundto be up to 40 %. Douglas and Halldórsson (2010) investigated differences between spectralaccelerations from main shocks and aftershocks using the same data as Ambraseys et al.(2005) but did not find any significant differences. Various damaging earthquakes in Europethat have been well recorded by strong-motion networks occurred as a series of events ofsimilar magnitudes occurring on adjacent faults (e.g., Friuli 1976, Umbria-Marche 1997–1998, Molise 2002), which complicates the classification of earthquakes into main shocksand aftershocks. Due to these reasons, and the fact that up to half of the records available forthis study come from earthquakes that could be classified as aftershocks, we have decidedto retain all available strong-motion data for the derivation of the GMPEs. Any possibledifference between aftershock and main shock motions is accommodated by the sigma value.
2 Akkar and Bommer (2007a) provide coefficients up to 4 s but later Akkar and Bommer (2010) highlightedthe unreliability of this model beyond 3 s because of a sharp reduction in the number of records used.
123
Bull Earthquake Eng
1 10 100
Mw
4
5
6
7
8
1 10 1004
5
6
7
8
RJB (km)
1 10 100
Mw
4
5
6
7
8
RJB (km)
1 10 1004
5
6
7
8
NormalReverseStrike-slip
VS30 > 800 m/s 360 m/s < VS30 < 800 m/s
180 m/s < VS30 < 360 m/s VS30 < 180 m/s
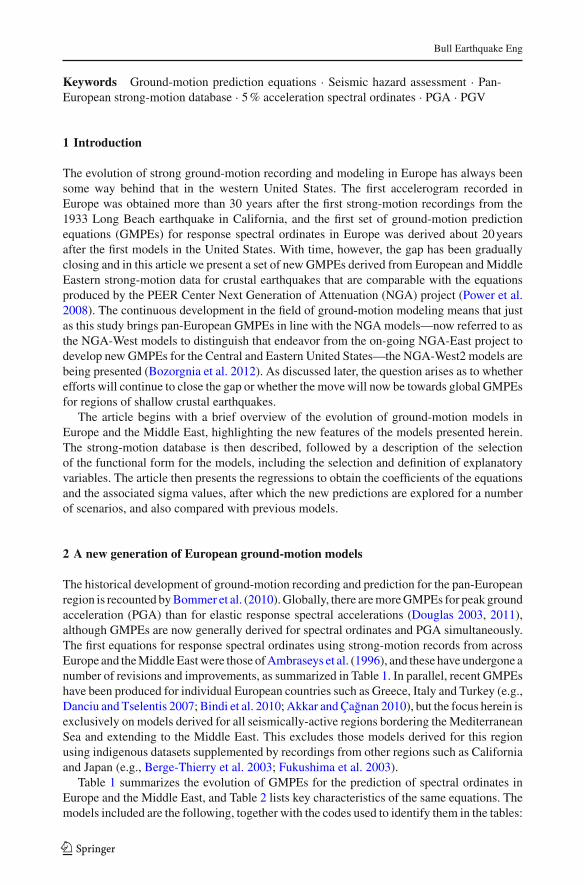
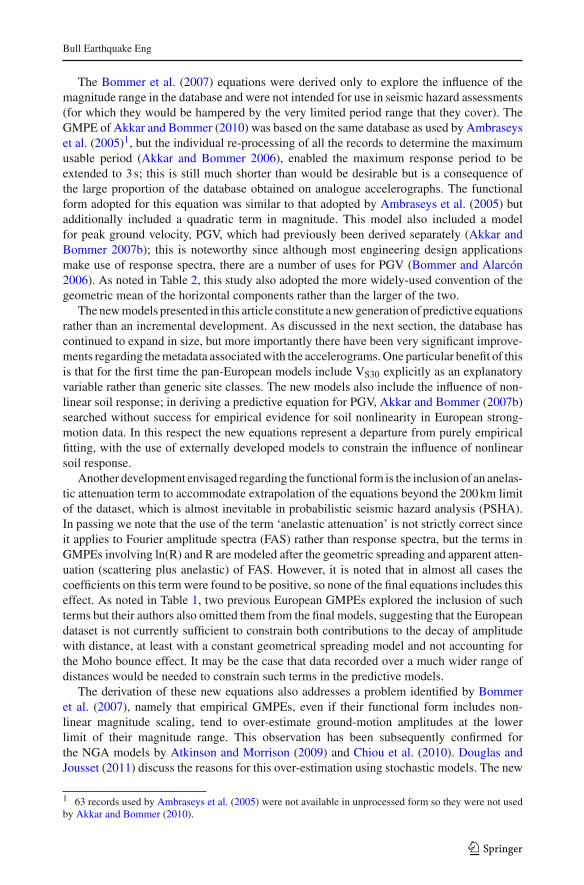
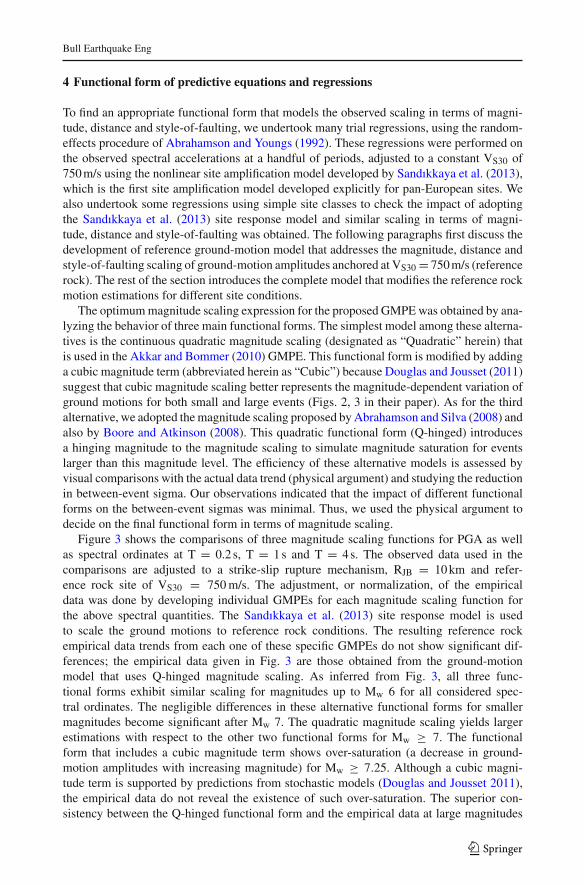
Fig. 1 Distribution of the data used in terms of magnitude, distance (RJB), style-of-faulting and Eurocode 8site class.
The vast majority of data that are the basis of this study were obtained from strong-motioninstruments triggered by accelerations higher than a pre-defined threshold. Consequentlyground motions below this threshold are not recorded. This leads to preferential recording ofonly larger-than-average motions from small earthquakes and/or at large distances. If thesedata were included within the regression analysis then the derived GMPEs would be biasedupwards for weak motions. Based on a preliminary investigation using the PGAs predictedby the GMPE of Bommer et al. (2007) and various instrument resolutions, it was concludedthat the available data are roughly unbiased for Mw > 4 at distances up to 200 km (Dr. JohnDouglas, personal communication, 2011). Singly-recorded earthquakes from 163 events wereremoved from the ground-motion database in order not to inflate the estimate of between-event variability in the proposed GMPEs. We considered 3-component accelerograms (twohorizontal and one vertical) in our final database to develop a vertical-to-horizontal spectralacceleration ratio model that replaces the model of Bommer et al. (2011) and is consistent withthe GMPEs proposed here. The latter GMPE is presented in a companion article publishedin this issue (Sandıkkaya et al. 2013b).
The distribution of the final database in terms of magnitude, source-to-site distance, style-of-faulting and Eurocode 8 site class is presented in Fig. 1. The distance measure is chosenas RJB in the scatter plots as the use of Repi or Rhyp does not significantly change the generalpicture displayed in this figure. From these scatter plots it can be seen that magnitudes up
123
Bull Earthquake Eng
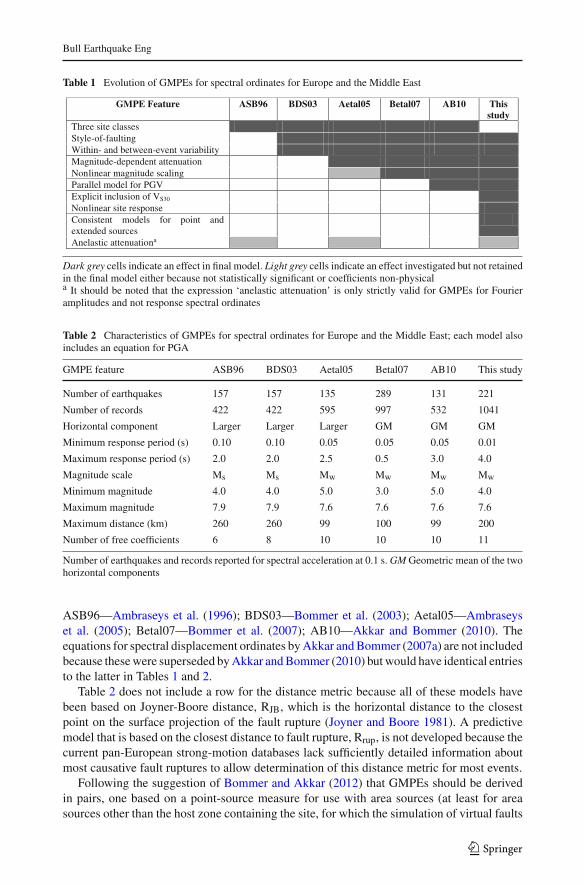
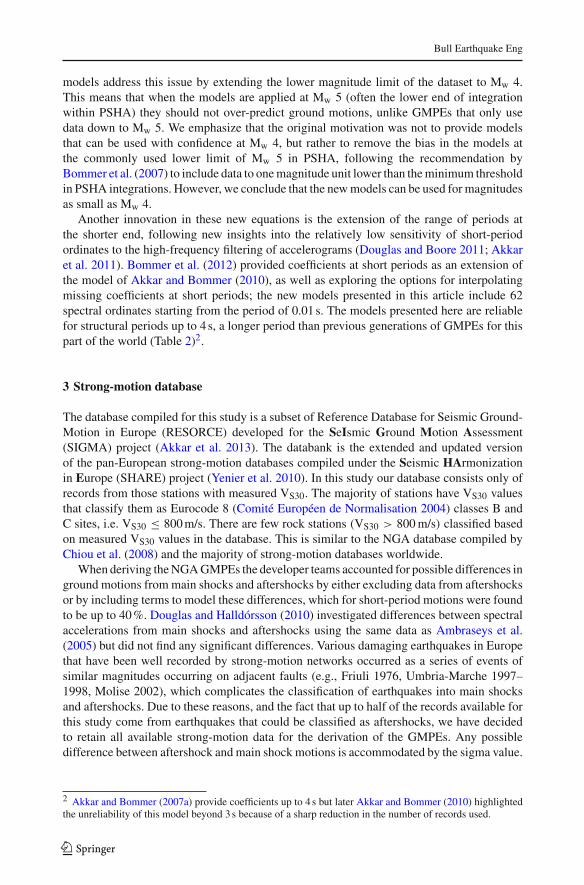
Fig. 2 Distribution of theearthquakes with respect tomagnitude, style-of-faulting andfocal depth.
Depth (km)0 5 10 15 20 25 30
MW
4
5
6
7
8Normal
Reverse
Strike-slip
to roughly Mw 7 are well represented, particularly for normal and strike-slip faulting. Forlarger magnitudes there are almost no records from normal and reverse-faulting events andthe available data are mainly from three large strike-slip earthquakes (Manjil, Kocaeli andDüzce). Reverse-faulting earthquakes are quite poorly represented whereas most data comefrom normal events: this is in contrast to the NGA models for which reverse earthquakescontribute a large proportion of the database and normal events relatively little. This promptsus to suggest that these new pan-European models should perhaps be considered in seismichazard studies in the Basin and Range Province of the US where normal-faulting earthquakesdominate, in the same way that Spudich et al. (1999) developed a model based on globaldata for application in that region. The distribution with respect to style-of-faulting of thedatabase for the current study is in part the consequence of using only records from sites withdirectly measured VS30 values, which excludes, for example, recordings from several large-magnitude earthquakes in Iran. The vast majority of earthquakes with Mw > 6 have focaldepths less than 20 km whereas the depth distribution of events smaller than Mw 6 is roughlyuniform between 0 and 30 km (Fig. 2). All earthquakes are shallower than 30 km; as withearlier European GMPEs, records from deeper events have been excluded from the database.A table summarizing our database is given in the Electronic Supplement to this article.
The individual filtering of each record means that the number of spectral accelerationsavailable for regression at each period varies. The high-pass filtering effect on long-periodspectral ordinates is minimized by applying the criteria given in Akkar and Bommer (2006).The number of records starts reducing for T > 1s as the effect of the chosen high-pass filtervalues becomes more and more apparent. By 4 s about 60 % of the records in the database arestill available for regression analysis. The available data decays rapidly after T = 4 s, whichprevented going beyond this spectral period in the regressions. This rapid drop-off is due to alarge proportion of records from analogue instruments within the databank used despite theconversion of most European strong-motion networks to digital accelerometers in the pastdecade. The Akkar et al. (2011) criteria to account for low-pass filtering effects on the shortperiod spectral ordinates (T < 0.05 s) were not followed as its application did not result insignificant changes in the total number of data in this period range.
The GMPEs are derived from pseudo-spectral accelerations for 5 % of critical damping forthe geometric mean of the two horizontal components computed from the selected records.A predictive model that scales the 5 % damped spectral ordinates of the proposed GMPEsfor different damping levels ranging between 1 and 30 % is presented in a companion paperin this issue (Sandıkkaya et al. 2013b).
123
Bull Earthquake Eng
4 Functional form of predictive equations and regressions
To find an appropriate functional form that models the observed scaling in terms of magni-tude, distance and style-of-faulting, we undertook many trial regressions, using the random-effects procedure of Abrahamson and Youngs (1992). These regressions were performed onthe observed spectral accelerations at a handful of periods, adjusted to a constant VS30 of750 m/s using the nonlinear site amplification model developed by Sandıkkaya et al. (2013),which is the first site amplification model developed explicitly for pan-European sites. Wealso undertook some regressions using simple site classes to check the impact of adoptingthe Sandıkkaya et al. (2013) site response model and similar scaling in terms of magni-tude, distance and style-of-faulting was obtained. The following paragraphs first discuss thedevelopment of reference ground-motion model that addresses the magnitude, distance andstyle-of-faulting scaling of ground-motion amplitudes anchored at VS30 = 750 m/s (referencerock). The rest of the section introduces the complete model that modifies the reference rockmotion estimations for different site conditions.
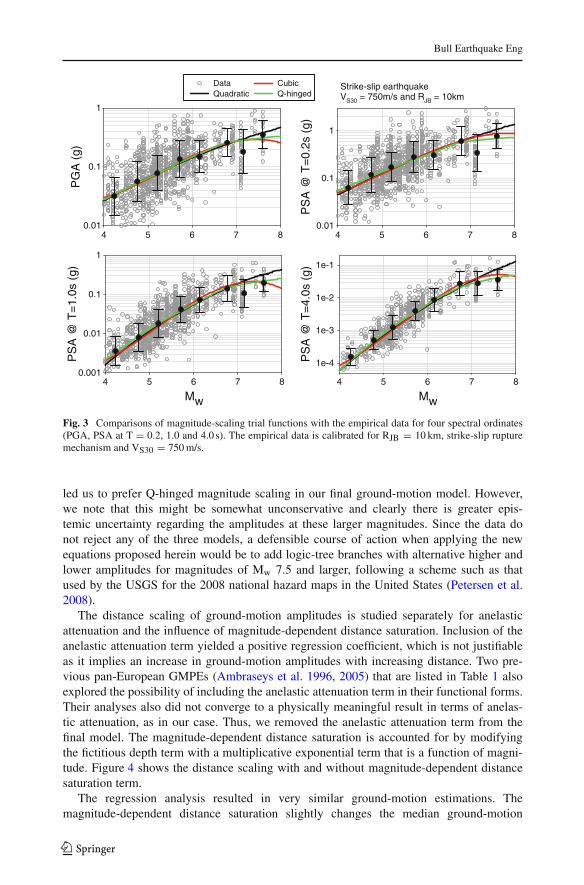
The optimum magnitude scaling expression for the proposed GMPE was obtained by ana-lyzing the behavior of three main functional forms. The simplest model among these alterna-tives is the continuous quadratic magnitude scaling (designated as “Quadratic” herein) thatis used in the Akkar and Bommer (2010) GMPE. This functional form is modified by addinga cubic magnitude term (abbreviated herein as “Cubic”) because Douglas and Jousset (2011)suggest that cubic magnitude scaling better represents the magnitude-dependent variation ofground motions for both small and large events (Figs. 2, 3 in their paper). As for the thirdalternative, we adopted the magnitude scaling proposed by Abrahamson and Silva (2008) andalso by Boore and Atkinson (2008). This quadratic functional form (Q-hinged) introducesa hinging magnitude to the magnitude scaling to simulate magnitude saturation for eventslarger than this magnitude level. The efficiency of these alternative models is assessed byvisual comparisons with the actual data trend (physical argument) and studying the reductionin between-event sigma. Our observations indicated that the impact of different functionalforms on the between-event sigmas was minimal. Thus, we used the physical argument todecide on the final functional form in terms of magnitude scaling.
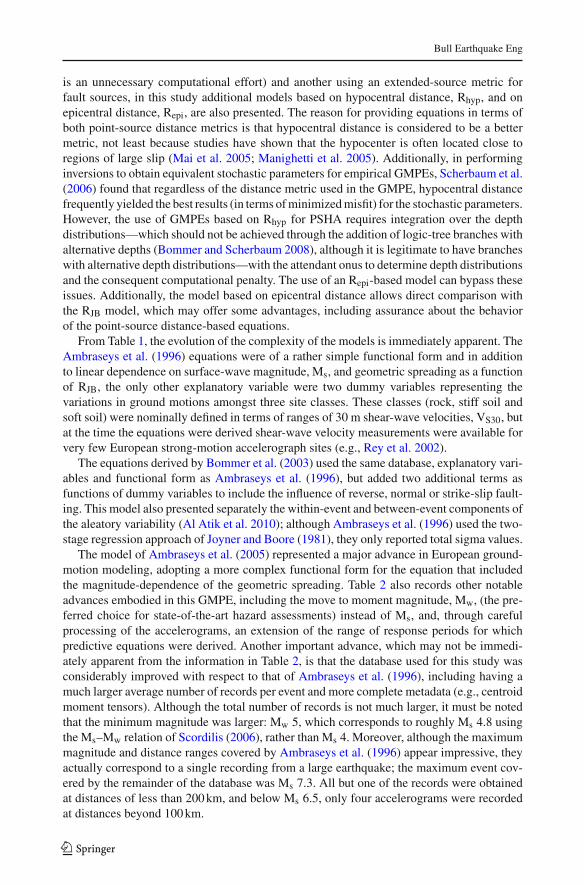
Figure 3 shows the comparisons of three magnitude scaling functions for PGA as wellas spectral ordinates at T = 0.2 s, T = 1 s and T = 4 s. The observed data used in thecomparisons are adjusted to a strike-slip rupture mechanism, RJB = 10 km and refer-ence rock site of VS30 = 750 m/s. The adjustment, or normalization, of the empiricaldata was done by developing individual GMPEs for each magnitude scaling function forthe above spectral quantities. The Sandıkkaya et al. (2013) site response model is usedto scale the ground motions to reference rock conditions. The resulting reference rockempirical data trends from each one of these specific GMPEs do not show significant dif-ferences; the empirical data given in Fig. 3 are those obtained from the ground-motionmodel that uses Q-hinged magnitude scaling. As inferred from Fig. 3, all three func-tional forms exhibit similar scaling for magnitudes up to Mw 6 for all considered spec-tral ordinates. The negligible differences in these alternative functional forms for smallermagnitudes become significant after Mw 7. The quadratic magnitude scaling yields largerestimations with respect to the other two functional forms for Mw ≥ 7. The functionalform that includes a cubic magnitude term shows over-saturation (a decrease in ground-motion amplitudes with increasing magnitude) for Mw ≥ 7.25. Although a cubic magni-tude term is supported by predictions from stochastic models (Douglas and Jousset 2011),the empirical data do not reveal the existence of such over-saturation. The superior con-sistency between the Q-hinged functional form and the empirical data at large magnitudes
123
Bull Earthquake Eng
PG
A (
g)
0.01
0.1
1
DataQuadratic
Cubic Q-hinged
4 5 6 7 8 4 5 6 7 8
PS
A @
T=
0.2s
(g)
0.01
0.1
1
Mw
PS
A @
T=
1.0s
(g)
0.001
0.01
0.1
1
Mw
4 5 6 7 8 4 5 6 7 8
PS
A @
T=
4.0s
(g)
1e-4
1e-3
1e-2
1e-1
Strike-slip earthquakeVS30 = 750m/s and RJB = 10km
Fig. 3 Comparisons of magnitude-scaling trial functions with the empirical data for four spectral ordinates(PGA, PSA at T = 0.2, 1.0 and 4.0 s). The empirical data is calibrated for RJB = 10 km, strike-slip rupturemechanism and VS30 = 750 m/s.
led us to prefer Q-hinged magnitude scaling in our final ground-motion model. However,we note that this might be somewhat unconservative and clearly there is greater epis-temic uncertainty regarding the amplitudes at these larger magnitudes. Since the data donot reject any of the three models, a defensible course of action when applying the newequations proposed herein would be to add logic-tree branches with alternative higher andlower amplitudes for magnitudes of Mw 7.5 and larger, following a scheme such as thatused by the USGS for the 2008 national hazard maps in the United States (Petersen et al.2008).
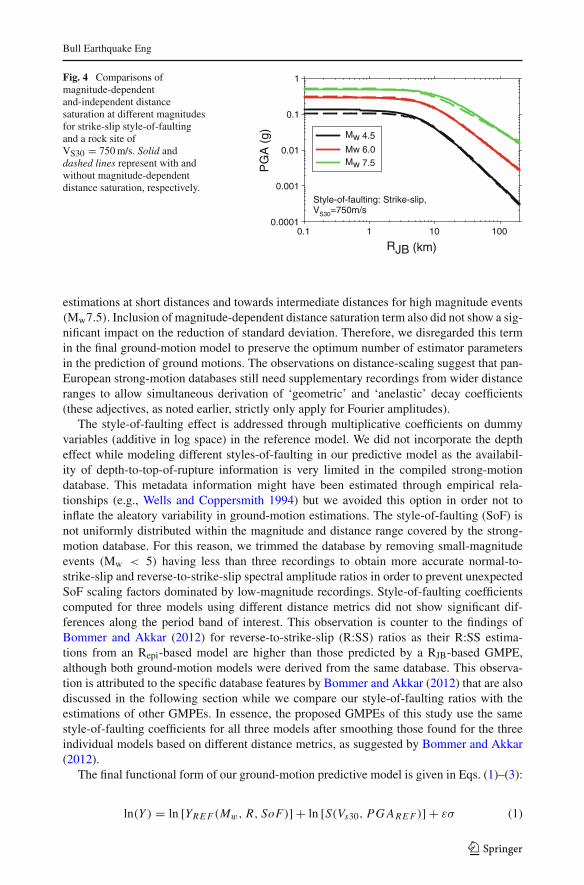
The distance scaling of ground-motion amplitudes is studied separately for anelasticattenuation and the influence of magnitude-dependent distance saturation. Inclusion of theanelastic attenuation term yielded a positive regression coefficient, which is not justifiableas it implies an increase in ground-motion amplitudes with increasing distance. Two pre-vious pan-European GMPEs (Ambraseys et al. 1996, 2005) that are listed in Table 1 alsoexplored the possibility of including the anelastic attenuation term in their functional forms.Their analyses also did not converge to a physically meaningful result in terms of anelas-tic attenuation, as in our case. Thus, we removed the anelastic attenuation term from thefinal model. The magnitude-dependent distance saturation is accounted for by modifyingthe fictitious depth term with a multiplicative exponential term that is a function of magni-tude. Figure 4 shows the distance scaling with and without magnitude-dependent distancesaturation term.
The regression analysis resulted in very similar ground-motion estimations. Themagnitude-dependent distance saturation slightly changes the median ground-motion
123
Bull Earthquake Eng
Fig. 4 Comparisons ofmagnitude-dependentand-independent distancesaturation at different magnitudesfor strike-slip style-of-faultingand a rock site ofVS30 = 750 m/s. Solid anddashed lines represent with andwithout magnitude-dependentdistance saturation, respectively.
RJB (km)0.1 1 10 100
PG
A (
g)
0.0001
0.001
0.01
0.1
1
Mw 4.5
Mw 6.0Mw 7.5
Style-of-faulting: Strike-slip,VS30=750m/s
estimations at short distances and towards intermediate distances for high magnitude events(Mw7.5). Inclusion of magnitude-dependent distance saturation term also did not show a sig-nificant impact on the reduction of standard deviation. Therefore, we disregarded this termin the final ground-motion model to preserve the optimum number of estimator parametersin the prediction of ground motions. The observations on distance-scaling suggest that pan-European strong-motion databases still need supplementary recordings from wider distanceranges to allow simultaneous derivation of ‘geometric’ and ‘anelastic’ decay coefficients(these adjectives, as noted earlier, strictly only apply for Fourier amplitudes).
The style-of-faulting effect is addressed through multiplicative coefficients on dummyvariables (additive in log space) in the reference model. We did not incorporate the deptheffect while modeling different styles-of-faulting in our predictive model as the availabil-ity of depth-to-top-of-rupture information is very limited in the compiled strong-motiondatabase. This metadata information might have been estimated through empirical rela-tionships (e.g., Wells and Coppersmith 1994) but we avoided this option in order not toinflate the aleatory variability in ground-motion estimations. The style-of-faulting (SoF) isnot uniformly distributed within the magnitude and distance range covered by the strong-motion database. For this reason, we trimmed the database by removing small-magnitudeevents (Mw < 5) having less than three recordings to obtain more accurate normal-to-strike-slip and reverse-to-strike-slip spectral amplitude ratios in order to prevent unexpectedSoF scaling factors dominated by low-magnitude recordings. Style-of-faulting coefficientscomputed for three models using different distance metrics did not show significant dif-ferences along the period band of interest. This observation is counter to the findings ofBommer and Akkar (2012) for reverse-to-strike-slip (R:SS) ratios as their R:SS estima-tions from an Repi-based model are higher than those predicted by a RJB-based GMPE,although both ground-motion models were derived from the same database. This observa-tion is attributed to the specific database features by Bommer and Akkar (2012) that are alsodiscussed in the following section while we compare our style-of-faulting ratios with theestimations of other GMPEs. In essence, the proposed GMPEs of this study use the samestyle-of-faulting coefficients for all three models after smoothing those found for the threeindividual models based on different distance metrics, as suggested by Bommer and Akkar(2012).
The final functional form of our ground-motion predictive model is given in Eqs. (1)–(3):
ln(Y ) = ln [YRE F (Mw, R, SoF)] + ln [S(Vs30, PG ARE F )] + εσ (1)
123
Bull Earthquake Eng
where
ln(YRE F ) =
⎧⎪⎪⎪⎪⎨
⎪⎪⎪⎪⎩
a1 + a2(Mw − c1) + a3(8.5 − Mw)2 + [a4 + a5(Mw − c1)
]ln(
√
R2 + a26)+
a8 FN + a9 FR + S forMw ≤ c1
a1 + a7(Mw − c1) + a3(8.5 − Mw)2 + [a4 + a5(Mw − c1)
]ln(
√
R2 + a26)+
a8 FN + a9 FR + S for Mw > c1
(2)
and
ln(S) =⎧⎨
⎩
b1 ln(VS30/VRE F ) + b2 ln[
PG ARE F +c(VS30/VRE F )n
(PG ARE F +c)(VS30/VRE F )n
]for VS30 ≤ VRE F
b1 ln[
min(VS30,VC O N )VRE F
]for VS30 > VRE F
(3)
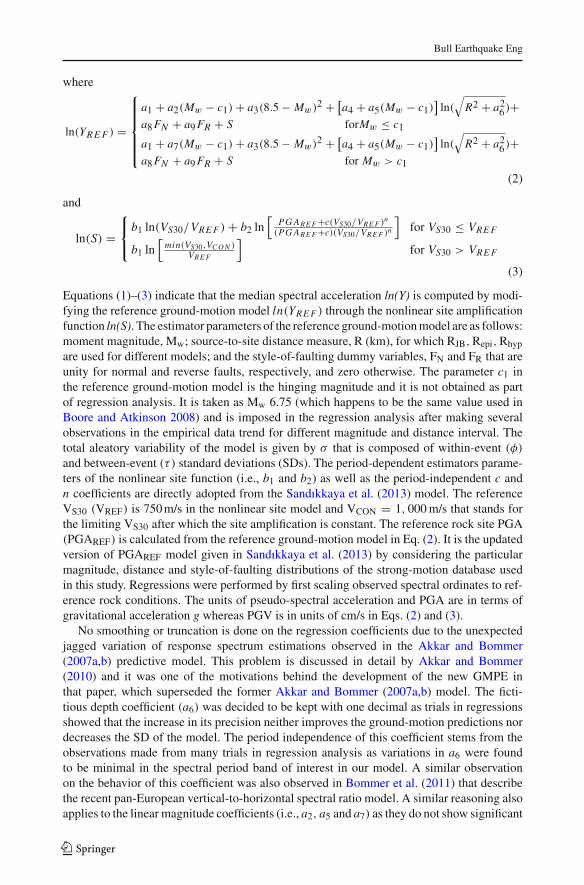
Equations (1)–(3) indicate that the median spectral acceleration ln(Y) is computed by modi-fying the reference ground-motion model ln(YRE F ) through the nonlinear site amplificationfunction ln(S). The estimator parameters of the reference ground-motion model are as follows:moment magnitude, Mw; source-to-site distance measure, R (km), for which RJB, Repi, Rhyp
are used for different models; and the style-of-faulting dummy variables, FN and FR that areunity for normal and reverse faults, respectively, and zero otherwise. The parameter c1 inthe reference ground-motion model is the hinging magnitude and it is not obtained as partof regression analysis. It is taken as Mw 6.75 (which happens to be the same value used inBoore and Atkinson 2008) and is imposed in the regression analysis after making severalobservations in the empirical data trend for different magnitude and distance interval. Thetotal aleatory variability of the model is given by σ that is composed of within-event (φ)
and between-event (τ ) standard deviations (SDs). The period-dependent estimators parame-ters of the nonlinear site function (i.e., b1 and b2) as well as the period-independent c andn coefficients are directly adopted from the Sandıkkaya et al. (2013) model. The referenceVS30 (VREF) is 750 m/s in the nonlinear site model and VCON = 1, 000 m/s that stands forthe limiting VS30 after which the site amplification is constant. The reference rock site PGA(PGAREF) is calculated from the reference ground-motion model in Eq. (2). It is the updatedversion of PGAREF model given in Sandıkkaya et al. (2013) by considering the particularmagnitude, distance and style-of-faulting distributions of the strong-motion database usedin this study. Regressions were performed by first scaling observed spectral ordinates to ref-erence rock conditions. The units of pseudo-spectral acceleration and PGA are in terms ofgravitational acceleration g whereas PGV is in units of cm/s in Eqs. (2) and (3).
No smoothing or truncation is done on the regression coefficients due to the unexpectedjagged variation of response spectrum estimations observed in the Akkar and Bommer(2007a,b) predictive model. This problem is discussed in detail by Akkar and Bommer(2010) and it was one of the motivations behind the development of the new GMPE inthat paper, which superseded the former Akkar and Bommer (2007a,b) model. The ficti-tious depth coefficient (a6) was decided to be kept with one decimal as trials in regressionsshowed that the increase in its precision neither improves the ground-motion predictions nordecreases the SD of the model. The period independence of this coefficient stems from theobservations made from many trials in regression analysis as variations in a6 were foundto be minimal in the spectral period band of interest in our model. A similar observationon the behavior of this coefficient was also observed in Bommer et al. (2011) that describethe recent pan-European vertical-to-horizontal spectral ratio model. A similar reasoning alsoapplies to the linear magnitude coefficients (i.e., a2, a5 and a7) as they do not show significant
123
Bull Earthquake Eng
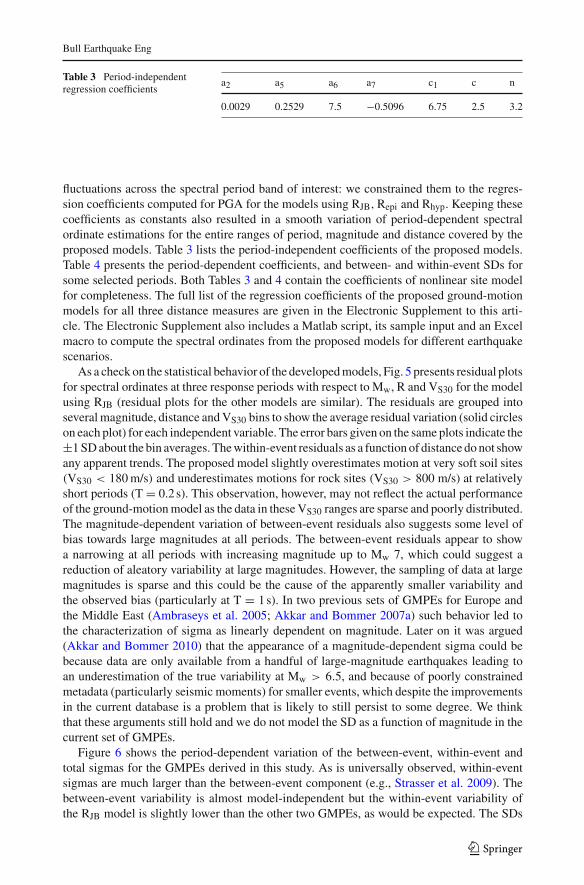
Table 3 Period-independentregression coefficients
a2 a5 a6 a7 c1 c n
0.0029 0.2529 7.5 −0.5096 6.75 2.5 3.2
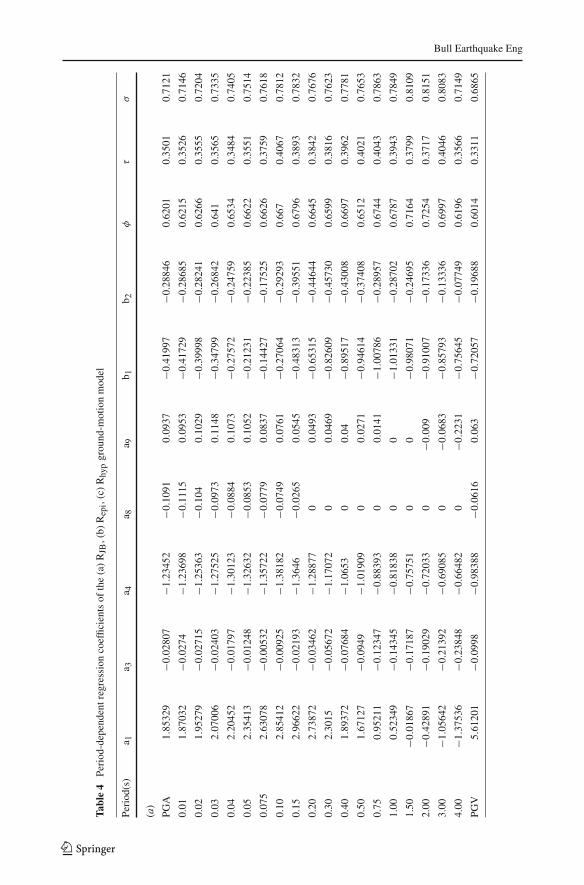
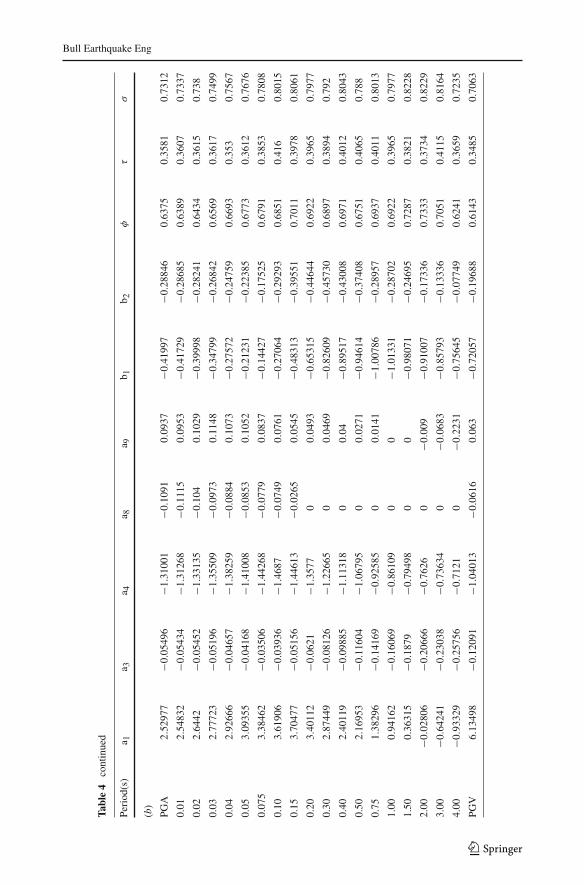
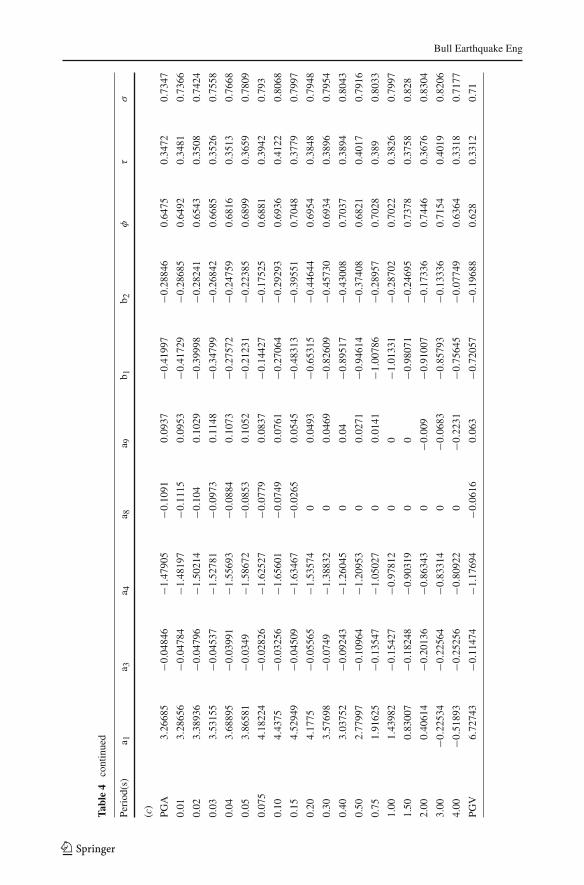
fluctuations across the spectral period band of interest: we constrained them to the regres-sion coefficients computed for PGA for the models using RJB, Repi and Rhyp. Keeping thesecoefficients as constants also resulted in a smooth variation of period-dependent spectralordinate estimations for the entire ranges of period, magnitude and distance covered by theproposed models. Table 3 lists the period-independent coefficients of the proposed models.Table 4 presents the period-dependent coefficients, and between- and within-event SDs forsome selected periods. Both Tables 3 and 4 contain the coefficients of nonlinear site modelfor completeness. The full list of the regression coefficients of the proposed ground-motionmodels for all three distance measures are given in the Electronic Supplement to this arti-cle. The Electronic Supplement also includes a Matlab script, its sample input and an Excelmacro to compute the spectral ordinates from the proposed models for different earthquakescenarios.
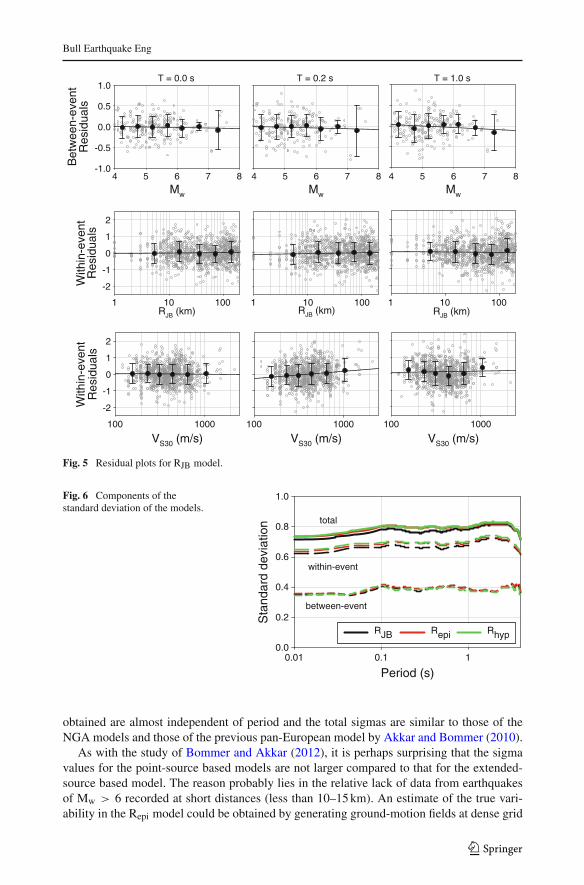
As a check on the statistical behavior of the developed models, Fig. 5 presents residual plotsfor spectral ordinates at three response periods with respect to Mw, R and VS30 for the modelusing RJB (residual plots for the other models are similar). The residuals are grouped intoseveral magnitude, distance and VS30 bins to show the average residual variation (solid circleson each plot) for each independent variable. The error bars given on the same plots indicate the±1 SD about the bin averages. The within-event residuals as a function of distance do not showany apparent trends. The proposed model slightly overestimates motion at very soft soil sites(VS30 < 180 m/s) and underestimates motions for rock sites (VS30 > 800 m/s) at relativelyshort periods (T = 0.2 s). This observation, however, may not reflect the actual performanceof the ground-motion model as the data in these VS30 ranges are sparse and poorly distributed.The magnitude-dependent variation of between-event residuals also suggests some level ofbias towards large magnitudes at all periods. The between-event residuals appear to showa narrowing at all periods with increasing magnitude up to Mw 7, which could suggest areduction of aleatory variability at large magnitudes. However, the sampling of data at largemagnitudes is sparse and this could be the cause of the apparently smaller variability andthe observed bias (particularly at T = 1 s). In two previous sets of GMPEs for Europe andthe Middle East (Ambraseys et al. 2005; Akkar and Bommer 2007a) such behavior led tothe characterization of sigma as linearly dependent on magnitude. Later on it was argued(Akkar and Bommer 2010) that the appearance of a magnitude-dependent sigma could bebecause data are only available from a handful of large-magnitude earthquakes leading toan underestimation of the true variability at Mw > 6.5, and because of poorly constrainedmetadata (particularly seismic moments) for smaller events, which despite the improvementsin the current database is a problem that is likely to still persist to some degree. We thinkthat these arguments still hold and we do not model the SD as a function of magnitude in thecurrent set of GMPEs.
Figure 6 shows the period-dependent variation of the between-event, within-event andtotal sigmas for the GMPEs derived in this study. As is universally observed, within-eventsigmas are much larger than the between-event component (e.g., Strasser et al. 2009). Thebetween-event variability is almost model-independent but the within-event variability ofthe RJB model is slightly lower than the other two GMPEs, as would be expected. The SDs
123
Bull Earthquake Eng
Tabl
e4
Peri
od-d
epen
dent
regr
essi
onco
effic
ient
sof
the
(a)
RJB
,(b)
Rep
i,(c
)R
hyp
grou
nd-m
otio
nm
odel
Peri
od(s
)a 1
a 3a 4
a 8a 9
b 1b 2
φτ
σ
(a)
PGA
1.85
329
−0.0
2807
−1.2
3452
−0.1
091
0.09
37−0
.419
97−0
.288
460.
6201
0.35
010.
7121
0.01
1.87
032
−0.0
274
−1.2
3698
−0.1
115
0.09
53−0
.417
29−0
.286
850.
6215
0.35
260.
7146
0.02
1.95
279
−0.0
2715
−1.2
5363
−0.1
040.
1029
−0.3
9998
−0.2
8241
0.62
660.
3555
0.72
04
0.03
2.07
006
−0.0
2403
−1.2
7525
−0.0
973
0.11
48−0
.347
99−0
.268
420.
641
0.35
650.
7335
0.04
2.20
452
−0.0
1797
−1.3
0123
−0.0
884
0.10
73−0
.275
72−0
.247
590.
6534
0.34
840.
7405
0.05
2.35
413
−0.0
1248
−1.3
2632
−0.0
853
0.10
52−0
.212
31−0
.223
850.
6622
0.35
510.
7514
0.07
52.
6307
8−0
.005
32−1
.357
22− 0
.077
90.
0837
−0.1
4427
−0.1
7525
0.66
260.
3759
0.76
18
0.10
2.85
412
−0.0
0925
−1.3
8182
−0.0
749
0.07
61−0
.270
64−0
.292
930.
667
0.40
670.
7812
0.15
2.96
622
−0.0
2193
−1.3
646
−0.0
265
0.05
45−0
.483
13−0
.395
510.
6796
0.38
930.
7832
0.20
2.73
872
−0.0
3462
−1.2
8877
00.
0493
−0.6
5315
−0.4
4644
0.66
450.
3842
0.76
76
0.30
2.30
15−0
.056
72−1
.170
720
0.04
69−0
.826
09−0
.457
300.
6599
0.38
160.
7623
0.40
1.89
372
−0.0
7684
−1.0
653
00.
04−0
.895
17−0
.430
080.
6697
0.39
620.
7781
0.50
1.67
127
−0.0
949
−1.0
1909
00.
0271
−0.9
4614
−0.3
7408
0.65
120.
4021
0.76
53
0.75
0.95
211
−0.1
2347
−0.8
8393
00.
0141
−1.0
0786
− 0.2
8957
0.67
440.
4043
0.78
63
1.00
0.52
349
−0.1
4345
−0.8
1838
00
−1.0
1331
−0.2
8702
0.67
870.
3943
0.78
49
1.50
−0.0
1867
−0.1
7187
−0.7
5751
00
−0.9
8071
−0.2
4695
0.71
640.
3799
0.81
09
2.00
−0.4
2891
−0.1
9029
−0.7
2033
0−0
.009
−0.9
1007
−0.1
7336
0.72
540.
3717
0.81
51
3.00
−1.0
5642
−0.2
1392
−0.6
9085
0−0
.068
3−0
.857
93−0
.133
360.
6997
0.40
460.
8083
4.00
−1.3
7536
−0.2
3848
−0.6
6482
0−0
.223
1−0
.756
45−0
.077
490.
6196
0.35
660.
7149
PGV
5.61
201
−0.0
998
−0.9
8388
−0.0
616
0.06
3−0
.720
57−0
.196
880.
6014
0.33
110.
6865
123
Bull Earthquake Eng
Tabl
e4
cont
inue
d
Peri
od(s
)a 1
a 3a 4
a 8a 9
b 1b 2
φτ
σ
(b)
PGA
2.52
977
−0.0
5496
−1.3
1001
−0.1
091
0.09
37−0
.419
97−0
.288
460.
6375
0.35
810.
7312
0.01
2.54
832
−0.0
5434
−1.3
1268
−0.1
115
0.09
53−0
.417
29−0
.286
850.
6389
0.36
070.
7337
0.02
2.64
42−0
.054
52−1
.331
35−0
.104
0.10
29−0
.399
98−0
.282
410.
6434
0.36
150.
738
0.03
2.77
723
−0.0
5196
−1.3
5509
−0.0
973
0.11
48−0
.347
99−0
.268
420.
6569
0.36
170.
7499
0.04
2.92
666
−0.0
4657
−1.3
8259
−0.0
884
0.10
73−0
.275
72−0
.247
590.
6693
0.35
30.
7567
0.05
3.09
355
−0.0
4168
−1.4
1008
−0.0
853
0.10
52−0
.212
31−0
.223
850.
6773
0.36
120.
7676
0.07
53.
3846
2−0
.035
06−1
.442
68− 0
.077
90.
0837
−0.1
4427
−0.1
7525
0.67
910.
3853
0.78
08
0.10
3.61
906
−0.0
3936
−1.4
687
−0.0
749
0.07
61−0
.270
64−0
.292
930.
6851
0.41
60.
8015
0.15
3.70
477
−0.0
5156
−1.4
4613
−0.0
265
0.05
45−0
.483
13−0
.395
510.
7011
0.39
780.
8061
0.20
3.40
112
−0.0
621
−1.3
577
00.
0493
−0.6
5315
−0.4
4644
0.69
220.
3965
0.79
77
0.30
2.87
449
−0.0
8126
−1.2
2665
00.
0469
−0.8
2609
−0.4
5730
0.68
970.
3894
0.79
2
0.40
2.40
119
−0.0
9885
−1.1
1318
00.
04−0
.895
17−0
.430
080.
6971
0.40
120.
8043
0.50
2.16
953
−0.1
1604
−1.0
6795
00.
0271
−0.9
4614
−0.3
7408
0.67
510.
4065
0.78
8
0.75
1.38
296
−0.1
4169
−0.9
2585
00.
0141
−1.0
0786
− 0.2
8957
0.69
370.
4011
0.80
13
1.00
0.94
162
−0.1
6069
−0.8
6109
00
−1.0
1331
−0.2
8702
0.69
220.
3965
0.79
77
1.50
0.36
315
−0.1
879
−0.7
9498
00
−0.9
8071
−0.2
4695
0.72
870.
3821
0.82
28
2.00
−0.0
2806
−0.2
0666
−0.7
626
0−0
.009
−0.9
1007
−0.1
7336
0.73
330.
3734
0.82
29
3.00
−0.6
4241
−0.2
3038
−0.7
3634
0−0
.068
3−0
.857
93−0
.133
360.
7051
0.41
150.
8164
4.00
−0.9
3329
−0.2
5756
−0.7
121
0−0
.223
1−0
.756
45−0
.077
490.
6241
0.36
590.
7235
PGV
6.13
498
−0.1
2091
−1.0
4013
−0.0
616
0.06
3−0
.720
57−0
.196
880.
6143
0.34
850.
7063
123
Bull Earthquake Eng
Tabl
e4
cont
inue
d
Peri
od(s
)a 1
a 3a 4
a 8a 9
b 1b 2
φτ
σ
(c)
PGA
3.26
685
−0.0
4846
−1.4
7905
−0.1
091
0.09
37−0
.419
97−0
.288
460.
6475
0.34
720.
7347
0.01
3.28
656
−0.0
4784
−1.4
8197
−0.1
115
0.09
53−0
.417
29−0
.286
850.
6492
0.34
810.
7366
0.02
3.38
936
−0.0
4796
−1.5
0214
−0.1
040.
1029
−0.3
9998
−0.2
8241
0.65
430.
3508
0.74
24
0.03
3.53
155
−0.0
4537
−1.5
2781
−0.0
973
0.11
48−0
.347
99−0
.268
420.
6685
0.35
260.
7558
0.04
3.68
895
−0.0
3991
−1.5
5693
−0.0
884
0.10
73−0
.275
72−0
.247
590.
6816
0.35
130.
7668
0.05
3.86
581
−0.0
349
−1.5
8672
−0.0
853
0.10
52−0
.212
31−0
.223
850.
6899
0.36
590.
7809
0.07
54.
1822
4−0
.028
26−1
.625
27− 0
.077
90.
0837
−0.1
4427
−0.1
7525
0.68
810.
3942
0.79
3
0.10
4.43
75−0
.032
56−1
.656
01−0
.074
90.
0761
−0.2
7064
−0.2
9293
0.69
360.
4122
0.80
68
0.15
4.52
949
−0.0
4509
−1.6
3467
−0.0
265
0.05
45−0
.483
13−0
.395
510.
7048
0.37
790.
7997
0.20
4.17
75−0
.055
65−1
.535
740
0.04
93−0
.653
15−0
.446
440.
6954
0.38
480.
7948
0.30
3.57
698
−0.0
749
−1.3
8832
00.
0469
−0.8
2609
−0.4
5730
0.69
340.
3896
0.79
54
0.40
3.03
752
−0.0
9243
−1.2
6045
00.
04−0
.895
17−0
.430
080.
7037
0.38
940.
8043
0.50
2.77
997
−0.1
0964
−1.2
0953
00.
0271
−0.9
4614
−0.3
7408
0.68
210.
4017
0.79
16
0.75
1.91
625
−0.1
3547
−1.0
5027
00.
0141
−1.0
0786
− 0.2
8957
0.70
280.
389
0.80
33
1.00
1.43
982
−0.1
5427
−0.9
7812
00
−1.0
1331
−0.2
8702
0.70
220.
3826
0.79
97
1.50
0.83
007
−0.1
8248
−0.9
0319
00
−0.9
8071
−0.2
4695
0.73
780.
3758
0.82
8
2.00
0.40
614
−0.2
0136
−0.8
6343
0−0
.009
−0.9
1007
−0.1
7336
0.74
460.
3676
0.83
04
3.00
−0.2
2534
−0.2
2564
−0.8
3314
0−0
.068
3−0
.857
93−0
.133
360.
7154
0.40
190.
8206
4.00
−0.5
1893
−0.2
5256
−0.8
0922
0−0
.223
1−0
.756
45−0
.077
490.
6364
0.33
180.
7177
PGV
6.72
743
−0.1
1474
−1.1
7694
−0.0
616
0.06
3−0
.720
57−0
.196
880.
628
0.33
120.
71
123
Bull Earthquake Eng
RJB (km)
With
in-e
vent
-2
-1
0
1
2
Mw
Bet
wee
n-ev
ent
-1.0
-0.5
0.0
0.5
1.0
VS30 (m/s)1000100
With
in-e
vent
-2
-1
0
1
2
T = 0.0 s
RJB (km)
Mw
VS30 (m/s)1000100
T = 0.2 s
RJB (km)1 10 100 1 10 100 1 10 100
Mw
4 5 6 7 8 4 5 6 7 8 4 5 6 7 8
VS30 (m/s)1000100
T = 1.0 sR
esid
uals
Res
idua
lsR
esid
uals
Fig. 5 Residual plots for RJB model.
Fig. 6 Components of thestandard deviation of the models.
Period (s)0.01 0.1 1
Sta
ndar
d de
viat
ion
0.0
0.2
0.4
0.6
0.8
1.0
total
between-event
within-event
RJB Repi Rhyp
obtained are almost independent of period and the total sigmas are similar to those of theNGA models and those of the previous pan-European model by Akkar and Bommer (2010).
As with the study of Bommer and Akkar (2012), it is perhaps surprising that the sigmavalues for the point-source based models are not larger compared to that for the extended-source based model. The reason probably lies in the relative lack of data from earthquakesof Mw > 6 recorded at short distances (less than 10–15 km). An estimate of the true vari-ability in the Repi model could be obtained by generating ground-motion fields at dense grid
123
Bull Earthquake Eng
points around various hypothetical ruptures (with dimensions appropriate to the earthquakemagnitude), predicting the motions (at various exceedance levels) using the RJB model. Theepicentral distances could then be calculated (making appropriate assumptions about thedistribution of unilateral and bilateral ruptures) and regressions performed in Repi to obtainsigma values that may better reflect the added variability from using point-source distancemetrics. The sigma model developed in this way may need to be magnitude- and/or distance-dependent, and the values would then likely differ from those presented herein only for largermagnitudes and relatively short epicentral distances.
5 Predictions and comparison with other models
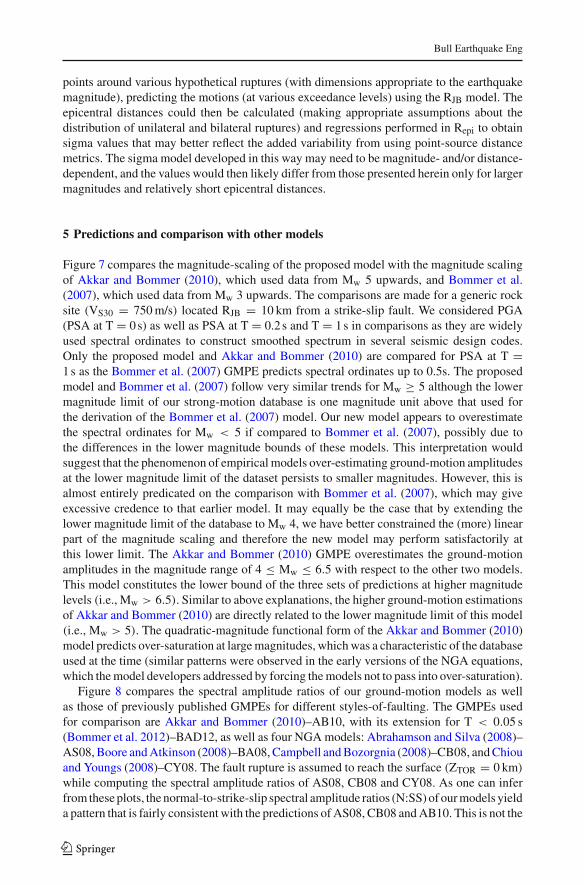
Figure 7 compares the magnitude-scaling of the proposed model with the magnitude scalingof Akkar and Bommer (2010), which used data from Mw 5 upwards, and Bommer et al.(2007), which used data from Mw 3 upwards. The comparisons are made for a generic rocksite (VS30 = 750 m/s) located RJB = 10 km from a strike-slip fault. We considered PGA(PSA at T = 0 s) as well as PSA at T = 0.2 s and T = 1 s in comparisons as they are widelyused spectral ordinates to construct smoothed spectrum in several seismic design codes.Only the proposed model and Akkar and Bommer (2010) are compared for PSA at T =1 s as the Bommer et al. (2007) GMPE predicts spectral ordinates up to 0.5s. The proposedmodel and Bommer et al. (2007) follow very similar trends for Mw ≥ 5 although the lowermagnitude limit of our strong-motion database is one magnitude unit above that used forthe derivation of the Bommer et al. (2007) model. Our new model appears to overestimatethe spectral ordinates for Mw < 5 if compared to Bommer et al. (2007), possibly due tothe differences in the lower magnitude bounds of these models. This interpretation wouldsuggest that the phenomenon of empirical models over-estimating ground-motion amplitudesat the lower magnitude limit of the dataset persists to smaller magnitudes. However, this isalmost entirely predicated on the comparison with Bommer et al. (2007), which may giveexcessive credence to that earlier model. It may equally be the case that by extending thelower magnitude limit of the database to Mw 4, we have better constrained the (more) linearpart of the magnitude scaling and therefore the new model may perform satisfactorily atthis lower limit. The Akkar and Bommer (2010) GMPE overestimates the ground-motionamplitudes in the magnitude range of 4 ≤ Mw ≤ 6.5 with respect to the other two models.This model constitutes the lower bound of the three sets of predictions at higher magnitudelevels (i.e., Mw > 6.5). Similar to above explanations, the higher ground-motion estimationsof Akkar and Bommer (2010) are directly related to the lower magnitude limit of this model(i.e., Mw > 5). The quadratic-magnitude functional form of the Akkar and Bommer (2010)model predicts over-saturation at large magnitudes, which was a characteristic of the databaseused at the time (similar patterns were observed in the early versions of the NGA equations,which the model developers addressed by forcing the models not to pass into over-saturation).
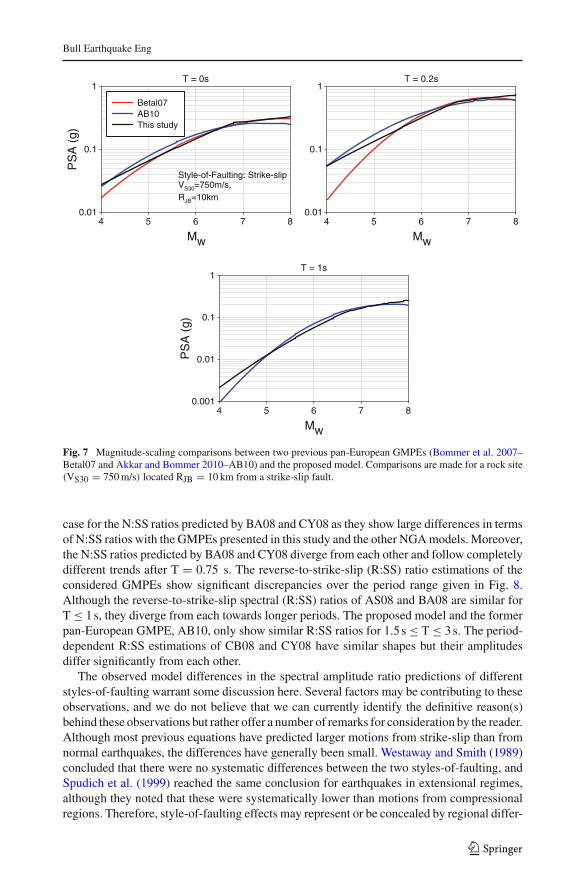
Figure 8 compares the spectral amplitude ratios of our ground-motion models as wellas those of previously published GMPEs for different styles-of-faulting. The GMPEs usedfor comparison are Akkar and Bommer (2010)–AB10, with its extension for T < 0.05 s(Bommer et al. 2012)–BAD12, as well as four NGA models: Abrahamson and Silva (2008)–AS08, Boore and Atkinson (2008)–BA08, Campbell and Bozorgnia (2008)–CB08, and Chiouand Youngs (2008)–CY08. The fault rupture is assumed to reach the surface (ZTOR = 0 km)
while computing the spectral amplitude ratios of AS08, CB08 and CY08. As one can inferfrom these plots, the normal-to-strike-slip spectral amplitude ratios (N:SS) of our models yielda pattern that is fairly consistent with the predictions of AS08, CB08 and AB10. This is not the
123
Bull Earthquake Eng
Mw
PS
A (
g)
0.01
0.1
1
Betal07AB10This study
Mw
0.01
0.1
1
Mw
4 5 6 7 8 4 5 6 7 8
4 5 6 7 8
PS
A (
g)
0.001
0.01
0.1
1
T = 0s T = 0.2s
T = 1s
Style-of-Faulting: Strike-slipVS30=750m/s,RJB=10km
Fig. 7 Magnitude-scaling comparisons between two previous pan-European GMPEs (Bommer et al. 2007–Betal07 and Akkar and Bommer 2010–AB10) and the proposed model. Comparisons are made for a rock site(VS30 = 750 m/s) located RJB = 10 km from a strike-slip fault.
case for the N:SS ratios predicted by BA08 and CY08 as they show large differences in termsof N:SS ratios with the GMPEs presented in this study and the other NGA models. Moreover,the N:SS ratios predicted by BA08 and CY08 diverge from each other and follow completelydifferent trends after T = 0.75 s. The reverse-to-strike-slip (R:SS) ratio estimations of theconsidered GMPEs show significant discrepancies over the period range given in Fig. 8.Although the reverse-to-strike-slip spectral (R:SS) ratios of AS08 and BA08 are similar forT ≤ 1 s, they diverge from each towards longer periods. The proposed model and the formerpan-European GMPE, AB10, only show similar R:SS ratios for 1.5 s ≤ T ≤ 3 s. The period-dependent R:SS estimations of CB08 and CY08 have similar shapes but their amplitudesdiffer significantly from each other.
The observed model differences in the spectral amplitude ratio predictions of differentstyles-of-faulting warrant some discussion here. Several factors may be contributing to theseobservations, and we do not believe that we can currently identify the definitive reason(s)behind these observations but rather offer a number of remarks for consideration by the reader.Although most previous equations have predicted larger motions from strike-slip than fromnormal earthquakes, the differences have generally been small. Westaway and Smith (1989)concluded that there were no systematic differences between the two styles-of-faulting, andSpudich et al. (1999) reached the same conclusion for earthquakes in extensional regimes,although they noted that these were systematically lower than motions from compressionalregions. Therefore, style-of-faulting effects may represent or be concealed by regional differ-
123
Bull Earthquake Eng
Period (s)0.01 0.1 1
N:S
S
0.6
0.8
1.0
1.2
1.4
This studyAB10+BAD12AS08 BA08CB08CY08
Period (s)0.01 0.1 1
R:S
S
0.6
0.8
1.0
1.2
1.4
Fig. 8 Period dependent normal-to-strike-slip (left panel) and reverse-to-strike-slip (right panel) spectralordinate ratios of different GMPEs.
ences in ground motions. Similarly, the style-of-faulting effect can trade-off with effects suchas the fact that buried ruptures tend to produce higher amplitudes of motion than rupturesthat break the surface (Kagawa et al. 2004), reflected in the NGA models by the inclusion ofa parameter reflecting the depth-to-the-top-of-rupture (ZTOR). This trade-off is related to thefact that deeper events are likely to be associated with higher stress drop, which may havea more pronounced effect than the increased separation of source and site. Another factorthat must be considered is the limitations of strong-motion databases in terms of differentrupture mechanisms. For example, normal-faulting earthquakes are poorly represented in thedatasets used for the NGA models, which is not the case for this pan-European database.On the other hand, in our current database, nearly all records from events with Mw > 7 arefrom strike-slip earthquakes with none from normal events and only two from reverse events.Thus, it may also be the case that such non-uniform distribution of rupture mechanisms in thedatabases contributes to the observed discrepancies in style-of-faulting ratios. The variationin style-of-faulting ratios under the influence of strong-motion database features is discussedin Sandıkkaya and Akkar (2012) by using alternative subsets of the strong-motion databaseused in this study.
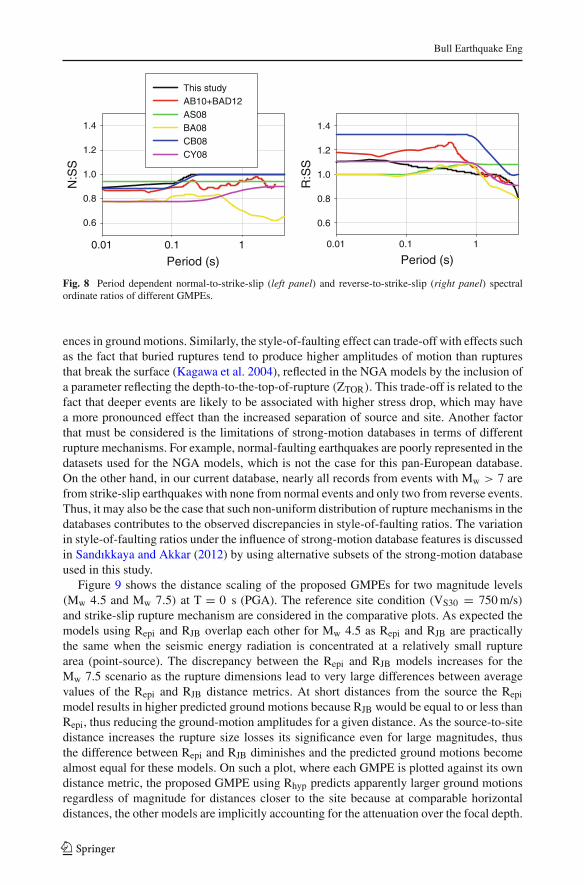
Figure 9 shows the distance scaling of the proposed GMPEs for two magnitude levels(Mw 4.5 and Mw 7.5) at T = 0 s (PGA). The reference site condition (VS30 = 750 m/s)and strike-slip rupture mechanism are considered in the comparative plots. As expected themodels using Repi and RJB overlap each other for Mw 4.5 as Repi and RJB are practicallythe same when the seismic energy radiation is concentrated at a relatively small rupturearea (point-source). The discrepancy between the Repi and RJB models increases for theMw 7.5 scenario as the rupture dimensions lead to very large differences between averagevalues of the Repi and RJB distance metrics. At short distances from the source the Repi
model results in higher predicted ground motions because RJB would be equal to or less thanRepi, thus reducing the ground-motion amplitudes for a given distance. As the source-to-sitedistance increases the rupture size losses its significance even for large magnitudes, thusthe difference between Repi and RJB diminishes and the predicted ground motions becomealmost equal for these models. On such a plot, where each GMPE is plotted against its owndistance metric, the proposed GMPE using Rhyp predicts apparently larger ground motionsregardless of magnitude for distances closer to the site because at comparable horizontaldistances, the other models are implicitly accounting for the attenuation over the focal depth.
123
Bull Earthquake Eng
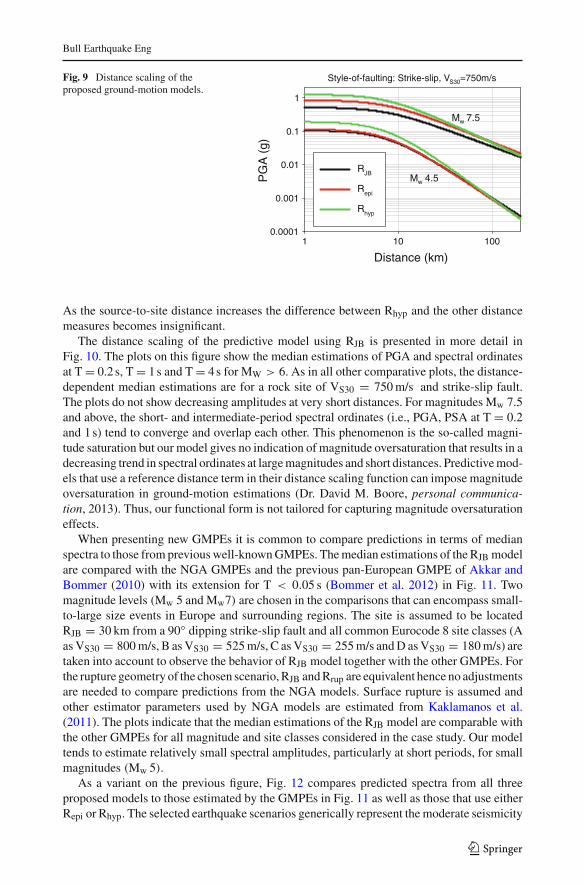
Fig. 9 Distance scaling of theproposed ground-motion models.
Distance (km)1 10 100
PG
A (
g)
0.0001
0.001
0.01
0.1
1
RJB
Repi
Rhyp
Mw 7.5
Mw 4.5
Style-of-faulting: Strike-slip, VS30=750m/s
As the source-to-site distance increases the difference between Rhyp and the other distancemeasures becomes insignificant.
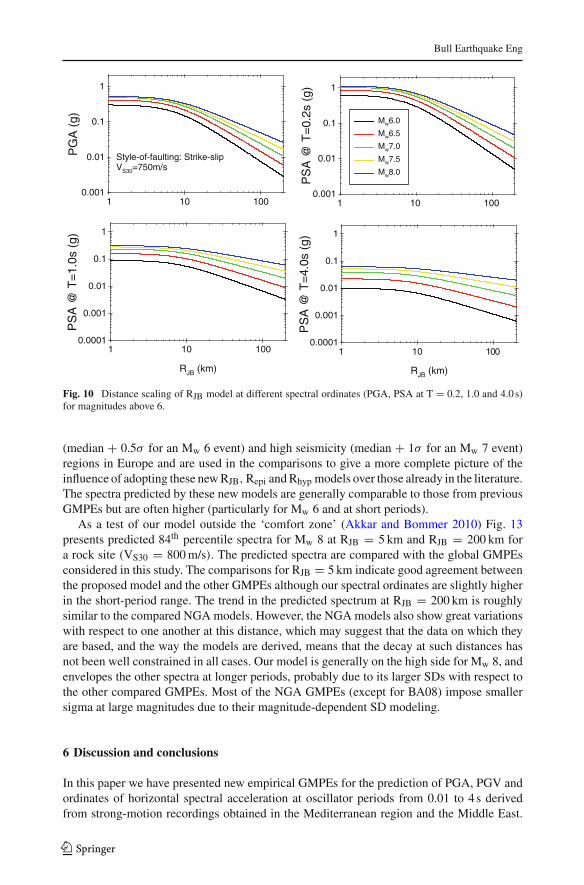
The distance scaling of the predictive model using RJB is presented in more detail inFig. 10. The plots on this figure show the median estimations of PGA and spectral ordinatesat T = 0.2 s, T = 1 s and T = 4 s for MW > 6. As in all other comparative plots, the distance-dependent median estimations are for a rock site of VS30 = 750 m/s and strike-slip fault.The plots do not show decreasing amplitudes at very short distances. For magnitudes Mw 7.5and above, the short- and intermediate-period spectral ordinates (i.e., PGA, PSA at T = 0.2and 1 s) tend to converge and overlap each other. This phenomenon is the so-called magni-tude saturation but our model gives no indication of magnitude oversaturation that results in adecreasing trend in spectral ordinates at large magnitudes and short distances. Predictive mod-els that use a reference distance term in their distance scaling function can impose magnitudeoversaturation in ground-motion estimations (Dr. David M. Boore, personal communica-tion, 2013). Thus, our functional form is not tailored for capturing magnitude oversaturationeffects.
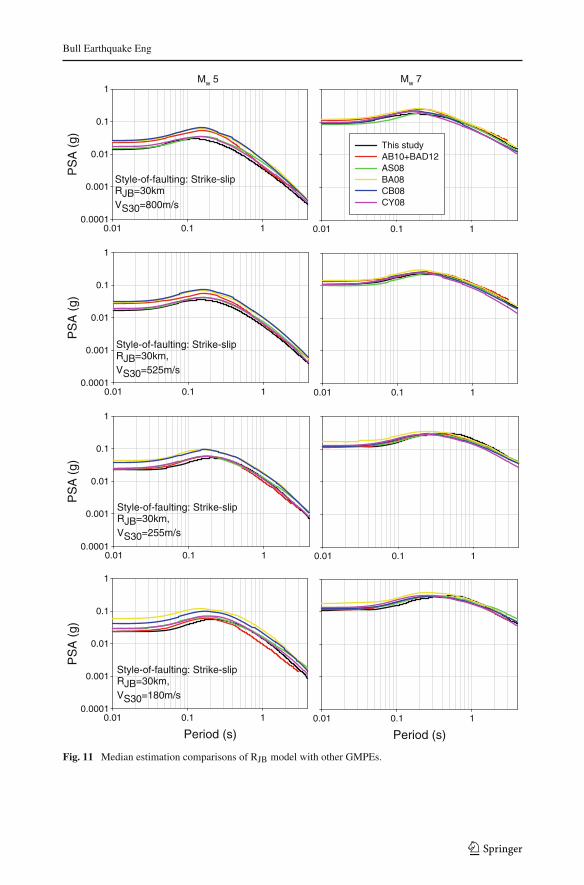
When presenting new GMPEs it is common to compare predictions in terms of medianspectra to those from previous well-known GMPEs. The median estimations of the RJB modelare compared with the NGA GMPEs and the previous pan-European GMPE of Akkar andBommer (2010) with its extension for T < 0.05 s (Bommer et al. 2012) in Fig. 11. Twomagnitude levels (Mw 5 and Mw7) are chosen in the comparisons that can encompass small-to-large size events in Europe and surrounding regions. The site is assumed to be locatedRJB = 30 km from a 90◦ dipping strike-slip fault and all common Eurocode 8 site classes (Aas VS30 = 800 m/s, B as VS30 = 525 m/s, C as VS30 = 255 m/s and D as VS30 = 180 m/s) aretaken into account to observe the behavior of RJB model together with the other GMPEs. Forthe rupture geometry of the chosen scenario, RJB and Rrup are equivalent hence no adjustmentsare needed to compare predictions from the NGA models. Surface rupture is assumed andother estimator parameters used by NGA models are estimated from Kaklamanos et al.(2011). The plots indicate that the median estimations of the RJB model are comparable withthe other GMPEs for all magnitude and site classes considered in the case study. Our modeltends to estimate relatively small spectral amplitudes, particularly at short periods, for smallmagnitudes (Mw 5).
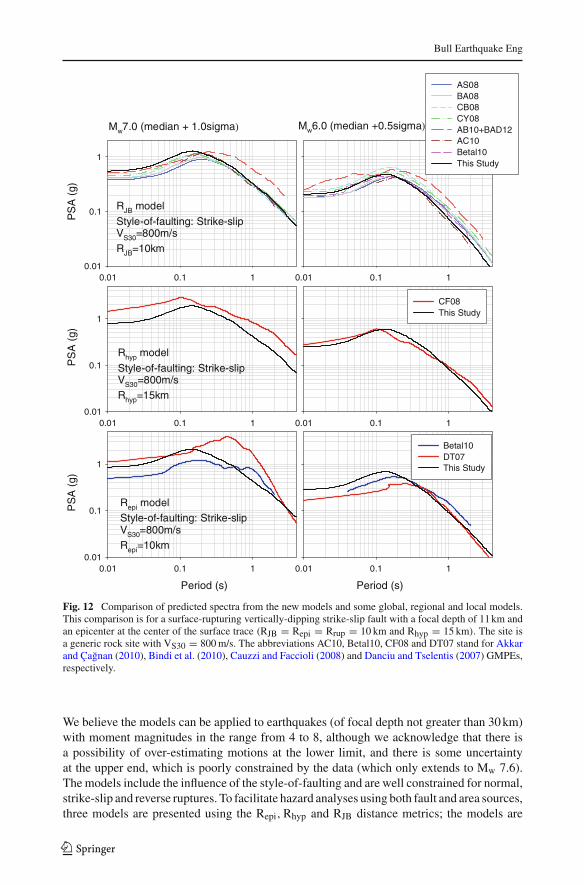
As a variant on the previous figure, Fig. 12 compares predicted spectra from all threeproposed models to those estimated by the GMPEs in Fig. 11 as well as those that use eitherRepi or Rhyp. The selected earthquake scenarios generically represent the moderate seismicity
123
Bull Earthquake Eng
1 10 100
PS
A @
T=
0.2s
(g)
0.001
0.01
0.1
1
1 10 100
PG
A (
g)
0.001
0.01
0.1
1
Mw6.0
Mw6.5
Mw7.0
Mw7.5
Mw8.0
RJB (km)
1 10 100
PS
A @
T=
1.0s
(g)
0.0001
0.001
0.01
0.1
1
RJB (km)
1 10 100
PS
A @
T=
4.0s
(g)
0.0001
0.001
0.01
0.1
1
Style-of-faulting: Strike-slipVS30=750m/s
Fig. 10 Distance scaling of RJB model at different spectral ordinates (PGA, PSA at T = 0.2, 1.0 and 4.0 s)for magnitudes above 6.
(median + 0.5σ for an Mw 6 event) and high seismicity (median + 1σ for an Mw 7 event)regions in Europe and are used in the comparisons to give a more complete picture of theinfluence of adopting these new RJB, Repi and Rhyp models over those already in the literature.The spectra predicted by these new models are generally comparable to those from previousGMPEs but are often higher (particularly for Mw 6 and at short periods).
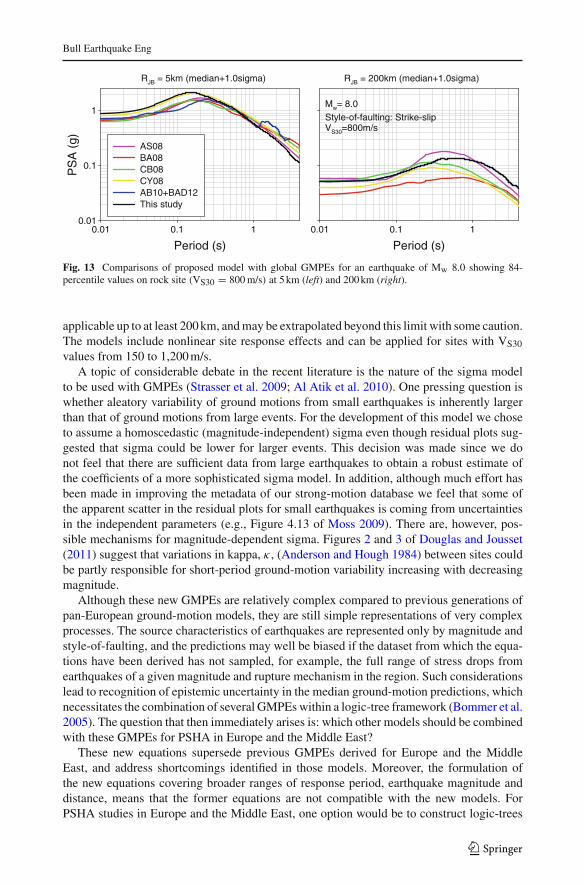
As a test of our model outside the ‘comfort zone’ (Akkar and Bommer 2010) Fig. 13presents predicted 84th percentile spectra for Mw 8 at RJB = 5 km and RJB = 200 km fora rock site (VS30 = 800 m/s). The predicted spectra are compared with the global GMPEsconsidered in this study. The comparisons for RJB = 5 km indicate good agreement betweenthe proposed model and the other GMPEs although our spectral ordinates are slightly higherin the short-period range. The trend in the predicted spectrum at RJB = 200 km is roughlysimilar to the compared NGA models. However, the NGA models also show great variationswith respect to one another at this distance, which may suggest that the data on which theyare based, and the way the models are derived, means that the decay at such distances hasnot been well constrained in all cases. Our model is generally on the high side for Mw 8, andenvelopes the other spectra at longer periods, probably due to its larger SDs with respect tothe other compared GMPEs. Most of the NGA GMPEs (except for BA08) impose smallersigma at large magnitudes due to their magnitude-dependent SD modeling.
6 Discussion and conclusions
In this paper we have presented new empirical GMPEs for the prediction of PGA, PGV andordinates of horizontal spectral acceleration at oscillator periods from 0.01 to 4 s derivedfrom strong-motion recordings obtained in the Mediterranean region and the Middle East.
123
Bull Earthquake Eng
PS
A (
g)
0.0001
0.001
0.01
0.1
1
This studyAB10+BAD12AS08 BA08 CB08 CY08
Mw 5 Mw 7P
SA
(g)
0.0001
0.001
0.01
0.1
1
PS
A (
g)
0.0001
0.001
0.01
0.1
1
Period (s)
PS
A (
g)
0.0001
0.001
0.01
0.1
1
Period (s)
0.01 0.1 10.01 0.1 1
0.01 0.1 1 0.01 0.1 1
0.01 0.1 1 0.01 0.1 1
0.01 0.1 1 0.01 0.1 1
Style-of-faulting: Strike-slipRJB=30kmVS30=800m/s
Style-of-faulting: Strike-slipRJB=30km,VS30=525m/s
Style-of-faulting: Strike-slipRJB=30km,VS30=255m/s
Style-of-faulting: Strike-slipRJB=30km,VS30=180m/s
Fig. 11 Median estimation comparisons of RJB model with other GMPEs.
123
Bull Earthquake Eng
0.01 0.1 1
0.01 0.1 10.01 0.1 1
PS
A (
g)
0.01
0.1
1
CF08 This Study
Period (s) Period (s)
0.01 0.1 1
PS
A (
g)
0.01
0.1
1
Betal10 DT07 This Study
0.01 0.1 10.01 0.1 1
PS
A (
g)
0.01
0.1
1
AS08 BA08 CB08 CY08 AB10+BAD12AC10 Betal10 This Study
Mw7.0 (median + 1.0sigma) Mw6.0 (median +0.5sigma)
Repi model Style-of-faulting: Strike-slipVS30=800m/sRepi=10km
RJB model
Style-of-faulting: Strike-slipVS30=800m/sRJB=10km
Rhyp model
Style-of-faulting: Strike-slipVS30=800m/sRhyp=15km
Fig. 12 Comparison of predicted spectra from the new models and some global, regional and local models.This comparison is for a surface-rupturing vertically-dipping strike-slip fault with a focal depth of 11 km andan epicenter at the center of the surface trace (RJB = Repi = Rrup = 10 km and Rhyp = 15 km). The site isa generic rock site with VS30 = 800 m/s. The abbreviations AC10, Betal10, CF08 and DT07 stand for Akkarand Çagnan (2010), Bindi et al. (2010), Cauzzi and Faccioli (2008) and Danciu and Tselentis (2007) GMPEs,respectively.
We believe the models can be applied to earthquakes (of focal depth not greater than 30 km)with moment magnitudes in the range from 4 to 8, although we acknowledge that there isa possibility of over-estimating motions at the lower limit, and there is some uncertaintyat the upper end, which is poorly constrained by the data (which only extends to Mw 7.6).The models include the influence of the style-of-faulting and are well constrained for normal,strike-slip and reverse ruptures. To facilitate hazard analyses using both fault and area sources,three models are presented using the Repi, Rhyp and RJB distance metrics; the models are
123
Bull Earthquake Eng
Period (s)
PS
A (
g)
0.01
0.1
1
AS08 BA08 CB08 CY08 AB10+BAD12This study
RJB = 5km (median+1.0sigma)
Period (s)0.01 0.1 1 0.01 0.1 1
RJB = 200km (median+1.0sigma)
Mw= 8.0Style-of-faulting: Strike-slipVS30=800m/s
Fig. 13 Comparisons of proposed model with global GMPEs for an earthquake of Mw 8.0 showing 84-percentile values on rock site (VS30 = 800 m/s) at 5 km (left) and 200 km (right).
applicable up to at least 200 km, and may be extrapolated beyond this limit with some caution.The models include nonlinear site response effects and can be applied for sites with VS30
values from 150 to 1,200 m/s.A topic of considerable debate in the recent literature is the nature of the sigma model
to be used with GMPEs (Strasser et al. 2009; Al Atik et al. 2010). One pressing question iswhether aleatory variability of ground motions from small earthquakes is inherently largerthan that of ground motions from large events. For the development of this model we choseto assume a homoscedastic (magnitude-independent) sigma even though residual plots sug-gested that sigma could be lower for larger events. This decision was made since we donot feel that there are sufficient data from large earthquakes to obtain a robust estimate ofthe coefficients of a more sophisticated sigma model. In addition, although much effort hasbeen made in improving the metadata of our strong-motion database we feel that some ofthe apparent scatter in the residual plots for small earthquakes is coming from uncertaintiesin the independent parameters (e.g., Figure 4.13 of Moss 2009). There are, however, pos-sible mechanisms for magnitude-dependent sigma. Figures 2 and 3 of Douglas and Jousset(2011) suggest that variations in kappa, κ , (Anderson and Hough 1984) between sites couldbe partly responsible for short-period ground-motion variability increasing with decreasingmagnitude.
Although these new GMPEs are relatively complex compared to previous generations ofpan-European ground-motion models, they are still simple representations of very complexprocesses. The source characteristics of earthquakes are represented only by magnitude andstyle-of-faulting, and the predictions may well be biased if the dataset from which the equa-tions have been derived has not sampled, for example, the full range of stress drops fromearthquakes of a given magnitude and rupture mechanism in the region. Such considerationslead to recognition of epistemic uncertainty in the median ground-motion predictions, whichnecessitates the combination of several GMPEs within a logic-tree framework (Bommer et al.2005). The question that then immediately arises is: which other models should be combinedwith these GMPEs for PSHA in Europe and the Middle East?
These new equations supersede previous GMPEs derived for Europe and the MiddleEast, and address shortcomings identified in those models. Moreover, the formulation ofthe new equations covering broader ranges of response period, earthquake magnitude anddistance, means that the former equations are not compatible with the new models. ForPSHA studies in Europe and the Middle East, one option would be to construct logic-trees
123
Bull Earthquake Eng
by combining these new GMPEs with the Next Generation of Attenuation (NGA) modelsof Abrahamson and Silva (2008); Boore and Atkinson (2008); Campbell and Bozorgnia(2008), and Chiou and Youngs (2008). These NGA models are broadly consistent withthe new model in terms of parameterization, and it has been demonstrated that the NGAmodels are broadly applicable in Europe (Stafford et al. 2008), although Scasserra et al.(2009) and Akkar and Çagnan (2010) found some systematic differences between the NGApredictions and strong-motion data from Italy and Turkey, respectively. In addition to recom-mending the use of the NGA models, Bommer et al. (2010) identified the GMPEs of Zhaoet al. (2006), derived predominantly from Japanese data, as another candidate for selectionwithin PSHA for shallow crustal seismicity. Additional logic-tree branches could be popu-lated using local GMPEs, provided these were compatible in terms of parameter definitions.An alternative approach would be to use the new GMPEs as ‘backbones’ and create addi-tional logic-tree branches by scaling the median predictions up and down as appropriateto reflect possible differences in median stress drops, etc.. The scaling factors could alsobe distance-dependent if potential differences in attenuation needed to be captured as well.Such approaches are being used more and more widely in PSHA studies and this is likelyto become standard practice over the coming years (Bommer 2012). The construction of alogic-tree for ground-motion predictions by scaling a single backbone GMPE offers severaladvantages, including obviating the need for any adjustments for parameter compatibilityamong the equations and a more transparent relationship between branch weights and theresulting distributions of median ground-motion amplitudes. Another advantage, particularrelevant to PSHA for safety-critical facilities, is that it allows a wider range of epistemicuncertainty to be captured than that represented by simply assembling available models for aregion.
The database from which these new models have been derived is dominated by recordingsfrom Italy, Turkey and Greece, but we believe that the equations can be used with confidencefor crustal earthquakes in seismically active areas of southern Europe and the Middle East. Aquestion that arises, however, is whether these models will have applicability to more stableregions, such as northwest Europe? Although NW Europe may be considered to be a stableregion, this has not always led those conducting seismic hazard analyses to adopt GMPEs fromother stable continental regions such as Central and Eastern United States: for example, indeveloping hazard maps for the UK, Musson and Sargreant (2007) adopted one NGA equationand one of the predecessors of the model presented in this paper. Whether or not the newmodels may be applicable to any particular region could be explored using any available localrecordings and any one of the available methods for ranking GMPE performance (Scherbaumet al. 2004, 2009; Kale and Akkar 2013), although if only recordings from small-magnitudeearthquakes are available locally, the results of such procedures must be interpreted withcaution. Consideration should always be given to the application of the hybrid-empiricalapproach of Campbell (2003) to render the selected equations more applicable to the targetregion, as done, for example, by Douglas et al. (2006) for southern Norway and southernSpain. The key issue that must be borne in mind is that epistemic uncertainty in ground-motionprediction in such regions must, inevitably, be higher than in more active areas with moreabundant data and this should be reflected in the logic-trees developed for PSHA, whetherusing the ‘backbone’ approach discussed above and/or by combining adjusted empiricalmodels with local stochastic equations, such as Rietbrock et al. (2013) for the case of theUK, for example. The models presented here could be the last generation of pan-EuropeanGMPEs before the development of truly global ground-motion models for shallow crustalseismicity. This would require the development of a global database in the style of the NGAdatabase (Chiou et al. 2008) with consistent and reliable metadata for records from all regions.
123
Bull Earthquake Eng
To help in the correct implementation of our models, tables of coefficients and SDs areavailable as Electronic Supplements to this paper. In addition, we provide Excel and Matlabsubroutines to evaluate our models. Finally, tables of predicted median values and theirassociated SDs for various earthquake scenarios are available on request to check evaluationsof the models within quality assurance procedures (e.g., for nuclear power projects).
Acknowledgments The work presented in this article has been mainly developed within the SHARE (Seis-mic Hazard Harmonization in Europe) Project funded under contract 226967 of the EC-Research FrameworkProgramme FP7, and within the SeIsmic Ground Motion Assessment (SIGMA) project. We benefitted signif-icantly from the suggestions and comments of Dr. John Douglas, Professor Frank Scherbaum and ProfessorFabrice Cotton during early discussions regarding these new models, particularly within the context of theSHARE Project. We are very grateful to David M. Boore and an anonymous reviewer for constructive feedbackon the original version of this paper that assisted us in improving the final presentation of the new models.
References
Abrahamson NA, Silva W (2008) Summary of the Abrahamson and Silva NGA ground-motion relations.Earthq Spectra 24:67–97
Abrahamson NA, Youngs RR (1992) A stable algorithm for regression analyses using the random effectsmodel. Bull Seismol Soc Am 82:505–510
Akkar S, Bommer JJ (2006) Influence of long-period filter cut-off on elastic spectral displacements. EarthqEng Struct Dyn 35:1145–1165
Akkar S, Bommer JJ (2007a) Prediction of elastic displacement response spectra at multiple damping levelsin Europe and the Middle East. Earthq Eng Struct Dyn 36:1275–1301
Akkar S, Bommer JJ (2007b) Empirical prediction equations for peak ground velocity derived from strong-motions records from Europe and the Middle East. Bull Seismol Soc Am 97:511–530
Akkar S, Bommer JJ (2010) Empirical equations for the prediction of PGA, PGV and spectral accelerationsin Europe, the Mediterranean and the Middle East. Seismol Res Lett 81:195–206
Akkar S, Çagnan Z (2010) A local ground-motion predictive model for Turkey, and its comparison with otherregional and global ground-motion. Bull Seismol Soc Am 100:2978–2995
Akkar S, Kale Ö, Yenier E, Bommer JJ (2011) The high-frequency limit of usable response spectral ordinatesfrom filtered analogue and digital strong-motion accelerograms. Earthq Eng Struct Dyn 40:1387–1401
Akkar S, Sandıkkaya MA, Senyurt M, Azari SA, Ay BÖ (2013) Reference database for seismic ground-motionin Europe (RESORCE). Bull Earthq Eng (submitted to this issue)
Al Atik L, Abrahamson NA, Bommer JJ, Scherbaum F, Cotton F, Kuehn N (2010) The variability of ground-motion prediction models and its components. Seismol Res Lett 81:783–793
Ambraseys NN, Douglas J, Sarma SK, Smit PM (2005) Equations for the estimation of strong ground motionfrom shallow crustal earthquakes using data from Europe and the Middle East: horizontal peak groundacceleration and spectral acceleration. Bull Earthq Eng 3:1–53
Ambraseys NN, Simpson KA, Bommer JJ (1996) The prediction of horizontal response spectra in Europe.Earthq Eng Struct Dyn 25:371–400
Anderson JG, Hough SE (1984) A model for the shape of the Fourier amplitude spectrum of acceleration athigh frequencies. Bull Seismol Soc Am 74:1969–1993
Atkinson GM, Morrison M (2009) Observations on regional variability in ground-motion amplitude for small-to-moderate magnitude earthquakes in North America. Bull Seismol Soc Am 99:2393–2409
Berge-Thierry C, Cotton C, Scotti O, Griot-Pommera D-A, Fukushima Y (2003) New empirical attenuationlaws for moderate European earthquakes. J Earthq Eng 7:193–222
Bindi D, Luzi L, Massa M, Pacor F (2010) Horizontal and vertical ground motion prediction equations derivedfrom the Italian Accelerometric Archive (ITACA). Bull Earthq Eng 8:1209–1230
Bommer JJ (2012) The challenge of building logic trees for probabilistic seismic hazard analysis. EarthqSpectra 28:1723–1735
Bommer JJ, Akkar S (2012) Consistent source-to-site distance metrics in ground-motion prediction equationsand seismic source models for PSHA. Earthq Spectra 28:1–15
Bommer JJ, Akkar S, Kale Ö (2011) A model for vertical-to-horizontal response spectral ratios for Europeand the Middle East. Bull Seismol Soc Am 101:1783–1806
Bommer JJ, Akkar S, Drouet S (2012) Extending ground-motion prediction equations for spectral ordinatesto higher response frequencies. Bull Earthq Eng 10:379–399
123
Bull Earthquake Eng
Bommer JJ, Alarcón JE (2006) The prediction and use of peak ground velocity. J Earthq Eng 10:1–31Bommer JJ, Douglas J, Scherbaum F, Cotton F, Bungum H, Fäh D (2010b) On the selection of ground-motion
prediction equations for seismic hazard analysis. Seismol Res Lett 81:783–793Bommer JJ, Douglas J, Strasser FO (2003) Style-of-faulting in ground motion prediction equations. Bull
Earthq Eng 1:171–203Bommer JJ, Scherbaum F (2008) The use and misuse of logic-trees in PSHA. Earthq Spectra 24:997–1009Bommer JJ, Scherbaum F, Bungum H, Cotton F, Sabetta F, Abrahamson NA (2005) On the use of logic trees
for ground-motion prediction equations in seismic hazard assessment. Bull Seismol Soc Am 95:377–389Bommer JJ, Stafford PJ, Akkar S (2010a) Current empirical ground-motion prediction equations for Europe
and their application to Eurocode 8. Bull Earthq Eng 8:5–26Bommer JJ, Stafford PJ, Alarcón JE, Akkar S (2007) The influence of magnitude range on empirical ground-
motion prediction. Bull Seismol Soc Am 97:2152–2170Boore DM, Atkinson GM (2008) Ground-motion prediction equations for the average horizontal component
of PGA, PGV, and 5%-damped PSA at spectral periods between 0.1s and 10.0s. Earthq Spectra 24:99–138Bozorgnia Y, Abrahamson NA, Campbell KW, Rowshandel B, Shantz T (2012) NGAWest2: a comprehensive
research program to update ground motion prediction equations for shallow crustal earthquakes in activetectonic regions. In: Proceedings of 15th world conference on earthquake engineering paper number 2572,Lisbon, Portugal
Campbell KW (2003) Prediction of strong ground motion using the hybrid empirical method and its use inthe development of ground-motion (attenuation) relations in eastern North America. Bull Seismol Soc Am93:1012–1033
Campbell KW, Bozorgnia Y (2008) NGA ground motion model for the geometric mean horizontal componentof PGA, PGV, PGD and 5%-damped linear elastic response spectra at periods ranging from 0.1 s to 10.0s. Earthq Spectra 24:139–171
Cauzzi C, Faccioli E (2008) Broadband (0.05 to 20 s) prediction of displacement response spectra based onworldwide digital records. J Seismol 12:453–475
Comité Européen de Normalisation (CEN) (2004) Eurocode 8, design of structures for earthquake resistance–part 1: general rules, seismic actions and rules for buildings. European Standard NF EN 1998–1, Brussels
Chiou B, Darragh R, Gregor N, Silva W (2008) NGA project strong-motion database. Earthq Spectra 24:23–44Chiou BS-J, Youngs RR (2008) An NGA model for the average horizontal component of peak ground motion
and response spectra. Earthq Spectra 24:173–215Chiou B, Youngs R, Abrahamson N, Addo K (2010) Ground-motion attenuation model for small-to-moderate
shallow crustal earthquakes in California and its implications on regionalization of ground-motion predic-tion models. Earthq Spectra 26:907–926
Danciu L, Tselentis G-A (2007) Engineering ground-motion parameters attenuation relationships for Greece.Bull Seismol Soc Am 97:162–183
Douglas J (2003) Earthquake ground motion estimation using strong-motion records: a review of equationsfor the estimation of peak ground acceleration and response spectral ordinates. Earth Sci Rev 61:43–140
Douglas J (2011) Ground-motion prediction equations 1964–2010. Final report BRGM/RP-59356-FRDouglas J, Boore DM (2011) High-frequency filtering of strong-motion records. Bull Earthq Eng 9:395–409Douglas J, Bungum H, Scherbaum F (2006) Ground-motion prediction equations for southern Spain and
southern Norway obtained using the composite model perspective. J Earthq Eng 10(1):37–72Douglas J, Halldórsson B (2010) On the use of aftershocks when deriving ground-motion prediction equations.
In: Proceedings of the 9th U.S. national and 10th Canadian conference on earthquake engineering, paperno. 220
Douglas J, Jousset P (2011) Modeling the difference in ground-motion magnitude-scaling in small and largeearthquakes. Seismol Res Lett 82:504–508
Fukushima Y, Berge-Thierry C, Volant P, Griot-Pommera D-A, Cotton F (2003) Attenuation relation forWest Eurasia determined with recent near-fault records from California, Japan and Turkey. J Earthq Eng7:573–598
Joyner WB, Boore DM (1981) Peak horizontal acceleration and velocity from strong-motion records includingrecords from the 1979 Imperial Valley, California, earthquake. Bull Seismol Soc Am 71:2011–2038
Kagawa T, Irikura K, Somerville PG (2004) Differences in ground motion and fault rupture process betweenthe surface and buried rupture earthquakes. Earth Planets Space 56:3–14
Kaklamanos J, Baise LG, Boore DM (2011) Estimating unknown input parameters when implementing theNGA ground-motion prediction equations in engineering practice. Earthq Spectra 27:1219–1235
Kale Ö, Akkar S (2013) A new perspective for selecting and ranking ground-motion prediction equations(GMPEs): the euclidian distance-based ranking method. Bull Seismol Soc Am 103(2A):1069–1084
Mai MP, Spudich P, Boatwright J (2005) Hypcenter locations in finite-source rupture models. Bull SeismolSoc Am 95:965–980
123
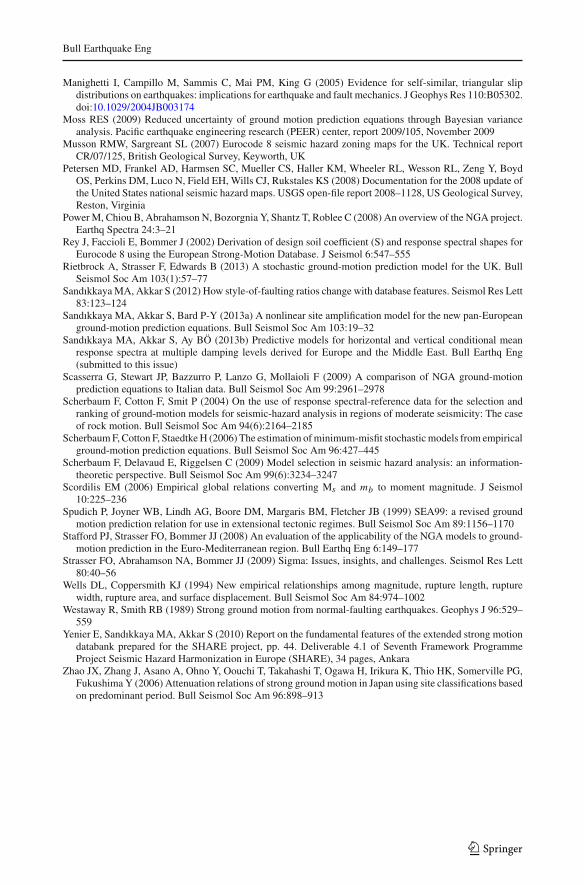
Bull Earthquake Eng
Manighetti I, Campillo M, Sammis C, Mai PM, King G (2005) Evidence for self-similar, triangular slipdistributions on earthquakes: implications for earthquake and fault mechanics. J Geophys Res 110:B05302.doi:10.1029/2004JB003174
Moss RES (2009) Reduced uncertainty of ground motion prediction equations through Bayesian varianceanalysis. Pacific earthquake engineering research (PEER) center, report 2009/105, November 2009
Musson RMW, Sargreant SL (2007) Eurocode 8 seismic hazard zoning maps for the UK. Technical reportCR/07/125, British Geological Survey, Keyworth, UK
Petersen MD, Frankel AD, Harmsen SC, Mueller CS, Haller KM, Wheeler RL, Wesson RL, Zeng Y, BoydOS, Perkins DM, Luco N, Field EH, Wills CJ, Rukstales KS (2008) Documentation for the 2008 update ofthe United States national seismic hazard maps. USGS open-file report 2008–1128, US Geological Survey,Reston, Virginia
Power M, Chiou B, Abrahamson N, Bozorgnia Y, Shantz T, Roblee C (2008) An overview of the NGA project.Earthq Spectra 24:3–21
Rey J, Faccioli E, Bommer J (2002) Derivation of design soil coefficient (S) and response spectral shapes forEurocode 8 using the European Strong-Motion Database. J Seismol 6:547–555
Rietbrock A, Strasser F, Edwards B (2013) A stochastic ground-motion prediction model for the UK. BullSeismol Soc Am 103(1):57–77
Sandıkkaya MA, Akkar S (2012) How style-of-faulting ratios change with database features. Seismol Res Lett83:123–124
Sandıkkaya MA, Akkar S, Bard P-Y (2013a) A nonlinear site amplification model for the new pan-Europeanground-motion prediction equations. Bull Seismol Soc Am 103:19–32
Sandıkkaya MA, Akkar S, Ay BÖ (2013b) Predictive models for horizontal and vertical conditional meanresponse spectra at multiple damping levels derived for Europe and the Middle East. Bull Earthq Eng(submitted to this issue)
Scasserra G, Stewart JP, Bazzurro P, Lanzo G, Mollaioli F (2009) A comparison of NGA ground-motionprediction equations to Italian data. Bull Seismol Soc Am 99:2961–2978
Scherbaum F, Cotton F, Smit P (2004) On the use of response spectral-reference data for the selection andranking of ground-motion models for seismic-hazard analysis in regions of moderate seismicity: The caseof rock motion. Bull Seismol Soc Am 94(6):2164–2185
Scherbaum F, Cotton F, Staedtke H (2006) The estimation of minimum-misfit stochastic models from empiricalground-motion prediction equations. Bull Seismol Soc Am 96:427–445
Scherbaum F, Delavaud E, Riggelsen C (2009) Model selection in seismic hazard analysis: an information-theoretic perspective. Bull Seismol Soc Am 99(6):3234–3247
Scordilis EM (2006) Empirical global relations converting Ms and mb to moment magnitude. J Seismol10:225–236
Spudich P, Joyner WB, Lindh AG, Boore DM, Margaris BM, Fletcher JB (1999) SEA99: a revised groundmotion prediction relation for use in extensional tectonic regimes. Bull Seismol Soc Am 89:1156–1170
Stafford PJ, Strasser FO, Bommer JJ (2008) An evaluation of the applicability of the NGA models to ground-motion prediction in the Euro-Mediterranean region. Bull Earthq Eng 6:149–177
Strasser FO, Abrahamson NA, Bommer JJ (2009) Sigma: Issues, insights, and challenges. Seismol Res Lett80:40–56
Wells DL, Coppersmith KJ (1994) New empirical relationships among magnitude, rupture length, rupturewidth, rupture area, and surface displacement. Bull Seismol Soc Am 84:974–1002
Westaway R, Smith RB (1989) Strong ground motion from normal-faulting earthquakes. Geophys J 96:529–559
Yenier E, Sandıkkaya MA, Akkar S (2010) Report on the fundamental features of the extended strong motiondatabank prepared for the SHARE project, pp. 44. Deliverable 4.1 of Seventh Framework ProgrammeProject Seismic Hazard Harmonization in Europe (SHARE), 34 pages, Ankara
Zhao JX, Zhang J, Asano A, Ohno Y, Oouchi T, Takahashi T, Ogawa H, Irikura K, Thio HK, Somerville PG,Fukushima Y (2006) Attenuation relations of strong ground motion in Japan using site classifications basedon predominant period. Bull Seismol Soc Am 96:898–913
123
Recommended