MINISTRY OF AGRICULTURE AND RURAL DEVELOPMENT
REGIONAL ENVIRONMENTAL ASSESSMENT REPORT
ON
MEKONG DELTA INTEGRATED CLIMATE RESILIENCE
AND SUSTAINABLE LIVELIHOODS PROJECT (MD-ICRSL)
Ha Noi – March 2016
SFG1760 REVP
ublic
Dis
clos
ure
Aut
horiz
edP
ublic
Dis
clos
ure
Aut
horiz
edP
ublic
Dis
clos
ure
Aut
horiz
edP
ublic
Dis
clos
ure
Aut
horiz
ed
ii
Mekong Delta Integrated Climate Resilience and
Sustainable Livelihoods Project
REGIONAL ENVIRONMENTAL ASSESSMENT
REPORT
iii
ABBREVIATIONS
ADB Asian Development Bank
BDP Basin Development Plan
CBA Cost-Benefit Analysis
CC Climate Change
CCVA Climate Change Vulnerability Assessment
CEA Cost-Effectiveness Analysis
CIEM Central Institute for Economic Management
CMIP Coupled Model Intercomparison Project
CSIRO Commonwealth Scientific and Industrial Research Organization
CTA Chief Technical Advisor
CTL Co-Team Leader
CTU Can Tho University
DARD Department of Agriculture and Rural Development
DEM Digital Elevation Model
DONRE Department of Natural Resources and Environment
DSF Decision Support Framework
DSS Decision Support System
EOC Environment Operations Centre (ADB)
ESA European Space Agency
GCM General Circulation Model
GIS Geographical Information Systems
GIZ German Development Corporation
GMS-SCC Greater Mekong Subregion Southern Coastal Corridor
GOV Government of Viet Nam
HCMC Ho Chi Minh City
ICEM International Centre for Environmental Management
ICMP Integrated Coastal Management Program
IFAD International Fund for Agricultural Development
IMHEN Institute of Meteorology, Hydrology and Environment
IPCC Intergovernmental Panel on Climate Change
IUCN International Union for the Conservation of Nature
IWRM Integrated Water Resource Management
KPI Key Performance Indicators
LMB Lower Mekong Basin
LXQ Long Xuyen Quadrangle
MARD Ministry of Agriculture and Rural Development
MD-ICRSL Mekong Delta Integrated Climate Resilience and Sustainable Livelihoods
MDI Mekong Delta Development Research Institute
MDP Mekong Delta Plan
MOC Ministry of Construction
MODIS Moderate Resolution Imaging Spectroradiometer
MONRE Ministry of Natural Resources and Environment
iv
MOT Ministry of Transport
MPI Ministry of Planning and Investment
MRC Mekong River Commission
RIF Regional Investment Framework
SCC Southern Coastal Corridor
SEA START Southeast Asia System for Analysis Research and Training
SIWRP Southern Institute for Water Resources Planning
SIWRR Southern Institute for Water Resources Research
SLR Sea Level Rise
SMCA Spatial Multi-criteria Analysis
Sub-NIAPP Sub-National Institute for Agricultural Planning and Protection in the South
SWAT Soil and Water Assessment Tool
SWSC Southwest Steering Committee
TA Technical Assistance
TWG Technical Working Group
UNDP United Nations Development Programme
USAID United States Agency for International Development
VCCI Vietnam Chamber of Commerce and Industry
VNMC Vietnam National Mekong Committee
WB World Bank
WISDOM Water Information System for Sustainable Development of Mekong Delta
v
TABLE OF CONTENTS
ABBREVIATIONS .................................................................................................................... III
LIST OF TABLES ...................................................................................................................... 9
LIST OF FIGURES .................................................................................................................. 10
EXECUTIVE SUMMARY ....................................................................................................... 13
1 THE MEKONG RIVER BASIN AND DELTA ..................................................................... 1 1.1 Introduction ..................................................................................................................... 1 1.2 REA objectives ..................................................................... Error! Bookmark not defined. 1.3 Mekong Delta Plan ........................................................................................................... 1 1.4 REA Methodology ........................................................................................................... 2 1.5 Overview of the Mekong Basin ......................................................................................... 3 1.5.1 Connectivity between the Mekong River Basin and the Delta ........................................... 7 1.5.2 Hydrological processes and sediment transport .............................................................. 9 1.6 Bio-physical description of the Mekong Delta .................................................................. 10 1.6.1 Soil and geology ......................................................................................................... 10 1.6.2 Climate ...................................................................................................................... 12 1.6.3 Water resources.......................................................................................................... 13
1.6.3.1 Flooding .................................................................................................................................... 13 1.6.3.2 Sediment transport .................................................................................................................... 13 1.6.3.3 Groundwater.............................................................................................................................. 14 1.6.3.4 Salinity intrusion ....................................................................................................................... 14 1.6.3.5 Water quality ............................................................................................................................. 15
1.6.4 Biodiversity and ecosystems ........................................................................................ 15 1.6.4.1 Wetlands.................................................................................................................................... 15 1.6.4.2 National Parks and Nature Reserves ......................................................................................... 16 1.6.4.3 Flora .......................................................................................................................................... 18 1.6.4.4 Fauna ......................................................................................................................................... 19 1.6.4.5 The coastal plume ..................................................................................................................... 19 1.6.4.6 Physical cultural resources ........................................................................................................ 19
1.7 Socio-economic description of the Mekong Delta ............................................................. 20 1.7.1 Demographics ............................................................................................................ 21
1.7.1.1 Population ................................................................................................................................. 21 1.7.1.2 Ethnic minorities ....................................................................................................................... 24
1.7.2 Livelihoods................................................................................................................. 24 1.7.2.1 Natural capital ........................................................................................................................... 25 1.7.2.2 Physical capital.......................................................................................................................... 25 1.7.2.3 Human capital ........................................................................................................................... 26 1.7.2.4 Financial capital ........................................................................................................................ 27 1.7.2.5 Social capital ............................................................................................................................. 28
1.7.3 Agricultural Sector ..................................................................................................... 28 1.7.3.1 Agriculture ................................................................................................................................ 28 1.7.3.2 Livestock ................................................................................................................................... 30 1.7.3.3 Aquaculture ............................................................................................................................... 30
1.7.4 Water resources management ...................................................................................... 31 1.7.4.1 Flood management and irrigation in the freshwater zone ......................................................... 31 1.7.4.2 Managing salinity in the coastal zone and estuaries ................................................................. 33 1.7.4.3 Safe water supply for domestic and industrial uses .................................................................. 35 1.7.4.4 Water resource management plans by the government............................................................. 36 1.7.4.5 Water supply plan for focal economic zones ............................................................................ 38
vi
2 CURRENT TRENDS AND CHALLENGES IN THE MEKONG DELTA ......................... 40 2.1 Environmental and Social Baseline trends for Upper delta floodplain (Component 2) ......... 43 2.1.1 Shrinking floodplains and exacerbated flood damages .................................................. 44 2.1.2 Acidification and surface water quality ........................................................................ 48 2.1.3 Higher inputs of agro-chemicals, reducing agricultural productivity .............................. 50 2.1.4 Rapid economic growth with a persistent poverty gap ................................................... 54 2.1.5 River bank erosion ...................................................................................................... 55 2.2 Environmental and Social Baseline trends for Delta Estuary (Component 3) ...................... 56 2.2.1 Salinization of the estuary ........................................................................................... 58 2.2.2 Estuary balance between saline and freshwater farming ................................................ 59 2.2.3 Dry season freshwater shortages and droughts ............................................................. 64 2.2.4 Land use changes from industrialization and urbanization ............................................ 65 2.2.5 Ethnic minorities and reduced farm-based income ........................................................ 66 2.3 Environmental and Social Baseline trends for Peninsula (Component 4) ............................ 67 2.3.1 Delta shrinking and land subsidence ............................................................................ 68 2.3.2 Deterioration of mangroves ......................................................................................... 74 2.3.3 Intensive shrimp farming ............................................................................................. 77 2.3.4 Natural resource dependency of the poor and landless .................................................. 81 2.3.5 Loss of peat soil environments ..................................................................................... 81
3 PROJECTED CHANGES IN THE MEKONG DELTA ..................................................... 84 3.1 External drivers of change .............................................................................................. 84 3.1.1 Hydropower development ............................................................................................ 85 3.1.2 Land use change and deforestation .............................................................................. 87 3.1.3 Climate change........................................................................................................... 88 3.1.4 Sea level rise and land subsidence ............................................................................... 89 3.2 Future Scenarios for 2050 ............................................................................................... 89 3.2.1 Baseline scenarios ...................................................................................................... 89 3.2.2 Future scenarios ......................................................................................................... 90 3.3 Regional threats to the Mekong Delta .............................................................................. 91 3.3.1 Temperature and rainfall ............................................................................................ 91 3.3.2 Flooding .................................................................................................................... 92 3.3.3 Saline intrusion .......................................................................................................... 96 3.3.4 Coastal erosion .......................................................................................................... 98 3.4 Regional threats in the hydro-ecological zones ............................................................... 100 3.4.1 Component 2: Upper delta floodplain ........................................................................ 101
3.4.1.1 Temperature and rainfall ......................................................................................................... 101 3.4.1.2 Flooding .................................................................................................................................. 103 3.4.1.3 Saline intrusion........................................................................................................................ 104
3.4.2 Component 3: Delta estuary ...................................................................................... 105 3.4.2.1 Temperature and rainfall ......................................................................................................... 105 3.4.2.2 Flooding .................................................................................................................................. 108 3.4.2.3 Saline intrusion........................................................................................................................ 110 3.4.2.4 Coastal erosion ........................................................................................................................ 110
3.4.3 Component 4: Delta peninsula................................................................................... 112 3.4.3.1 Temperature and rainfall ......................................................................................................... 112 3.4.3.2 Flooding .................................................................................................................................. 115 3.4.3.3 Saline intrusion........................................................................................................................ 117 3.4.3.4 Coastal erosion ........................................................................................................................ 118
4 LEGAL AND INSTITUTIONAL ASSESSMENT ............................................................ 121 4.1 Projected climate change impacts in Vietnam ................................................................. 121 4.1.1 Social aspects of climate change ................................................................................ 121 4.2 Governance arrangements for responding to climate change ............................................ 122
vii
4.2.1 National Target Programme to Respond To Climate Change (NTPRCC)...................... 122 4.2.2 Climate change adaptation ........................................................................................ 123 4.2.3 Implementation of climate change program ................................................................ 123 4.2.4 Regional coordination of LMB countries .................................................................... 124 4.3 Results of CC adaptation action plan in Vietnam ............................................................ 124 4.3.1 Natural resources and environment............................................................................ 124 4.3.2 Agricultural sector .................................................................................................... 124 4.3.3 Land use planning .................................................................................................... 125 4.3.4 Agricultural Restructuring Plan ................................................................................. 125 4.3.5 Forestry sector ......................................................................................................... 125 4.3.6 Carbon market ......................................................................................................... 126 4.3.7 Construction sector ................................................................................................... 126 4.3.8 Transport and energy sectors .................................................................................... 126 4.4 Disaster risk management ............................................................................................. 126 4.4.1 Integrated Water Resources Management (IWRM) in the LMB .................................... 128 4.5 International support..................................................................................................... 128 4.5.1 Program SP-RCC ..................................................................................................... 128 4.6 Legal and institutional policy on environmental management .......................................... 129 4.6.1 Vietnam's Environmental and Social Safeguards Policies and Legislations ................... 129 4.6.2 Application of World Bank Safeguard Policies............................................................ 130
4.6.2.1 IFC Environmental, Health and Safety Guidelines ................................................................. 130 4.6.2.2 World Bank Policy on Access to Information ........................................................................ 131
4.6.3 Capacity in government environmental organizations ................................................. 131 4.6.4 Improving environmental management in the Mekong Delta ...................................... 131
5 STRATEGIES FOR BUILDING RESILIENCE IN THE MEKONG DELTA ................. 133 5.1 Component 1: Investments Enhancing Monitoring, Analytics and Information Systems .... 133 5.1.1 Integrating with on-going assessments in the Mekong Delta ........................................ 136 5.1.2 Summary of trends, challenges and regional changes for Components 2, 3 and 4 .......... 137 5.2 Component 2: Upper delta floodplain ............................................................................ 140 5.3 Component 3: Delta estuary .......................................................................................... 142 5.4 Component 4: Delta peninsula....................................................................................... 144
6 ASSESSING PROJECT-FINANCED REGIONAL IMPACTS ........................................ 147 6.1 Environmental assessment ............................................................................................ 147 6.1.1 Sub projects under Component 2, 3 and 4................................................................... 147
6.1.1.1 Component 2 (Upper Delta) .................................................................................................... 147 6.1.1.2 Subprojects in Component 3 (Delta Estuary) .......................................................................... 147 6.1.1.3 Subprojects in Component 4 (Delta Peninsula) ...................................................................... 148
6.2 Assessing the regional impacts ...................................................................................... 148 6.3 Regional impact evaluation methodology....................................................................... 149 6.3.1 Regional impacts of Components 2, 3 and 4................................................................ 150
6.3.1.1 Impacts of upgrading and constructing new infrastructure ..................................................... 150 6.3.1.2 Impacts of dredging................................................................................................................. 151 6.3.1.3 Impacts of installing water/flood control structures in the upper delta ................................... 151 6.3.1.4 Impacts of new livelihood models in the upper delta ............................................................. 152 6.3.1.5 Impacts of installing water/salinity control structures in the estuary and peninsula ............... 153 6.3.1.6 Impacts of new livelihood models in the estuary and peninsula ............................................. 153 6.3.1.7 Expanding aquaculture and shrimp farming ........................................................................... 154 6.3.1.8 Impacts of protecting mangrove forests in coastal areas ........................................................ 155 6.3.1.9 Impacts of building reservoir for freshwater storage .............................................................. 155 6.3.1.10 Utilizing enhanced information systems to monitor regional impacts .................................. 156
6.4 Summary of regional impacts ........................................................................................ 161 6.5 Public consultation on REA .......................................................................................... 162
viii
6.5.1 Upper Delta ............................................................................................................. 162 6.5.2 Delta Estuary ........................................................................................................... 162 6.5.3 Peninsula ................................................................................................................. 162 6.6 Linkages with other World Bank projects in the Mekong Delta ....................................... 163 6.7 Recommendations: ....................................................................................................... 164
7 BUILDING ADAPTIVE MANAGEMENT CAPACITY IN THE MEKONG DELTA ..... 166 7.1 Introduction ................................................................................................................. 166 7.2 Sub-component 1.1. Upgrading Monitoring Infrastructure to Enhance Mekong Delta
Knowledge Base (US$ 33.7 Million) ...................................................................................... 166 7.2.1 Upgrading MONRE’s Surface Water Quality Monitoring Network (US$ 9.5 million) .... 167 7.2.2 Upgrading MONRE’s Groundwater Monitoring Network (US$ 10.0 million)................ 167 7.2.3 Upgrading of MONRE’s Remote Sensing Infrastructure and Associated Studies (US$ 11.0 million) 167 7.2.4 Upgrading MARD’s Water Resource Monitoring Systems (US$ 3.2 million) ................. 167 7.3 Subcomponent 1.2. Infrastructure and Information Systems for Enhanced Decisions (US$
13.8 million) ......................................................................................................................... 168 7.3.1 Mekong Delta Center for Climate Resilience (US$ 12.0 million) .................................. 168 7.3.2 Constructing and Equipping the Mekong Delta Center (US$ 5 million) ........................ 168 7.3.3 Formulation of Mekong Delta Climate Resiliency Assessment (US$ 3.5 million) ........... 168 7.3.4 Development of Databases and Models for the Mekong Delta Center (US$ 3.5 million) 169 7.3.5 Vietnam National Mekong Committee (VNMC) Mekong Basin Databases and Models (US$
1.8 million) 169 7.4 Alternatives Considered under Component 1 .................................................................. 170 7.5 Assessing Environmental Impacts of Component 1 ......................................................... 170 7.6 Mekong Delta Climate Resiliency Assessment ............................................................... 171
8 REFERENCES ................................................................................................................. 172
ANNEX 1- PROPOSED SUBPROJECTS FOR COMPONENTS 2, 3 & 4.............................. 176
ANNEX 2- VIETNAMESE ENVIRONMENTAL STANDARDS ........................................... 177
9
LIST OF TABLES
Table 1: Summary of MDP priority and "no regret" measures .......................................................... 1 Table 2: National parks and nature reserves in the Mekong Delta ................................................... 17 Table 3: Species and Landscape Reserves and Landscape Protected Areas in the Mekong Delta ...... 17 Table 4: Physical cultural resources in the Mekong Delta .............................................................. 20 Table 5: Summary of national plans, benefits and impacts ............................................................. 37 Table 6: Hydro-ecological zones and focal provinces .................................................................... 41 Table 7: Water-related problems and solutions in Soc Trang province Source: Nhan et al. 2013....... 66 Table 8: Key actors in the Mekong Delta.................................................................................... 134 Table 9: Vietnamese Strategies and Master Plan for the Mekong Delta......................................... 135 Table 10: Agriculture and water management investments in An Giang, Ca Mau, Ben Tre & Soc Trang
................................................................................................................................................ 135 Table 11: Challenges, solution and key trade-offs for upper delta floodplain ................................. 142 Table 12: Challenges, solutions and key-trade-offs for the delta estuary ....................................... 143 Table 13: Challenges, solutions and key trade-offs for the delta peninsula .................................... 145 Table 14: Regional impact evaluation criteria ............................................................................. 149 Table 15: Summary of regional impacts for Components 2, 3 & 4................................................ 157 Table 16: Ongoing World Bank projects relevant to the MD-ICRSL project ................................. 163 Table 17: New institutions, planning and analytics and enhanced monitoring in the Mekong Delta 166 Table 18: Summary of costs and activities for Component 1 ........................................................ 170 Table 19: Summary of potential environmental impacts of general interventions under Component 1.
................................................................................................................................................ 171
10
LIST OF FIGURES
Figure 1: Upper and Lower Basin .................................................................................................. 4 Figure 2: Eco-regions in the Mekong River Basin ........................................................................... 5 Figure 3: Hydropower development in the Upper and Lower Mekong Basin..................................... 6 Figure 4: Changes in forest cover 1975-2010 .................................................................................. 7 Figure 5: Tonle Sap and Mekong Delta .......................................................................................... 8 Figure 6: Tonle Sap lake in the wet and dry season ....................................................................... 10 Figure 7: Elevation in the Mekong Delta ...................................................................................... 11 Figure 8: Soil types in the Mekong Delta...................................................................................... 12 Figure 9: Wetland types in the Mekong Delta ............................................................................... 16 Figure 10: Mekong Delta protected areas ..................................................................................... 18 Figure 11: Urban and rural population in the Mekong Delta........................................................... 21 Figure 12: Population density in the Mekong Delta 2000 ............................................................... 22 Figure 13: Poverty rates in the Mekong Delta compared to National average .................................. 23 Figure 14: Poverty rates in the Mekong Delta in 1999 and 2009..................................................... 23 Figure 15: Ethnic groups in the Mekong Delta .............................................................................. 24 Figure 16: Farming areas in the Mekong Delta ............................................................................. 25 Figure 17: Labor force structure in the Mekong Delta ................................................................... 26 Figure 18: Labor force qualification in the Mekong Delta a) Overall b) Agricultural sector.............. 27 Figure 19: Trends of agriculture (rice, fruit, vegetables) from 1990-2012. ...................................... 29 Figure 20: Rice area by crop in the Mekong Delta from 2000-2013 ................................................ 29 Figure 21: Rice production by crop in the Mekong Delta from 2000-2013 ...................................... 30 Figure 22: Trends of livestock (pig, poultry, cattle) from 1990-2012. ............................................. 30 Figure 23: Trends of aquaculture from 1990-2013 ........................................................................ 31 Figure 24: Mekong Delta Flood Control and Irrigation Infrastructure ............................................. 32 Figure 25: Predicted safe water requirement of domestic and industrial uses of the focal economic zones
of the Mekong Delta ................................................................................................................... 36 Figure 26: Location of proposed water treatment plants in the Mekong Delta................................. 38 Figure 27: Hydro-ecological zones and focal provinces ................................................................. 42 Figure 28: Agricultural land use in An Giang and Dong Thap ........................................................ 43 Figure 29: Land use types in the upper delta floodplain ................................................................. 44 Figure 30: Flood control and water infrastructure in the upper delta floodplain ............................... 45 Figure 31: Flooded areas in the October 2000 and 2011 ................................................................ 47 Figure 32: Area of acid sulfate and alluvial soil in the upper delta floodplain .................................. 49 Figure 33: Trends of rice growing areas in An Giang .................................................................... 51 Figure 34: Trends of the autumn-winter crop areas by district in An Giang ..................................... 51 Figure 35: Trends of paddy yields by crop in An Giang ................................................................. 51 Figure 36: Trends of rice growing areas by crop in Dong Thap ...................................................... 52 Figure 37: Trends of paddy yields by crop in Dong Thap............................................................... 52 Figure 38: Trends of fertilizer application rates (N, P & K), total yield and BCR ............................ 53 Figure 39: Trends of vegetable production area in An Giang and Dong Thap .................................. 54 Figure 40: Trends of aquaculture production in An Giang and Dong Thap ...................................... 54 Figure 41: Trends of poverty rates of An Giang, Dong Thap and Mekong Delta from 2006-2013..... 55 Figure 42: Agricultural land use in Ben Tre & Tra Vinh ................................................................ 57 Figure 43: Agricultural land use in the delta estuary ...................................................................... 57 Figure 44: Duration of salinity intrusion (>4g/L) in delta estuary ................................................... 58 Figure 45: Existing water infrastructure in the delta estuary ........................................................... 59 Figure 46: Areas of brackish and freshwater farming in delta estuary ............................................. 60 Figure 47: Paddy yields by crop in Ben Tre, Tra Vinh & Soc Trang provinces ................................ 61 Figure 48: Aquaculture area and production in Ben Tre, Tra Vinh & Song Trang ............................ 62

11
Figure 49: Trends of farming area of high-value fruit crops in Ben Tre, Tra Vinh & Soc Trang........ 63 Figure 50: Increasing trends of coconut growing area in Ben Tre province 2005-12 ........................ 64 Figure 51: Maximum rate of aquifer drawdown (cm/year) in delta estuary...................................... 65 Figure 52: Agricultural land use in Ca Mau & Bac Lieu provinces ................................................. 68 Figure 53: Land use types in delta peninsula ................................................................................. 68 Figure 54: Net erosion and accretion rates in the East Sea ............................................................. 69 Figure 55: Coastal erosion and deposition in Ca Mau - Bac Lieu.................................................... 70 Figure 56: Coastal erosion and deposition in the Ca Mau peninsula ................................................ 71 Figure 57: Coastal erosion and deposition in delta peninsula .......................................................... 72 Figure 58: Maximum rate of aquifer drawdown (cm/year) in delta peninsula .................................. 73 Figure 59: Subsidence rate (cm/year) in the delta peninsula ........................................................... 74 Figure 60: Wetland types in delta peninsula .................................................................................. 75 Figure 61: Mangroves and coastline change in Ca Mau peninsula .................................................. 76 Figure 62: Aquaculture area and production in Bac Lieu and Ca Mau provinces ............................. 78 Figure 63: Areas of brackish and freshwater farming in delta peninsula .......................................... 78 Figure 64: Shrimp farming areas in Ca Mau & Bac Lieu ............................................................... 79 Figure 65: Existing water infrastructure in the delta peninsula ....................................................... 80 Figure 66: The proportion of in -migration and out-migration in Bac Lieu & Ca Mau provinces ...... 81 Figure 67: U Minh Ha & U Minh Thuong National Parks .............................................................. 82 Figure 68: Upstream hydropower development in the Mekong Basin ............................................. 85 Figure 69: Forest cover change in the Mekong Basin from 1975-2010............................................ 88 Figure 70: Changes in precipitation in Wet Season (%) ................................................................. 92 Figure 71: Change in percentage of provincial area flooded (%) .................................................... 93 Figure 72: Increase in maximum flood depth (m) .......................................................................... 94 Figure 73: Flood depth in meters ................................................................................................. 95 Figure 74: Day of flooding per year in the Mekong 2050 ............................................................... 96 Figure 75: Increase in provincial area experiencing salinity intrusion ............................................. 97 Figure 76: Increase in number of days with salinity at higher than 4g/L .......................................... 98 Figure 77: Rates of coastal erosion in the East Sea ........................................................................ 99 Figure 78: Increasing erosion rate/year ....................................................................................... 100 Figure 79: Changes in average maximum temperature in the dry season in upper delta floodplain .. 101 Figure 80: Changes in dry season rainfall in the upper delta floodplain......................................... 102 Figure 81: Changes in wet season rainfall in the upper delta floodplain ........................................ 102 Figure 82: Changes in maximum flood depth under extreme high condition in upper delta floodplain
................................................................................................................................................ 103 Figure 83: Flood duration (>1m)- Extreme High Condition in the Upper Delta Floodplains ........... 104 Figure 84: Changing maximum salinity concentration under future worst case in the Upper Delta
Floodplain ................................................................................................................................ 105 Figure 85: Changes in average maximum temperature in the dry season ....................................... 106 Figure 86: Changes in average maximum temperate in wet season for delta estuary ...................... 106 Figure 87: Changes in dry season rainfall in the delta estuary ...................................................... 107 Figure 88: Changes in wet season rainfall in the delta estuary ...................................................... 108 Figure 89: Changes in maximum flood depth under extreme high conditions in delta estuary......... 109 Figure 90: Changes in flood duration (<1m) under extreme high conditions in delta estuary .......... 109 Figure 91: Changes in salinity duration (>4g/L) under future worst-case scenario in the delta estuary
................................................................................................................................................ 110 Figure 92: Changes in coastal erosion and deposition in Ben Tre province.................................... 111 Figure 93: Changes in coastal erosion and deposition in Tra Vinh province .................................. 111 Figure 94: Changes in dry season average maximum temperatures ............................................... 112 Figure 95: Changes in wet season average maximum temperatures for delta peninsula .................. 113 Figure 96: Changes in dry season rainfall in the delta peninsula ................................................... 114 Figure 97: Changes in wet season rainfall in the delta peninsula................................................... 115
12
Figure 98: Changes in maximum flood depth under extreme high conditions for delta peninsula .... 116 Figure 99: Changes in flood duration (>1m) under extreme high conditions for delta peninsula ..... 116 Figure 100: Changes in maximum salinity concentration under future worst-case scenario for the delta
peninsula.................................................................................................................................. 117 Figure 101: Changes under salinity duration (4g/L) under future worst-case scenario in the delta
peninsula.................................................................................................................................. 118 Figure 102: Changes in coastal erosion in Bac Lieu and Soc Trang .............................................. 119 Figure 103: Changes in coastal erosion in Ca Mau and Bac Lieu .................................................. 120 Figure 104: DRM structure in Vietnam ...................................................................................... 127 Figure 105: Summary of trends and challenges in the hydro-ecological zones ............................... 138 Figure 106: External drives of change in the Mekong Delta ......................................................... 139 Figure 107: External drives and regional changes in the Mekong Delta ........................................ 140 Figure 108: Key components for building resilience in the upper delta floodplain ......................... 141 Figure 109: Inundated rice paddies in the wet season offer controlled retention of river floods after two
crops........................................................................................................................................ 141 Figure 110: Controlled flooding in the upper delta floodplain, using the inundate paddies for fish
farming in wet season of "floating vegetables” offering an attractive economic proposition ........... 142 Figure 111: Key components for building resilience in the delta estuary ....................................... 143 Figure 112: Key components for building resilience in the delta peninsula ................................... 145 Figure 113: Mangrove restoration and three step shrimp farming ................................................. 146

13
EX ECUTIVE SUMM ARY
1. This Regional Environmental Assessment (REA) supports the development of the ‘Mekong Delta Integrated Climate Resilience and Sustainable Livelihood (MD-ICRSL)’ project. The
PDO is to enhance tools for climate-smart planning, and improve climate resilience of land and
water management practices in selected provinces of the Mekong Delta in Vietnam. The objective would be achieved through the provision of capital investments, technical assistance
and capacity building for farmers in the selected provinces of the Mekong Delta in Vietnam and government institutions at national and sub-national levels.
The Project activities will be implemented through five components:
Component 1: Enhancing Monitoring, Analytics, and Information Systems
Component 2: Managing Floods in the Upper Delta
Component 3: Adapting to Salinity Transitions in the Delta Estuary
Component 4: Protecting Coastal Areas in the Delta Peninsula
Component 5: Project Management and Implementation Support
The Mekong Delta Plan (MDP) 2013 presents a long‐ term vision on the safe, prosperous and sustainable development of the Delta region and is the foundation for the MD-ICRSL project.
This REA builds upon and expands the analysis in the MDP by providing a more
comprehensive presentation of existing information, utilizes climate scenario modelling, and describes in more detail the strategies in the three hydro-ecological zones included in this
project. The key objectives of this REA are to:
provide a comprehensive environmental and socio-economic baseline of the Mekong
Delta;
present the existing trends and challenges in the upper delta, delta estuary and delta
peninsula;
analyze the regional changes from hydropower development, land use change, sea level
rise and climate change and recommend strategies for building resilience; and
assess the regional project-financed impacts and recommend investments for building adaptive capacity in the Mekong Delta.
The existing trend and challenges and future scenarios used in this REA were developed from
the “no-regret” and priority measures set out in the MDP and comprises the following sections: 1. The Mekong River Basin and Delta;
2. Current challenges in the Mekong Delta; 3. Regional changes in the Mekong Delta;
4. Legal and Institutional assessment;
5. Strategies for Building Resilience in the Mekong Delta; 6. Assessing Regional Project-Financed Impacts; and
7. Building Adaptive Management Capacity in the Mekong Delta

14
The Mekong River Basin and Delta
The development success of the delta can be attributed to two important factors. First the natural supply of freshwater and nutrient-laden sediments by the Mekong River annually
transforms the delta providing the vital ingredients for productivity. On average some 50-160 million tons of sediment are transported downstream with the floods into the Mekong Delta of
Vietnam with approximately 15-20% deposited on the delta’s floodplains and the remainder
transported into the marine environment contributing to important delta building processes (ICEM 2012). The large range in variability of sediment transport reflects the uncertainty
regarding the amount of sediment trapped behind existing dams in the Upper Mekong and tributaries (Koehnken et al. 2012; Lu et al. 2014). Second the Government of Vietnam has
since the late 1960s supported ambitious master planning efforts with the guiding mandate
being the control of the delta’s freshwater hydrology to enable multiple rice crops each year (Kakkonen et al, 2008).
Rapid population growth and intensive agricultural and aquaculture development over the past decades have significantly reduced the natural values in the delta. Progressive
land and water reclamation, agricultural intensification, as well negative ecological impacts of
warfare, have significantly reduced the natural forests, wetlands and other natural habitats of the delta. Many wetlands such as mangroves, ponds, lakes, lagoons and wet grasslands are
threatened by extinction through the concessions for irrigation, forest plantations, salt ponds, and industrial development zones and shrimp farms (MDP 2013).
After decades, multi-cropping farming systems are dropping in productivity, flood plains are
shrinking exacerbating flood risks elsewhere, wetland habitats are being degraded causing water quality issues while water over-exploitation is shifting the balance between land and sea,
subsiding the delta surface and causing salinization of remaining sources (ICEM 2015). Five key lessons from the Mekong Delta are:
1. Highly controlled multi-crop farming systems have depleted soil fertility and cut
off agricultural areas from natural fertilization processes of the Mekong River: The widespread isolation of the Mekong’s freshwater flood plain from fluvial processes
to open up opportunities for triple and double crop rice farming has resulted in reduced fertility and reduced productivity of triple cropped areas. In An Giang province total
yield from some triple cropped areas are actually lower than yield from neighboring
double- crop areas which are still partially connected to the annual flood cycles (Kakkonen et al, 2008);
2. The Shrinking Mekong Floodplain area has exacerbated flooding in unprotected areas: the loss of floodplain has increased flood levels in the remaining unprotected
areas and concentrated flood discharge in the Mekong River channels and distributaries.
Worsened flood conditions have also lead to transboundary issues between Viet Nam and Cambodia, and channelized flood flows have led to increasing issues of river bank
and coastal erosion (ICEM, 2012);
3. Draining of wetland depressions in the delta for agricultural expansion have led to
increasing acidification of surface water environments with knock-on effects for
ecosystems (especially fisheries) and water supply. Lack of wastewater treatment and use of agro-chemicals has also reduced surface water quality. Deterioration of these
provisioning services have disproportionately impacted poor communities of the Delta who rely on these services for their livelihood;

15
4. Dry season agriculture is shifting the delta’s balance between fresh and marine
environments: The MDP highlighted that increased water demand to support dry season agriculture has depleted groundwater sources, strengthened the penetration of
saline intrusion, increasing the salinity of water sources and accelerating rates of land subsidence in the Delta; and
5. Centralized water control initiatives such as the saline control structures in the
coastal areas of the delta often limit the livelihood and economic opportunities for farmers seeking to take advantage of market driven opportunities: the market
driven conflict between shrimp and rice farming in the early 2000s revealed the inflexibility and low levels of adaptive capacity of a infrastructure-driven approach to
controlling the delta environment and conflict between government targets for rice
production and individual farmers wanting to optimize the economic returns for their farming effort.
Many of the lessons above are Delta-wide, cut across provincial and administrative boundaries and require both structural and non-structural measures to meet these challenges; however,
these trends and challenges vary according to the hydro-ecological zones.
Current challenges in the Mekong Delta
For further analysis the delta is divided into four hydro-ecological zones based on the balance
between coastal and upstream hydrological influences:
1. Upper Delta floodplain (Component 2): Northern, upper delta floodplain comprising
the alluvial terraces, riverine levies and wetland depressions of Kien Giang, An Giang,
Dong Thap, and Long An provinces. The upper delta floodplain is dominated by freshwater inputs from the Mekong basin and overbank flooding of the Tien and Hau
river channels. During the wet season, flood water levels regularly exceed 2.0 meters;
2. Middle delta: includes the alluvial floodplains and urban areas of Can Tho, Hau Giang,
Vinh Long and Tien Giang provinces and is characterized by industrialization, land use
changes and limited urban water supply and wastewater services;
3. Delta estuary (Component 3): comprising the estuary areas of Vinh Long, Tra Vinh,
Soc Trang and Ben Tre. The inter-tidal zone is under the mixed influence of upstream hydrology as well as coastal processes such as tidally-induced saline intrusion and
channel-flow reversal. In the delta estuary under mixed coastal and freshwater
influence, rice is still an important crop accounting for 30% of provincial area, with brackish aquaculture accounting for a further 11%; and
4. Delta peninsula (Component 4): Eastern and southern regions of the Delta, where coastal processes dominate local hydrology and local rainfall is the main freshwater
input. On the delta peninsula dominated by coastal influences and limited freshwater
inputs, brackish aquaculture is the dominant land use accounting for 41% of the provincial area.
The MD-ICRSL focuses on investments in the delta estuary provinces of Soc Trang, Ben Tre and Tra Vinh and does not include the middle delta. However, the subprojects to be
implemented in the upper delta (Component 2) are expected to reduce flood risks in the middle
delta and the enhanced monitoring, analytics and information systems developed under Component 1 will support sustainable management and planning at the regional level. A
summary of the hydro-ecological zones used in the MD-ICRSL project is provided below.
16
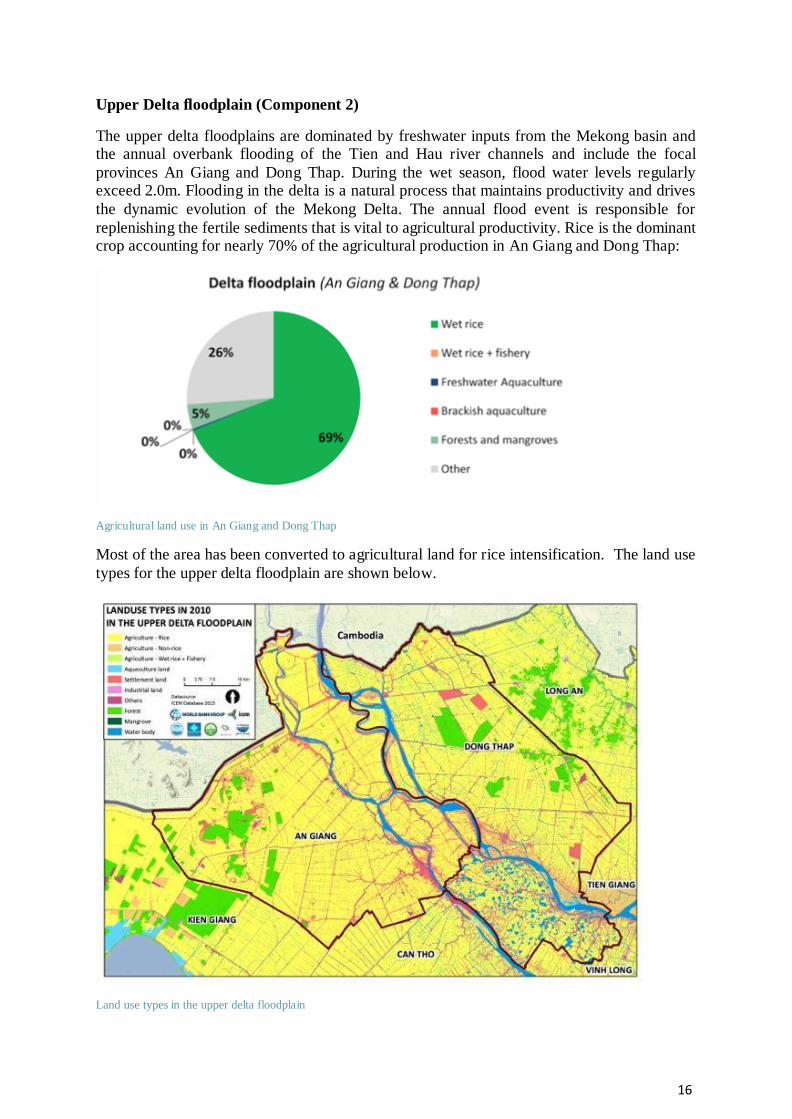
Upper Delta floodplain (Component 2)
The upper delta floodplains are dominated by freshwater inputs from the Mekong basin and the annual overbank flooding of the Tien and Hau river channels and include the focal
provinces An Giang and Dong Thap. During the wet season, flood water levels regularly exceed 2.0m. Flooding in the delta is a natural process that maintains productivity and drives
the dynamic evolution of the Mekong Delta. The annual flood event is responsible for
replenishing the fertile sediments that is vital to agricultural productivity. Rice is the dominant crop accounting for nearly 70% of the agricultural production in An Giang and Dong Thap:
Agricultural land use in An Giang and Dong Thap
Most of the area has been converted to agricultural land for rice intensification. The land use
types for the upper delta floodplain are shown below.
Land use types in the upper delta floodplain

17
Climate change is expected to bring higher and more pronounced season flood regimes, the
key challenges are to retain the natural flood based agriculture and protect downstream provinces from flooding.
Delta estuary (Component 3)
The delta estuary is under the mixed influence of upstream hydrology as well as coastal
processes such as tidally-induced saline intrusion and channel-flow reversal. In the delta
estuary under mixed coastal and freshwater influence, rice is still an important crop accounting for 30% of provincial area, with brackish aquaculture accounting for a further 11%.
Agricultural land use in Ben Tre & Tra Vinh
As indicated in the Mekong Delta Plan, rapid population growth and intensive agricultural and aquaculture development over the past decades have significantly reduced the natural values
in the delta estuary. The land use and existing water infrastructure in the delta estuary are shown
below.
Agricultural land use in the delta estuary

18
Salinity intrusion into the delta estuary is reducing agricultural productivity and leading
to dry season freshwater shortages. Tidal fluctuations drive saline intrusion more than 80km inland, affecting 40% of the Mekong Delta (SIWRR, 2010). Seven provinces are highly prone
to saline intrusion, including: Kien Giang, Tra Vinh, Ben Tre, Soc Trang, Ca Mau, Bac Lieu and Long An, with more than 1 million hectares experiencing salinity concentrations above
4g/L is shown below.
Duration of salinity intrusion in the Delta Estuary
Delta Peninsula (Component 4)
On the delta peninsula dominated by coastal influences and limited freshwater inputs, brackish aquaculture is the dominant land use accounting for 41% of the provincial area.
Agricultural land use in Ca Mau & Bac Lieu provinces
19
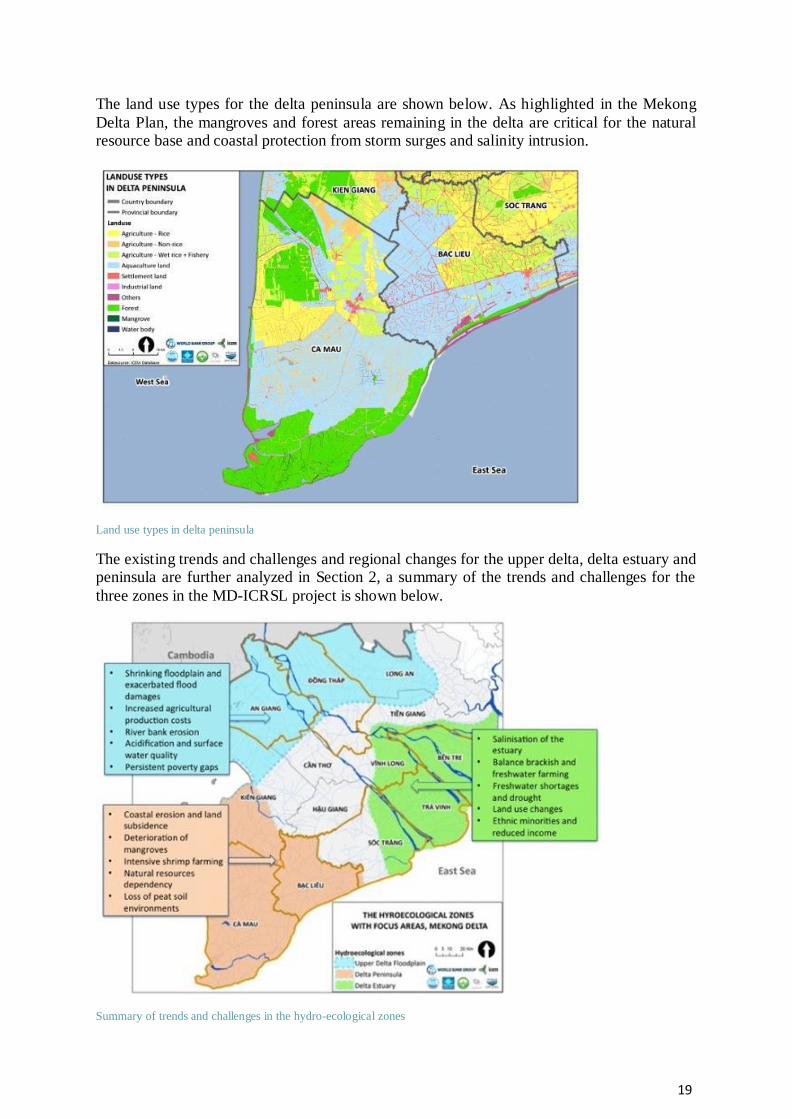
The land use types for the delta peninsula are shown below. As highlighted in the Mekong
Delta Plan, the mangroves and forest areas remaining in the delta are critical for the natural resource base and coastal protection from storm surges and salinity intrusion.
Land use types in delta peninsula
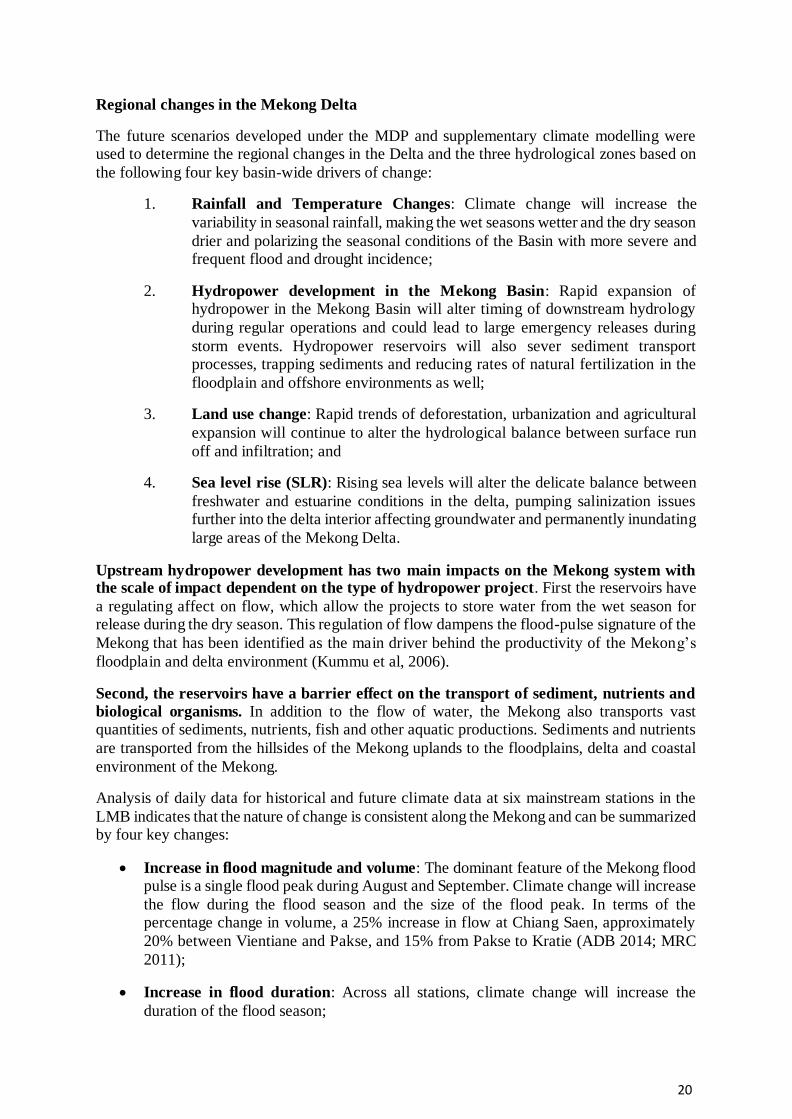
The existing trends and challenges and regional changes for the upper delta, delta estuary and peninsula are further analyzed in Section 2, a summary of the trends and challenges for the
three zones in the MD-ICRSL project is shown below.
Summary of trends and challenges in the hydro-ecological zones
20
Regional changes in the Mekong Delta
The future scenarios developed under the MDP and supplementary climate modelling were used to determine the regional changes in the Delta and the three hydrological zones based on
the following four key basin-wide drivers of change:
1. Rainfall and Temperature Changes: Climate change will increase the
variability in seasonal rainfall, making the wet seasons wetter and the dry season
drier and polarizing the seasonal conditions of the Basin with more severe and frequent flood and drought incidence;
2. Hydropower development in the Mekong Basin: Rapid expansion of hydropower in the Mekong Basin will alter timing of downstream hydrology
during regular operations and could lead to large emergency releases during
storm events. Hydropower reservoirs will also sever sediment transport processes, trapping sediments and reducing rates of natural fertilization in the
floodplain and offshore environments as well;
3. Land use change: Rapid trends of deforestation, urbanization and agricultural
expansion will continue to alter the hydrological balance between surface run
off and infiltration; and
4. Sea level rise (SLR): Rising sea levels will alter the delicate balance between
freshwater and estuarine conditions in the delta, pumping salinization issues further into the delta interior affecting groundwater and permanently inundating
large areas of the Mekong Delta.
Upstream hydropower development has two main impacts on the Mekong system with the scale of impact dependent on the type of hydropower project. First the reservoirs have
a regulating affect on flow, which allow the projects to store water from the wet season for release during the dry season. This regulation of flow dampens the flood-pulse signature of the
Mekong that has been identified as the main driver behind the productivity of the Mekong’s
floodplain and delta environment (Kummu et al, 2006).
Second, the reservoirs have a barrier effect on the transport of sediment, nutrients and
biological organisms. In addition to the flow of water, the Mekong also transports vast quantities of sediments, nutrients, fish and other aquatic productions. Sediments and nutrients
are transported from the hillsides of the Mekong uplands to the floodplains, delta and coastal
environment of the Mekong.
Analysis of daily data for historical and future climate data at six mainstream stations in the
LMB indicates that the nature of change is consistent along the Mekong and can be summarized by four key changes:
Increase in flood magnitude and volume: The dominant feature of the Mekong flood pulse is a single flood peak during August and September. Climate change will increase
the flow during the flood season and the size of the flood peak. In terms of the percentage change in volume, a 25% increase in flow at Chiang Saen, approximately
20% between Vientiane and Pakse, and 15% from Pakse to Kratie (ADB 2014; MRC
2011);
Increase in flood duration: Across all stations, climate change will increase the
duration of the flood season;

21
Shortening of transition seasons and onset of flooding: Climate change will shorten the transition seasons at all stations and increase the rate of increase of discharge. This
will accelerate the rate of transition from dry to flood and vice-versa (ADB 2014); and
Increase in dry season water levels: Climate change will increase dry season flows in response to increases in dry season rainfall for most areas of the Mekong catchment. All the simulated flood pulse characteristics indicate that the average and dry
hydrological years are likely to be wetter in the future (Keskinen et al. 2014).
The Mekong Delta is particularly vulnerable to the impacts of climate change due to the impacts of increased flooding and sea level rise. The population of more than 17 million
people in the Mekong is directly impacted by changes in upstream flow and water quality conditions. In the worst case scenario, by 2050:
Sediment inflows to the delta will be reduced by 94%;
Dry season flow volumes will reduce by 18%;
Average annual flood flow volumes will decrease by 22%; and
Peak daily flood flows will increase dramatically with the historic 1 in 100 year flood event becoming a 1 in 20 year event and the 1 in 10 year flood event becoming a 1 in 5
year event.
Rising sea levels compounded by a shrinking delta land mass will alter the delicate
balance between freshwater and estuarine conditions in the delta. Groundwater abstraction
coupled with the area’s unique geology and natural land consolidation processes of a young delta like the Mekong have resulted in rates of land subsidence in the order of 0.5 – 3.3cm/year
(Erban et al, 2014), with hotspots centered on the Cau Mau peninsula and the central floodplain areas of Can Tho, Vinh Long, and Tien Giang.
Flood management in the upper delta floodplain, saline intrusion in the delta estuary and
coastal protection in the peninsula will become more critical with the projected regional changes for the delta. Strategies will need to carefully consider the existing trends and
challenges, external and internal drivers of change and regional changes for the hydro-ecological zones. An integrated approach is required that assesses the regional impacts and
shared benefits of the proposed investments, aligns with policy drivers and identifies areas for
improved inter-provincial cooperation. For each of the hydrological zones these include:
Upper delta floodplain: Flood management is required to deal with the issues of
increasing flood damage and riverbank erosion;
Delta estuary: Adapting to salinity intrusion requires saline tolerant farming systems
to be adopted i.e. embracing brackish aquaculture; and
Delta peninsula: Coastal zone protection should consist of a combination of sea dykes, mangroves and sustainable shrimp farming practices
22
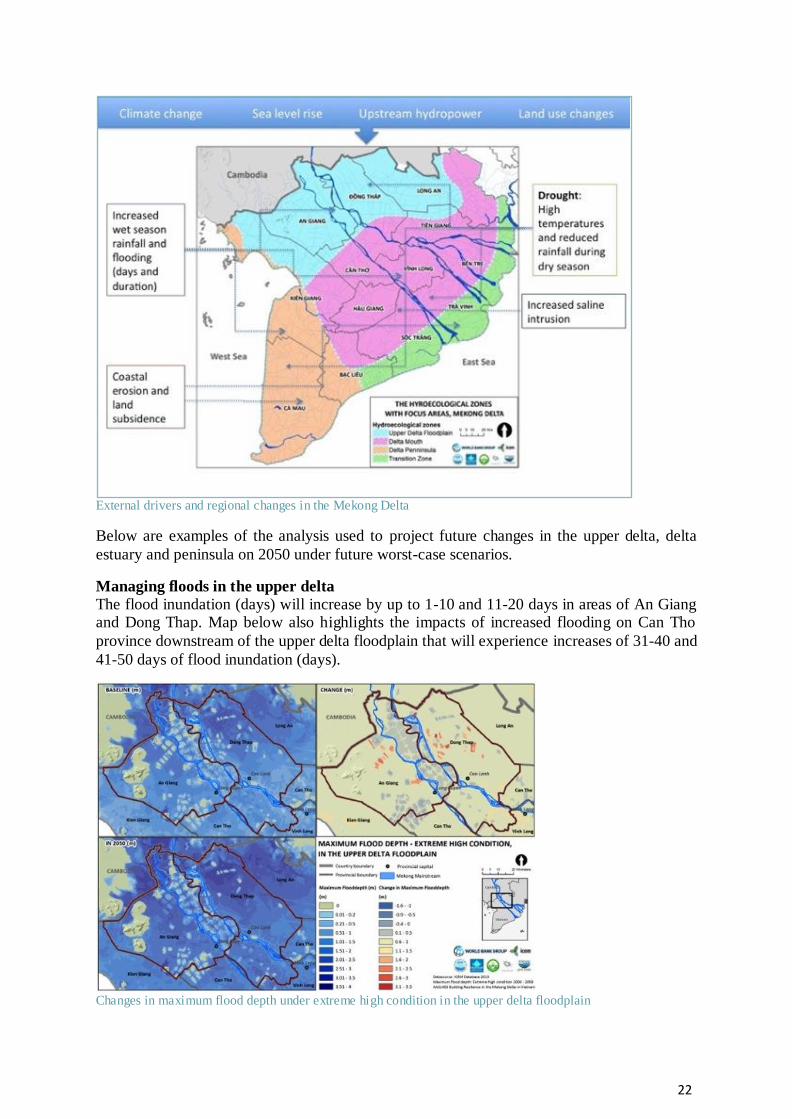
External drivers and regional changes in the Mekong Delta
Below are examples of the analysis used to project future changes in the upper delta, delta
estuary and peninsula on 2050 under future worst-case scenarios.
Managing floods in the upper delta The flood inundation (days) will increase by up to 1-10 and 11-20 days in areas of An Giang and Dong Thap. Map below also highlights the impacts of increased flooding on Can Tho
province downstream of the upper delta floodplain that will experience increases of 31-40 and
41-50 days of flood inundation (days).
Changes in maximum flood depth under extreme high condition in the upper delta floodplain
23
Salinity intrusion in the Delta Estuary
In 2050 under future worse case scenarios salinity duration (>4g/L) will increase by up to 45-60 days in Soc Trang, Tra Ben Tre and Tra Vinh. Increased saline intrusion put further
pressures on land use, balancing brackish and freshwater aquaculture and dry season water shortages.
Changes in salinity duration (>4g/L) under future worst-case scenario in the delta estuary
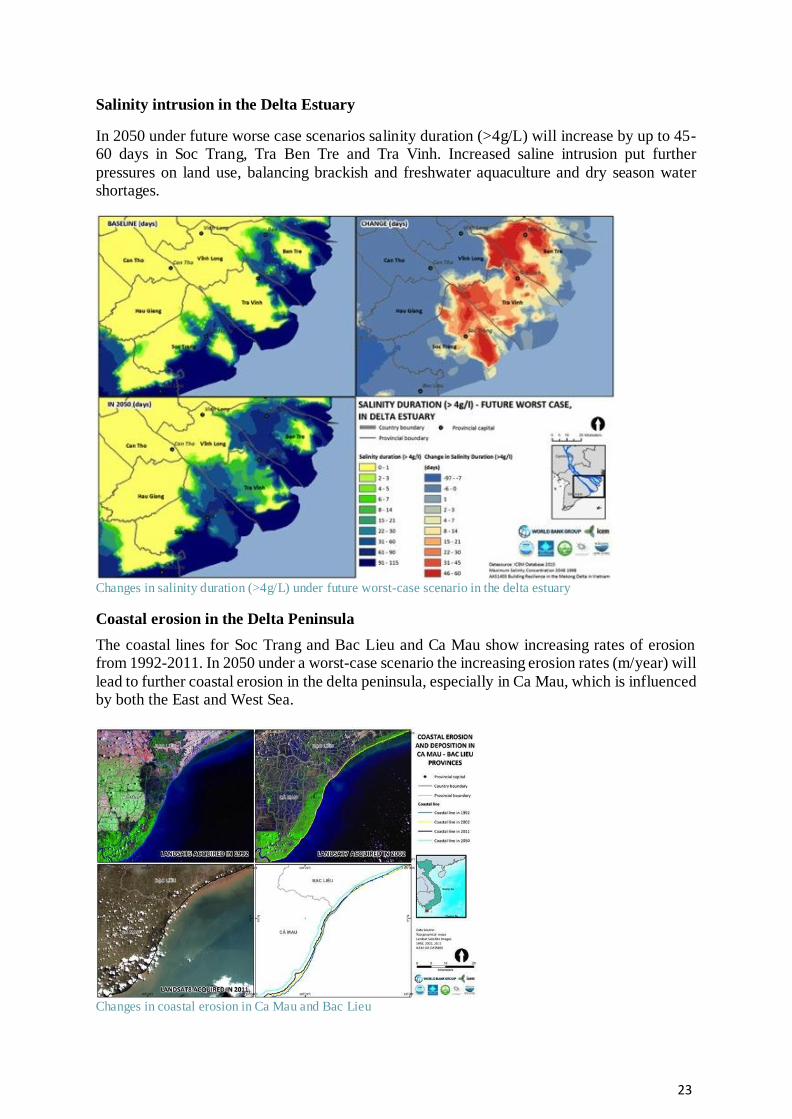
Coastal erosion in the Delta Peninsula
The coastal lines for Soc Trang and Bac Lieu and Ca Mau show increasing rates of erosion from 1992-2011. In 2050 under a worst-case scenario the increasing erosion rates (m/year) will
lead to further coastal erosion in the delta peninsula, especially in Ca Mau, which is influenced by both the East and West Sea.
Changes in coastal erosion in Ca Mau and Bac Lieu

24
Strategies for building resilience in the Mekong Delta
This section outlines the strategic options for the MD-ICRSL project for Components 1-4.
Component 1: Investments Enhancing Monitoring, Analytics, and Information Systems
Adaptation to climate change in the Mekong Delta requires an integrated, multidisciplinary
approach and the coordinated participation of all disciplines, sectors, and stakeholders.
Effective adaptation also requires strengthening the evidence base. Component 1 provides the
framework for updating and sharing information, knowledge, and data among stakeholders—
researchers, policy makers and decision makers, planners –and between different levels and
places are critical for resilient decisions. Component 1 comprised two subcomponents:
Sub-component 1.1: Investing in Monitoring Systems and Related Products to Enhance
Mekong Delta Knowledge Base:
Subcomponent 1.2: Infrastructure and Integrated Information Systems for Enhanced Decision-Making
Upgrading monitoring programs will include remote sensing, land use, water quantity and
quality, groundwater, coastal and river morphology, coastal zone protection, etc. to provide better information. Establishing the Mekong Delta Center will be for data, information,
education, knowledge and advocacy for adapting to climate change and promoting sustainability. The operations system for hydraulic infrastructure will provide real-time
information on salinity, floods and droughts to allow for better operation of infrastructure. A
comprehensive assessment of Delta sustainability issues, including status, trends and recommendations on how to adaptively mange the Delta in the context of rapidly changing
environmental conditions will also be prepared. This strategy aligns with the overall priority and “no-regret” measures outlined in the MDP for integrated development of the Mekong
Delta.
Component 2: Managing floods in the Upper Delta
The key strategies for the upper delta flood plains are to increase (or as a minimum maintain
the existing) water retention capacity by moving away from the advocated system of high dykes that facilitates triple crop rice production towards a more climate resilient flood based
production system that adapts to and optimizes wet and dry-season water conditions.
Flood Management in the upper delta floodplain is critical to protect and/or reclaim the benefits of flood retention and flood diversion measures while increasing rural incomes and protecting
high value assets. Over the last decades, the region has seen substantial changes to the landscape through the intensification of agriculture and aquaculture. High dykes have been
constructed around rice fields to control flooding and enable a third rice crop to be grown per
year. The key strategy for building resilience is embracing flood-based agriculture and flood management. Achieving the balance between flood control, adaptive land and water use and
restoring flood retention and ecosystem connectivity.
Component 3: Adapting to salinity transitions in the delta estuary
The strategies outlined in the MDP for the delta estuary address flood protection, freshwater
supply for the horticultural/agricultural areas of Ben Tre and Tra Vinh, the limitation of groundwater aquifer exploitation to sustainable levels and livelihoods improvements
25
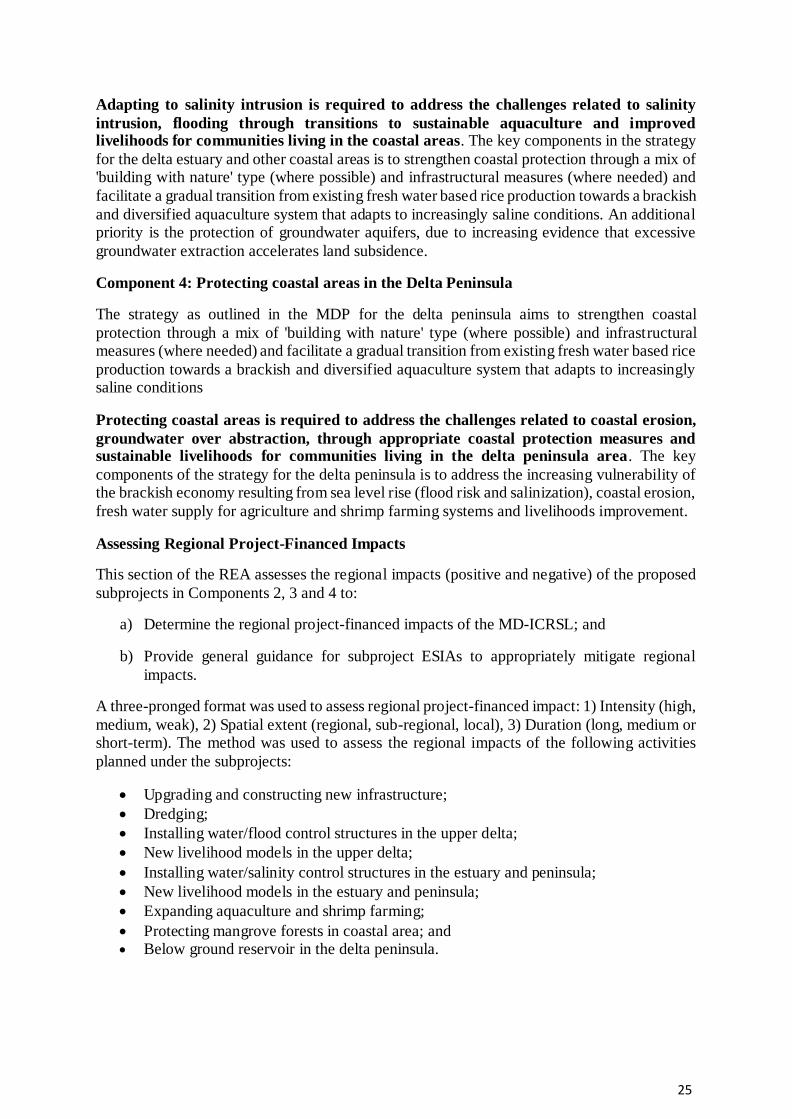
Adapting to salinity intrusion is required to address the challenges related to salinity
intrusion, flooding through transitions to sustainable aquaculture and improved livelihoods for communities living in the coastal areas. The key components in the strategy
for the delta estuary and other coastal areas is to strengthen coastal protection through a mix of 'building with nature' type (where possible) and infrastructural measures (where needed) and
facilitate a gradual transition from existing fresh water based rice production towards a brackish
and diversified aquaculture system that adapts to increasingly saline conditions. An additional priority is the protection of groundwater aquifers, due to increasing evidence that excessive
groundwater extraction accelerates land subsidence.
Component 4: Protecting coastal areas in the Delta Peninsula
The strategy as outlined in the MDP for the delta peninsula aims to strengthen coastal
protection through a mix of 'building with nature' type (where possible) and infrastructural measures (where needed) and facilitate a gradual transition from existing fresh water based rice
production towards a brackish and diversified aquaculture system that adapts to increasingly saline conditions
Protecting coastal areas is required to address the challenges related to coastal erosion,
groundwater over abstraction, through appropriate coastal protection measures and sustainable livelihoods for communities living in the delta peninsula area. The key
components of the strategy for the delta peninsula is to address the increasing vulnerability of the brackish economy resulting from sea level rise (flood risk and salinization), coastal erosion,
fresh water supply for agriculture and shrimp farming systems and livelihoods improvement.
Assessing Regional Project-Financed Impacts
This section of the REA assesses the regional impacts (positive and negative) of the proposed
subprojects in Components 2, 3 and 4 to:
a) Determine the regional project-financed impacts of the MD-ICRSL; and
b) Provide general guidance for subproject ESIAs to appropriately mitigate regional
impacts.
A three-pronged format was used to assess regional project-financed impact: 1) Intensity (high,
medium, weak), 2) Spatial extent (regional, sub-regional, local), 3) Duration (long, medium or short-term). The method was used to assess the regional impacts of the following activities
planned under the subprojects:
Upgrading and constructing new infrastructure;
Dredging;
Installing water/flood control structures in the upper delta;
New livelihood models in the upper delta;
Installing water/salinity control structures in the estuary and peninsula;
New livelihood models in the estuary and peninsula;
Expanding aquaculture and shrimp farming;
Protecting mangrove forests in coastal area; and Below ground reservoir in the delta peninsula.

26
Summary of regional project-financed impacts
The impacts of upgrading and constructing new infrastructure and dredging are likely to only have local or sub-regional impacts and can be managed through subproject safeguard
instruments and environmental management plan (EMP). Further information will be provided in the ESMF and the subproject ESIAs, where required.
Installing water/flood control structures in the upper delta will change the hydrological flow
and is likely to have major positive regional impacts by increasing flood retention and restoring floodplain ecosystems and agriculture. Hydrological and hydraulic modelling is needed to
determine the extent of flood protection in wet and average years. Flooding will provide nutrients and sediment in the wet season reducing the use of fertilizers and pesticides. Under
the new livelihood models farmers will be transitioning from triple rice cropping to double rice
plus crops and aquaculture. This will be a step-by-step process that includes agricultural extension, access to markets and sustainable agricultural practices. Surface water monitoring
will be important to detect whether the use of agro-chemicals, fertilizers and pesticides has increased or reduced in the project areas. Water quality monitoring will be developed at the
regional level under Component 1 of the MD-ICRSL.
Installing water/salinity control structures in the estuary and peninsula will have major positive impacts by increasing protection from coastal erosion, and major negative regional impacts by
blocking the movement and migration of coastal and estuarine fisheries in the Delta. The loss in capture fisheries may be offset by increasing the area of mangrove forests, that in
combination with improved coastal management are likely to increase biodiversity. The
combination of mangroves and sea dykes will also provide positive benefits by reducing the damages caused by storm surges and sea level rise.
The operation of the sluice gates will need to be flexible, and incorporate hydrological modelling and surface water monitoring of salinity to determine zones for freshwater, brackish
and saline farming. The operations and zones may need to be altered depending on wet, average
or dry years. For example, the provinces of Vinh Long are impacted by salinity in dry years only.
The development of livelihood programs in the delta estuary will help farmers to transition to adapt to salinity intrusion and improve climate resilience. A step-by-step process is needed as
some high value aquaculture (i.e. sugar cane) in the estuary earns higher income and provides
more employment opportunities than aquaculture and shrimp farming. The livelihood models will need to provide support to Khmer and other ethnic groups. Promoting sustainable
aquaculture, extensive shrimp and mangrove-shrimp should lead to reduced groundwater abstraction and surface water pollution associated with intensive shrimp farming. Groundwater
use studies and surface water monitoring will be developed at the regional level under
Component 1.
Constructing the reservoir in Ca Mau to increase freshwater storage is the delta peninsula is
likely to have major positive regional impacts. Dry season freshwater shortages and access to water and sanitation are critical challenges in coastal areas. The reservoir, if operated
effectively, and complemented by climate smart agriculture should decrease the exploitation
of groundwater. Dam safety measures and further hydrological and hydraulic modelling is required to enhance the benefits and reduce any negative impacts during construction and
operation of the reservoir.
27
Overall the subprojects are designed to have positive environmental and social impacts and
monitoring changes during construction and operation of water control infrastructure and livelihood models is required. The additional surface and groundwater monitoring and
assessing changes in coastal and riverbank erosion under Component 1 will be important for measuring and managing the regional impacts of the subprojects 2, 3 and 4. The investments
under Component 1 are outlined in Chapter 7 of the REA.
Linkages with other World Bank Projects in the Mekong Delta
The investments in the MD-ICRSL align with other World Bank projects implemented in the
Mekong Delta in water resources, flood protection, coastal management, flood protection and climate change adaptation, including:
Vietnam Sustainable Agriculture Transformation (VNSAT) Project (P145055)
Coastal Resources for Sustainable Development Project (CRDSP) (P11879)
Mekong Delta Water Management for Rural Development (Mekong Water) (P113949)
Mekong Integrated Water Resources Management (Mekong IWRM) - Phase II (P124942)
Mekong Delta Region Urban Upgrading Project (UUP) (P113904)
Mekong Transport Infrastructure Development
Building Adaptive Management Capacity in the Mekong Delta
Component 1 of the project takes a much more comprehensive and regional approach to
building resiliency in the Delta by investing in improved monitoring, analytics, and information systems to help guide planning and policy making. Putting the Mekong Delta on a more
sustainable and resilient trajectory in the face of climate change, upstream Mekong basin development, and environmentally unsustainable practices within the Delta itself, will require
investments in both infrastructure and the enhanced capacity to monitor, plan, and manage the
Delta’s land and water resources. Component 1 comprises two sub components:
Sub-component 1.1. Upgrading Monitoring Infrastructure to Enhance Mekong Delta
Knowledge Base (US$ 33.7 Million)
Subcomponent 1.2. Infrastructure and Information Systems for Enhanced Decisions
(US$ 13.8 million)
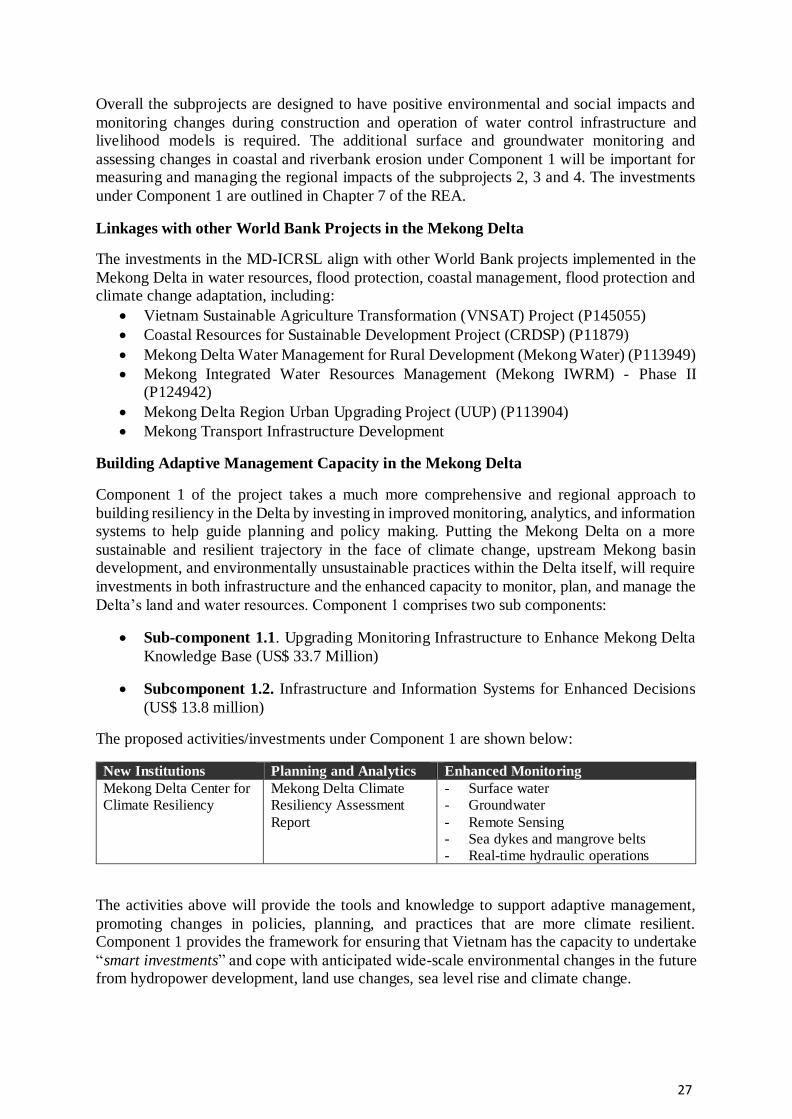
The proposed activities/investments under Component 1 are shown below:
New Institutions Planning and Analytics Enhanced Monitoring
Mekong Delta Center for
Climate Resiliency
Mekong Delta Climate
Resiliency Assessment
Report
- Surface water
- Groundwater
- Remote Sensing
- Sea dykes and mangrove belts
- Real-time hydraulic operations
The activities above will provide the tools and knowledge to support adaptive management,
promoting changes in policies, planning, and practices that are more climate resilient. Component 1 provides the framework for ensuring that Vietnam has the capacity to undertake
“smart investments” and cope with anticipated wide-scale environmental changes in the future from hydropower development, land use changes, sea level rise and climate change.

1
1 THE M EKONG RIVER B AS IN AND DELTA
1.1 Introduction
This Regional Environmental Assessment (REA) supports the development of the ‘Mekong
Delta Integrated Climate Resilience and Sustainable Livelihood (MD-ICRSL)’ project. The PDO is to enhance tools for climate-smart planning, and improve climate resilience of land and
water management practices in selected provinces of the Mekong Delta in Vietnam.. The objective would be achieved through the provision of capital investments, technical assistance
and capacity building for farmers in the selected provinces of the Mekong Delta in Vietnam
and government institutions at national and sub-national levels.
The Project activities will be implemented through the following five components:
Component 1: Enhancing Monitoring, Analytics, and Information Systems
Component 2: Managing Floods in the Upper Delta
Component 3: Adapting to Salinity Transitions in the Delta Estuary
Component 4: Protecting Coastal Areas in the Delta Peninsula
Component 5: Project Management and Implementation Support
1.2 Mekong Delta Plan
The MDP presents a long-term vision on the safe, prosperous and sustainable development of
the Delta region and contains strategic development principles for the upper delta, middle delta and peninsula zone. The key recommendations in the MDP is to move from the existing
diversified socio-economic planning towards a development direction for the Mekong Delta region that focuses on economic growth through modernizing present agriculture and
aquaculture systems by utilizing the unique demographic features (low-lying lands, the
waterways network and fertile soils).
The MDP includes “no-regret” and priority measures, as well as measures that can be deferred
towards the longer-term that Vietnam could adopt to ensure a safe, prosperous and both economically and environmentally sustainable future for the delta region. The MDP is a
regional wide assessment of the current trends and long-term sustainability issues for the Delta
and forms the foundations for this project. The overall objectives of this project is to operationalize the priority and “no-regret’ strategies for the upper delta, coastal zones and
overall measures developed under the MDP to enhance integrated development of the Delta (Table 1). The coastal zone described in the MDP includes areas of the delta estuary and
peninsula.
Table 1: Summary of MDP priority and "no regret" measures
Upper delta
2050 “no-regret” Controlled Flooding: agricultural land-use planning in upper delta
and modernization of flood-based “no-regret” agricultural production
systems (flood water retention, diversification of fish and vegetables).
2050 priority and “no-
regret”
Flood protection: local urban and rural in combination with room for
river and reinforcement and upgrading of flood (reversed drainage)
protection system and spatial urban planning.
Coastal zones
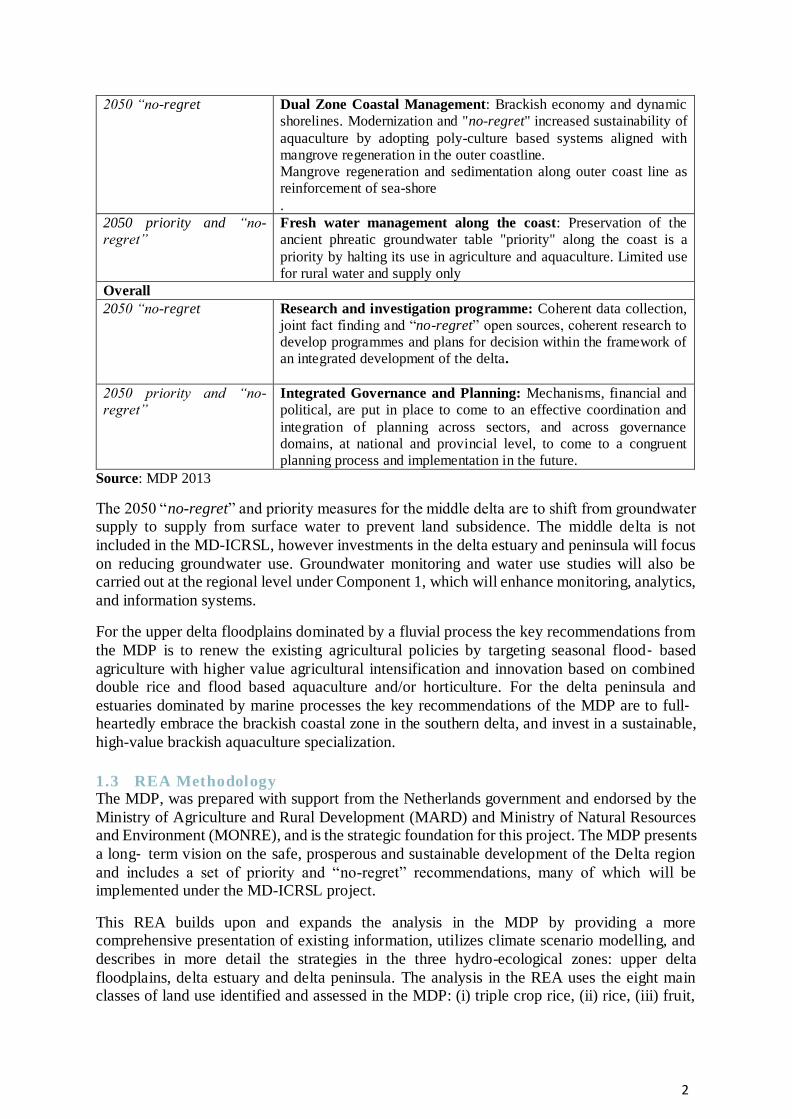
2
2050 “no-regret Dual Zone Coastal Management: Brackish economy and dynamic
shorelines. Modernization and "no-regret" increased sustainability of
aquaculture by adopting poly-culture based systems aligned with
mangrove regeneration in the outer coastline.
Mangrove regeneration and sedimentation along outer coast line as
reinforcement of sea-shore
.
2050 priority and “no-regret”
Fresh water management along the coast: Preservation of the
ancient phreatic groundwater table "priority" along the coast is a
priority by halting its use in agriculture and aquaculture. Limited use
for rural water and supply only
Overall
2050 “no-regret Research and investigation programme: Coherent data collection,
joint fact finding and “no-regret” open sources, coherent research to
develop programmes and plans for decision within the framework of
an integrated development of the delta.
2050 priority and “no-regret”
Integrated Governance and Planning: Mechanisms, financial and
political, are put in place to come to an effective coordination and
integration of planning across sectors, and across governance
domains, at national and provincial level, to come to a congruent
planning process and implementation in the future.
Source: MDP 2013
The 2050 “no-regret” and priority measures for the middle delta are to shift from groundwater supply to supply from surface water to prevent land subsidence. The middle delta is not
included in the MD-ICRSL, however investments in the delta estuary and peninsula will focus
on reducing groundwater use. Groundwater monitoring and water use studies will also be carried out at the regional level under Component 1, which will enhance monitoring, analytics,
and information systems.
For the upper delta floodplains dominated by a fluvial process the key recommendations from
the MDP is to renew the existing agricultural policies by targeting seasonal flood‐ based
agriculture with higher value agricultural intensification and innovation based on combined double rice and flood based aquaculture and/or horticulture. For the delta peninsula and
estuaries dominated by marine processes the key recommendations of the MDP are to full‐heartedly embrace the brackish coastal zone in the southern delta, and invest in a sustainable,
high-value brackish aquaculture specialization.
1.3 REA Methodology The MDP, was prepared with support from the Netherlands government and endorsed by the
Ministry of Agriculture and Rural Development (MARD) and Ministry of Natural Resources and Environment (MONRE), and is the strategic foundation for this project. The MDP presents
a long‐ term vision on the safe, prosperous and sustainable development of the Delta region
and includes a set of priority and “no-regret” recommendations, many of which will be implemented under the MD-ICRSL project.
This REA builds upon and expands the analysis in the MDP by providing a more comprehensive presentation of existing information, utilizes climate scenario modelling, and
describes in more detail the strategies in the three hydro-ecological zones: upper delta
floodplains, delta estuary and delta peninsula. The analysis in the REA uses the eight main classes of land use identified and assessed in the MDP: (i) triple crop rice, (ii) rice, (iii) fruit,

3
(iv) brackish water culture, (v) shrimp, (vi) forest/wetlands, (vii) mangroves, and (viii) urban.
(vii) mangroves, and (viii) urban.
The existing trends/challenges projected future changes (2050) and strategies for the Mekong
Delta were developed using the baseline information, GIS tools, maps, images and modelling developed under the ‘Building Resilience in the Mekong Delta’ (TA) (P149017). The
information from this TA is available online at: http://icem.com.au/DELTA/.
1.4 REA objectives The key objectives of this REA are to:
provide a comprehensive environmental and socio-economic baseline of the Mekong Delta;
present the existing trends and challenges in the upper delta, delta estuary and delta peninsula;
analyze the regional changes from hydropower development, land use change, sea level rise and climate change and recommend strategies for building resilience; and
assess the regional project-financed impacts and recommend investments for building adaptive capacity in the Mekong Delta.
A number of environmental safeguard instruments and assessment will be conducted for this project, including the Environmental and Social Management Framework (ESMF), three
Environmental Management Plans (EMPs) and three Environmental and Social Impact
Assessments (ESIAs). The ESMF will establish the requirements for subproject safeguard screening, impact assessment and development of mitigation measures, an Environmental
Codes of Practice (ECOP) for construction activities, safeguard documentation preparation and clearance, safeguard implementation, supervision, monitoring, and reporting. The REA will
provide general guidance to subproject ESIAs to ensure that regional project-financed impacts
are effectively mitigated.
1.5 Overview of the Mekong Basin
The Mekong River is the twelfth longest river in the world and sixth largest in terms of mean annual discharge. The Mekong River flows for 4,750km from its source in Tibet at
4,500m above sea level through China, Myanmar, Laos, Thailand, Cambodia and Vietnam via
a Delta into the East Sea, draining a basin area of 795,000 km2 and with a mean annual discharge of approximately 475 km3. The Mekong Basin can be divided into two parts: 1) the
Upper Mekong Basin (UMB) in China accounting for 24% of drainage and contributing 16% percent of flows into the Mekong annually (up to 30% in the dry season)(MRC 2009), and 2)
the Lower Mekong Basin (LMB) accounting for 76% of the drainage area (Lu & Siew 2006).
The Mekong plays a crucial socio-economic role in the lives of the 90 million people living in the Basin. Maintaining and improving the natural productivity of the river basin is essential
to both the local populations and the national economies of the countries within the basin. The Mekong is the second most bio-diverse aquatic system in the world after the Amazon, and
supports the world’s largest fresh water capture fishery of about 2.3 million tons per year (MRC
2011). The people of the Mekong have the highest per capita consumption of fish in the world—up to 50 kg/head/year in some parts of the basin (ICEM 2013). The freshwater fish
catch per capita in the LMB is nearly four times the world average (Baran 2010). Of the fish species nearly 200 species are migratory “white” fish, some of them travelling long distances
from the Tonle Sap or the Mekong Delta in Vietnam up the Khone Phapheng Falls and further
up the Mekong in Laos and Thailand.
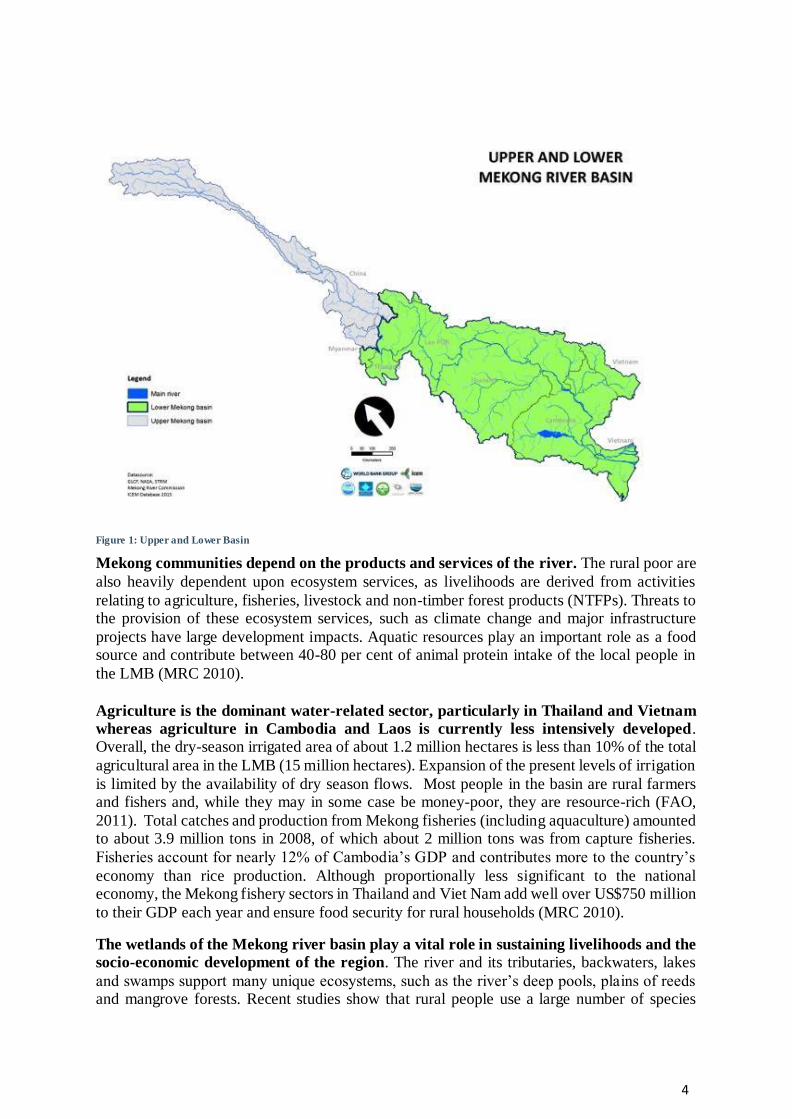
4
Figure 1: Upper and Lower Basin
Mekong communities depend on the products and services of the river. The rural poor are
also heavily dependent upon ecosystem services, as livelihoods are derived from activities
relating to agriculture, fisheries, livestock and non-timber forest products (NTFPs). Threats to the provision of these ecosystem services, such as climate change and major infrastructure
projects have large development impacts. Aquatic resources play an important role as a food source and contribute between 40-80 per cent of animal protein intake of the local people in
the LMB (MRC 2010).
Agriculture is the dominant water-related sector, particularly in Thailand and Vietnam
whereas agriculture in Cambodia and Laos is currently less intensively developed. Overall, the dry-season irrigated area of about 1.2 million hectares is less than 10% of the total
agricultural area in the LMB (15 million hectares). Expansion of the present levels of irrigation
is limited by the availability of dry season flows. Most people in the basin are rural farmers and fishers and, while they may in some case be money-poor, they are resource-rich (FAO,
2011). Total catches and production from Mekong fisheries (including aquaculture) amounted to about 3.9 million tons in 2008, of which about 2 million tons was from capture fisheries.
Fisheries account for nearly 12% of Cambodia’s GDP and contributes more to the country’s
economy than rice production. Although proportionally less significant to the national economy, the Mekong fishery sectors in Thailand and Viet Nam add well over US$750 million
to their GDP each year and ensure food security for rural households (MRC 2010).
The wetlands of the Mekong river basin play a vital role in sustaining livelihoods and the
socio-economic development of the region. The river and its tributaries, backwaters, lakes
and swamps support many unique ecosystems, such as the river’s deep pools, plains of reeds and mangrove forests. Recent studies show that rural people use a large number of species
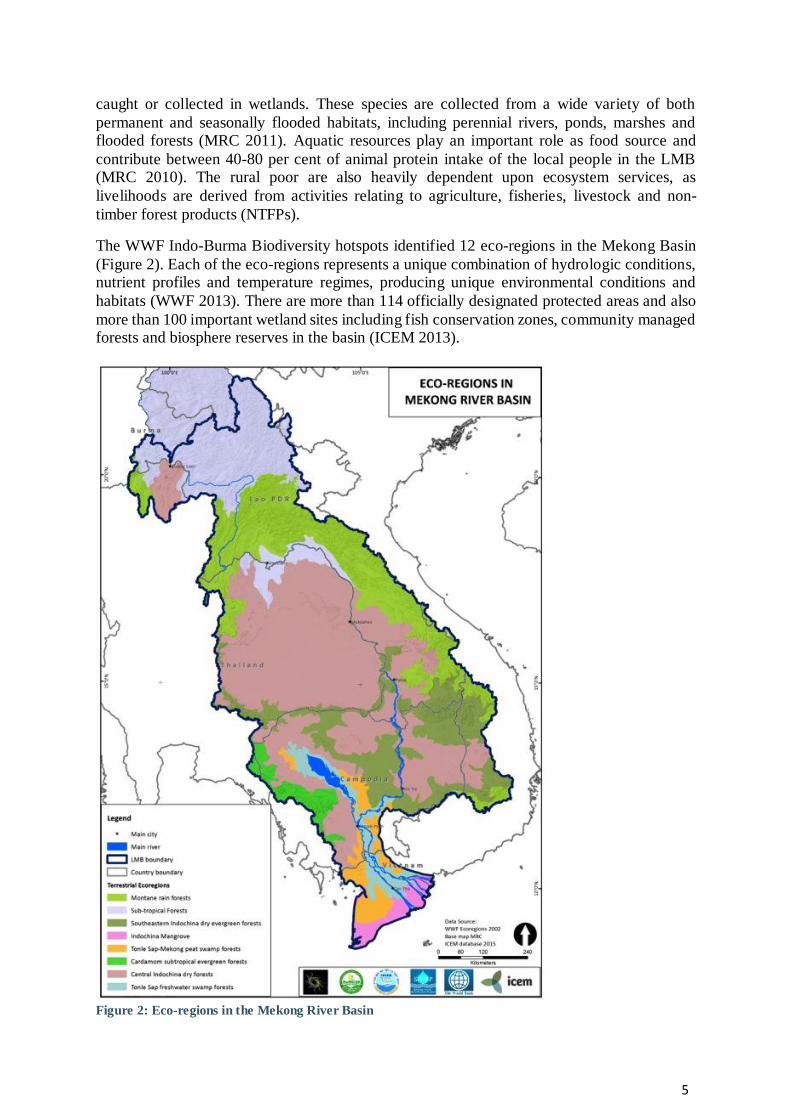
5
caught or collected in wetlands. These species are collected from a wide variety of both
permanent and seasonally flooded habitats, including perennial rivers, ponds, marshes and flooded forests (MRC 2011). Aquatic resources play an important role as food source and
contribute between 40-80 per cent of animal protein intake of the local people in the LMB (MRC 2010). The rural poor are also heavily dependent upon ecosystem services, as
livelihoods are derived from activities relating to agriculture, fisheries, livestock and non-
timber forest products (NTFPs).
The WWF Indo-Burma Biodiversity hotspots identified 12 eco-regions in the Mekong Basin
(Figure 2). Each of the eco-regions represents a unique combination of hydrologic conditions, nutrient profiles and temperature regimes, producing unique environmental conditions and
habitats (WWF 2013). There are more than 114 officially designated protected areas and also
more than 100 important wetland sites including fish conservation zones, community managed forests and biosphere reserves in the basin (ICEM 2013).
Figure 2: Eco-regions in the Mekong River Basin
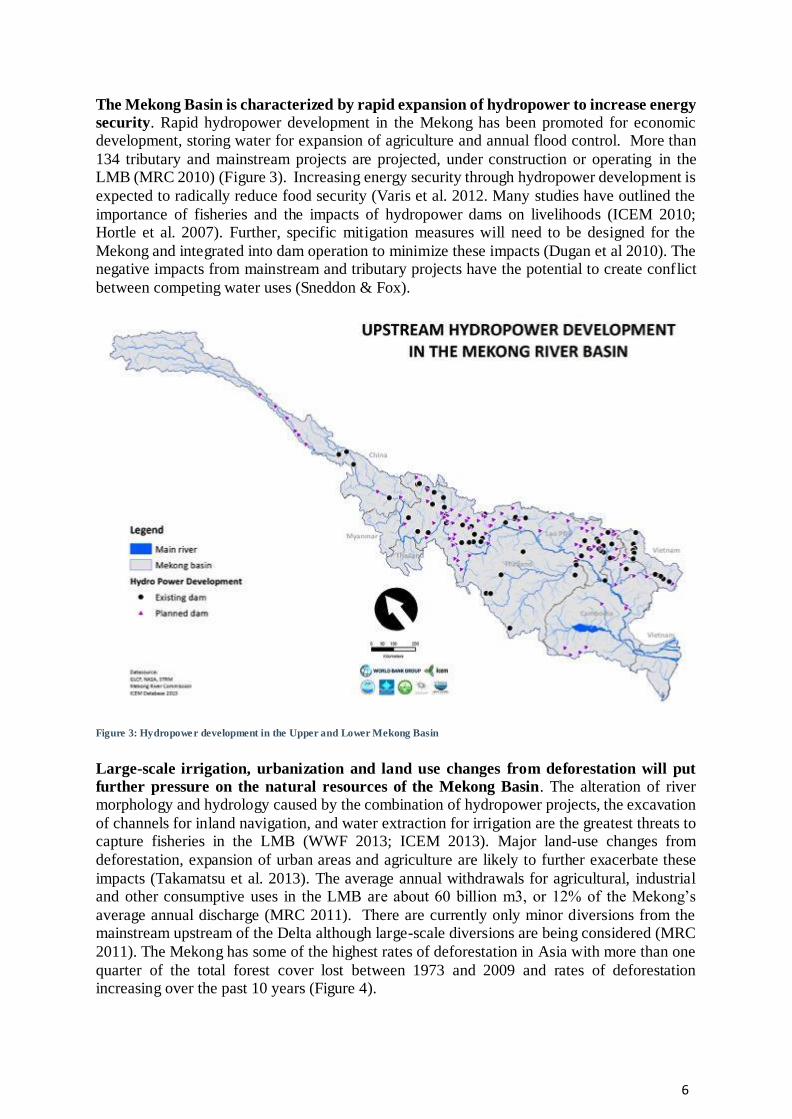
6
The Mekong Basin is characterized by rapid expansion of hydropower to increase energy
security. Rapid hydropower development in the Mekong has been promoted for economic development, storing water for expansion of agriculture and annual flood control. More than
134 tributary and mainstream projects are projected, under construction or operating in the LMB (MRC 2010) (Figure 3). Increasing energy security through hydropower development is
expected to radically reduce food security (Varis et al. 2012. Many studies have outlined the
importance of fisheries and the impacts of hydropower dams on livelihoods (ICEM 2010; Hortle et al. 2007). Further, specific mitigation measures will need to be designed for the
Mekong and integrated into dam operation to minimize these impacts (Dugan et al 2010). The negative impacts from mainstream and tributary projects have the potential to create conflict
between competing water uses (Sneddon & Fox).
Figure 3: Hydropower development in the Upper and Lower Mekong Basin
Large-scale irrigation, urbanization and land use changes from deforestation will put
further pressure on the natural resources of the Mekong Basin. The alteration of river morphology and hydrology caused by the combination of hydropower projects, the excavation
of channels for inland navigation, and water extraction for irrigation are the greatest threats to capture fisheries in the LMB (WWF 2013; ICEM 2013). Major land-use changes from
deforestation, expansion of urban areas and agriculture are likely to further exacerbate these
impacts (Takamatsu et al. 2013). The average annual withdrawals for agricultural, industrial and other consumptive uses in the LMB are about 60 billion m3, or 12% of the Mekong’s
average annual discharge (MRC 2011). There are currently only minor diversions from the mainstream upstream of the Delta although large-scale diversions are being considered (MRC
2011). The Mekong has some of the highest rates of deforestation in Asia with more than one
quarter of the total forest cover lost between 1973 and 2009 and rates of deforestation increasing over the past 10 years (Figure 4).
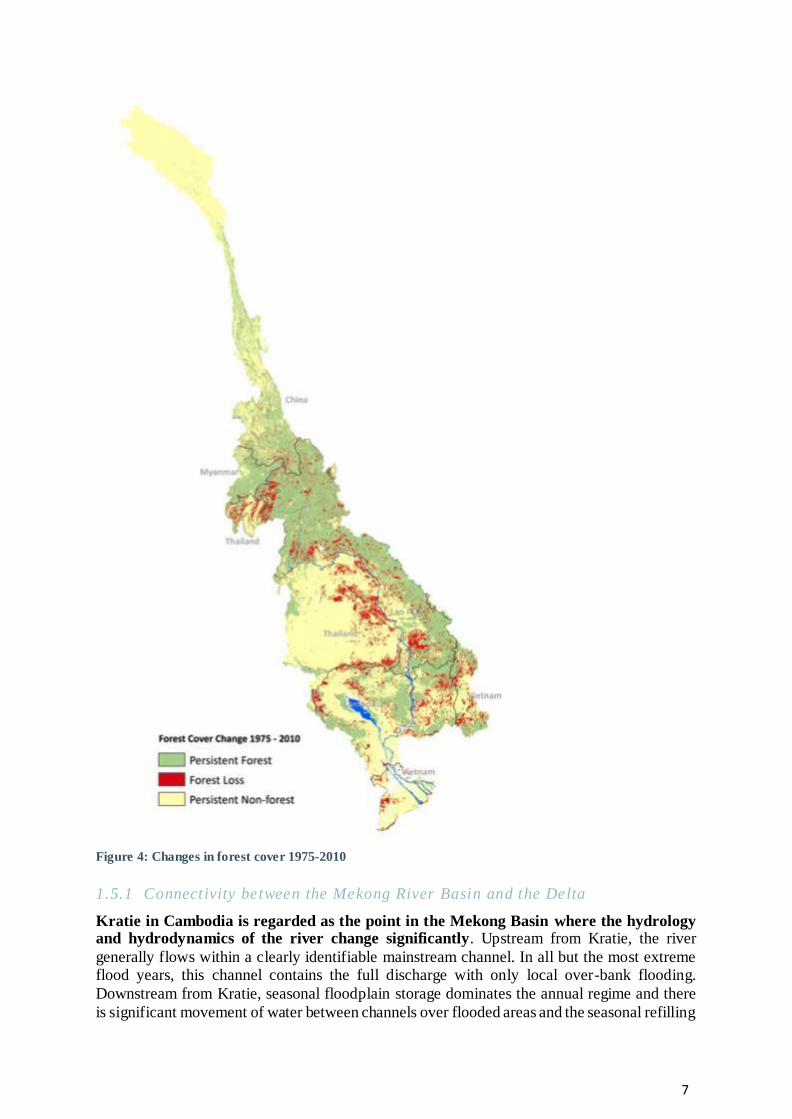
7
Figure 4: Changes in forest cover 1975-2010
1.5.1 Connectivity between the Mekong River Basin and the Delta
Kratie in Cambodia is regarded as the point in the Mekong Basin where the hydrology and hydrodynamics of the river change significantly. Upstream from Kratie, the river
generally flows within a clearly identifiable mainstream channel. In all but the most extreme flood years, this channel contains the full discharge with only local over-bank flooding.
Downstream from Kratie, seasonal floodplain storage dominates the annual regime and there
is significant movement of water between channels over flooded areas and the seasonal refilling
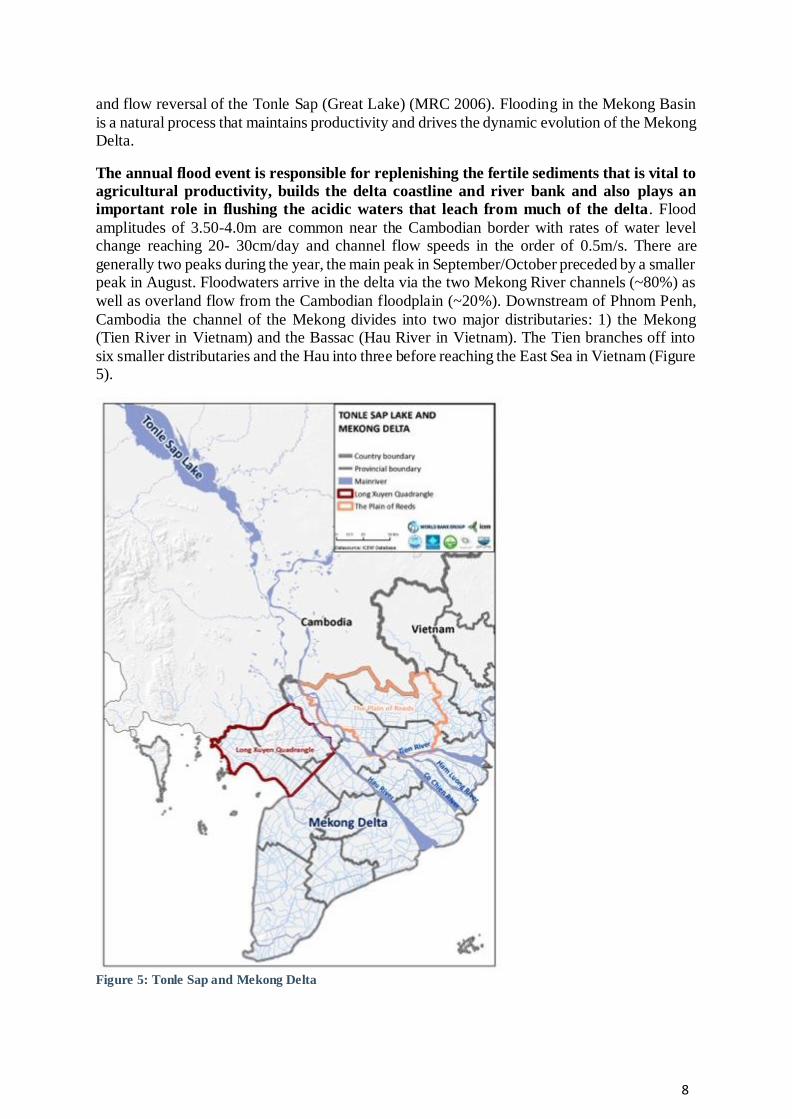
8
and flow reversal of the Tonle Sap (Great Lake) (MRC 2006). Flooding in the Mekong Basin
is a natural process that maintains productivity and drives the dynamic evolution of the Mekong Delta.
The annual flood event is responsible for replenishing the fertile sediments that is vital to
agricultural productivity, builds the delta coastline and river bank and also plays an
important role in flushing the acidic waters that leach from much of the delta. Flood
amplitudes of 3.50-4.0m are common near the Cambodian border with rates of water level change reaching 20- 30cm/day and channel flow speeds in the order of 0.5m/s. There are
generally two peaks during the year, the main peak in September/October preceded by a smaller peak in August. Floodwaters arrive in the delta via the two Mekong River channels (~80%) as
well as overland flow from the Cambodian floodplain (~20%). Downstream of Phnom Penh,
Cambodia the channel of the Mekong divides into two major distributaries: 1) the Mekong (Tien River in Vietnam) and the Bassac (Hau River in Vietnam). The Tien branches off into
six smaller distributaries and the Hau into three before reaching the East Sea in Vietnam (Figure 5).
Figure 5: Tonle Sap and Mekong Delta
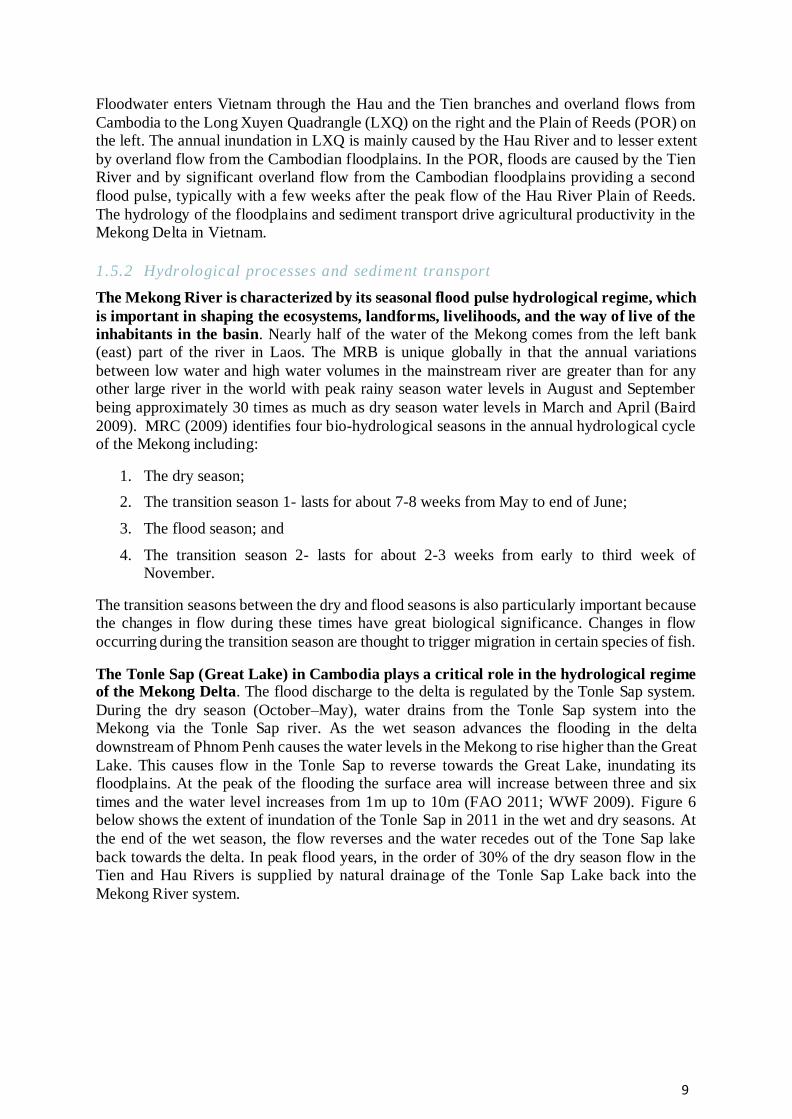
9
Floodwater enters Vietnam through the Hau and the Tien branches and overland flows from
Cambodia to the Long Xuyen Quadrangle (LXQ) on the right and the Plain of Reeds (POR) on the left. The annual inundation in LXQ is mainly caused by the Hau River and to lesser extent
by overland flow from the Cambodian floodplains. In the POR, floods are caused by the Tien River and by significant overland flow from the Cambodian floodplains providing a second
flood pulse, typically with a few weeks after the peak flow of the Hau River Plain of Reeds.
The hydrology of the floodplains and sediment transport drive agricultural productivity in the Mekong Delta in Vietnam.
1.5.2 Hydrological processes and sediment transport
The Mekong River is characterized by its seasonal flood pulse hydrological regime, which
is important in shaping the ecosystems, landforms, livelihoods, and the way of live of the
inhabitants in the basin. Nearly half of the water of the Mekong comes from the left bank (east) part of the river in Laos. The MRB is unique globally in that the annual variations
between low water and high water volumes in the mainstream river are greater than for any other large river in the world with peak rainy season water levels in August and September
being approximately 30 times as much as dry season water levels in March and April (Baird
2009). MRC (2009) identifies four bio-hydrological seasons in the annual hydrological cycle of the Mekong including:
1. The dry season;
2. The transition season 1- lasts for about 7-8 weeks from May to end of June;
3. The flood season; and
4. The transition season 2- lasts for about 2-3 weeks from early to third week of November.
The transition seasons between the dry and flood seasons is also particularly important because the changes in flow during these times have great biological significance. Changes in flow
occurring during the transition season are thought to trigger migration in certain species of fish.
The Tonle Sap (Great Lake) in Cambodia plays a critical role in the hydrological regime of the Mekong Delta. The flood discharge to the delta is regulated by the Tonle Sap system.
During the dry season (October–May), water drains from the Tonle Sap system into the Mekong via the Tonle Sap river. As the wet season advances the flooding in the delta
downstream of Phnom Penh causes the water levels in the Mekong to rise higher than the Great
Lake. This causes flow in the Tonle Sap to reverse towards the Great Lake, inundating its floodplains. At the peak of the flooding the surface area will increase between three and six
times and the water level increases from 1m up to 10m (FAO 2011; WWF 2009). Figure 6 below shows the extent of inundation of the Tonle Sap in 2011 in the wet and dry seasons. At
the end of the wet season, the flow reverses and the water recedes out of the Tone Sap lake
back towards the delta. In peak flood years, in the order of 30% of the dry season flow in the Tien and Hau Rivers is supplied by natural drainage of the Tonle Sap Lake back into the
Mekong River system.
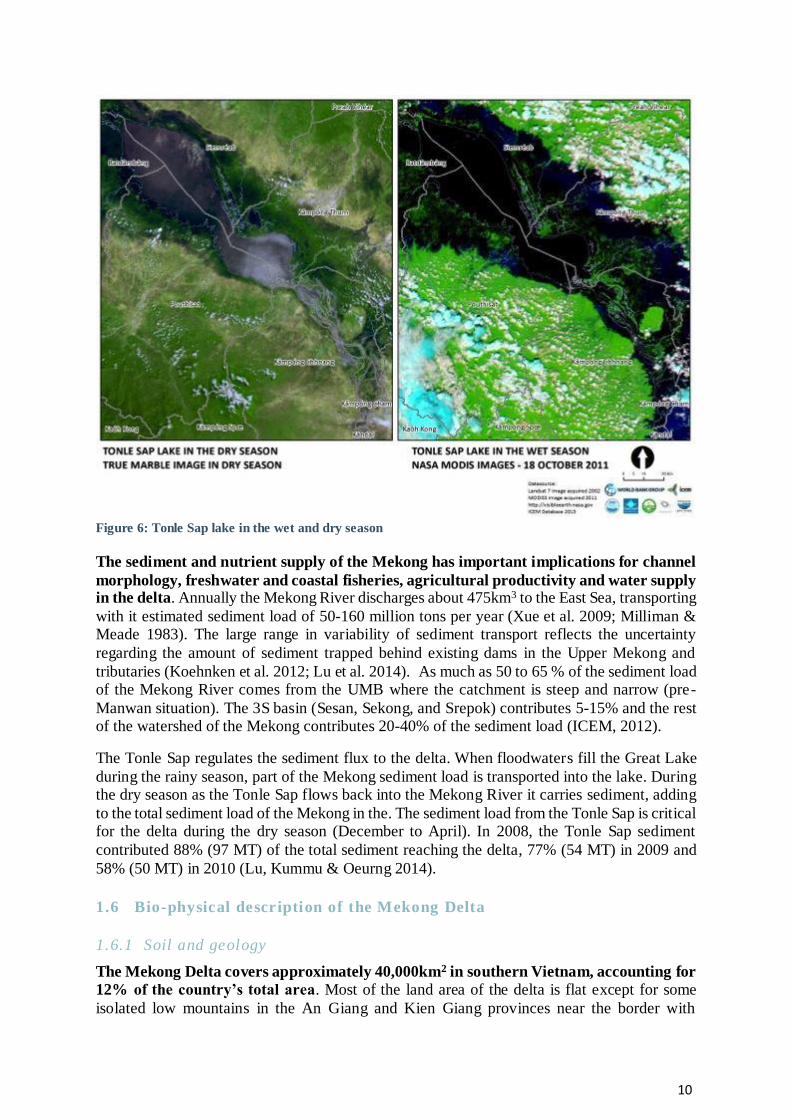
10
Figure 6: Tonle Sap lake in the wet and dry season
The sediment and nutrient supply of the Mekong has important implications for channel
morphology, freshwater and coastal fisheries, agricultural productivity and water supply in the delta. Annually the Mekong River discharges about 475km3 to the East Sea, transporting
with it estimated sediment load of 50-160 million tons per year (Xue et al. 2009; Milliman & Meade 1983). The large range in variability of sediment transport reflects the uncertainty
regarding the amount of sediment trapped behind existing dams in the Upper Mekong and
tributaries (Koehnken et al. 2012; Lu et al. 2014). As much as 50 to 65 % of the sediment load of the Mekong River comes from the UMB where the catchment is steep and narrow (pre-
Manwan situation). The 3S basin (Sesan, Sekong, and Srepok) contributes 5-15% and the rest of the watershed of the Mekong contributes 20-40% of the sediment load (ICEM, 2012).
The Tonle Sap regulates the sediment flux to the delta. When floodwaters fill the Great Lake
during the rainy season, part of the Mekong sediment load is transported into the lake. During the dry season as the Tonle Sap flows back into the Mekong River it carries sediment, adding
to the total sediment load of the Mekong in the. The sediment load from the Tonle Sap is critical for the delta during the dry season (December to April). In 2008, the Tonle Sap sediment
contributed 88% (97 MT) of the total sediment reaching the delta, 77% (54 MT) in 2009 and
58% (50 MT) in 2010 (Lu, Kummu & Oeurng 2014).
1.6 Bio-physical description of the Mekong Delta
1.6.1 Soil and geology
The Mekong Delta covers approximately 40,000km2 in southern Vietnam, accounting for
12% of the country’s total area. Most of the land area of the delta is flat except for some
isolated low mountains in the An Giang and Kien Giang provinces near the border with

11
Cambodia and the coastal sand ridges of 5-8m in elevation. More than half of the delta is less
than 1.0m above mean sea level. Generally, the terrain of the delta drops from 2.0-4.0m near the northwest border with Cambodia to 1.0-1.5m in the middle plain, to 0.3-0.7m in the
southeast in the coastal area (Figure 7).
Figure 7: Elevation in the Mekong Delta
The formation of the Mekong Delta is the product of fluvial process of the Mekong River
System interacting with tidal and wave processes in the East and West Seas (ICEM 2012).
Regressions over the last 4550 years BP have produced many distinct sets of relict beach ridges, which are useful in distinguishing the former coastlines and evolutionary history of the delta
(Nguyen et al. 1997). The extremely fast progradation rate could be due to: 1) very high sediment supply depositing in the slight inclination of the receiving basin, 2) neotectonic
movements and relative sea-level changes, and, 3) widespread mangrove forests playing an
important role to enhance sediment accumulation. Former mangrove marshy deposits were significantly developed in the Plain of Reeds (POR) and Long Xuyen Quadrangle (LXQ).
The dynamics of its formation have resulted in the majority of the Mekong Delta area being comprised of acid-sulphate or saline soils, creating a poor environment for agricultural
production, and yet, today, the delta is central to Vietnam’s agro-economy and has some of the
most productive agricultural land in Vietnam (Tuyet & Cosslett 2014). The soil types in different provinces have an important influence on the type of agriculture. The four main soil
types in the delta are alluvium, acid sulphate, saline and peat soils (Figure 8).
Alluvium soils: cover an area of 1.110 million hectares (28% of the Delta) and are
found along the Tien and Hau rivers. The soils are a result of multiple depositions of alluvia by the Mekong River over several thousands of years, and are most suitable for
rice production;
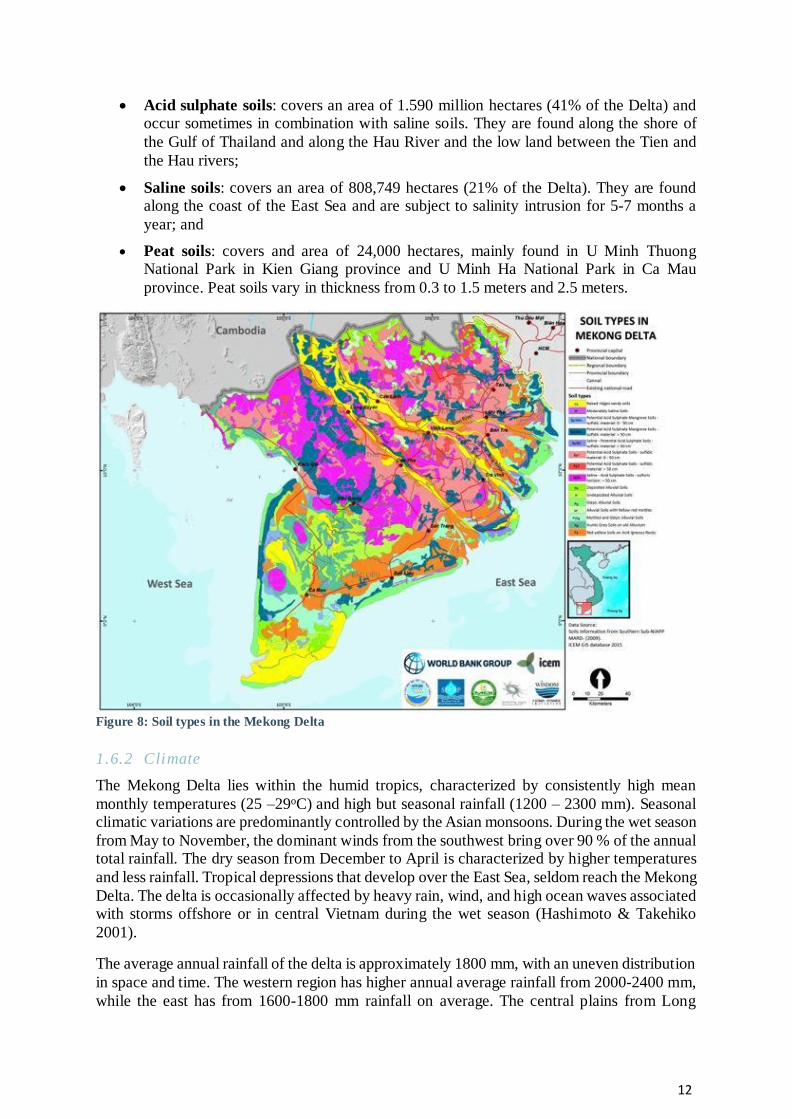
12
Acid sulphate soils: covers an area of 1.590 million hectares (41% of the Delta) and occur sometimes in combination with saline soils. They are found along the shore of
the Gulf of Thailand and along the Hau River and the low land between the Tien and
the Hau rivers;
Saline soils: covers an area of 808,749 hectares (21% of the Delta). They are found along the coast of the East Sea and are subject to salinity intrusion for 5-7 months a
year; and
Peat soils: covers and area of 24,000 hectares, mainly found in U Minh Thuong National Park in Kien Giang province and U Minh Ha National Park in Ca Mau
province. Peat soils vary in thickness from 0.3 to 1.5 meters and 2.5 meters.
Figure 8: Soil types in the Mekong Delta
1.6.2 Climate
The Mekong Delta lies within the humid tropics, characterized by consistently high mean
monthly temperatures (25 –29oC) and high but seasonal rainfall (1200 – 2300 mm). Seasonal climatic variations are predominantly controlled by the Asian monsoons. During the wet season
from May to November, the dominant winds from the southwest bring over 90 % of the annual total rainfall. The dry season from December to April is characterized by higher temperatures
and less rainfall. Tropical depressions that develop over the East Sea, seldom reach the Mekong
Delta. The delta is occasionally affected by heavy rain, wind, and high ocean waves associated with storms offshore or in central Vietnam during the wet season (Hashimoto & Takehiko
2001).
The average annual rainfall of the delta is approximately 1800 mm, with an uneven distribution
in space and time. The western region has higher annual average rainfall from 2000-2400 mm,
while the east has from 1600-1800 mm rainfall on average. The central plains from Long

13
Xuyen, Chau Doc-Can Tho to Tra Vinh - Cao Lanh - Go Cong have the lowest annual rainfall
1200-1600 mm. Rainfall is very unevenly distributed throughout the year. Rainfall in the dry season accounts for only 10% of the total rainfall, with January, February, and March having
almost no rain (often triggering droughts). In the rainy season there is occasionally continuous rain that can last for 3-5 days causing flooding and an increase in water levels (MDP 2011).
1.6.3 Water resources
The hydrological regime of the Mekong Delta is a product of the interaction between the river flows, the semi-diurnal tidal regime of the East Sea and the diurnal tide of the West Sea (Gulf
of Thailand). Hydrologically, the delta can be divided into three parts:
1. The upper delta: is dominated by freshwater inputs from the Mekong basin and
overbank flooding of the Tien and Hau river channels. The POR and LXQ are subject
to annual inundation of about 3-4 meters by Mekong floodwaters. The floodplains temporarily store water in the flood season and gradually release water to replenish the
river mainstream in the dry season, regulating the extent of salinity intrusion in downstream coastal areas;
2. The middle delta: an area of about 1.6 million ha lying between the upper part of the
delta and the coastal area on both sides of the Mekong River. The area is under the mixed influence of upstream hydrology as well as coastal processes such as tidally-
induced saline intrusion and channel-flow reversal; and
3. The coastal delta: with an area of about 1.0 million ha, primarily influenced by tidal
flow. The saline soils form a belt of 20-50km wide along the east and west coast and
most of the Ca Mau Peninsula. Coastal processes dominate local hydrology and local rainfall is the main freshwater input.
1.6.3.1 Flooding
Annual flooding in the Mekong Delta usually begins in June-July and ends in November-
December, with an average peak flow entering the delta of around 28,000-30,000 m3/s. This is
followed by a seasonal average dry flow of about 3,000-5,000 m3/s. Both high and low flood regimes prevail for about 6 months. The total average annual river flow in the Mekong Delta
in the upstream parts of the Tien and Hau rivers is ~408 billion m3 (according to data measured from 2000 to 2008 at Tan Chau and Chau Doc stations). With flooding in the flood season the
border region accounts for 14-18% of the total flow into the Vietnam (estimated 57 billion m3)
and surface water by rain on the plains accounts for 11% of the whole water volume (estimated 45 billion m3) (MDP 2013).
There are two large natural floodplain depression areas: 1) Long Xuyen Quadrangle (LXQ) is roughly 600,000 hectares on the right bank of the Hau river (Bassac) and, 2) Plain of Reeds
(POR) is about 700,000 hectares on the left bank of the Tien river (Mekong). These two vast
floodplain areas act as natural sponges to regulate flooding by absorbing water in the flood seasons and releasing water back to the mainstream in the dry season.
1.6.3.2 Sediment transport
One of the important benefits of the annual floodwaters that the Mekong brings to the
delta is the sediments and associated nutrients critical for agriculture and fisheries. The
total sediment transported to the delta varies from 64% in an extreme flood to 71% for a low flood, with a corresponding flood volume of 86 and 93% respectively. The largest fraction of
14
the sediment is transported through the Tan Chau and Chau Doc stations ranging from 57 to
68% (corresponding flood volume: 78–89%) for high and low flood years (Manh et al. 2014). The floodplains compartments trap 1-6% of the total sediment load at Kratie, this is equivalent
to around 9-41 % of the total sediment transported into the delta. The remaining suspended sediment is transported to the coastal areas.
For example, in the extreme flood in 2011 it was estimated that 292,000 tons of nutrients were
deposited in the POR, 102,000 tons in the LXQ and 45,000 tons between the Tien and Hau rivers (Manh et al. 2014). Even under normal flood conditions (as in 2009), flooding can
provide more than 50% of the typically applied agro-chemicals for rice crops (N, P, K), reducing the costs of fertilizers and pesticides used in intensive rice growing areas.
1.6.3.3 Groundwater
The Mekong Delta can be described as having five main aquifers named after the
following geological units: 1) Holocene, 2) Upper-Middle Pleistocene, 3) Lower
Pleistocene, 4) Pliocene, and 5) Upper Miocene. The near-surface aquifer (holocene) occurs across most of the delta. Water quality and yield from this aquifer are generally poor with high
salinity, high levels of pollutants, and some areas of extremely low pH because of the exposure
and oxidization of acid sulphate soils, particularly in the POR and Ca Mau Peninsula (Hung et al. 2000; IUCN 2011). The other four deeper confined aquifers including Upper-Middle
Pleistocene, Lower Pleistocene, Pliocene, and Miocene are large-scale reserves of water with varying yield and quality. Water quality is best in the Pleistocene and Pliocene layers but varies
markedly by location and aquifer (Phuc 2008).
As surface water in the Mekong Delta is under increasing strain due to pollution, extraction, salinity intrusion, groundwater has become an important water source. Today
more than one million wells access groundwater for domestic, agricultural, and industrial needs, causing hydraulic heads (i.e., groundwater levels) to steadily decline in many aquifers
over extensive regions (Wagner et al. 2012). A drop in hydraulic heads of over 15m has been
reported at Ca Mau since the mid 1990s, the current average rate of hydraulic head decline among wells in the Delta is estimated at 26cm/year (ranging 9-78cm/year)(Erban et al. 2014).
The decline in hydraulic head has caused widespread aquifer drawdown in a 100km wide area northwest of Ca Mau to Ho Chi Minh City. Based on time-series data from 79 nested
monitoring wells, the compaction of sedimentary layers at these locations is calculated to be
causing land subsidence at an average rate of 1.6cm/year (range: 0.28-0.31cm/year), if groundwater extraction continues at present rates, ∼0.88m (0.35–1.4m) of land subsidence is
expected by 2050 (Erban et al. 2014).
1.6.3.4 Salinity intrusion
In dry years, such as 1998, salinity intrusion can be pervasive in the coastal and intertidal
zones of the delta, with as much as 35% of the delta experiencing salinity levels greater than 4g/L. Ca Mau is the most affected province in the delta with 90% of the province area
affected in dry years, followed by the delta estuary provinces of Ben Tre, Bac Lieu and Soc Trang (60-79%). In these provinces saline conditions can persist for more than 40 days during
the year and up to 100 days in Ca Mau, with maximum salinity concentrations reaching ocean-
levels of 30-35g/l. In the coastal areas, seawater intrudes into land through the rivers and canals. The Ca Mau peninsula is most influenced by saline water as seawater intrudes from both sides
on the east and the west coasts with different tidal regimes.
15
1.6.3.5 Water quality
The variation in water quality of the flooded areas of the Mekong Delta is complicated as it is dominated by climate, hydrology, soils, and human activities. The levels of soluble
substances of Na, K, Ca2+, Mg2+, Fe2+, Al3+, SO42-, Cl-, HCO3
- varies with season (MDP 2011). The dry season values are usually higher than those in the flood season, but are generally still
below critical thresholds. Surface water pollution in the Mekong delta is characterized by high
concentrations of coliform (300.000-1500.000 unit/100ml on average) from human, livestock, and poultry. Effluents from industrial sources and untreated effluent from aquaculture and
agriculture also affect surface water quality. Every year the agricultural sector uses around 2 million tons of chemical fertilizers and 500,000 tons of plant protection pesticides.
The Environment Monitoring Center (2012) reported that organic pollution of surface water in
the Mekong Delta is showing a decreasing trend in recent years. Measurements of COD and BOD5 on the mainstream Hau River were reportedly low and meeting Vietnamese standards
(QCVN 08:2008/BTNMT for class A21). Pollution level on the mainstream Tien river was higher than Hau river but still meeting the standards for class A2. Concentrations of N-NH4+
and N-NO3 at the monitoring sites on Hau and Tien Rivers were low, meeting Vietnamese
Standards (QCVN-08:2008 for class A12), suitable for domestic water supply, irrigation, and aquaculture purposes.
1.6.4 Biodiversity and ecosystems
1.6.4.1 Wetlands
The Mekong Delta is a highly modified landscape with most of the natural wetlands
converted to agriculture land relying on the networks of canals for irrigation. Although the delta has been substantially modified for the intensification of rice-based agriculture it still
supports a diverse biota (Campbell 2012). The delta consists of a variety of landscapes, ranging from tidal flats, sandy ridges and tidal back swamps in the coastal plains, estuaries at river
mouths, to river flood plains, broad depressions, peat swamps, alluvial levees and terraces
further inland (Thinh 2003). The habitats of the delta are dominated by wetlands (Figure 9). The wetlands are among the richest ecosystems in the basin and are important breeding sites
for many aquatic species migrating from upper reaches of the Mekong River (Vietnam Environmental Protection Agency 2005).
1 A2 – water can be used for domestic purposes with appropriate treatments; conservation of aquatic life; and
other purposes in lower categories (B1 and B2 for navigation, irrigation, and other purposes that do not require high quality water) 2 A1—water is good for domestic purposes and other purposes in the lower categories (A2, B1, and B2)

16
Figure 9: Wetland types in the Mekong Delta
The wetlands of the Mekong Delta can be broadly categorized into three groups:
1. Saline wetlands: distributed along the east and west coast along with the coastal
mangrove belt. The mangrove forest cover used to be more extensive but has steadily declines for the development of shrimp aquaculture. Saltwater lagoons are also found
in the west coast, including the Dong Ho lagoon in Ha Tien, Kien Giang and the Thi
Tuong lagoon in Ca Mau;
2. Inland wetlands: are dominated by melaleuca forest and seasonally inundated
grassland habitats. Melaleuca forest and grassland used to cover most of the acid sulphate soil zones but now remain mainly in the U Minh protected areas in Kien Giang
and Ca Mau, the Ha Tien grasslands near the border with Cambodia in Kien Giang,
POR in Dong Thap and LXQ in An Giang; and
3. Estuarine wetlands: distributed mainly at the mouth of the Mekong River in Long An,
Tien Giang, Ben Tre, Tra Vinh, and Soc Trang are seasonal saltwater wetlands.
1.6.4.2 National Parks and Nature Reserves
The natural resource areas including national parks and natural reserves have increased
in the Mekong Delta. The natural resource areas were recently updated under the Law on Biodiversity issued by Decision 1107/QD-BTNMT on May 12, 2015. Details of the 5 national
parks and 6 nature reserves in the Delta are presented in Table 2.
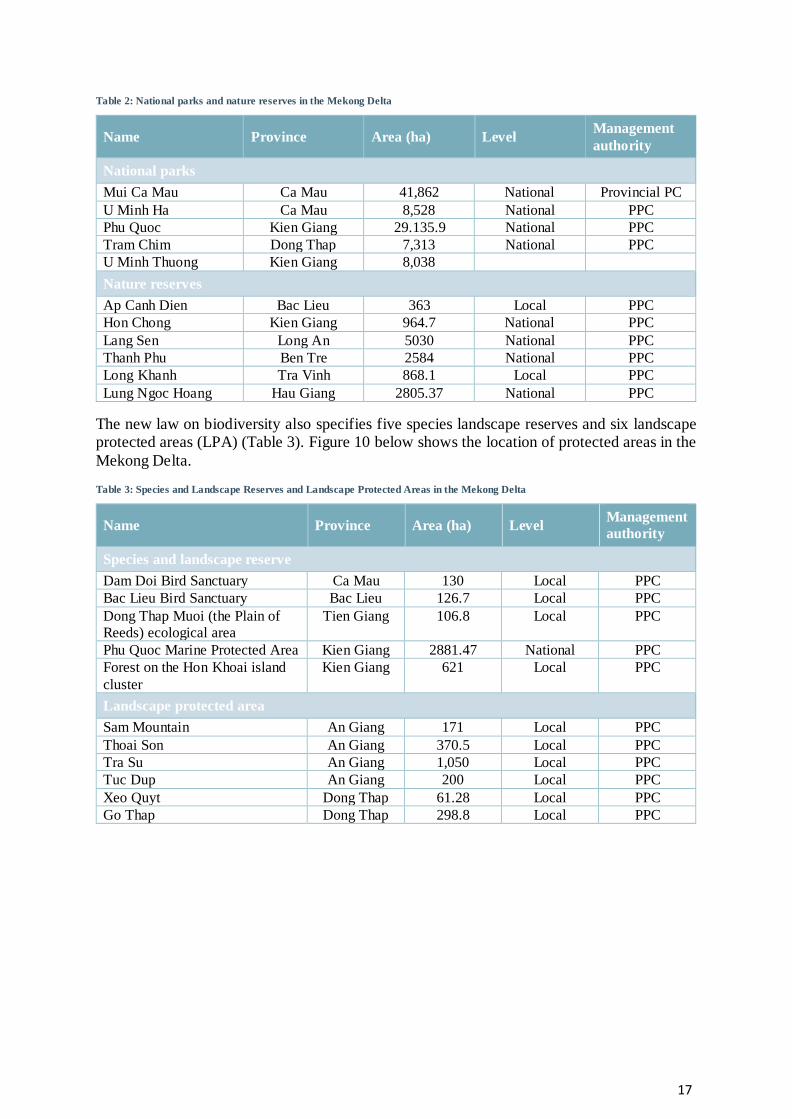
17
Table 2: National parks and nature reserves in the Mekong Delta
Name Province Area (ha) Level Management
authority
National parks
Mui Ca Mau Ca Mau 41,862 National Provincial PC
U Minh Ha Ca Mau 8,528 National PPC
Phu Quoc Kien Giang 29.135.9 National PPC
Tram Chim Dong Thap 7,313 National PPC
U Minh Thuong Kien Giang 8,038
Nature reserves
Ap Canh Dien Bac Lieu 363 Local PPC
Hon Chong Kien Giang 964.7 National PPC
Lang Sen Long An 5030 National PPC
Thanh Phu Ben Tre 2584 National PPC
Long Khanh Tra Vinh 868.1 Local PPC
Lung Ngoc Hoang Hau Giang 2805.37 National PPC
The new law on biodiversity also specifies five species landscape reserves and six landscape protected areas (LPA) (Table 3). Figure 10 below shows the location of protected areas in the
Mekong Delta.
Table 3: Species and Landscape Reserves and Landscape Protected Areas in the Mekong Delta
Name Province Area (ha) Level Management
authority
Species and landscape reserve
Dam Doi Bird Sanctuary Ca Mau 130 Local PPC
Bac Lieu Bird Sanctuary Bac Lieu 126.7 Local PPC
Dong Thap Muoi (the Plain of
Reeds) ecological area
Tien Giang 106.8 Local PPC
Phu Quoc Marine Protected Area Kien Giang 2881.47 National PPC
Forest on the Hon Khoai island
cluster
Kien Giang 621 Local PPC
Landscape protected area
Sam Mountain An Giang 171 Local PPC
Thoai Son An Giang 370.5 Local PPC
Tra Su An Giang 1,050 Local PPC
Tuc Dup An Giang 200 Local PPC
Xeo Quyt Dong Thap 61.28 Local PPC
Go Thap Dong Thap 298.8 Local PPC

18
Figure 10: Mekong Delta protected areas
1.6.4.3 Flora
In terms of vegetation, the distribution of natural and semi-natural vegetation
communities in the delta depend on a combination climatic, soil, and hydrological
conditions. The vegetation of the delta can be broadly divided into freshwater and saline water communities, and further classified to freshwater communities in riverbank vegetation,
lowland forests and marshes, and aquatic vegetation associated with rivers and waterways (Le
Cong Kiet 1994). The dominant tree species in the lowland forest and marshes in the delta such as the POR, LXQ and U Minh peat swamp forest is Melaleuca cajuputi. A diversity of other
plant species is also recorded in the Melaleuca forests, including: 134 flora species in the U Minh Ha National Park and 130 flora species in Tram Chim National Park including 14 woody
tree species, 2 shrub, 5 climber, and 109 herby plant species (Thinh 2003).
The saline communities consist mainly of mangrove forests. There are at least 40 species of mangroves plants including, Rhizophora, Avicenia, Bruguiera, Ceriop, Sonneratia,
Xylocarpus, Aegiceras, Lumnitzera and Acanthus. The distribution of these species depends on soil fertility, tidal influences and salinity (Thinh 2003). For instance, R. Mucronata, and A.
marina can grow in areas of high saline (20 –30%) and R. apiculata and A. officinalis can grow
in moderately saline areas. N. fruticans and K. candel grow in slightly saline or brackish water areas. Avicenia alba is a pioneer species occurring in newly accreted mud flats while
Rhizophora species occupy higher grounds. Further inland in brackish water areas the Rhizomatous palm and Nypa palm are recorded. S. caseolaris is the dominant species at slightly
19
saline environment at the mouths of the Mekong at as Cua Dai, Ham Luong, and Co Chien. In
Ca Mau peninsular A. alba, A. marina, A. officinalis and R. apiculata grow densely in muddy swampy areas along the coast and in less saline areas Lumnitzera and Ceriopsare were found.
1.6.4.4 Fauna
The Mekong Delta boasts a rich fauna biodiversity due to its vast wetlands. The fauna of
the delta includes 23 species of mammals, 386 species and subspecies of birds, 35 species of
reptiles and six species of amphibians (Thinh 2003). The mammals include five species of dolphin, the crab eating Macaque fascularis, smooth-coated Otter Lutragale perspicilata and
fishing cat Prionailurus viverrina. While there are only two mammals of conservation significance (the Hairy-nosed Otter and the Dugong) remaining in the delta there are at least
37 species of birds and 470 species of fish that have been recorded, of which 28 are endemic
to the Mekong and four are known only to exist in the delta (Campbell 2012).
The delta has the largest diversity of fish in the Mekong Basin. From an extensive review
of 45 sources of information on fisheries in the Mekong Basin, there is a strong gradient of species richness from the headwaters down to the sea with 24 species in Tibet and 486 species
in the delta (Baran 2010). This phenomenon reflects the fact that hydrological predictability
and habitat diversity increase downstream, allowing more species to develop. The delta is the area characterized by the highest species diversity, because of the combination of estuarine,
freshwater, and marine faunas. The aquatic invertebrate fauna of the delta has been substantially impacted by humans, with the littoral fauna of the main channels particularly
species poor, probably reflecting the intensity of human impact in those locations. (Ian
Campbell, 2012).
1.6.4.5 The coastal plume
The Mekong Basin is also considered to extend ecologically into coastal marine waters
known as the “Mekong Plume”, where productivity of coastal fisheries depends on the
nutrients attached to the sediments distributed by the Mekong River. The Mekong River
contributes around 16,000 – 17,000 tons of attached nutrients to coastal Vietnam, which supports productive fisheries harvesting 0.5 to 0.7 million tons of fish per year (Baran 2012).
Very little is known about the trends and extent of the Mekong sediment plume, but it plays two important functions for the delta:
Introduces nutrient rich silt into the marine environment, which plays an important role in the highly productive marine fisheries of the Mekong delta. Trash fish from marine
fisheries are also an important source of food‐pellets used extensively in the Mekong
Delta to support its large aquaculture industry; and
Responsible for delta building and the preservation of mangrove coastlines –
particularly in Ca Mau province (ICEM 2010).
1.6.4.6 Physical cultural resources
There are a number of physical cultural resources or national heritage sites of significance to people in the Mekong Delta. Physical cultural resources are defined as
property, site, monument, building or group of buildings with paleontological, archaeological,
historical, cultural, artistic, religious, spiritual or symbolic value for a nation, people or community (IUCN 2015). Any direct or regional impacts on the physical cultural resources

20
listed in Table 4 below will need to be considered in the environment and social management
framework (ESMF) for any future projects.
Table 4: Physical cultural resources in the Mekong Delta
Province Physical cultural resources
Long An Tôn Thạnh Pagoda (Can Giuoc district)
1000-pillar house (Can Duoc district)
Nhựt Tảo rivulet mouth (Tan Tru district)
Tien Giang Vĩnh Tràng Pagoda (My Tho city), Thủ Khoa Huân Tomb and Temple (Cho Gao
district)
Trương Định Temple, Hoàng Gia Tomb (Go Cong district)
Gò Thành Relic (Cho Gao district)
Ben Tre Phú Lễ Temple, Nguyễn Đình Chiểu Tomb (Ba Tri district)
Tiên Thủy Temple (Chau Thanh district)
Cồn Phụng Islet (Chau Thanh district)
Dong Thap Gò Tháp Relic (Thap Muoi district)
Kiến An Cung Pagoda (Sa Dec Town)
Sa Dec flower village (Sa Dec Town)
An Giang Bà Chúa Xứ Temple, Tây An Pagoda (Chau Doc Town)
Nui Sam Relic cluster
Oc Eo Cultural Relic (Thoai Son district), Ba Chúc Charnel-house (Tri Ton
district)
Kien Giang Nguyễn Trung Trực Temple
Phật Lớn Pagoda, Sắc Tứ Tam Bảo Pagoda (Rach Gia Town),
Đá Dựng Mountain, Mạc Cửu Tomb (Ha Tien Town)
Can Tho Bình Thủy Temple, Long Quang Pagoda (Binh Thuy district)
Ông Temple (Ninh Kieu district)
Cái Răng floating market (Cai Rang district)
Hau Giang Ngã Bảy floating market (Phung Hiep district)
Tra Vinh Ba Om Pond, Phước Minh Cung Pagoda (Tra Vinh town)
Soc Trang Mahatup Pagoda, Kh’Leang Pagoda (Soc Trang city)
Bac Lieu Đồng Nọc Nạng Relic (Gia Rai district)
Vĩnh Hưng Tower (Vinh Loi district)
Thành Hoàng Cổ Temple , Công Tử Bac Liêu House (Bac Lieu city)
Cỏ Thum Pagoda (Hong Dan district)
Ca Mau Đá Bạc Island (Tran van Thoi district
Hòn Khoai Island (Ngoc Hien district)
1.7 Socio-economic description of the Mekong Delta
The development success of the delta can be attributed to two important factors. First the
natural supply of freshwater and nutrient-laden sediments by the Mekong River annually
transforms the delta providing the vital ingredients for productivity. On average some 120 million tons of sediment are transported downstream with the floods into the Mekong Delta of
Vietnam with approximately 15-20% deposited on the delta’s floodplains and the remainder

21
transported into the marine environment contributing to important delta building processes
(ICEM, 2012).
Second the Government of Vietnam has since the late 1960s supported ambitious master
planning efforts with the guiding mandate being the control of the delta’s freshwater hydrology to enable multiple rice crops each year (Kakkonen et al, 2008). These planning initiatives,
which emphasized the role of water control infrastructure began to take effect in the 1980s after
the American War and accelerated in the post Doi Moi era of the 1990s, had a tremendous effect in increasing rice production in the Mekong Delta but adverse effects on the delta’s
connectivity and on the wide array of fresh, brackish and marine habitats which had previously covered the delta and which were responsible for the delta’s former high biodiversity. Today
some 75% of the Vietnamese Mekong Delta is agriculture land (mainly multiple rice cropping
paddies), and at least 13,000km of dykes and 42,000km of primary and secondary canals have been constructed.
1.7.1 Demographics
1.7.1.1 Population
From 1990 to 2010 the population in the Mekong Delta increased from 14.7 million to 17.5
million people (Figure 11). The annual population growth rate decreased slightly from 1.1% between 1990-2000 to 0.52% from 2001-2013. In 2013, about 76% of total population still
lived in rural areas of the Mekong Delta. Rural-migration has occurred as a result of urbanization and industrialization. Rural people often migrate to urban areas within provinces
or to Can Tho and the south-east region of the Mekong delta (including Ho Chi Minh City) in
search of employment. The annual growth rate of urban population increased from 2.7% between 1990-2000 to 3.1% between 2001-2013. Rural areas experienced marginal growth of
0.8% between 1990 -2000 and a negative net migration rate caused the population to decrease by -0.2% between 2001-2013.
Figure 11: Urban and rural population in the Mekong Delta
The population density of the Mekong Delta is shown below in Figure 12.
0
2
4
6
8
10
12
14
16
18
19
90
19
92
19
94
19
96
19
98
20
00
20
02
20
04
20
06
20
08
20
10
20
12
Po
pu
latio
n (m
illio
n p
eo
ple
)
Rural
Urban
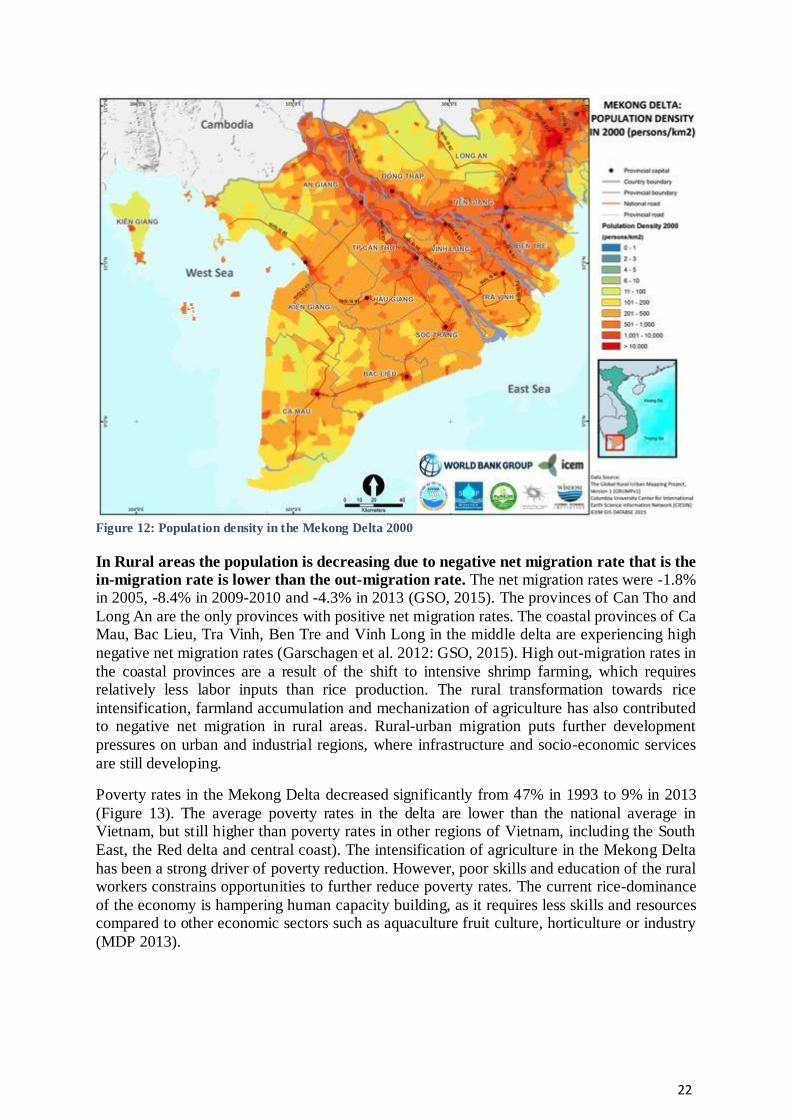
22
Figure 12: Population density in the Mekong Delta 2000
In Rural areas the population is decreasing due to negative net migration rate that is the
in-migration rate is lower than the out-migration rate. The net migration rates were -1.8% in 2005, -8.4% in 2009-2010 and -4.3% in 2013 (GSO, 2015). The provinces of Can Tho and
Long An are the only provinces with positive net migration rates. The coastal provinces of Ca Mau, Bac Lieu, Tra Vinh, Ben Tre and Vinh Long in the middle delta are experiencing high
negative net migration rates (Garschagen et al. 2012: GSO, 2015). High out-migration rates in
the coastal provinces are a result of the shift to intensive shrimp farming, which requires relatively less labor inputs than rice production. The rural transformation towards rice
intensification, farmland accumulation and mechanization of agriculture has also contributed to negative net migration in rural areas. Rural-urban migration puts further development
pressures on urban and industrial regions, where infrastructure and socio-economic services
are still developing.
Poverty rates in the Mekong Delta decreased significantly from 47% in 1993 to 9% in 2013
(Figure 13). The average poverty rates in the delta are lower than the national average in Vietnam, but still higher than poverty rates in other regions of Vietnam, including the South
East, the Red delta and central coast). The intensification of agriculture in the Mekong Delta
has been a strong driver of poverty reduction. However, poor skills and education of the rural workers constrains opportunities to further reduce poverty rates. The current rice-dominance
of the economy is hampering human capacity building, as it requires less skills and resources compared to other economic sectors such as aquaculture fruit culture, horticulture or industry
(MDP 2013).
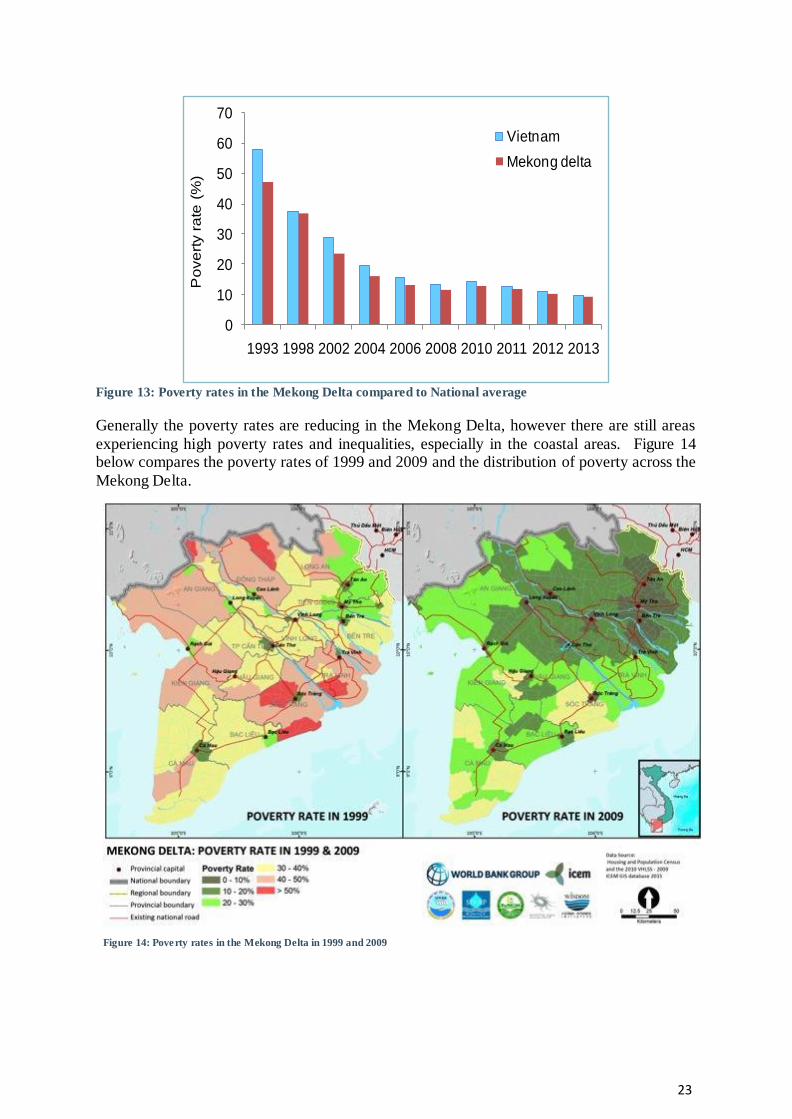
23
Figure 13: Poverty rates in the Mekong Delta compared to National average
Generally the poverty rates are reducing in the Mekong Delta, however there are still areas
experiencing high poverty rates and inequalities, especially in the coastal areas. Figure 14 below compares the poverty rates of 1999 and 2009 and the distribution of poverty across the
Mekong Delta.
Figure 14: Poverty rates in the Mekong Delta in 1999 and 2009
0
10
20
30
40
50
60
70
1993 1998 2002 2004 2006 2008 2010 2011 2012 2013
Po
ve
rty r
ate
(%
)
Vietnam
Mekong delta

24
1.7.1.2 Ethnic minorities
The Chinese group inhabits all provinces, while the Cham people are living only in the An Giang province. The majority of the Khmer people live in Tra Vinh (32%), Soc Trang (31%),
Kien Giang (12%), Bac Lieu (8%) and An Giang (4%) provinces (GSO 2009). Previous studies have revealed that the poverty rates among the Khmer people are higher than that of Kinh and
Chinese communities (AusAid 2004: Nhan et al, 2012). Poor Khmer households accounted for
one in three of the total poor households in highly populated provinces like Tra Vinh and Soc Trang.
Figure 15: Ethnic groups in the Mekong Delta
Over the last two decades, the Vietnamese government has implemented several National Development programmes aimed at reducing poverty and improving livelihoods of ethnic
minority groups, including Khmer people in poor and disadvantaged communes3. These
programmes were successful in improving and diversifying livelihoods and increasing access to social services, credit, markets, and agricultural extension. However, studies have shown
that Khmer households generally have less opportunity to generate wealth than other ethnic groups due to limited human and social capital (Nhan et al. 2008; Nhan et al. 2012).
1.7.2 Livel ihoods
The livelihoods of rural households are characterised by access to five capitals: 1) natural 2) physical 3) human 4) financial, and (5) social. In the Mekong delta, rural people and farmers
face multiple threats to their livelihoods. The resilience of the households to respond to environmental and socio-economic challenges depends on access to the five capitals. For rural
households in the delta, livelihood capacity depends upon agro-ecological zones, infrastructure
and farm size. Generally, people living in more favourable zones have higher capacity than those in lesser favourable zones. Favourable biophysical conditions include fertile soils, year-
round availability of freshwater, effective irrigation (and drainage) systems, semi-flood depth or without salinity intrusion. Rural households with large farms usually have higher resilience
to natural and socio-economic shocks than those with smaller farms.
3 Programme 134 “improved housing, safe water supply and agricultural land for poor ethnic minority people”; Programme 135 “Socio-economic Development of the Most Vulnerable Communes in Ethnic Minority and Mountainous Areas”; Programme 138 “infrastructure development of centres and improvement of settlement ethnic minority households of remote or disadvantaged rural communes
Kinh92.0%
Khmer6.9%
Chinese1.0%
Cham0.1%

25
1.7.2.1 Natural capital
The livelihoods of people living in the delta are highly dependent on natural resources. Agricultural production in most areas remains small-scale, an average of 48% of households
owned less than 0.5 ha, 42% owned 0.5-2 ha and 10% owned more than 2 ha of farmland (GSO 2012). For farmers in the delta, livelihoods largely depend on rice, which on average shares a
60% (in rainfed, brackish or saline zone) and 80% (in flood or alluvial zones) of farmland. The
farming areas for rice, agriculture and aquaculture in the the Mekong Delta are shown below (Figure 16). Flooding (or inundation), water quality, salinity intrusion, and droughts in the dry
season are considered threats to natural capital.
Figure 16: Farming areas in the Mekong Delta
1.7.2.2 Physical capital
At community level, rural households have improved access to social services, including
transportation, electricity, schooling, Internet, health services, water and sanitation (based on data from GSO 2012; GSO2007-2013) as summarised below:
Roads: The number of communes that the centre approaches asphalt or concrete increased from 41% in 2001, to 66% in 2006 and 90% in 2011;
National electricity grid: Connections increased from 97% of communes and 90% of households in 2006 to 99% of the communes or 97% of households in 2011;
Schools: The number of communes with concrete schools was 57% for elementary level, 75% for basic secondary level and 91% with high secondary level in 2011,
compared to 34%, 56% and 81% in 2006;
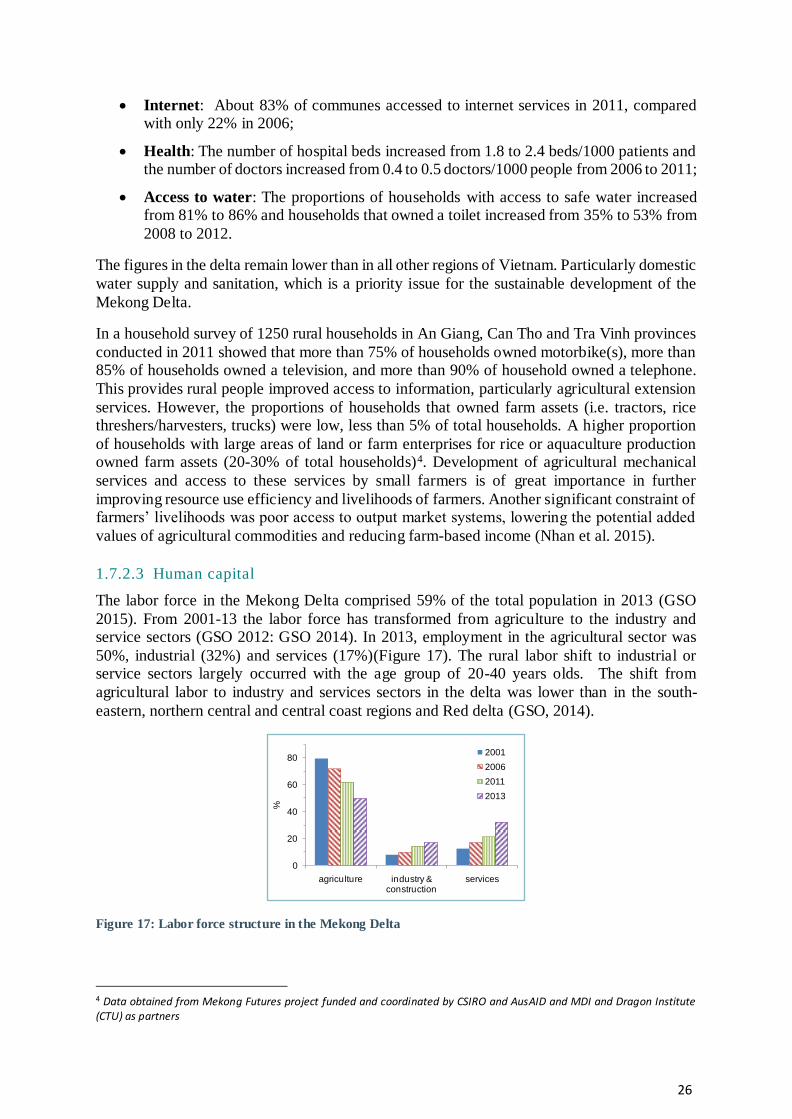
26
Internet: About 83% of communes accessed to internet services in 2011, compared with only 22% in 2006;
Health: The number of hospital beds increased from 1.8 to 2.4 beds/1000 patients and the number of doctors increased from 0.4 to 0.5 doctors/1000 people from 2006 to 2011;
Access to water: The proportions of households with access to safe water increased from 81% to 86% and households that owned a toilet increased from 35% to 53% from
2008 to 2012.
The figures in the delta remain lower than in all other regions of Vietnam. Particularly domestic
water supply and sanitation, which is a priority issue for the sustainable development of the
Mekong Delta.
In a household survey of 1250 rural households in An Giang, Can Tho and Tra Vinh provinces
conducted in 2011 showed that more than 75% of households owned motorbike(s), more than 85% of households owned a television, and more than 90% of household owned a telephone.
This provides rural people improved access to information, particularly agricultural extension
services. However, the proportions of households that owned farm assets (i.e. tractors, rice threshers/harvesters, trucks) were low, less than 5% of total households. A higher proportion
of households with large areas of land or farm enterprises for rice or aquaculture production owned farm assets (20-30% of total households)4. Development of agricultural mechanical
services and access to these services by small farmers is of great importance in further
improving resource use efficiency and livelihoods of farmers. Another significant constraint of farmers’ livelihoods was poor access to output market systems, lowering the potential added
values of agricultural commodities and reducing farm-based income (Nhan et al. 2015).
1.7.2.3 Human capital
The labor force in the Mekong Delta comprised 59% of the total population in 2013 (GSO
2015). From 2001-13 the labor force has transformed from agriculture to the industry and service sectors (GSO 2012: GSO 2014). In 2013, employment in the agricultural sector was
50%, industrial (32%) and services (17%)(Figure 17). The rural labor shift to industrial or service sectors largely occurred with the age group of 20-40 years olds. The shift from
agricultural labor to industry and services sectors in the delta was lower than in the south-
eastern, northern central and central coast regions and Red delta (GSO, 2014).
Figure 17: Labor force structure in the Mekong Delta
4 Data obtained from Mekong Futures project funded and coordinated by CSIRO and AusAID and MDI and Dragon Institute (CTU) as partners
0
20
40
60
80
agriculture industry & construction
services
%
2001
2006
2011
2013

27
The transformation of labor in the delta is complex due to high rates of untrained and unskilled
labor (Fig. 5), only about 4% of labor force had technical or vocational training and about 2.5% of that had college or higher training. The capacity of labor in the delta remains lower than the
other regions in Vietnam (GSO 2014). Figure 18 below shows the labor force qualifications in the Mekong Delta overall and specifically for the agricultural sector.
Figure 18: Labor force qualification in the Mekong Delta a) Overall b) Agricultural sector
The transition of rural labor requires labor force to become more specialized and diversified.
Better-off farming households will look to accumulate agricultural land and modernize
agricultural activities for market integration (i.e. stepping up from agriculture) and the non-agricultural sectors can be expand by improving rural infrastructure (i.e. stepping out from
agriculture) (Dorward et al 2009). This creates both opportunities for employment for poor households, as well as further demands for agricultural development for better-off farming
households. Better infrastructure and job opportunities are required to attract labor in rural
areas. Currently, unskilled and/or young labor tends to migrate to urban and industrial centers, mostly to Ho Chi Minh City or the south-east region of the delta (Garschagen et al. 2012).
1.7.2.4 Financial capital
Agricultural activities are still the main income source of a majority of household in the delta.
Due to the labor shift from agriculture, households with the main source of income from
agriculture reduced from 73% in 2006 to 65% in 2011. At the same time the industry sector increased from 9 to 13% and the services from 16 to 20% (GSO, 2014). Savings per household
increased from $VN 7 million to $VN 21 million, in comparison, household savings in the Red delta increased from $VN 8 million vs. 24 million $VN) (GSO, 2014).
Farming and household income depends on several factors related to farm assets and land
ownership. Farmers with larger areas of land, more available labor and farm assets earned higher income. In the same province or district, farmers living in more favourable areas and
having more diverse sources of income had higher farm-based and household income (Nhan et al. 2015). Results from the Mekong Futures project5 demonstrate that households that were
classified as intermediate wealth with a farm size of 0.4-0.7 ha had an average monthly income
of just one million $VN/capital or two million $VN/labor. This income level is just above the poverty line issued by Vietnamese government in 2013. Among agro-ecological zones,
households in the transition between fresh and brackish water had lower income than those in other zones (Nhan et al. 2012). This implies livelihoods of people in this zone are more
vulnerable to freshwater availability from the upstream, to salinity intrusion from estuaries
and/or adjacent shrimp farming areas and to extreme dry-season droughts.
5 Mekong Futures project was funded and coordinated by CSIRO and AusAID and MDI and Dragon Institute (CTU) as partners
0
0.5
1
1.5
2
2.5
technical vocational college university and higher
%
2006
2011
0
0.2
0.4
0.6
0.8
1
1.2
1.4
technical vocational college university and higher
%
2006
2011
(a) (b)

28
Small farmers have limited financial savings from low farming incomes, particularly those in
acid sulphate or rainfed zones. Farmer income is also affected by high interest for informal credits from local agro-chemical businesses. About 70-90% farmers got informal in-kind credit
sources locally, due to the ease of access, compared to formal micro-credit programmes by the government (Nhan et al. 2015). Further improvement of formal micro-credit programs for rural
people is essential for further increases in livelihoods and financial security.
1.7.2.5 Social capital
Social capital is reflected by participation of households in community-based organisations
(CBOs), and in decision making in local development plans. Relatively more rural households in flood and alluvial zones participated in CBOs than those in other zones. For example, about
30% of farming households in the flood or alluvial zones had members participating in
Farmer’s Association, Women’s Union or Agricultural Extension Clubs compared to 23% of those in acid sulphate soil and 17% in saline ecological zone (Dung et al. 2014). Poorer
households also had members participating in CBOs (Nhan et al 2012). Increased participation of rural households in CBOs is important for social networking and to improve knowledge on
more efficient resources use to improve adaptive capacity of rural households.
1.7.3 Agricultural Sector
The Mekong delta is considered an important agricultural region of Vietnam. In 2010, the
economic structure in the Mekong Delta was 39 % for agriculture, 28 % for trading and services and 18 % for the industry and construction sector (GSO 2011). The share of the agricultural
sector to the total economic value in the Mekong Delta reduced from 2000 (54% agriculture,
28% trading and services and 18% for industry and construction) to 2010 due to transformation of the economy, but was still higher than the national average of 21% for agriculture. Foreign
Development Investment (FDI) remains relatively low in the delta. From 2010 to 2013, the share of the delta to the country in FDI capital was about 5%, much lower than that of the Red
delta, the north central and central coastal region and the south-east region that contributed
from 20% to 45% (GSO, 2013). For the whole delta, total output values can only meet about 70% of budget for investment in local development. Among the 13 provinces in the delta, only
Can Tho is able to contribute to the national budget, the other provinces rely on annual financial assistance from the State.
Rice, horticulture and aquaculture (Pangasius catfish and shrimp) are the main agricultural
commodities of the Mekong Delta. Rice and aquaculture production have been contributing significantly to national food security as well as to national agricultural exports. Rice and
aquaculture in the delta shared about 53% and 70% of total production and about 90% and 70% of total export volume of Vietnam (GSO, 2015).
1.7.3.1 Agriculture
The major land use patterns for agricultural production are primarily determined by soil and hydrological conditions. Over the last three decades, changes in agricultural land uses
and agricultural development have been strongly influenced by a combination of drivers, including policy reforms, irrigation development, export markets, technological advances,
environmental changes, urbanisation and industrialization (Garschagen et al. 2012). The trends
of agriculture (rice, fruit and vegetables) are shown below in Figure 19. Rice growing areas increased significantly between 1990-1999, as a result of the “rice first” policy by the
government. However, rice-growing areas declined in the period between 2000-2007 as a result of policies promoting agricultural diversification. From 2000-2013 the areas of fruit and

29
vegetable area increased 3% and 7% per year, respectively.
Figure 19: Trends of agriculture (rice, fruit, vegetables) from 1990-2012. Standardized data with Z-score
In 2000, recognising the importance of aquaculture and fruit production for sustainable development of the agricultural sector the Vietnamese government implemented the policy on
agricultural diversification and sustainability (Decree no. 09/2000/NQ-CP dated 15th June
2000). In response many farmers shifted from rice production to aquaculture, to fruits or vegetables or from rice monoculture to a more diversified rice-based farming system with
higher potential for increased income generation (Nhan et al. 2007).
From 2007-2013, the rice growing area again increased in response to the development of
irrigation and flood-control systems and the rice export promotion policy of the government.
The increase in rice growing areas came from the development of the third crop (summer-autumn crop), with annual growth rate of 2% (Figure 20). In contrast, growing area of
traditional rice production decreased by an average of -2% per year in the period 2000-2013, due to the shift to high-yielding rice and/or shrimp culture.
Figure 20: Rice area by crop in the Mekong Delta from 2000-2013
Total rice production increased between 1990-2013 due to the contribution of high-yielding
rice crops in winter-spring and summer-autumn crops (Figure 21). From 2000-2013, rice production grew 2.4%, 4.4% and 1% with the winter-spring, summer-autumn and traditional
rice crops, respectively. The growth of rice production was higher than the increase in rice growing areas area, reflecting the shift towards rice intensification. From 2000-2013 the areas
of fruit and vegetable area increased 3% and 7% per year, respectively.
-2.5
-1.5
-0.5
0.5
1.5
1990 1992 1994 1996 1998 2000 2002 2004 2006 2008 2010 2012
Z-s
co
re
Rice area
Fruit area
Vegetable area
Rice production
-
500
1,000
1,500
2,000
2,500
2000 2002 2004 2006 2008 2010 2012
Are
a (1
00
0 h
a)
Winter-spring
Summer-autumn
Traditional crop
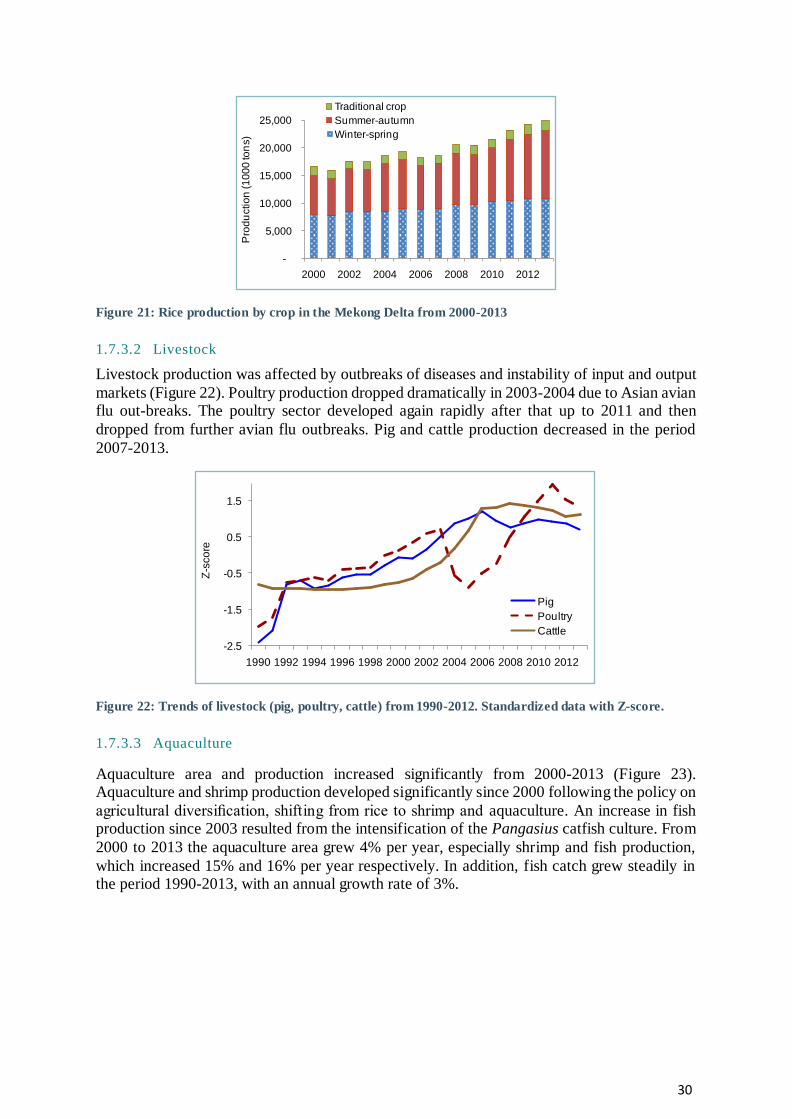
30
Figure 21: Rice production by crop in the Mekong Delta from 2000-2013
1.7.3.2 Livestock
Livestock production was affected by outbreaks of diseases and instability of input and output
markets (Figure 22). Poultry production dropped dramatically in 2003-2004 due to Asian avian flu out-breaks. The poultry sector developed again rapidly after that up to 2011 and then
dropped from further avian flu outbreaks. Pig and cattle production decreased in the period
2007-2013.
Figure 22: Trends of livestock (pig, poultry, cattle) from 1990-2012. Standardized data with Z-score.
1.7.3.3 Aquaculture
Aquaculture area and production increased significantly from 2000-2013 (Figure 23). Aquaculture and shrimp production developed significantly since 2000 following the policy on
agricultural diversification, shifting from rice to shrimp and aquaculture. An increase in fish production since 2003 resulted from the intensification of the Pangasius catfish culture. From
2000 to 2013 the aquaculture area grew 4% per year, especially shrimp and fish production,
which increased 15% and 16% per year respectively. In addition, fish catch grew steadily in the period 1990-2013, with an annual growth rate of 3%.
-
5,000
10,000
15,000
20,000
25,000
2000 2002 2004 2006 2008 2010 2012
Pro
du
ctio
n (1
00
0 to
ns)
Traditional crop
Summer-autumn
Winter-spring
-2.5
-1.5
-0.5
0.5
1.5
1990 1992 1994 1996 1998 2000 2002 2004 2006 2008 2010 2012
Z-s
co
re
Pig
Poultry
Cattle
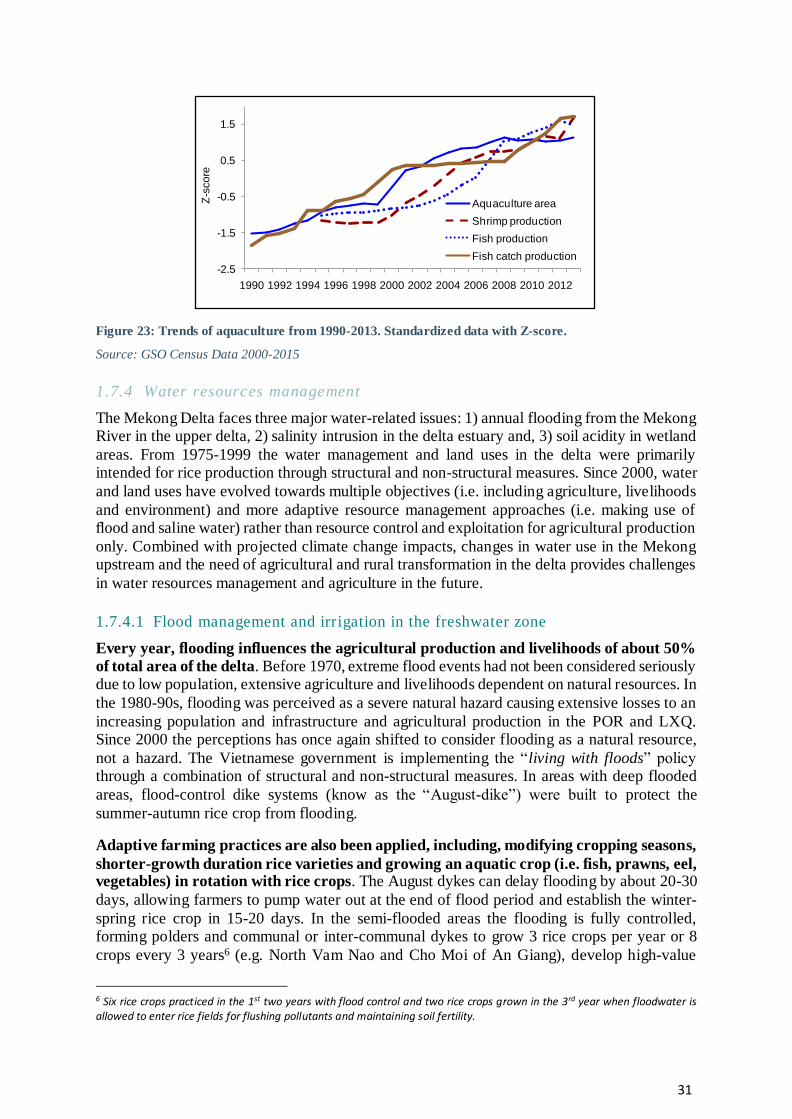
31
Figure 23: Trends of aquaculture from 1990-2013. Standardized data with Z-score.
Source: GSO Census Data 2000-2015
1.7.4 Water resources management
The Mekong Delta faces three major water-related issues: 1) annual flooding from the Mekong River in the upper delta, 2) salinity intrusion in the delta estuary and, 3) soil acidity in wetland
areas. From 1975-1999 the water management and land uses in the delta were primarily intended for rice production through structural and non-structural measures. Since 2000, water
and land uses have evolved towards multiple objectives (i.e. including agriculture, livelihoods
and environment) and more adaptive resource management approaches (i.e. making use of flood and saline water) rather than resource control and exploitation for agricultural production
only. Combined with projected climate change impacts, changes in water use in the Mekong upstream and the need of agricultural and rural transformation in the delta provides challenges
in water resources management and agriculture in the future.
1.7.4.1 Flood management and irrigation in the freshwater zone
Every year, flooding influences the agricultural production and livelihoods of about 50%
of total area of the delta. Before 1970, extreme flood events had not been considered seriously due to low population, extensive agriculture and livelihoods dependent on natural resources. In
the 1980-90s, flooding was perceived as a severe natural hazard causing extensive losses to an
increasing population and infrastructure and agricultural production in the POR and LXQ. Since 2000 the perceptions has once again shifted to consider flooding as a natural resource,
not a hazard. The Vietnamese government is implementing the “living with floods” policy through a combination of structural and non-structural measures. In areas with deep flooded
areas, flood-control dike systems (know as the “August-dike”) were built to protect the
summer-autumn rice crop from flooding.
Adaptive farming practices are also been applied, including, modifying cropping seasons,
shorter-growth duration rice varieties and growing an aquatic crop (i.e. fish, prawns, eel, vegetables) in rotation with rice crops. The August dykes can delay flooding by about 20-30
days, allowing farmers to pump water out at the end of flood period and establish the winter-
spring rice crop in 15-20 days. In the semi-flooded areas the flooding is fully controlled, forming polders and communal or inter-communal dykes to grow 3 rice crops per year or 8
crops every 3 years6 (e.g. North Vam Nao and Cho Moi of An Giang), develop high-value
6 Six rice crops practiced in the 1st two years with flood control and two rice crops grown in the 3rd year when floodwater is allowed to enter rice fields for flushing pollutants and maintaining soil fertility.
-2.5
-1.5
-0.5
0.5
1.5
1990 1992 1994 1996 1998 2000 2002 2004 2006 2008 2010 2012
Z-s
co
reAquaculture area
Shrimp production
Fish production
Fish catch production
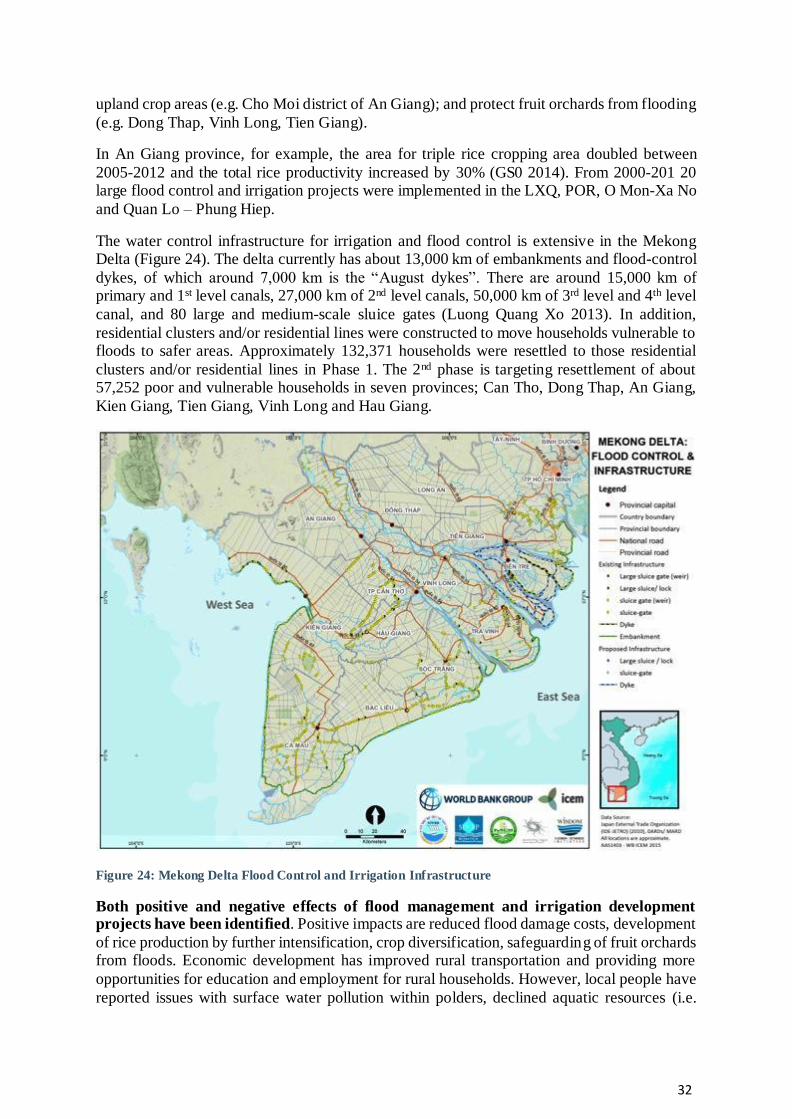
32
upland crop areas (e.g. Cho Moi district of An Giang); and protect fruit orchards from flooding
(e.g. Dong Thap, Vinh Long, Tien Giang).
In An Giang province, for example, the area for triple rice cropping area doubled between
2005-2012 and the total rice productivity increased by 30% (GS0 2014). From 2000-201 20 large flood control and irrigation projects were implemented in the LXQ, POR, O Mon-Xa No
and Quan Lo – Phung Hiep.
The water control infrastructure for irrigation and flood control is extensive in the Mekong Delta (Figure 24). The delta currently has about 13,000 km of embankments and flood-control
dykes, of which around 7,000 km is the “August dykes”. There are around 15,000 km of primary and 1st level canals, 27,000 km of 2nd level canals, 50,000 km of 3rd level and 4th level
canal, and 80 large and medium-scale sluice gates (Luong Quang Xo 2013). In addition,
residential clusters and/or residential lines were constructed to move households vulnerable to floods to safer areas. Approximately 132,371 households were resettled to those residential
clusters and/or residential lines in Phase 1. The 2nd phase is targeting resettlement of about 57,252 poor and vulnerable households in seven provinces; Can Tho, Dong Thap, An Giang,
Kien Giang, Tien Giang, Vinh Long and Hau Giang.
Figure 24: Mekong Delta Flood Control and Irrigation Infrastructure
Both positive and negative effects of flood management and irrigation development projects have been identified. Positive impacts are reduced flood damage costs, development
of rice production by further intensification, crop diversification, safeguarding of fruit orchards from floods. Economic development has improved rural transportation and providing more
opportunities for education and employment for rural households. However, local people have
reported issues with surface water pollution within polders, declined aquatic resources (i.e.
33
capture fisheries) and less sediments and nutrients for natural fertilisation (Nhan et al. 2012).
Increasing inputs and application of fertilisers, combined with surface water pollution,
declining aquatic resources and reduced income are impacting the sustainability of rice
intensification. Surface water pollution comes from the residues of agro-chemicals (i.e. pesticides and fertilisers) and organic matter from rice intensification when flushing water from
canals. Natural aquatic resources that support livelihoods of the poor are declining from fish
migration being blocked by dykes and increased application of fertilisers and pesticides in rice fields. Farmers have also reported that their rice fields are less fertile from reduced alluvial
deposition from flood control structures. They are now investing in a higher rate of chemical fertilisers and other agro-chemicals to maintain high yields or income of rice crops, increasing
rice production costs. An analysis of rice production in the delta from 1995-2006 found that
increases in the costs of fertilisers, fuel and labor were reducing farm-based income from rice production (Nhan 2009).
A sustainable approach was planned to grow eight rice crops every three years to maintain soil fertility and the ecosystem services of floodplains. However, farmers are growing rice crops
continuously without opening sluices to refresh the floodplains. The polders are increasing
water levels in main canals, which can lead to severe inundation in other areas of the LXQ and unexpected changes in the morphology of river networks from deposition or erosion (Hoa et
al. 2007; Tri et al. 2011). Resource use efficiency and transboundary impacts need to be considered further in in future water management plans.
The local government and farmers have implemented a combination of structural and
non-structural measures to mitigate the problems. Small-scale domestic water supply systems and on-farm irrigation structures have been developed. Local government have
promoted participatory irrigation management (PIM) and sustainable farming like the “1 must - 5 reductions” practice7 in rice culture (i.e. North Vam Nao project area in Phu Tan district of
An Giang). In addition, local government are promoting rotational rice-based farming systems,
replacing one rice crop with a short-duration upland crops and practicing small-scale aquaculture in paddy fields. Farming technologies, including alternate wetting-drying
irrigation, reduced cropping-duration practices and replacing triple rice with more sustainable farming systems are needed to maintain the ecosystem services of floodplains while improving
livelihoods of rural households. Appropriate production organisation and better service
supplies for farming inputs and outputs and vocational training packages will provide further benefits for farmers.
1.7.4.2 Managing salinity in the coastal zone and estuaries
Salinity intrusion affects the agricultural activities and livelihoods of around 40% of the
delta in the dry season. In March – April, the combined low flows of the Mekong and the tidal influence push salinity intrusion up 40-50 km inland. To implement the “rice-first” policy
for national food security and export the Vietnamese government with funds from the State and the World Bank invested in a series of salinity-control structures in coastal zones. The
projects aimed to control salinity intrusion and to use freshwater from the Mekong and Bassac
rivers for rice intensification, upland crop production and maintaining domestic water supply. Large-scale salinity-control projects were developed including the Go Cong (38,000 ha), South
Mang Thit (267,000 ha), Quan Lo-Phung Hiep (350,000 ha) and Ba Lai (133,875 ha) (Vo & Pham 2005). Subsequently, around 450km of sea dykes, 1,290 km of main river/canal dykes
and 7,000 km of tertiary and quaternary canal dykes with sluices were constructed (Luong
7 Must use certified seed and reduce seed, fertilizer, pesticide, irrigation water and harvest loss rates
34
Quang Xo 2013). By doing so, the government hoped that farmers in the saline zones could
intensify rice and other upland crop production and improve their livelihoods.
The shift to rice production resulted in a number of environmental issues and losses of
natural aquatic resources. With salinity control structures and irrigation systems, farmers shifted one crop of low-yielding traditional rice to two or three crops of high-yielding rice.
Farmers experienced problems from poor structural design and operations causing freshwater
shortages in the dry season and acidification of soil and canal water in early rainy periods. Farmers who cultivated rice in acid sulphate soil areas that dominate the coastal zones suffered
production losses due to crop failures. Their rice yields and income dropped, compared to what they earned previously. Farmers and rural households whose livelihoods depend on the natural
resources suffered reduced incomes from shrimp production and fisheries (Truong et al. 2003;
Ut 2004).
Since 2000, the Vietnamese government has recognised the importance of the
diversification of agriculture and aquaculture in improving resource use efficiency and the livelihoods of farmers in the coastal zones. The function of salinity-control structures
was modified from a control oriented to adaption-oriented approach. For instance, shrimp
culture relying on saline water in the dry season is followed by rice culture depending on rainwater in the wet season through proper adjustments in the design and operation of existing
water structures and additional investments in small-scale infrastructure. Considering the socio-economic and environmental impacts of salinity-control measures is critical for land and
water use planning in the coastal zone (Tuong et al. 2003). Saline water is now been utilised as
a resource rather than a problem (Nhan et al. 2012).
Proper adjustments in water management structures has allowed in both the irrigated and
saline-transformed areas (converted from freshwater back to brackish or saline water) to earn higher incomes and improve livelihoods from resource-based diversification of farming
activities. However, a number of environmental issues exist. An example is the Ba Lai salinity-
control structure that has contributed to surface water pollution from agro-chemicals, organic residues of agricultural activities and domestic effluents and prolonged inundation in some
swamp areas (Hoang et al. 2009).
The operation of water infrastructure to satisfy demands of different water uses for
shrimp and rice farming is complicated, and competition over water use remains an issue.
Rice farmers are facing salinity intrusion from adjacent shrimp areas in the early and the late rainy season, while shrimp farms downstream are have dealing with effluent discharges from
rice farms in early rainfall periods from upstream, including agro-chemical residues and acidic water (Nhan et al 2007). Internal conflict exists between shrimp farmers, with water pollution
in canals caused by the effluent from shrimp farm affecting other shrimp farms. Increasingly,
farmers are pumping more groundwater to further intensify upland crops and shrimp production, this is considered one of the main reason for groundwater drawdown and land
subsidence (Erban et al. 2014). Saline or brackish aquaculture also requires relatively lower labor inputs to intensive rice production, causing a high rate of urban-rural migration in the
coastal zones. This issue needs to be considered for future adaptation to expected salinity
intrusion in the coastal delta.
Adopting small-scale irrigation, salinity-management systems and improving farming
practices is reducing conflict over water uses and improving agriculture and livelihoods of people in coastal areas. The “Water Management Square” established 50-100 ha sub plots
for collective management of rice and shrimp production. Water saving techniques for rice

35
production and rainwater storage for vegetable production in the dry season are encouraging
initiatives to deal with freshwater shortages in the dry season. Moreover, farmers have grown rice varieties tolerant to salinity (≤ 4%) or varieties with shorter-growth duration, appropriate
land preparation for flushing salinity from soil and applying agro-chemicals to improve rice crop performance under saline soil conditions (Nhan et al. 2011).
For shrimp production, good farming practices have been applied such as improving pond
structure, stocking certified juvenile, pond water treatments, minimal exchange of pond water and frequently monitoring water quality. On-farm practices need to be supported by measures
at community and project scale (inter-district/province scale), including canal water monitoring, proper operation of sluices and improvement of irrigation and drainage systems.
Future water management interventions need combined measures of both structural and non-
structural solutions at different scales to maximise the efficiency of investments.
1.7.4.3 Safe water supply for domestic and industrial uses
Safe water supply for domestic and industrial uses in the delta is an important issue not only now but also in the future. About 5.7 million people in the delta lack access to safe drinking
water and about 10 million people in rural areas live without adequate sanitation (Herbst et al.
2009). The delta has about 2.4 million ha of acid sulfate soils and possessed a dense network of canals, serving irrigation, drainage and transport purposes at the same time. Surface and
groundwater pollution has become a major environmental problem (Buschmann et al. 2008; Toan et al. 2013).
Surface water serves as one of the main water sources in the freshwater zone while groundwater
is still the main supply source in the coastal zone, especially during the dry season. The main water-related issues caused by domestic, industrial and agriculture water uses are:
soil acidification: increased acids and soluble metal loads resulting from oxidation of acid sulphate soils are problems not only for agricultural and aquaculture production
and ecosystems, but also for safe water supply for domestic uses (Kawagahigashi et al. 2008);
groundwater aquifers contaminated by heavy metals: groundwater in several locations in the delta contain high concentrations of arsenic or dissolved organic carbon
(DOC), which exceed the WHO guidelines for drinking water (Buschmann et al. 2008). These contaminants are likely released from the surface or shallow subsurface. Chronic
arsenic poisoning is the most serious health risk for millions of people drinking this
groundwater without treatment in the delta;
agro-chemical residues: rice intensification requires heavy uses of pesticide application. Wide ranges of pesticide residues were found in surface water, soil, and
sediment monitoring. This presents chronic risks to biota and humans and surface water
requires more advanced treatments;
limited wastewater treatments: treatment systems for domestic sewage and industrial
wastewater are in very poor condition or even absent in some areas. As a result most of wastewater enters the river and canal networks leading to contaminated water and high
number of typhoid fever and shigellosis cases (Herbst et al. 2009); and
poor safe water supply systems: safe water supply systems for domestic and industrial
uses are not meeting requirements. It is estimated that the existing water treatment systems in Can Tho can only meet 70% total volume required for safe water for
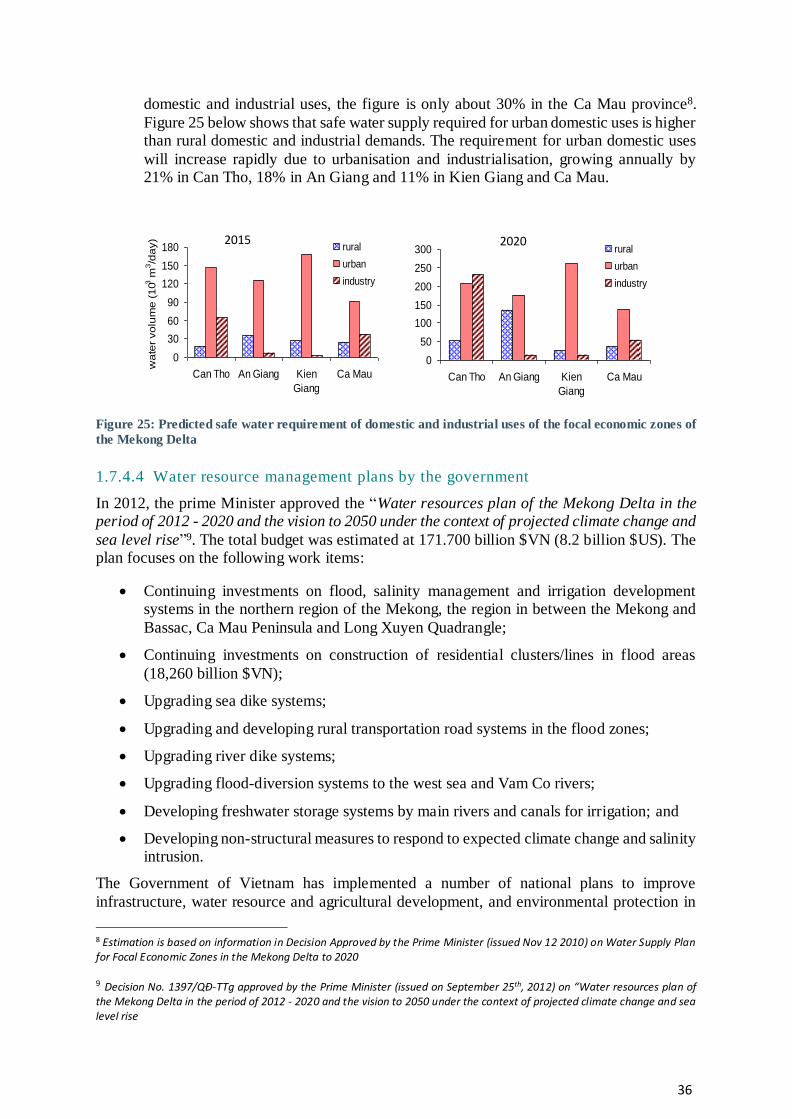
36
domestic and industrial uses, the figure is only about 30% in the Ca Mau province8.
Figure 25 below shows that safe water supply required for urban domestic uses is higher than rural domestic and industrial demands. The requirement for urban domestic uses
will increase rapidly due to urbanisation and industrialisation, growing annually by 21% in Can Tho, 18% in An Giang and 11% in Kien Giang and Ca Mau.
Figure 25: Predicted safe water requirement of domestic and industrial uses of the focal economic zones of
the Mekong Delta
1.7.4.4 Water resource management plans by the government
In 2012, the prime Minister approved the “Water resources plan of the Mekong Delta in the period of 2012 - 2020 and the vision to 2050 under the context of projected climate change and
sea level rise”9. The total budget was estimated at 171.700 billion $VN (8.2 billion $US). The plan focuses on the following work items:
Continuing investments on flood, salinity management and irrigation development systems in the northern region of the Mekong, the region in between the Mekong and
Bassac, Ca Mau Peninsula and Long Xuyen Quadrangle;
Continuing investments on construction of residential clusters/lines in flood areas
(18,260 billion $VN);
Upgrading sea dike systems;
Upgrading and developing rural transportation road systems in the flood zones;
Upgrading river dike systems;
Upgrading flood-diversion systems to the west sea and Vam Co rivers;
Developing freshwater storage systems by main rivers and canals for irrigation; and
Developing non-structural measures to respond to expected climate change and salinity intrusion.
The Government of Vietnam has implemented a number of national plans to improve
infrastructure, water resource and agricultural development, and environmental protection in
8 Estimation is based on information in Decision Approved by the Prime Minister (issued Nov 12 2010) on Water Supply Plan for Focal Economic Zones in the Mekong Delta to 2020
9 Decision No. 1397/QĐ-TTg approved by the Prime Minister (issued on September 25th, 2012) on “Water resources plan of the Mekong Delta in the period of 2012 - 2020 and the vision to 2050 under the context of projected climate change and sea level rise
0
30
60
90
120
150
180
Can Tho An Giang Kien
Giang
Ca Mau
wa
ter
vo
lum
e (
103
m3/d
ay)
rural
urban
industry
0
50
100
150
200
250
300
Can Tho An Giang Kien
Giang
Ca Mau
rural
urban
industry
2015 2020

37
the Mekong Delta. The implementation of the national plans has generated socio-economic
benefits and also led to some social and environmental impacts (positive and negative) as outlined in Table 5 below.
Table 5: Summary of national plans, benefits and impacts
National plans Socio-economic benefits Social and environmental impacts
Infrastructure and water resource development
Poldering with flood-
control systems in the
flood zone
Increased rice production and
diversified farming activities
Improved livelihoods of
farmers
Reduced risks and costs from
floods
Developed rural transportation infrastructure
Water pollution from
agricultural intensification
Reduced natural aquatic
resources and ecosystem
services of floodplain
Less opportunities for people
depend on natural resources i.e.
capture fisheries
Salinity control and
irrigation
development in the
coastal zone
Increased rice production and
diversified farming activities
Improved livelihoods of
farmers
Water pollution from rice
intensification
Reduced biodiversity in coastal
areas
Less opportunities for people
depend on natural resources
Residential
cluster/line
development
Provided 57,250 poor
households with safe housing
Reduced flood damages to
housing and livelihoods
Limited access to natural
resources for livelihoods of
inhabitants
Programme 135 for
disadvantaged
communes10
Improved rural transportation
infrastructure and enhanced
livelihood capacity in Khmer
communities
Agricultural development
Agricultural
diversification
Shifting rice to other crops
(fruits, upland crops,
aquaculture) for higher income
Conflicts between water uses
e.g. rice and shrimp farmers
“Living with flood”
programme
Diversified livelihood activities
during flood periods
Reduced economic risks and
improved income of poor
people
Sustainable
agricultural
production
programme in rice,
Improved income through
reduced costs of farming
activities
Improved linkages among
stakeholders in value chains
Promoting environmental
sustainability and social
linkages of farmers
10 Programme 135 (Development infrastructure and agricultural production for disadvantaged communes and/or communes
with high population of ethnic minority people)
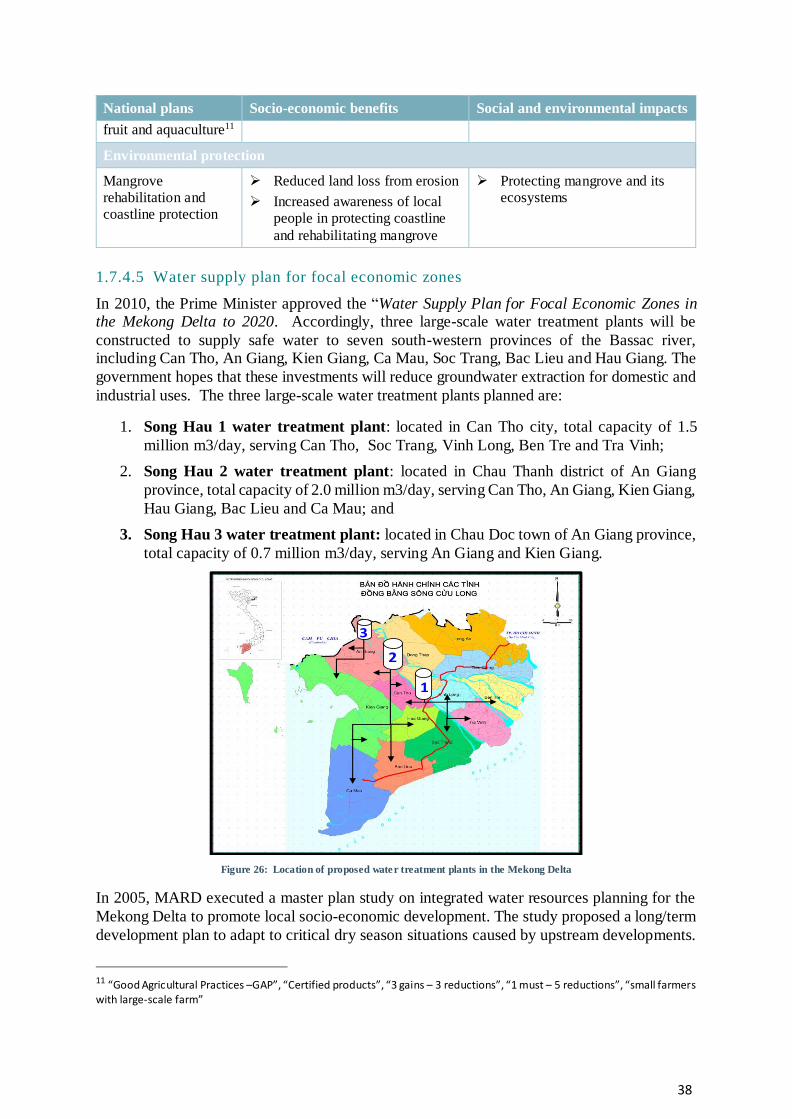
38
National plans Socio-economic benefits Social and environmental impacts
fruit and aquaculture11
Environmental protection
Mangrove
rehabilitation and
coastline protection
Reduced land loss from erosion
Increased awareness of local
people in protecting coastline
and rehabilitating mangrove
Protecting mangrove and its
ecosystems
1.7.4.5 Water supply plan for focal economic zones
In 2010, the Prime Minister approved the “Water Supply Plan for Focal Economic Zones in the Mekong Delta to 2020. Accordingly, three large-scale water treatment plants will be
constructed to supply safe water to seven south-western provinces of the Bassac river, including Can Tho, An Giang, Kien Giang, Ca Mau, Soc Trang, Bac Lieu and Hau Giang. The
government hopes that these investments will reduce groundwater extraction for domestic and
industrial uses. The three large-scale water treatment plants planned are:
1. Song Hau 1 water treatment plant: located in Can Tho city, total capacity of 1.5
million m3/day, serving Can Tho, Soc Trang, Vinh Long, Ben Tre and Tra Vinh;
2. Song Hau 2 water treatment plant: located in Chau Thanh district of An Giang
province, total capacity of 2.0 million m3/day, serving Can Tho, An Giang, Kien Giang,
Hau Giang, Bac Lieu and Ca Mau; and
3. Song Hau 3 water treatment plant: located in Chau Doc town of An Giang province,
total capacity of 0.7 million m3/day, serving An Giang and Kien Giang.
Figure 26: Location of proposed water treatment plants in the Mekong Delta
In 2005, MARD executed a master plan study on integrated water resources planning for the
Mekong Delta to promote local socio-economic development. The study proposed a long/term
development plan to adapt to critical dry season situations caused by upstream developments.
11 “Good Agricultural Practices –GAP”, “Certified products”, “3 gains – 3 reductions”, “1 must – 5 reductions”, “small farmers with large-scale farm”
1
2
3

39
A number of possible measures were identified in the MDP, such as changing cropping
patterns, increase of water storage in canals and storage basins and the construction of large sluice gates in the main estuaries. Although varying in importance for each region, the
following targets are mentioned:
Flood protection for residential areas, towns and cities;
Reduction of flood levels in early and late season to ensure the production of two spring-summer- autumn paddy;
Improvements in water management to reduce problems with acidic soils (e.g. in Ha Tien quadrangle) in order to use them for agriculture and aquaculture;
Combination of flood control projects with irrigation works to form a complete irrigation system, combination with water storage and traffic infrastructure;
Improvements of irrigation capacities by dredging canals and improvements the links
between canals and the various river; and
Improvements in drainage pumping capacity for areas that cannot be drained by gravity
(e.g. the fruit tree areas).

40
2 CURRENT TRENDS AND C HALLENGES IN
THE M EKONG DELTA
Rapid population growth and intensive agricultural and aquaculture development over the past decades have significantly reduced the natural values in the delta. Progressive
land and water reclamation, agricultural intensification, as well negative ecological impacts of
warfare, have significantly reduced the natural forests, wetlands and other natural habitats of the delta. Many wetlands such as mangroves, ponds, lakes, lagoons and wet grasslands are
threatened by extinction through the concessions for irrigation, forest plantations, salt ponds, and industrial development zones and shrimp farms (MDP 2013).
After decades, multi-cropping farming systems are dropping in productivity, flood plains are
shrinking exacerbating flood risks elsewhere, wetland habitats are being degraded causing water quality issues while water over-exploitation is shifting the balance between land and sea,
subsiding the delta surface and causing salinization of remaining sources (ICEM 2015). Five key lessons from the Mekong Delta are:
1. Highly controlled multi-crop farming systems have depleted soil fertility and cut
off agricultural areas from natural fertilization processes of the Mekong River: The widespread isolation of the Mekong’s freshwater flood plain from fluvial processes
to open up opportunities for triple and double crop rice farming has resulted in reduced fertility and reduced productivity of triple cropped areas. In An Giang province total
yield from some triple cropped areas are actually lower than yield from neighboring
double- crop areas which are still partially connected to the annual flood cycles (Kakkonen et al, 2008);
2. The Shrinking Mekong Floodplain area has exacerbated flooding in unprotected areas: the loss of floodplain has increased flood levels in the remaining unprotected
areas and concentrated flood discharge in the Mekong River channels and distributaries.
Worsened flood conditions have also lead to transboundary issues between Viet Nam and Cambodia, and channelized flood flows have lead to increasing issues of river bank
and coastal erosion (ICEM, 2012);
3. Draining of wetland depressions in the delta for agricultural expansion have led to
increasing acidification of surface water environments with knock-on effects for
ecosystems (especially fisheries) and water supply. Lack of wastewater treatment and use of agro-chemicals has also reduced surface water quality. Deterioration of these
provisioning services have disproportionately impacted poor communities of the Delta who rely on these services for their livelihood;
4. Dry season agriculture is shifting the delta’s balance between fresh and marine
environments: The MDP highlighted that increased water demand to support dry season agriculture has depleted groundwater sources, strengthened the penetration of
saline intrusion, increasing the salinity of water sources and accelerating rates of land subsidence in the Delta; and
5. Centralized water control initiatives such as the saline control structures in the
coastal areas of the delta often limit the livelihood and economic opportunities for farmers seeking to take advantage of market driven opportunities: the market
driven conflict between shrimp and rice farming in the early 2000s revealed the inflexibility and low levels of adaptive capacity of a infrastructure-driven approach to
controlling the delta environment and conflict between government targets for rice
41
production and individual farmers wanting to optimize the economic returns for their
farming effort.
Many of the lessons above are Delta-wide, cut across provincial and administrative boundaries and require both structural and non-structural measures to meet these challenges; however,
these trends and challenges vary according to the hydro-ecological zones. For further analysis
the delta is divided into four hydro-ecological zones based on the balance between coastal and upstream hydrological influences:
1. Upper delta floodplain: Northern, upper delta floodplain comprising the alluvial terraces, riverine levies and wetland depressions of Kien Giang, An Giang, Dong Thap,
and Long An provinces. The upper delta floodplain is dominated by freshwater inputs
from the Mekong basin and overbank flooding of the Tien and Hau river channels. During the wet season, flood water levels regularly exceed 2.0;
2. Middle delta: includes the alluvial floodplains and urban areas of Can Tho, Hau Giang, Vinh Long and Tien Giang provinces and is characterized by industrialization, land use
changes and limited urban water supply and wastewater services;
3. Delta estuary: comprising the estuary areas of Vinh Long, Tra Vinh, Soc Trang and Ben Tre. The inter-tidal zone is under the mixed influence of upstream hydrology as
well as coastal processes such as tidally-induced saline intrusion and channel-flow reversal. In the delta estuary under mixed coastal and freshwater influence, rice is still
an important crop accounting for 30% of provincial area, with brackish aquaculture
accounting for a further 11%; and
4. Delta peninsula: Eastern and southern regions of the Delta, where coastal processes
dominate local hydrology and local rainfall is the main freshwater input. On the delta peninsula dominated by coastal influences and limited freshwater inputs, brackish
aquaculture is the dominant land use accounting for 41% of the provincial area.
Land use has also developed to take advantage of the distinct hydro-ecological characteristics
of the three zones in relation to freshwater, brackish and saline farming. Focal provinces have been identified in the three hydro-ecological zones to demonstrate the links between coastal
influence and land use as shown below in Table 6 and Figure 27. Section 2 in this REA
provided an overview of the biophysical and socio-economic status in the Mekong Delta. Section 3 & 4 will analyze the specific trends and challenges and projected changes in the three
hydro-ecological zones used in the MD-ICRSL project: upper delta floodplain, delta estuary and delta peninsula.
Table 6: Hydro-ecological zones and focal provinces
Hydro-ecological zones Focal provinces
Component 2: Upper delta floodplain An Giang, Dong Thap and Kien Giang
Component 3: Delta estuary Ben Tre, Tra Vinh & Soc Trang
Component 4: Peninsula Cau Mau & Bac Lieu
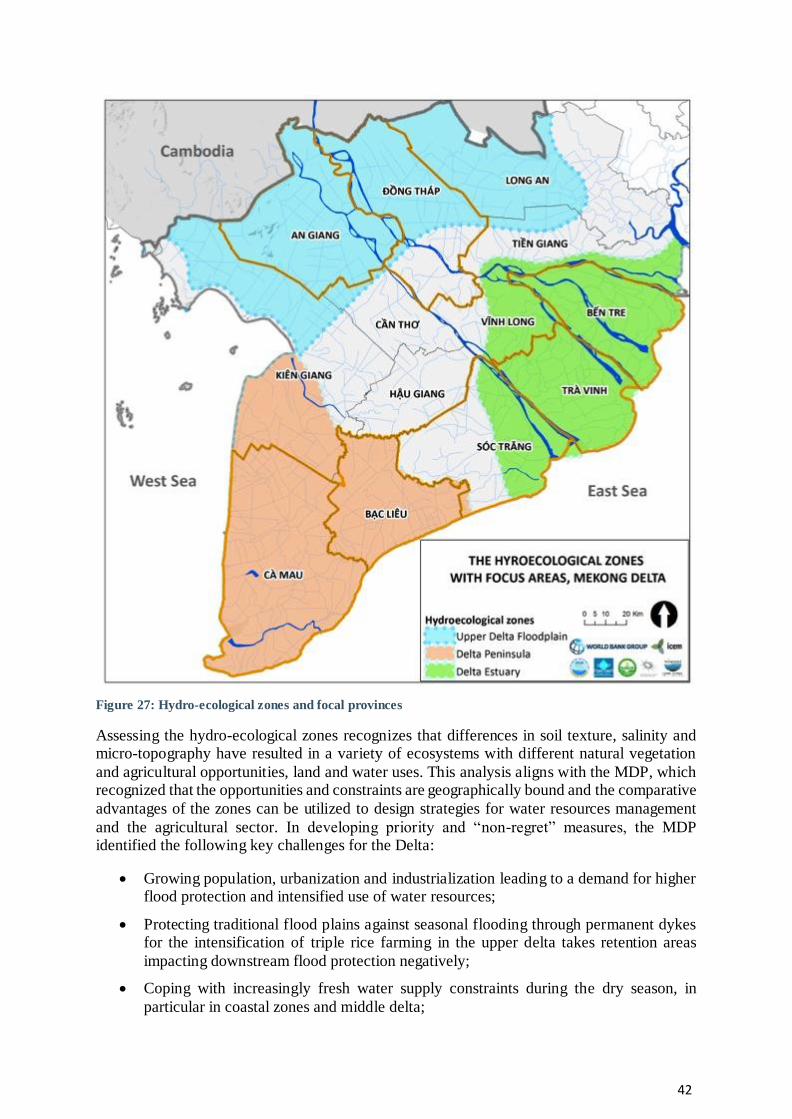
42
Figure 27: Hydro-ecological zones and focal provinces
Assessing the hydro-ecological zones recognizes that differences in soil texture, salinity and micro-topography have resulted in a variety of ecosystems with different natural vegetation
and agricultural opportunities, land and water uses. This analysis aligns with the MDP, which recognized that the opportunities and constraints are geographically bound and the comparative
advantages of the zones can be utilized to design strategies for water resources management
and the agricultural sector. In developing priority and “non-regret” measures, the MDP identified the following key challenges for the Delta:
Growing population, urbanization and industrialization leading to a demand for higher flood protection and intensified use of water resources;
Protecting traditional flood plains against seasonal flooding through permanent dykes for the intensification of triple rice farming in the upper delta takes retention areas
impacting downstream flood protection negatively;
Coping with increasingly fresh water supply constraints during the dry season, in
particular in coastal zones and middle delta;
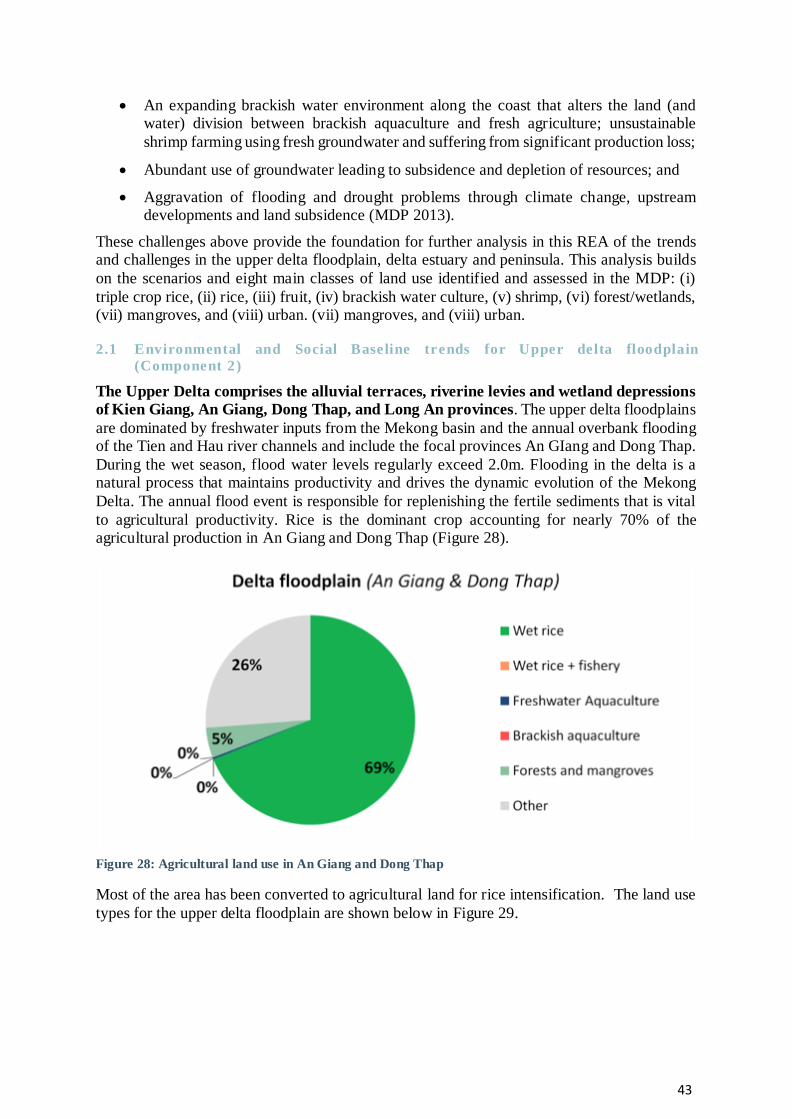
43
An expanding brackish water environment along the coast that alters the land (and water) division between brackish aquaculture and fresh agriculture; unsustainable
shrimp farming using fresh groundwater and suffering from significant production loss;
Abundant use of groundwater leading to subsidence and depletion of resources; and
Aggravation of flooding and drought problems through climate change, upstream developments and land subsidence (MDP 2013).
These challenges above provide the foundation for further analysis in this REA of the trends and challenges in the upper delta floodplain, delta estuary and peninsula. This analysis builds
on the scenarios and eight main classes of land use identified and assessed in the MDP: (i)
triple crop rice, (ii) rice, (iii) fruit, (iv) brackish water culture, (v) shrimp, (vi) forest/wetlands, (vii) mangroves, and (viii) urban. (vii) mangroves, and (viii) urban.
2.1 Environmental and Social Baseline trends for Upper delta floodplain
(Component 2)
The Upper Delta comprises the alluvial terraces, riverine levies and wetland depressions
of Kien Giang, An Giang, Dong Thap, and Long An provinces. The upper delta floodplains
are dominated by freshwater inputs from the Mekong basin and the annual overbank flooding of the Tien and Hau river channels and include the focal provinces An GIang and Dong Thap.
During the wet season, flood water levels regularly exceed 2.0m. Flooding in the delta is a natural process that maintains productivity and drives the dynamic evolution of the Mekong
Delta. The annual flood event is responsible for replenishing the fertile sediments that is vital
to agricultural productivity. Rice is the dominant crop accounting for nearly 70% of the agricultural production in An Giang and Dong Thap (Figure 28).
Figure 28: Agricultural land use in An Giang and Dong Thap
Most of the area has been converted to agricultural land for rice intensification. The land use
types for the upper delta floodplain are shown below in Figure 29.

44
Figure 29: Land use types in the upper delta floodplain
The MDP highlighted that climate change is expected to bring higher and more pronounced
season flood regimes, the key challenges are to retain the natural flood based agriculture and protect downstream provinces from flooding.
2.1.1 Shr inking floodplains and exacerbated flood damages
Rapid development of the delta over the past 20 years has reduced flood relief capacity
of upstream areas through the intensification of multiple crop rice farming. Extensive
water infrastructure was developed for flood control and to support rice intensification in the Mekong Delta (Figure 30).
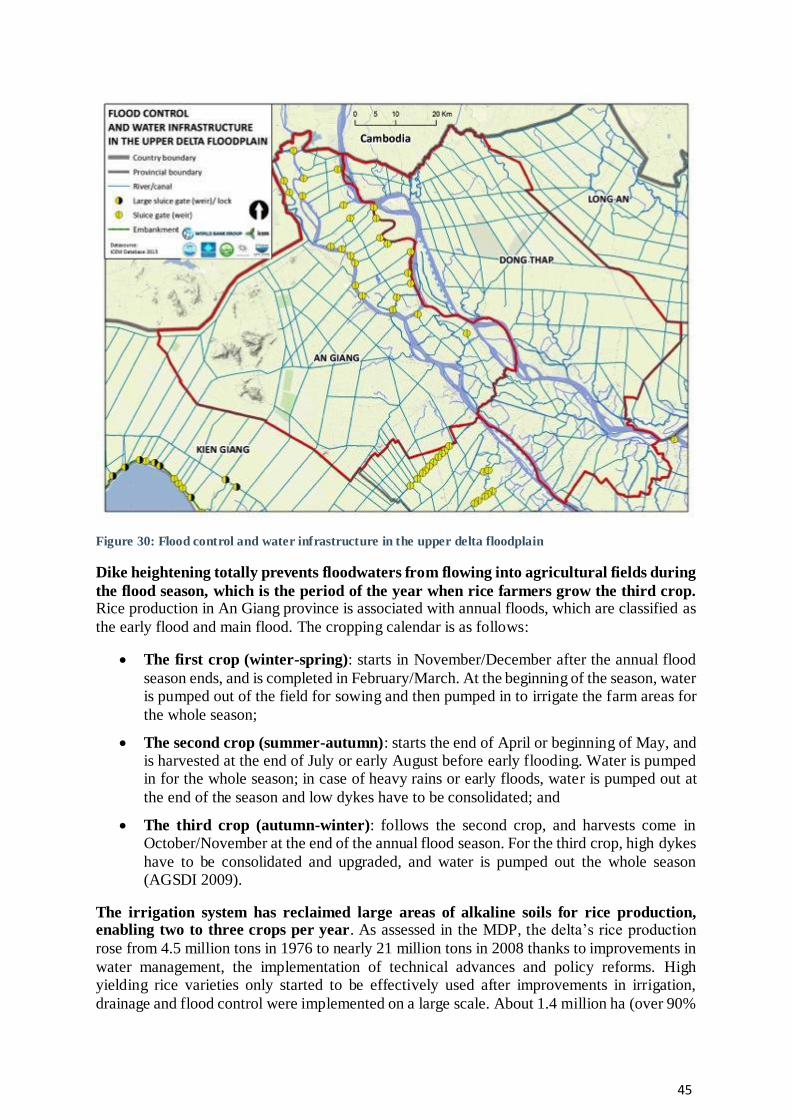
45
Figure 30: Flood control and water infrastructure in the upper delta floodplain
Dike heightening totally prevents floodwaters from flowing into agricultural fields during
the flood season, which is the period of the year when rice farmers grow the third crop. Rice production in An Giang province is associated with annual floods, which are classified as
the early flood and main flood. The cropping calendar is as follows:
The first crop (winter-spring): starts in November/December after the annual flood
season ends, and is completed in February/March. At the beginning of the season, water is pumped out of the field for sowing and then pumped in to irrigate the farm areas for
the whole season;
The second crop (summer-autumn): starts the end of April or beginning of May, and is harvested at the end of July or early August before early flooding. Water is pumped in for the whole season; in case of heavy rains or early floods, water is pumped out at
the end of the season and low dykes have to be consolidated; and
The third crop (autumn-winter): follows the second crop, and harvests come in October/November at the end of the annual flood season. For the third crop, high dykes
have to be consolidated and upgraded, and water is pumped out the whole season (AGSDI 2009).
The irrigation system has reclaimed large areas of alkaline soils for rice production, enabling two to three crops per year. As assessed in the MDP, the delta’s rice production
rose from 4.5 million tons in 1976 to nearly 21 million tons in 2008 thanks to improvements in
water management, the implementation of technical advances and policy reforms. High yielding rice varieties only started to be effectively used after improvements in irrigation,
drainage and flood control were implemented on a large scale. About 1.4 million ha (over 90%
46
of the Winter-Spring and Summer-Autumn crop) is actively irrigated with the canals and
sluices at all levels. Many embankments have been erected to avoid flooding during the harvest month of August. Flood control has achieved significant results, partly through state
investments, but also by local people themselves. The main idea is not to completely eradicate floods, since flooding also provide benefits to the people and their crops.
The high-dykes built for flood control failed to prevent extensive damages to agriculture
in An Giang province during the 2011 floods. The estimated costs of the damage amounted to around VND 72.4 billion (AGCFSC 2011). In the POR summer-autumn rice crops, high
value fruit trees and infrastructure also suffered damages (MDP 2013). The 2011 floods recorded a flood peak level of 4.86m at Tan Chau, lower than the 2000 flood peak level 5.06m.
Figure 31 below compares the flooded and non-flooded areas of the 2011 and 2000 floods.
Protecting traditional flood plains against seasonal flooding for rice intensification reduces flood retention impacting downstream provinces negatively. The 2011 flood
season experienced a smaller inflow volume than 2000, yet the water levels at Long Xuyen and Can Tho City were higher (MDP 2013). GIS analysis revealed that in the intervening decade
between these two floods there was a 42% reduction in flooded area within the LXQ. Between
2000 and 2011, approximately 1,1000 km2 of the LXQ was isolated from normal riverine processes of overbank flood and flood storage because of the expansion of triple crop rice. This
resulted in an additional 4,700 MCM of water exacerbating the peak flood water levels at Can Tho in September and October, and accounted for approximately 10% of the increase in water
levels at Can Tho relative to the year 2000 flood (ICEM 2015).
Since 2000, the Government has made efforts to diversify land use planning in the delta and promote the policy of “living with floods” in inland provinces. Controlled flooding
can protect crops and other infrastructure from floods. However, dykes and their associated irrigation systems can considerably affect the nature of the flood as they can fragment the
floodplains and interrupt the natural flow of water, sediments, nutrients, and fisheries (Tong
Yen Dan 2015; MDP 2013). The high dykes are also contributing to the decline of capture fisheries in the Mekong Delta. Declining trend are due to overfishing, water pollution,
destruction of natural fish habitats within the delta, and the increased pressures from the upstream developments (Chen and Zhang 2011).

47
Figure 31: Flooded areas in the October 2000 and 2011
48
2.1.2 Acidification and surface water quality
Draining of wetland depressions for agricultural expansion have led to increasing
acidification of surface water environments with knock-on effects for ecosystems (especially fisheries) and water supply. Each year about half of the delta is flooded by river
water up to three meters in depth under extreme conditions. And after the recession of the
floodwaters new problems arise. Reduced river flows cause the sea to intrude far inland, affecting over 1.4 million ha with saline waters. The drainage of naturally occurring acid
sulphate soils causes an additional problem for farms on low-lying land in the Upper Delta (MDP 2011). The acid sulphate soils comprise a total area of about 1.4 million ha
(approximately 35% of the entire Delta). Saline and alluvial soils occupy nearly an equal area
of about 1.2 million ha (28%) each. In the 1980s a total of about 1 million ha of acid sulphate soils could not be used for cultivation. Most of these soils have now been reclaimed for
cultivation from improved water management practices.
People living in acid-sulphate soil and saline-affected zones are more vulnerable to
natural resources threats than those in freshwater and alluvial zones. The decline of soil
fertility in the flood and alluvial zones and soil and water acidity in the acid sulphate zones are impacting agricultural productivity. Farmers in acid-sulphate soil and saline-affected zones
contend with more biophysical threats than farmers in freshwater and alluvial zones. Especially where infrastructure and human capacity remain under developed. In addition, the occurrence
of crop pests and surface water pollution from aquaculture and domestic users are emerging
threats to natural resources.
Households in the flood or saline zones usually have larger farms than those in alluvial or
rainfed zones. In the brackish and saline zones, where agriculture has shifted to the shrimp-based farming systems, field trenches and dykes are important farm resources, sharing around
20% of the total farm area. Household surveys showed that diversifying crops and replacing
rice production by aquaculture and horticulture enabled rural households to increase farm-based income. For landless or poor people, their livelihoods depend largely on the exploitation
of natural resources and off-farm activities. Ecosystem services and employment opportunities for poor households need to be considered in transforming the agricultural sector
The agricultural potential in areas of the Dong Thap Muoi and LXQ is low due to acid
sulphate soils. The Dong Thap Muoi and LXQ are closed floodplain systems are situated at both sides of the river and together cover an area of 510,027 ha. The Dong Thap Muoi includes
the vast POR, the agricultural potential is very low because soils in these regions have very high concentrations of sulphates (low pH values ranging from 2.26 to 3.54). These areas are
also deeply flooded from August to November and have insufficient fresh water during the dry
season (MDP 2013). The areas of sulphate and alluvial soils in the upper delta floodplain are shown below in Figure 32.

49
Figure 32: Area of acid sulfate and alluvial soil in the upper delta floodplain
Surface waters are polluted by acid water leaching from acid soils, increased use of
agricultural fertilisers and pesticides and domestic wastes in the upper delta floodplain. Draining of wetland depressions in the delta for agricultural expansion have led to increasing
acidification of surface water environments with knock-on effects for ecosystems (especially fisheries) and water supply. Water quality is reported as an issue by farmers and people living
in the Mekong Delta. The most extensive water quality programme (2002-2007) indicated the
following:
Saline intrusion in 2007 was not high. Of recent years, the year 2004 had the highest
salinity intrusion;
At some locations with aluminum concentrations (e.g. the channel in Nguyen Tan Thanh) relatively low pH values are measured;
Silt content in the mainstream and internal canals tends to increase during the period 2002-2007. The highest concentration of silt in major rivers was approx. 500 mg/l;
Nitrogen tends to increase whereas phosphorous decreased, although differences are not significant;
Organic matter measured as BOD5 is quite low, but COD component (chemical oxygen demand) increased in the period 2002-2007. In the dry season dissolved oxygen levels
in the channels were low;
In some locations the water was polluted by acid water leaching from acid soils early
during the rainy season; and

50
Total coliform and E.coli concentrations are low because of large flow conditions in rivers and canals where the measurements have been taken (MDP 2011).
The 2014 Mekong Delta Surface Water Monitoring Report produced by the Environment
Monitoring MONRE for the Tien and Hau rivers indicate surface water quality in the Mekong Delta has strong seasonality; the following trends were recently detected in the Hau and Tien
rivers:
1. In the dry season, due to saline intrusion from the East Sea high readings of electrical
conductivity (EC) and chloride were detected at downstream sites;
2. At the beginning of the rainy season, monitoring results show that some local areas are polluted with nutrients from agricultural run-off;
3. During the flood season, surface water is polluted in some localized areas; and
4. Residues of organic phosphorous (P) contained in agro-chemicals were not detected at
additional monitoring sites.
The large flows of the annual floodwaters help to flush out pollutants, especially nutrients and
organic compounds from river and streams. However, as the floodwaters rise over agricultural,
urban and industrial areas the surface water quality is affected in some local areas.
Increased levels of nutrients from agricultural run-off have been detected by bio
monitoring. Aquatic life in the delta is abundant and diverse with 347 species recorded including 187 species of phyto-plankton, 100 species of zooplankton and 60 species of zoo-
benthos. The species structure comprises mainly typical freshwater species and some species
migrated inland from the sea. Many of these species are adaptive to the nutrient rich environments, showing an increasing trend in organic pollution at the monitoring areas. At the
upstream site in Khanh Binh, An Giang province the density of phytoplankton was particularly high, especially the toxic blue algae species that lives in nutrient-rich and often polluted
environments. Using the water in this area presents a risk to domestic water supply and
aquaculture.
Managing the impacts of surface water pollution is critical as rural water supply is based
on surface water, groundwater and rainwater. The MDP identified that safe water supply is guaranteed to only 60-65% of the urban population and for the rural population this
percentage is considerably lower. Further water quality monitoring and analysis is required to
determine the impacts on surface water quality of acid sulphate soils, increased pesticide and fertilizer use for third rice cropping and aquaculture in the upper delta floodplain. Component
1 of the MD-ICRSL will enhance delta-wide monitoring systems for surface water, flow and groundwater in the Delta.
2.1.3 Higher inputs of agro-chemicals, reducing agr icultural productiv ity
Rice area (ha) and yield (tons/ha) have increased in both An Giang and Dong Thap
provinces from 1995-2013. The wet season crop includes the summer-autumn (second) and
the autumn-winter (third) crops. The extension of the wet season crops mainly came from the development of the autumn-winter crop, the area for wet season crops increased by about
200,000 ha from 1995 to 2013 (Figure 33). The traditional rice crop only exists in Tinh Bien and Tri Ton districts (GSO, 2014). The area of the autumn-winter crop in An Giang doubled
from 83,000 ha to 163,000 ha (Figure 34). From 2008-13 the yield (tons/ha) remained around
7.3 tons/ha for the dry season crop and 5.5-5.7 tons/ha for the wet season crops (Figure 35).

51
Figure 33: Trends of rice growing areas in An Giang
Figure 34: Trends of the autumn-winter crop areas by district in An Giang
Figure 35: Trends of paddy yields by crop in An Giang
In Dong Thap, the area for the wet season rice increased by 150,000ha from 1995-2013 as a
result of the autumn-winter crop (Figure 36). The autumn-winter crop was practiced
dominantly in Lai Vung, Lap Vo, Chau Thanh, Cao Lanh and Thap Muoi districts (GSO 2014). From 2008-2013, yields of the dry season crop did not change, about 7.1 tons/ha, and those of
the wet season crops from 2011-2013 were about 5.5 tons/ha (Figure 37).
0
100
200
300
400
500
600
700
1995 1997 1999 2001 2003 2005 2007 2009 2011 2013
Are
a (1
00
0 h
a)
Traditional crop
Wet season
Dry season
0
5
10
15
20
25
30
2005 2006 2007 2008 2009 2010 2011 2012 2013
Are
a (1
00
0 h
a)
Chau Phu
Chau Thanh
Chau Doc
Tri Ton
Phu Tan
An Phu
1
2
3
4
5
6
7
8
1995 1997 1999 2001 2003 2005 2007 2009 2011 2013
Pa
dd
y y
ield
s (to
ns/h
a)
Dry season
Wet season
Traditional crop

52
Figure 36: Trends of rice growing areas by crop in Dong Thap
Figure 37: Trends of paddy yields by crop in Dong Thap.
Third cropping in the upper delta floodplain has lower total yield and higher rice
production costs. In An Giang province total yield from some triple cropped areas are actually lower than yield from neighboring double crop areas that are still partially connected to the
annual flood cycles (Kakkonen et al, 2008). In a cost benefit analysis (CBA) of intensive rice
farming in An Giang province, a 20% decline in profit after 10 years of dike heightening was reported (Tong Yen Dan 2015). A recent situational analysis (Thien 2015) of intensive rice
farming in the An Giang and Dong Thap indicated that the third crop has the lowest yield and the highest unit cost of production (VND/Kg) among the 3 crops. The net profit of each crop
in the double cropping system is higher than that in the triple cropping system due to lower
costs of inputs and higher yields. However, the total profit of the triple cropping system is higher than the double cropping system.
Rice intensification has driven farmers to apply more pesticides and fertilizers, reducing
the cost benefits of the winter-autumn crop. Howie (2011) reported a 40% difference in rice yield per ton of fertilizer between rice plantations in low-dike and high-dike areas in sites where
high dykes had been built for more than 10 years. Figure 38 below shows the trends of fertilizer
application rates (nitrogen, phosphorous and potassium), total yield and benefit-cost ratio (BCR) of rice production for the 1st crop (winter-spring), 2nd crop (summer-autumn) in 1999,
2006 and 2010. Data for the 3rd crop is only available for 2010. In 2010, the application of nitrogen (N) and phosphorous (P) based fertilizers was higher for the third crop.
0
100
200
300
400
500
600
1995 1997 1999 2001 2003 2005 2007 2009 2011 2013
Are
a (1
00
0 h
a)
Wet season
Dry season
3
4
5
6
7
8
1995 1997 1999 2001 2003 2005 2007 2009 2011 2013
Pa
dd
y y
ield
s (to
ns/h
a)
Dry season
Wet season

53
Figure 38: Trends of fertilizer application rates (N, P & K), total yield and BCR
The third crop also had a lower total yield and BCR than the 1st and 2nd crops. Triple rice
cropping requires higher inputs levels of fertilizers and pesticides, leading to higher input costs and reduced BCR.A study in An Giang showed that floodwater provided an average of 61 tons
dry sediments, which contains 2t organic matter, 151kg total nitrogen (N), 109kg total phosphorus (P), 4kg potassium (K), 211 kg Calcium (Ca) and 6 kg sodium (Na) per ha per year
(Nha 2003).
The use of agro-chemicals also poses a threat to aquatic organisms and water quality. Agrochemicals are most intensively used in the upper delta floodplain, where farmers may
have as many as three crops of rice per year. Also, the use of pesticides in high value fruit and on vegetables is also high, where large quantities are suspected to end up in the aquatic
environment (MRC 2010). Chemicals used in livestock farming and aquaculture, such as
20
40
60
80
100
120
140
1st crop 2nd crop 3rd crop
N (kg
/ha
)
1999
2006
2010
20
30
40
50
60
70
80
1st crop 2nd crop 3rd crop
P (kg
/ha
)
1999
2006
2010
20
30
40
50
60
1st crop 2nd crop 3rd crop
K (kg
/ha
)
1999
2006
2010
2
4
6
8
1st crop 2nd crop 3rd crop
Yie
lds (to
ns/h
a)
1999
2006
2010
0
0.5
1
1.5
2
1st crop 2nd crop 3rd crop
BC
R
1999
2006
2010

54
antibiotics for Pangasius and shrimp farming may pose a threat to aquatic organisms (Gräslund
2004; Sarter et al. 2007).
Trends for high value agriculture and aquaculture are also increasing in An Giang and
Dong Thap provinces. Shifting from rice intensification is important to consider in the upper delta floodplain, farmers with rice monoculture had more expenditure per rice crop than those
farmers with rice rotation and intercropping (Huynh 2011). Figure 39 highlights the
encouraging trends of the vegetable and aquaculture production in An Giang Dong Thap. The increase in vegetable area results from flood-control projects, particularly in Cho Moi district
of An Giang (GSO 2014). Figure 40 below highlights the trends of increased aquaculture production in An Giang and Dong Thap mainly due to the intensification of pangasius catfish.
Figure 39: Trends of vegetable production area in An Giang and Dong Thap
Figure 40: Trends of aquaculture production in An Giang and Dong Thap
2.1.4 Rapid economic growth with a persistent poverty gap
Poverty rates are declining in An Giang and Dong Thap, not all communities have benefited from rice intensification. From 2006 to 2013 poverty rates declined in both An
Giang and Dong Thap (Figure 41). Compared to the Mekong Delta average, An Giang has lower rates and Dong Thap has higher poverty rates. In An Giang, relatively high poverty rates
occur in Tinh Bien, Tri Ton and An Phu districts. In Dong Thap, people living in deep-flood
districts like Tam Nong, Hong Ngu, Tan Hong and Thap Muoi have higher poverty rates (GSO 2013). At the same time total rice yield increased by up to 4% in some areas of the upper delta
floodplain, benefiting farmers that have accumulated more farmland and assets.
0
5
10
15
20
25
30
35
40
1995 2000 2001 2002 2003 2004 2005 2009 2010 2011 2012 2013
Are
a (1
00
0 h
a)
An Giang
Dong Thap
0
50
100
150
200
250
300
350
400
450
1995 1997 1999 2001 2003 2005 2007 2009 2011 2013
Pro
du
ctio
n (1
00
0 to
ns) An Giang
Dong Thap
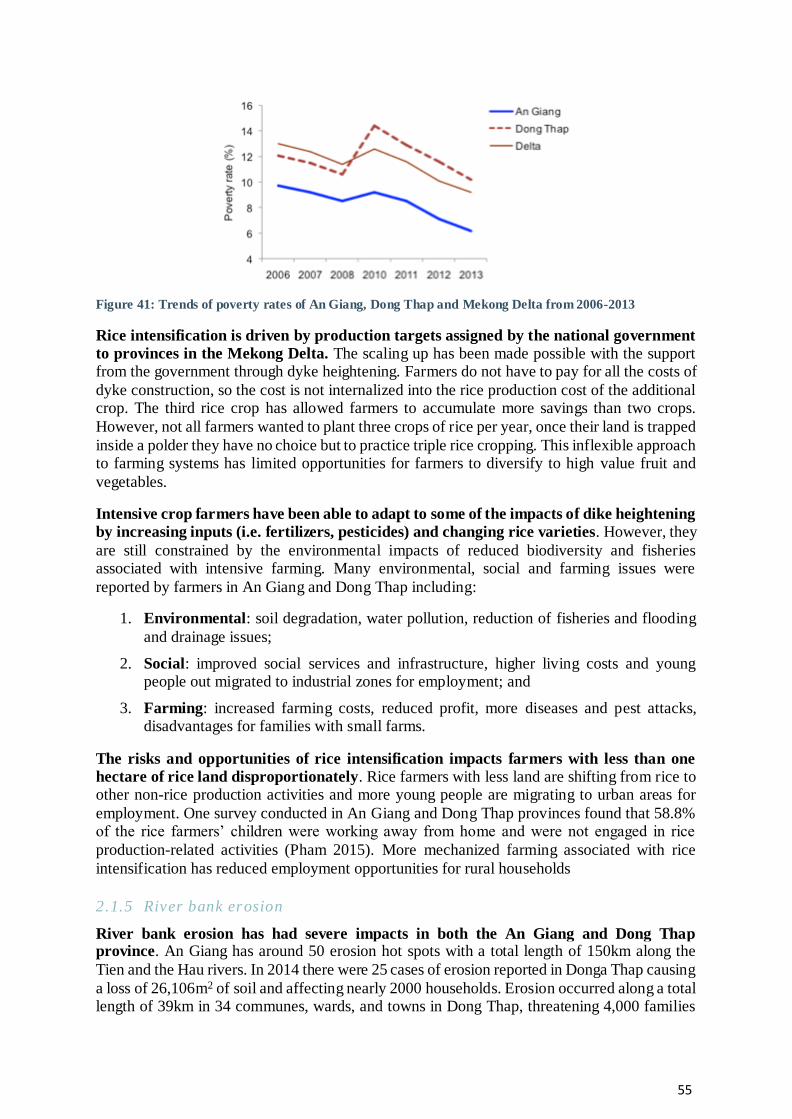
55
Figure 41: Trends of poverty rates of An Giang, Dong Thap and Mekong Delta from 2006-2013
Rice intensification is driven by production targets assigned by the national government
to provinces in the Mekong Delta. The scaling up has been made possible with the support from the government through dyke heightening. Farmers do not have to pay for all the costs of
dyke construction, so the cost is not internalized into the rice production cost of the additional crop. The third rice crop has allowed farmers to accumulate more savings than two crops.
However, not all farmers wanted to plant three crops of rice per year, once their land is trapped
inside a polder they have no choice but to practice triple rice cropping. This inflexible approach to farming systems has limited opportunities for farmers to diversify to high value fruit and
vegetables.
Intensive crop farmers have been able to adapt to some of the impacts of dike heightening
by increasing inputs (i.e. fertilizers, pesticides) and changing rice varieties. However, they
are still constrained by the environmental impacts of reduced biodiversity and fisheries associated with intensive farming. Many environmental, social and farming issues were
reported by farmers in An Giang and Dong Thap including:
1. Environmental: soil degradation, water pollution, reduction of fisheries and flooding
and drainage issues;
2. Social: improved social services and infrastructure, higher living costs and young people out migrated to industrial zones for employment; and
3. Farming: increased farming costs, reduced profit, more diseases and pest attacks, disadvantages for families with small farms.
The risks and opportunities of rice intensification impacts farmers with less than one
hectare of rice land disproportionately. Rice farmers with less land are shifting from rice to other non-rice production activities and more young people are migrating to urban areas for
employment. One survey conducted in An Giang and Dong Thap provinces found that 58.8% of the rice farmers’ children were working away from home and were not engaged in rice
production-related activities (Pham 2015). More mechanized farming associated with rice
intensification has reduced employment opportunities for rural households
2.1.5 River bank erosion
River bank erosion has had severe impacts in both the An Giang and Dong Thap province. An Giang has around 50 erosion hot spots with a total length of 150km along the
Tien and the Hau rivers. In 2014 there were 25 cases of erosion reported in Donga Thap causing
a loss of 26,106m2 of soil and affecting nearly 2000 households. Erosion occurred along a total length of 39km in 34 communes, wards, and towns in Dong Thap, threatening 4,000 families
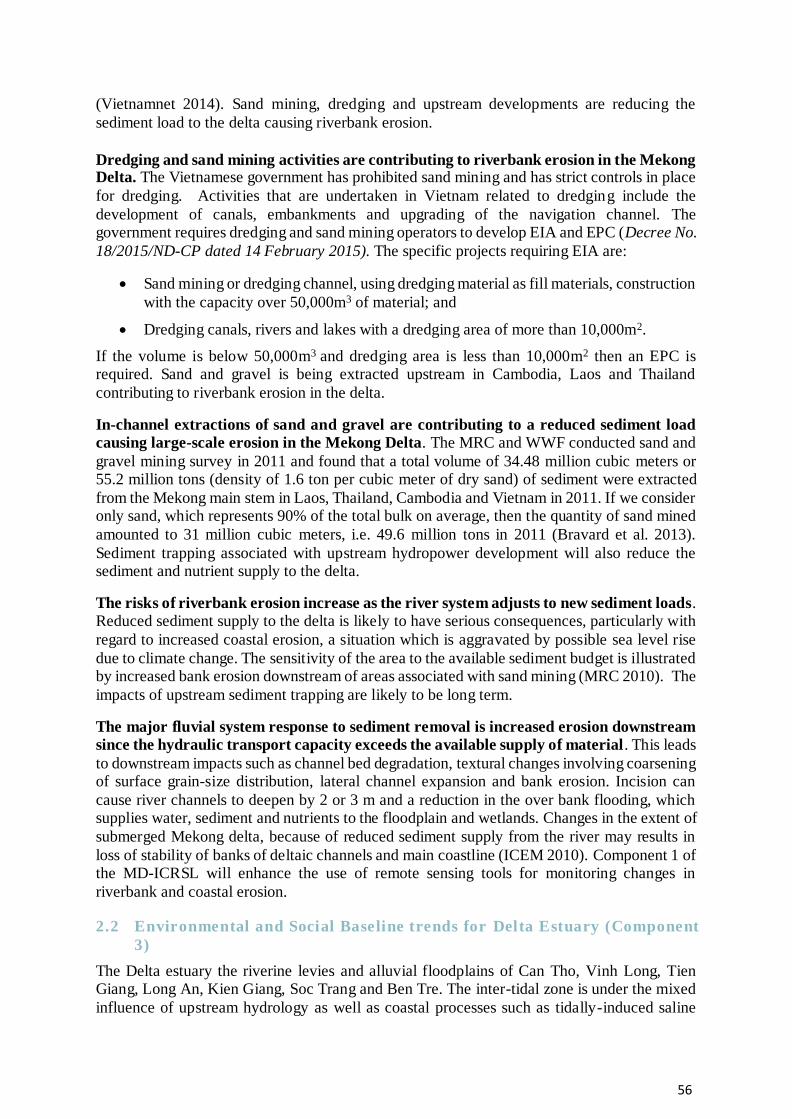
56
(Vietnamnet 2014). Sand mining, dredging and upstream developments are reducing the
sediment load to the delta causing riverbank erosion.
Dredging and sand mining activities are contributing to riverbank erosion in the Mekong Delta. The Vietnamese government has prohibited sand mining and has strict controls in place
for dredging. Activities that are undertaken in Vietnam related to dredging include the
development of canals, embankments and upgrading of the navigation channel. The government requires dredging and sand mining operators to develop EIA and EPC (Decree No.
18/2015/ND-CP dated 14 February 2015). The specific projects requiring EIA are:
Sand mining or dredging channel, using dredging material as fill materials, construction
with the capacity over 50,000m3 of material; and
Dredging canals, rivers and lakes with a dredging area of more than 10,000m2.
If the volume is below 50,000m3 and dredging area is less than 10,000m2 then an EPC is required. Sand and gravel is being extracted upstream in Cambodia, Laos and Thailand
contributing to riverbank erosion in the delta.
In-channel extractions of sand and gravel are contributing to a reduced sediment load
causing large-scale erosion in the Mekong Delta. The MRC and WWF conducted sand and
gravel mining survey in 2011 and found that a total volume of 34.48 million cubic meters or 55.2 million tons (density of 1.6 ton per cubic meter of dry sand) of sediment were extracted
from the Mekong main stem in Laos, Thailand, Cambodia and Vietnam in 2011. If we consider only sand, which represents 90% of the total bulk on average, then the quantity of sand mined
amounted to 31 million cubic meters, i.e. 49.6 million tons in 2011 (Bravard et al. 2013).
Sediment trapping associated with upstream hydropower development will also reduce the sediment and nutrient supply to the delta.
The risks of riverbank erosion increase as the river system adjusts to new sediment loads. Reduced sediment supply to the delta is likely to have serious consequences, particularly with
regard to increased coastal erosion, a situation which is aggravated by possible sea level rise
due to climate change. The sensitivity of the area to the available sediment budget is illustrated by increased bank erosion downstream of areas associated with sand mining (MRC 2010). The
impacts of upstream sediment trapping are likely to be long term.
The major fluvial system response to sediment removal is increased erosion downstream
since the hydraulic transport capacity exceeds the available supply of material. This leads
to downstream impacts such as channel bed degradation, textural changes involving coarsening of surface grain-size distribution, lateral channel expansion and bank erosion. Incision can
cause river channels to deepen by 2 or 3 m and a reduction in the over bank flooding, which supplies water, sediment and nutrients to the floodplain and wetlands. Changes in the extent of
submerged Mekong delta, because of reduced sediment supply from the river may results in
loss of stability of banks of deltaic channels and main coastline (ICEM 2010). Component 1 of the MD-ICRSL will enhance the use of remote sensing tools for monitoring changes in
riverbank and coastal erosion.
2.2 Environmental and Social Baseline trends for Delta Estuary (Component
3)
The Delta estuary the riverine levies and alluvial floodplains of Can Tho, Vinh Long, Tien Giang, Long An, Kien Giang, Soc Trang and Ben Tre. The inter-tidal zone is under the mixed
influence of upstream hydrology as well as coastal processes such as tidally-induced saline

57
intrusion and channel-flow reversal. In the delta estuary under mixed coastal and freshwater
influence, rice is still an important crop accounting for 30% of provincial area, with brackish aquaculture accounting for a further 11% (Figure 42).
Figure 42: Agricultural land use in Ben Tre & Tra Vinh
As outlined in the MDP, rapid population growth and intensive agricultural and aquaculture
development over the past decades have significantly reduced the natural values in the delta estuary. +The wetland types in the delta estuary are shown below in Figure 43.
Figure 43: Agricultural land use in the delta estuary

58
2.2.1 Salinization of the estuary
Salinity intrusion into the delta estuary is reducing agricultural productivity and leading to dry season freshwater shortages. Tidal fluctuations drive saline intrusion more than 80km
inland, affecting 40% of the Mekong Delta (SIWRR, 2010). Seven provinces are highly prone to saline intrusion, including: Kien Giang, Tra Vinh, Ben Tre, Soc Trang, Ca Mau, Bac Lieu
and Long An, with more than 1 million hectares experiencing salinity concentrations above
4g/L.
The situation of salinity intrusion in Mekong Delta is complex. Each year the situation is
different, depending on the magnitude of the previous years’ flooding, the ability to supply fresh water upstream in the dry season, the production level of Summer-Autumn paddy and the
onset of the rainy season. Salinity can intrude far inland when rains start late, as happened for
instance in 1977, 1993, 1998 and in 2004-2005. Highest salinity levels are reached at the end of the dry season, usually in April, but when rains are late sometimes even into early May
(MDP 2011). Figure 44 below shows the duration of salinity intrusion (>4g/L) in the delta estuary provinces of Ben Tre, Tra Vinh and Soc Trang.
Figure 44: Duration of salinity intrusion (>4g/L) in delta estuary
Expected sea level rise will further increase salinity levels in the delta's river branches
and its water network. A sea level rise of one meter would increase the area of 4g/L salinity
with 334,000 ha in relation to the benchmark year of 2004, a rise of 25%. Deep salinity intrusion is occurring already during dry seasons, giving rise to significant crop losses. Its
extent and frequency is likely to increase due to climate change, giving rise to even higher and more frequent economic losses.

59
Water control infrastructure has been constructed in coastal provinces to control salinity
intrusion into the estuaries. Sea dykes have been constructed along estuaries and coasts in Tien Giang, Tra Vinh, Soc Trang, Bac Lieu, Kien Giang, Ben Tre and Ca Mau provinces. In
Ben Tre and Ca Mau the sea dike system is not closed, and only gives partial protection. Both the height and strength of the dykes need upgrading (MDP 2011). The water control
infrastructure developed in delta estuary is show below in Figure 45.
Figure 45: Existing water infrastructure in the delta estuary
Saline water is prevented to enter the canals by the construction of sluices that can be
closed when the seawater rises with the tide above river water levels. However, many canals do not have such sluices. For instance along the coastline of the Long Xuyen Quadrangle
and Ca Mau peninsula, sluices consist of only one-way gates to let fresh water out and prevent salt water to enter (MDP 2013). Where sluices do exist, this creates conflicts between the
freshwater needs of agriculture and the brackish water needs for aquaculture, which will be
explored further in the following section. A large decline in capture fisheries is also associated with construction of a sea dykes to cut off saltwater flow into mangrove habitats so it could be
used for rice farming. Estuarine fish and other animals rely on these intertidal habitats for feeding so impacts on coastal and freshwater fisheries also need to be considered (MRC 2010).
2.2.2 Estuary balance between saline and freshwater farming
Balancing the needs of freshwater agriculture and brackish aquaculture is required to effectively adapt to salinity intrusion in the delta estuary. In the delta estuary under the
influence of both river flow and tidal action, the provincial authorities are faced with the decision to protect freshwater farming systems from salinity intrusion or open up the estuary
floodplains for saline tolerant systems. The brackish water environment in the coastal
provinces of the delta estuary and are gaining importance, not only due to emerging salinity
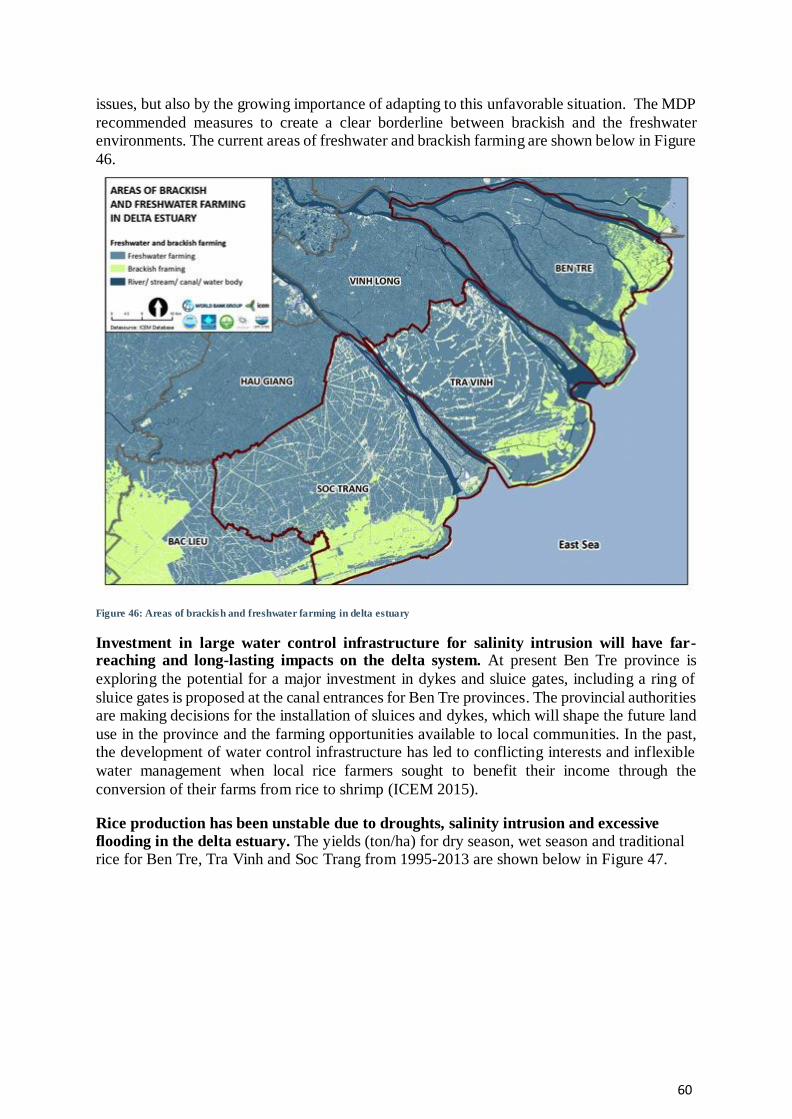
60
issues, but also by the growing importance of adapting to this unfavorable situation. The MDP
recommended measures to create a clear borderline between brackish and the freshwater environments. The current areas of freshwater and brackish farming are shown below in Figure
46.
Figure 46: Areas of brackish and freshwater farming in delta estuary
Investment in large water control infrastructure for salinity intrusion will have far-reaching and long-lasting impacts on the delta system. At present Ben Tre province is
exploring the potential for a major investment in dykes and sluice gates, including a ring of
sluice gates is proposed at the canal entrances for Ben Tre provinces. The provincial authorities are making decisions for the installation of sluices and dykes, which will shape the future land
use in the province and the farming opportunities available to local communities. In the past, the development of water control infrastructure has led to conflicting interests and inflexible
water management when local rice farmers sought to benefit their income through the
conversion of their farms from rice to shrimp (ICEM 2015).
Rice production has been unstable due to droughts, salinity intrusion and excessive
flooding in the delta estuary. The yields (ton/ha) for dry season, wet season and traditional rice for Ben Tre, Tra Vinh and Soc Trang from 1995-2013 are shown below in Figure 47.

61
Figure 47: Paddy yields by crop in Ben Tre, Tra Vinh & Soc Trang provinces Source: GSO 2014
Aquaculture area and aquaculture and shrimp production has increased in the delta
estuary. From 1995-2013 the total aquaculture area (ha), aquaculture and shrimp production
increased significantly in Ben Tre, Tra Vinh and Soc Trang (Figure 48). Aquaculture in the delta estuary primarily includes pangasius catfish (Ben Tre and Tra Vinh only), shrimp and
bivalve.
2
3
4
5
6
7
1995 1997 1999 2001 2003 2005 2007 2009 2011 2013
Yie
lds (
ton
s/h
a)
Dry season
Wet season
Traditional rice
Ben Tre
2
3
4
5
6
7
1995 1997 1999 2001 2003 2005 2007 2009 2011 2013
Yie
lds (
ton
s/h
a)
Dry season
Wet season
Traditional rice
Tra Vinh
2
3
4
5
6
7
1995 1997 1999 2001 2003 2005 2007 2009 2011 2013
Yie
lds (
ton
s/h
a)
Dry season
Wet season
Traditional rice
Soc Trang
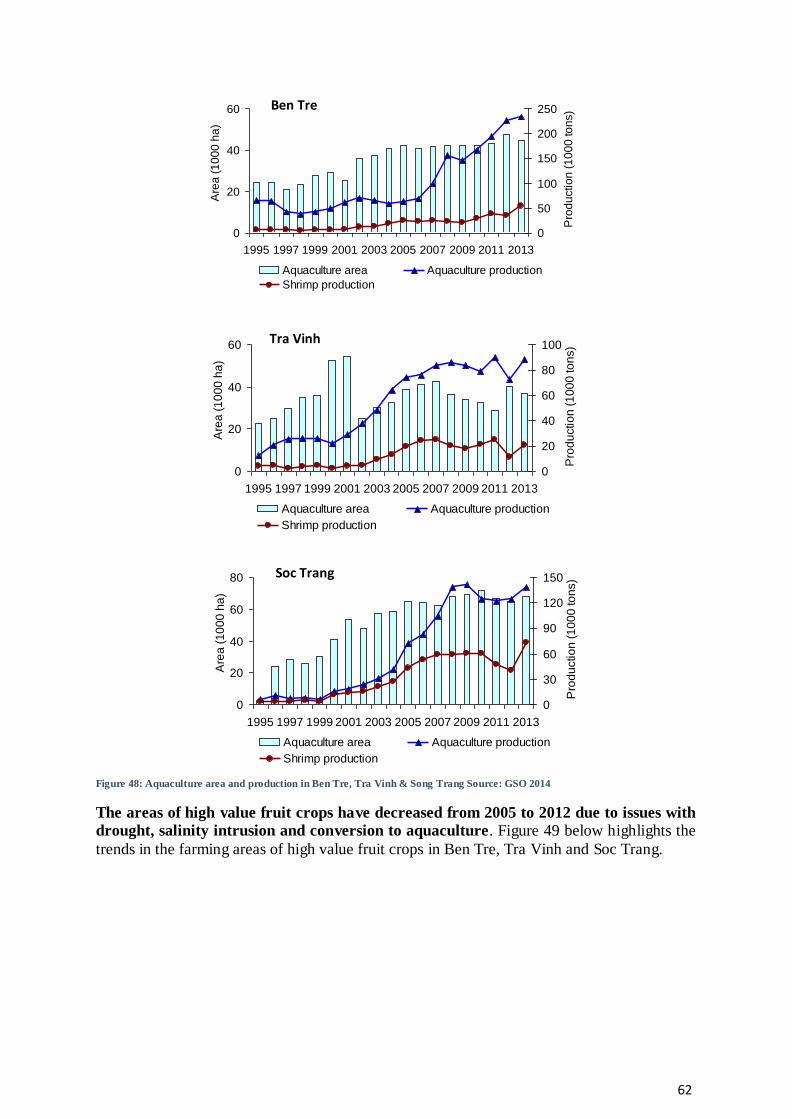
62
Figure 48: Aquaculture area and production in Ben Tre, Tra Vinh & Song Trang Source: GSO 2014
The areas of high value fruit crops have decreased from 2005 to 2012 due to issues with
drought, salinity intrusion and conversion to aquaculture. Figure 49 below highlights the
trends in the farming areas of high value fruit crops in Ben Tre, Tra Vinh and Soc Trang.
0
20
40
60
80
1995 1997 1999 2001 2003 2005 2007 2009 2011 2013
Are
a (
10
00
ha
)
0
30
60
90
120
150P
rod
uctio
n (
10
00
to
ns)
Aquaculture area Aquaculture production
Shrimp production
Soc Trang
0
20
40
60
1995 1997 1999 2001 2003 2005 2007 2009 2011 2013
Are
a (
10
00
ha
)
0
20
40
60
80
100
Pro
du
ctio
n (
10
00
to
ns)
Aquaculture area Aquaculture production
Shrimp production
Tra Vinh
0
20
40
60
1995 1997 1999 2001 2003 2005 2007 2009 2011 2013
Are
a (
10
00
ha
)
0
50
100
150
200
250
Pro
du
ctio
n (
10
00
to
ns)
Aquaculture area Aquaculture production
Shrimp production
Ben Tre
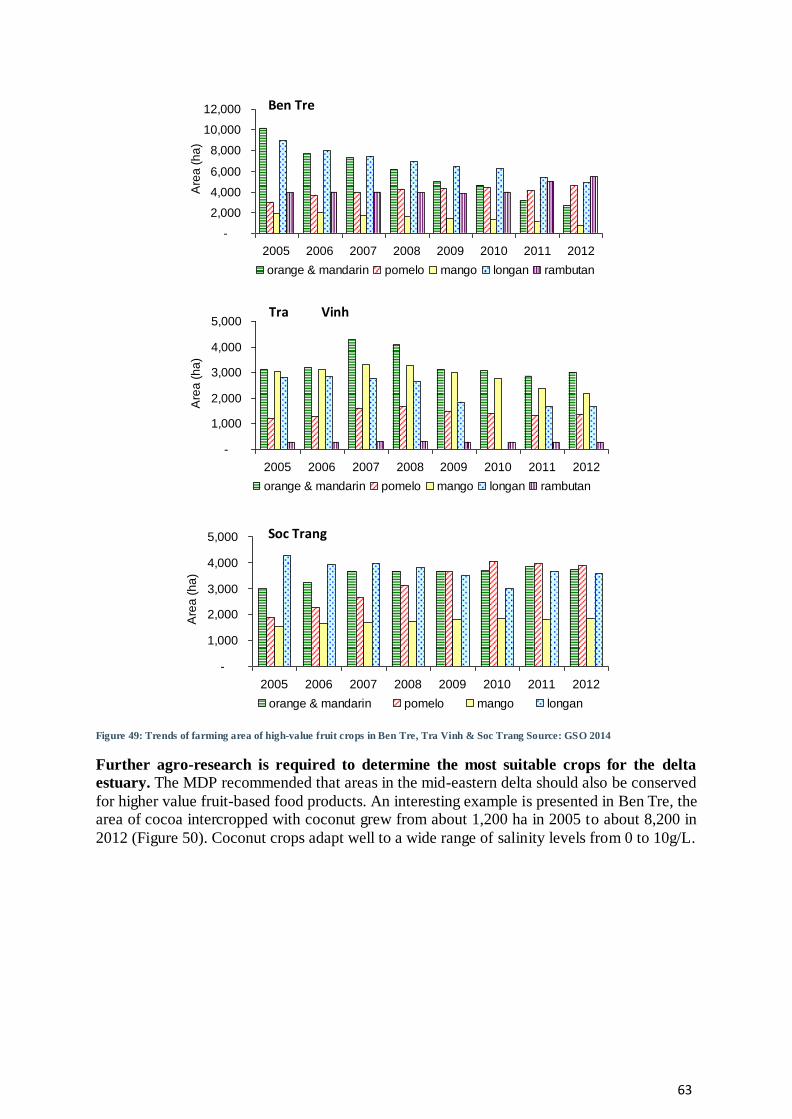
63
Figure 49: Trends of farming area of high-value fruit crops in Ben Tre, Tra Vinh & Soc Trang Source: GSO 2014
Further agro-research is required to determine the most suitable crops for the delta
estuary. The MDP recommended that areas in the mid-eastern delta should also be conserved
for higher value fruit-based food products. An interesting example is presented in Ben Tre, the area of cocoa intercropped with coconut grew from about 1,200 ha in 2005 to about 8,200 in
2012 (Figure 50). Coconut crops adapt well to a wide range of salinity levels from 0 to 10g/L.
-
1,000
2,000
3,000
4,000
5,000
2005 2006 2007 2008 2009 2010 2011 2012
Are
a (
ha
)
orange & mandarin pomelo mango longan rambutan
Tra Vinh Trang
-
1,000
2,000
3,000
4,000
5,000
2005 2006 2007 2008 2009 2010 2011 2012
Are
a (
ha
)
orange & mandarin pomelo mango longan
Soc Trang
-
2,000
4,000
6,000
8,000
10,000
12,000
2005 2006 2007 2008 2009 2010 2011 2012
Are
a (
ha
)
orange & mandarin pomelo mango longan rambutan
Ben Tre

64
Figure 50: Increasing trends of coconut growing area in Ben Tre province 2005-12
2.2.3 Dry season freshwater shortages and droughts
The Mekong Delta Plan emphasized that coping with dry season fresh water shortages and droughts and securing fresh water supply is a critical challenge for the delta estuary.
Ben Tre, Tra Vinh and Soc Trang, like many other coastal provinces suffer from several negative trends, like increased salinity intrusion, decreasing availability of fresh water of
sufficient quality, depletion of aquifers. Sea-level rise and dry-season salinity intrusion limit
the possibilities for fresh water agriculture and horticulture. Water quality problems put strain on (saline) aquaculture. There is a conflict in water use and availability between brackish areas
and fresh areas, and more broadly between agricultural, industrial and domestic water uses. Some parts of Soc Trang and Kien Giang experience dramatic changes in seasonal freshwater
available as surface waters in the dry season are almost exclusively dominated by tidal forces
and the main source of freshwater is rainfall.
The droughts in 2002 and 2004-05 caused extensive damage to agricultural crops and
water supply in the delta estuary. The drought of 2002 was a dry season drought that occurred from February to April. Some 70,300 ha of the delta were affected, with crops lost from 17,800
ha (25 per cent of the affected area). Crop losses in the Mekong Delta accounted for about 25
per cent of the national crop loss and, based on these figures, the cost of this drought to the delta was estimated as approximately US$24 million (US$1350 per ha of crop loss) (MRC
2010).
The 2004 wet season finished early, causing salinity intrusion to occur further upstream
than normal leading to widespread failure of the autumn rice crop and reduced dry
season water supply. More than 104,000 ha of rice were damaged in the delta. Ben Tre was the worst affected province, where 7000 ha of rice and 15,000 ha of fruit orchards worth US$33
million were destroyed. As well, more than 82,000 families were forced to buy water. The total drought damage bill to the delta was US$42 million (MARD 2005).
Water supply in many areas, such as Ca Mau, Bac Lieu and Soc Trang water is used
without treatment, so water quality is below the required standards. Existing water infrastructure is said to operate at no more than 55-65% of the design capacity. According to
the report of the Southern Institute for Urban and Rural Planning, around 60-65% of the urban population in the Delta receive water from the existing supply systems (MDP 2011). The
groundwater has been exploited for industrial and agricultural use since 1941. Up till now,
there are about 200 large wells to provide water for urban areas and over 25,000 small-scale drilled wells to provide water for rural areas. The current total exploited groundwater amounts
in the order of 480,000 m3/day (MDP 2011). The groundwater extraction in the delta estuary is shown below in Figure 51.
-
10,000
20,000
30,000
40,000
50,000
60,000
70,000
2005 2006 2007 2008 2009 2010 2011 2012
Are
a (
10
00
ha
)
Ben Tre
Tra Vinh
Soc Trang

65
Figure 51: Maximum rate of aquifer drawdown (cm/year) in delta estuary
The freshwater shortages calls for a detailed assessment of the effectiveness of horticulture, freshwater agriculture and brackish aquaculture in the delta estuary, especially as climate
change is expected to bring increased average temperatures and further salinity intrusion.
2.2.4 Land use changes from indus tr ialization and urbanization
Industrial development concentrated near the major cities of Can Tho, Long An, Ca Mau and My Tho. The processing of agricultural and aquaculture products is regarded as key to
future economic growth, integrated industrial zones near cities are expanding significantly.
These developments will have a major impact on population distribution and densities in the delta as more people migrate from rural to urban areas. The competition between provinces to
attract industry for their economic growth has led to poor spatial planning in the industrial zones in the Delta are developed randomly. Thousands of hectares of fertile soils along the
Mekong and Bassac have been saved for industrial zones instead of agriculture. The land-use
analysis in the MDP found that only 30 to 40 % of the industrial zones have actually been occupied by enterprises, even as low as 5% in some places.
Reduced retention area and sea level rise increase the vulnerability to flooding in the delta estuary leading to an increased need for capital-intensive measures for flood protection.
Conversion of agricultural land and floodplains decreases flood retention in the wet season,
exacerbating the impacts of flooding in urban areas. Raising dykes in the upper delta to enable triple instead of double crop rice takes retention area from the river system decreases and
increases flooding risks downstream (MDP 2013; ICEM 2015). Drainage capacity is insufficient in many areas during periods of heavy rainfall and high river discharges, causing
floodwaters to recede late.

66
The trend in industrialization and urbanization is growth, taking more land out of
agricultural production. At the same time more people need to be provided with food and fresh water. Ongoing industrialization will also take up more space and increase the demand
for water as well as the production of wastewater. Both trends will increase the need for proper spatial planning, efficient water supply and further investments in water treatment (MDP
2013).
Ineffective wastewater treatment and industrial growth also places pressure on surface water quality. Levels of heavy metals and oil and grease in surface waters and soils from
inland navigation and industrial activities are increasing along the Mekong and Bassac rivers and in canals. Untreated wastewater discharges, industrial pollution and limited sanitary
facilities cause local problems of water quality and create health risks in combination with
insufficient water supply.
2.2.5 Ethnic minor ities and reduced farm -based income
A high number of Khmer people are living in Soc Trang and Tra Vinh, the Khmer are
some of the poorest households in the Mekong Delta. The Khmer people living in the Tra
Cu district of Tra Vinh are living with poor water sanitation and hygiene conditions and relying on untreated groundwater for drinking (Nhan et al 2008). Their livelihoods totally depend on
the natural resource base. Government initiatives have been targeted at the Khmer people and some improvements have been made. However, the proportion of Khmer households with
improved income and wealth was lower than other households.
Khmer households and farmers are vulnerable to water related issues in the delta estuary.
Khmer farmers in the Soc Trang and Tra Vinh provinces are experiencing rice losses due to salinization and droughts in the early rainy season and pollution of inlet canal water is causing
high mortality rates of culture shrimp. The pollution of surface water from disposal of human
and animal wastes and run-off agro-chemicals from rice fields are impacting human health, agriculture and aquaculture. Poor sanitation conditions have increased the prevalence of
mosquitoes carrying dengue and malaria. A summary of the case study of Khmer people’s livelihoods and water-related issues in Soc Trang province is shown below in Table 7, problems
and solutions were determined for each of the communes.
Table 7: Water-related problems and solutions in Soc Trang province Source: Nhan et al. 2013
District Problem Solutions
Vinh Quoi:
Irrigated intensive rice
production area
1. Rice loss by salinity intrusion and
inundation
2. Livestock diseases
Health and unemployment
3. Improved rice farming practices
and water resources management
4. 2 rice crops with a fish vegetable
crop
5. Agricultural extension services
Water and sanitation
Tham Don:
Rain fed agricultural
area
6. Rice loss by droughts
7. Low fish yields in ponds
8. Livestock diseases
9. Vegetable diseases
10. Surface water pollution
11. Improved rice farming practices
12. Reduce surface water pollution
13. Improved pond farming practices
14. Crop diversification and bio gas
15. Improved on-farm irrigation
systems
Hoa Tu 1: Rice loss by salinity intrusion
16. Shrimp loss
17. Surface water pollution
18. Unemployment
19. Sustainable shrimp farming
practices
20. Improved shrimp seed
management
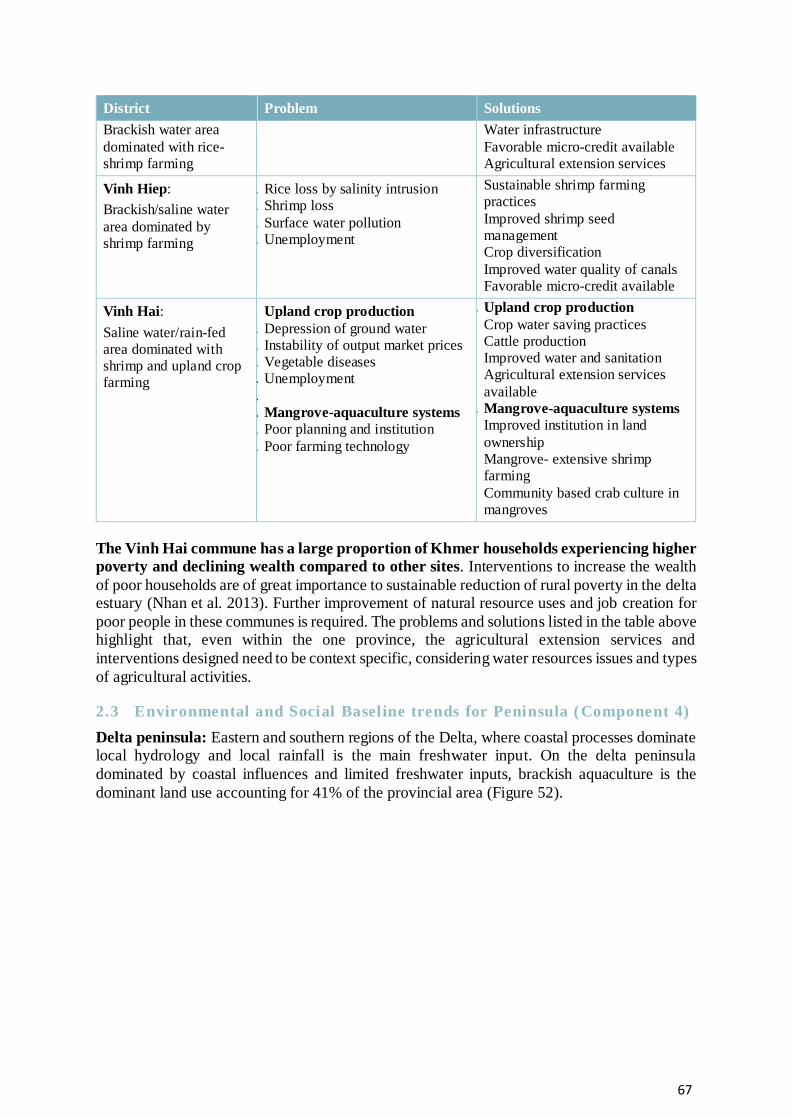
67
District Problem Solutions
Brackish water area
dominated with rice-
shrimp farming
21. Water infrastructure
22. Favorable micro-credit available
23. Agricultural extension services
Vinh Hiep:
Brackish/saline water
area dominated by
shrimp farming
24. Rice loss by salinity intrusion
25. Shrimp loss
26. Surface water pollution
27. Unemployment
28. Sustainable shrimp farming
practices
29. Improved shrimp seed
management
30. Crop diversification
31. Improved water quality of canals
32. Favorable micro-credit available
Vinh Hai:
Saline water/rain-fed
area dominated with
shrimp and upland crop
farming
Upland crop production
33. Depression of ground water
34. Instability of output market prices
35. Vegetable diseases
36. Unemployment
37. 38. Mangrove-aquaculture systems
39. Poor planning and institution
40. Poor farming technology
41. Upland crop production
42. Crop water saving practices
43. Cattle production
44. Improved water and sanitation
45. Agricultural extension services
available
46. Mangrove-aquaculture systems
47. Improved institution in land
ownership
48. Mangrove- extensive shrimp
farming
49. Community based crab culture in
mangroves
The Vinh Hai commune has a large proportion of Khmer households experiencing higher
poverty and declining wealth compared to other sites. Interventions to increase the wealth
of poor households are of great importance to sustainable reduction of rural poverty in the delta estuary (Nhan et al. 2013). Further improvement of natural resource uses and job creation for
poor people in these communes is required. The problems and solutions listed in the table above highlight that, even within the one province, the agricultural extension services and
interventions designed need to be context specific, considering water resources issues and types
of agricultural activities.
2.3 Environmental and Social Basel ine trends for Peninsula ( Component 4)
Delta peninsula: Eastern and southern regions of the Delta, where coastal processes dominate local hydrology and local rainfall is the main freshwater input. On the delta peninsula
dominated by coastal influences and limited freshwater inputs, brackish aquaculture is the
dominant land use accounting for 41% of the provincial area (Figure 52).

68
Figure 52: Agricultural land use in Ca Mau & Bac Lieu provinces
The land use types for the delta peninsula are shown below in Figure 53. The mangroves and
forest areas remaining in the delta are critical for the natural resource base and coastal protection from storm surges and salinity intrusion.
Figure 53: Land use types in delta peninsula
2.3.1 Delta shr inking and land subsidence
The coasts of the delta are tide dominated and affected by: (a) the discharge and sediment regime of the Mekong, (b) the tidal and wave regime of the East Sea, and (c) the Gulf of

69
Thailand, as well as coastal long shore currents. The coastal progradation rate of the delta has
not been continuous over the last 6ka. Through core studies, Ta et al. (2001) estimated the coastal progradation between 5300 to 3560 cal year BP to be 17-18 m year-1. Subsequently, the
progradation rate decreased to average 13-14 m yr-1 over the last 3500 years, forming a delta plain of 18,000km. The average accretion rate was 6km2 yr-1, with most progradation around
the mouths of the distributaries and due to long shore drift on the western side of the Ca Mau
Peninsula - which expanded westward at 1.2 km2 yr-1 between 1885 and 1985. Due to the dynamic processes on the coastline, in some areas land loss of ~30m y-1 has been recorded, but
in other places, some land accretion is still occurring though this is reducing (Albers et al. 2013).
Marine and fluvial processes of the delta maintain a balance between accretion and
erosion of the delta land mass. For the past 20 years the East Sea provinces of Ben Tre, Tien Giang, and Tra Vinh have been growing with net accretion rates of 1-10m/ year. Ca Mau has
experienced net erosion over the past 20 years with rates increasing from 1m/year to 16m/year
during that period. The provinces of Bac Lieu and Soc Trang, aggrading before 2002 at rates of 16-24 m/year, are now eroding at rates of 11-16m/year (Figure 54). These increases in rates
of coastal erosion are alarming and require an enhanced management in provinces like Ben Tre, Tra Vinh and Tien Giang. In the delta peninsula, the provinces of Ca Mau, Bac Lieu and
Soc Trang high historic rates are projected to continue increasing indicate that the business-as-
usual approach to coastal protection is not working and a new approach is needed to protect coastlines and valuable aquaculture and agriculture.
Figure 54: Net erosion and accretion rates in the East Sea

70
Satellite images from 1992, 2002 and 2011 were digitized to show the impacts of coastal
erosion and deposition in the delta peninsula for Bac Lieu & Ca Mau (Figure 55) and the Ca Mau Peninsula (Figure 56). The Ca Mau peninsula is extremely vulnerable to the impacts of
coastal erosion. A decreasing river sediment supply to the coast is deemed to be the prime cause of this erosion, and most likely due to existing dam retention of sediment and to massive
channel-bed sand mining in the delta, an activity on the increase over the last decade (Anthony
et al. 2015).
Figure 55: Coastal erosion and deposition in Ca Mau - Bac Lieu

71
Figure 56: Coastal erosion and deposition in the Ca Mau peninsula
Under a 2050 scenario with high climate change and high hydropower expansion, all six of the
coastal provinces along the East Sea will experience rates of erosion between 34 to 44m/year,
representing rates of erosion double anything experienced over the past 40 years. This will be explored further in Section 3. High-resolution satellite images show that the Mekong delta is
now largely prone to erosion, with shore-line retreat over the period 2003–2012 having affected over 50% of the > 600 km-long coast, and even up to 90% of the muddy South China Sea coast
(Anthony et al. 2015). The coastal erosion tool was used to determine the coastal line of the
delta peninsula in 2050 (Figure 57). Investments enhancing monitoring and information systems under Component 1 will use remote sensing tools to monitor changes in coastal and
riverbank erosion.

72
Figure 57: Coastal erosion and deposition in delta peninsula
The Ca Mau peninsula remains hydrological isolated from the surface water processes of
the Mekong River and its distributaries. This means that the provinces of Ca Mau and Bac
Lieu and some parts of Soc Trang and Kien Giang experience dramatic changes in seasonal freshwater available as surface waters in the dry season are almost exclusively dominated by
tidal forces and the main source of freshwater replenishment to the surface water system is direct rainfall with the monsoon rains. The timing and magnitude of wet season rainfall can
have significant impacts on farming systems and groundwater dependency of the peninsula
where rates of historic groundwater abstraction are the highest for the whole delta region (Figure 58). In the coastal zones a critical area identified in the MDP was that intensification
of groundwater exploitation has increased dramatically over the last decade, driven by the widespread diversification of shrimp farmers into horticulture and, to a lesser extent, salinity
control in shrimp farming. Further groundwater monitoring complemented by groundwater use
studies will be carried out under Component 1 of this project.
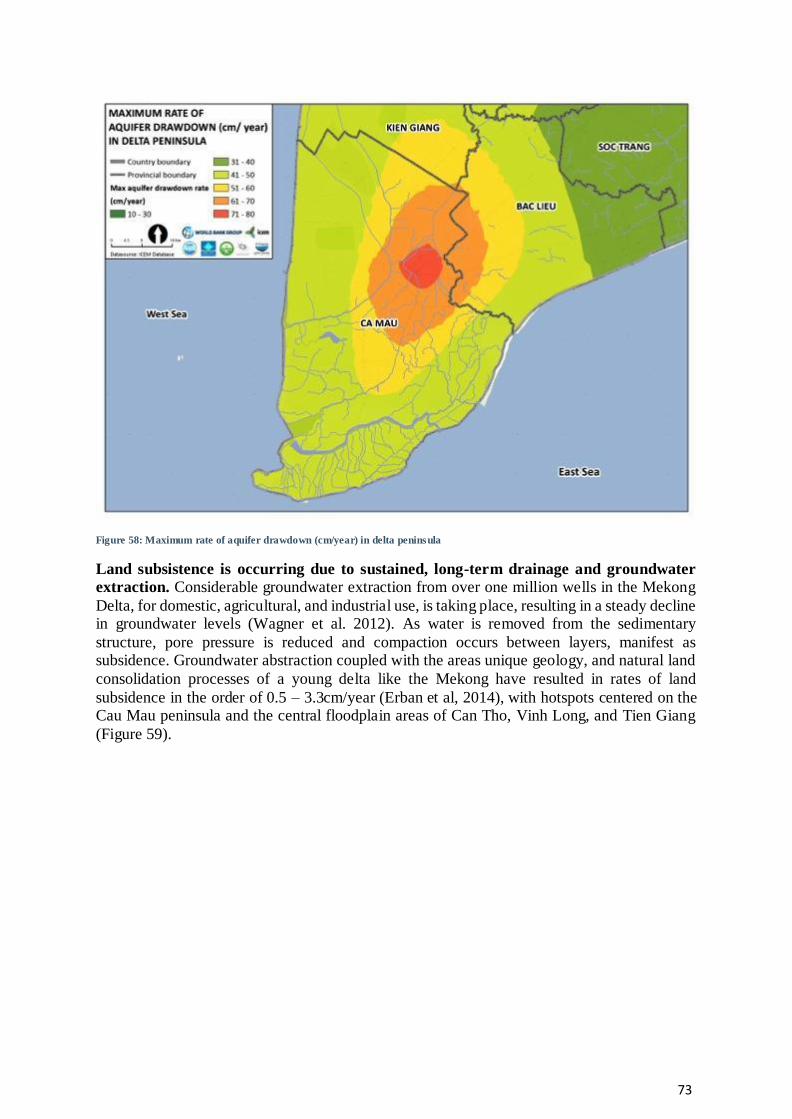
73
Figure 58: Maximum rate of aquifer drawdown (cm/year) in delta peninsula
Land subsistence is occurring due to sustained, long-term drainage and groundwater
extraction. Considerable groundwater extraction from over one million wells in the Mekong
Delta, for domestic, agricultural, and industrial use, is taking place, resulting in a steady decline in groundwater levels (Wagner et al. 2012). As water is removed from the sedimentary
structure, pore pressure is reduced and compaction occurs between layers, manifest as subsidence. Groundwater abstraction coupled with the areas unique geology, and natural land
consolidation processes of a young delta like the Mekong have resulted in rates of land
subsidence in the order of 0.5 – 3.3cm/year (Erban et al, 2014), with hotspots centered on the Cau Mau peninsula and the central floodplain areas of Can Tho, Vinh Long, and Tien Giang
(Figure 59).

74
Figure 59: Subsidence rate (cm/year) in the delta peninsula
As outlined in the MDP the issue of flooding, groundwater and land subsidence is not well
understood in the integrated context. Component 1 of the MD-ICRSL will establish
groundwater and surface water monitoring and use remote sensing to measure changes in coastal and riverbank erosion.
2.3.2 Deterioration of mangroves
The area of mangroves has rapidly declined over time in the coastal areas of Vietnam.
Mangroves declined from an estimated 408,500 ha in 1943 to 290,000 ha in 1962, to 252,000
ha in 1982; and to 155,290 ha in 2000 (Government of Vietnam, 2005). However, there is evidence that the area of mangroves increased in 2006 due to a National Action Plan for
mangrove protection and development (Government of Vietnam, 2005). Despite this national increase, some areas in the Mekong Delta and other coastal areas are still in decline.
In Ca Mau and Bac Lieu provinces, the mangroves play an important role in ecosystem
productivity and protecting coastal communities from storm surges and coastal erosion. The wetland types in the delta peninsula are shown below in Figure 60.

75
Figure 60: Wetland types in delta peninsula
In the delta peninsula demand for land for shrimp ponds and agriculture has resulted in
loss of mangrove forests. Deforestation of mangroves in the Mekong Delta is mainly due to
unplanned shrimp farming, urban development and the limited regulations and institutions in relation to integrated coastal management (Nguyen et al. 2013). The destruction of mangroves
in the coastal zones of the delta for shrimp ponds took place in the 1990s. Deforestation slowed down after the Government enforced stricter management measures in 2000, and farmers also
acknowledged that the sediment in mangroves were not suitable for shrimp farming (Nhuong
et al. 2006).
Increased fragmentation of mangroves has reduced capacity to withstand coastal processes,
such as wave actions, coastal currents and wind at exposed and semi-exposed coastline locations. Satellite images from 1992, 2002 and 2015 have been used to show the changes in
mangrove forests in the Ca Mau peninsula (Figure 61). The mangrove and land use has also
been mapped highlighting the areas of mixed forest, Rhizophora, Rhizophora and shrimp, Avicennia and intensive shrimp.
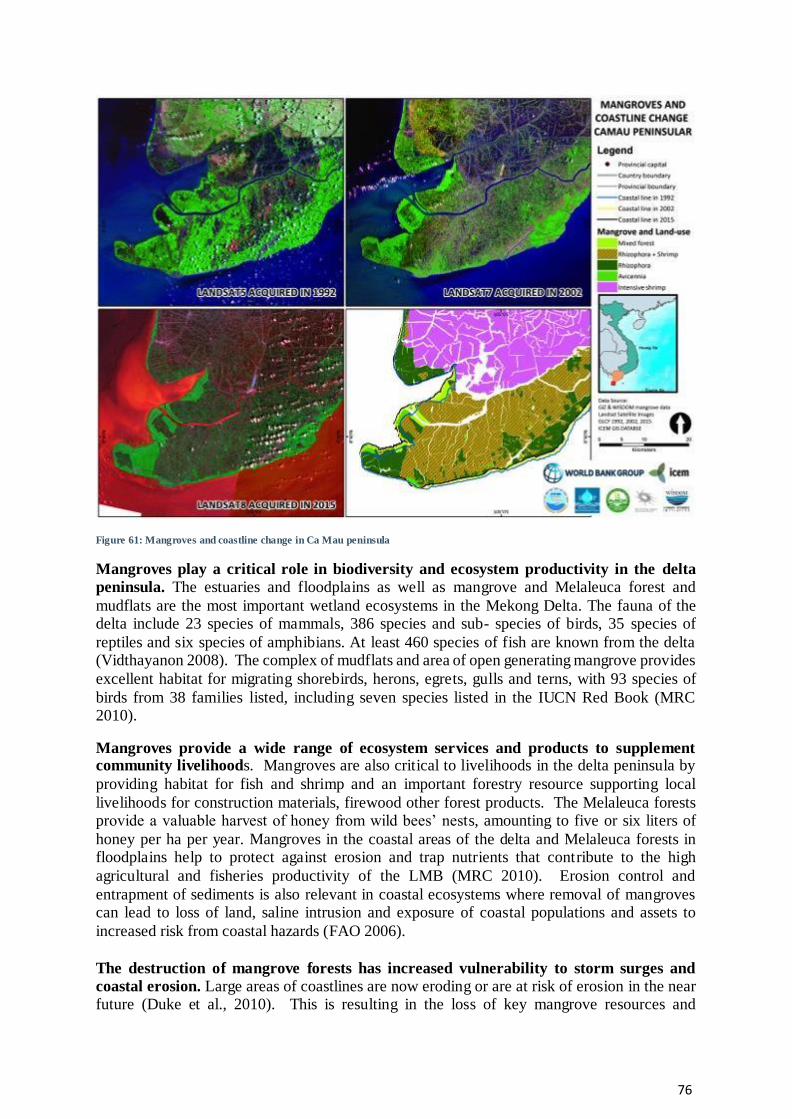
76
Figure 61: Mangroves and coastline change in Ca Mau peninsula
Mangroves play a critical role in biodiversity and ecosystem productivity in the delta
peninsula. The estuaries and floodplains as well as mangrove and Melaleuca forest and
mudflats are the most important wetland ecosystems in the Mekong Delta. The fauna of the delta include 23 species of mammals, 386 species and sub- species of birds, 35 species of
reptiles and six species of amphibians. At least 460 species of fish are known from the delta (Vidthayanon 2008). The complex of mudflats and area of open generating mangrove provides
excellent habitat for migrating shorebirds, herons, egrets, gulls and terns, with 93 species of
birds from 38 families listed, including seven species listed in the IUCN Red Book (MRC 2010).
Mangroves provide a wide range of ecosystem services and products to supplement community livelihoods. Mangroves are also critical to livelihoods in the delta peninsula by
providing habitat for fish and shrimp and an important forestry resource supporting local
livelihoods for construction materials, firewood other forest products. The Melaleuca forests provide a valuable harvest of honey from wild bees’ nests, amounting to five or six liters of
honey per ha per year. Mangroves in the coastal areas of the delta and Melaleuca forests in floodplains help to protect against erosion and trap nutrients that contribute to the high
agricultural and fisheries productivity of the LMB (MRC 2010). Erosion control and
entrapment of sediments is also relevant in coastal ecosystems where removal of mangroves can lead to loss of land, saline intrusion and exposure of coastal populations and assets to
increased risk from coastal hazards (FAO 2006).
The destruction of mangrove forests has increased vulnerability to storm surges and
coastal erosion. Large areas of coastlines are now eroding or are at risk of erosion in the near future (Duke et al., 2010). This is resulting in the loss of key mangrove resources and
77
associated ecosystem services, and also directly threatening the livelihoods of local
communities through increased vulnerability of coastal communities to storm surges and typhoons. Priority and “no-regret” measures developed in the MDP for coastal zones promote
the use of mangrove forests to protect the coastline against flooding and inundation in storms Mangrove forests also increases sedimentation and accretion, and reduces erosion.
National and provincial authorities are integrating climate resilient policies into wider
programs of coastal zone management. Major investments have been committed to upgrading national and provincial dike systems. MARD is carrying out a national plan worth
US$109 million to restore mangroves along Viet Nam’s coastline (MRC 2010). In some areas of the delta, dykes are being strengthened or heightened and mangroves are being planted to
improve protection from storm surges and coastal erosion The GIZ Integrated Coastal and
Mangrove Protection (ICMP) programme is supporting Viet Nam to manage its coastal ecosystems in order to strengthen resilience to climate change. The restoration of mangroves
is an important component of the ICMP (GIZ 2015).
Efforts are also being made to regenerate the mangrove areas and implement more
sustainable shrimp farming practices. Farmers in the coastal areas of Ca Mau province (where at least of 70% of farming area is mangrove) are practicing organic shrimp farming
(Nguyen and Fisher 2014). The preservation and gradual regeneration of mangrove forests is not only critical for ecology and biodiversity of the delta, but also in terms of natural
wastewater treatment for shrimp farming and aquaculture (MDP 2013). Remote sensing will
be established under Component 1 to monitor the changes in mangrove area in coastal zones.
2.3.3 Intensive shrimp farming
Aquaculture is no doubt one of the fastest growing sectors in the Delta. Out of 337,614
households in Vietnam) engaged in shrimp farming, 292,522 (86%) of households were from
the Mekong Delta. Aquaculture area and production increased significantly in Bac Lieu and Ca Mau provinces from 2000 as a result of the agricultural diversification policy by the
government (Figure 62). Farmers shifted from rice production to shrimp based farming systems for higher farm-based income.
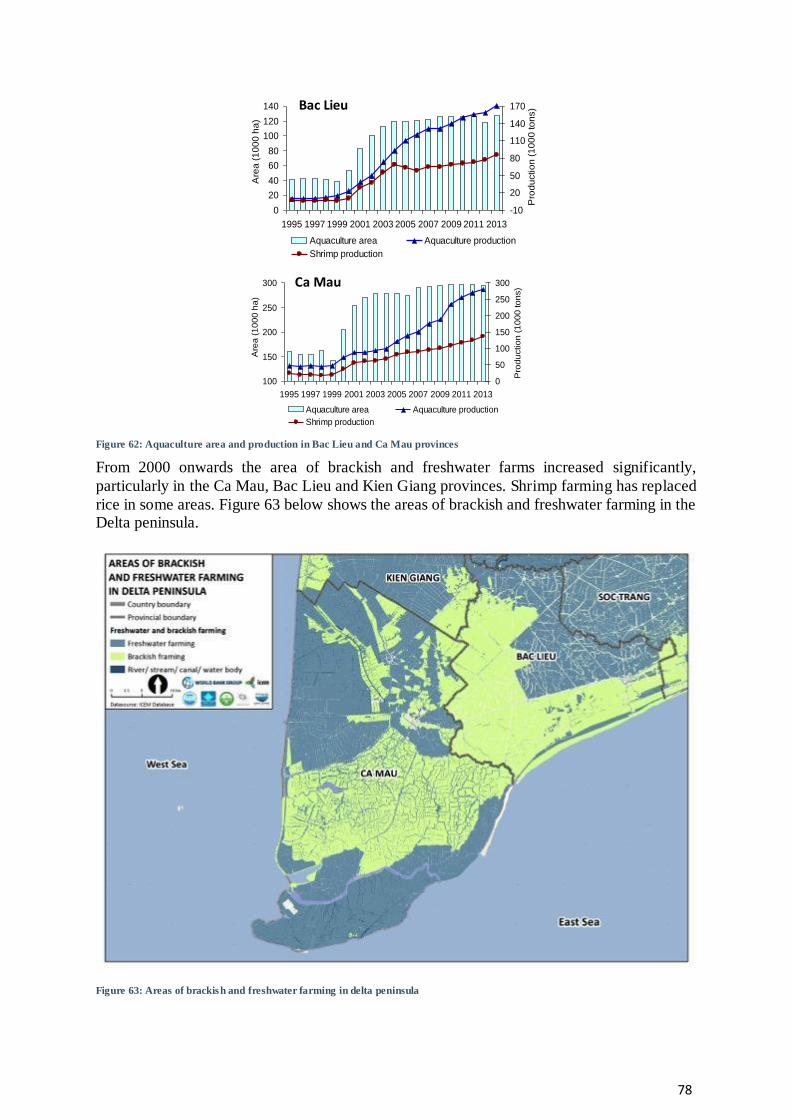
78
Figure 62: Aquaculture area and production in Bac Lieu and Ca Mau provinces
From 2000 onwards the area of brackish and freshwater farms increased significantly,
particularly in the Ca Mau, Bac Lieu and Kien Giang provinces. Shrimp farming has replaced
rice in some areas. Figure 63 below shows the areas of brackish and freshwater farming in the Delta peninsula.
Figure 63: Areas of brackish and freshwater farming in delta peninsula
100
150
200
250
300
1995 1997 1999 2001 2003 2005 2007 2009 2011 2013
Are
a (
10
00
ha
)
0
50
100
150
200
250
300
Pro
du
ctio
n (
10
00
to
ns)
Aquaculture area Aquaculture production
Shrimp production
Ca Mau
0
20
40
60
80
100
120
140
1995 1997 1999 2001 2003 2005 2007 2009 2011 2013
Are
a (
10
00
ha
)
-10
20
50
80
110
140
170
Pro
du
ctio
n (
10
00
to
ns)
Aquaculture area Aquaculture production
Shrimp production
Bac Lieu
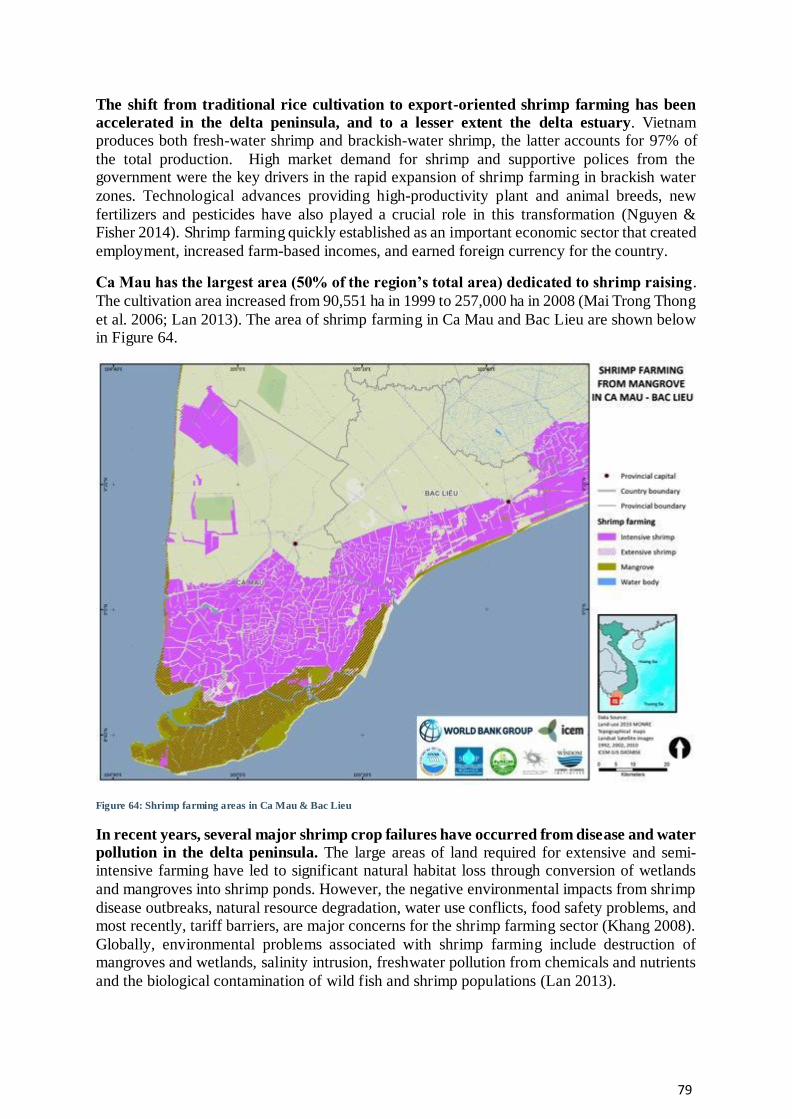
79
The shift from traditional rice cultivation to export-oriented shrimp farming has been
accelerated in the delta peninsula, and to a lesser extent the delta estuary. Vietnam produces both fresh-water shrimp and brackish-water shrimp, the latter accounts for 97% of
the total production. High market demand for shrimp and supportive polices from the government were the key drivers in the rapid expansion of shrimp farming in brackish water
zones. Technological advances providing high-productivity plant and animal breeds, new
fertilizers and pesticides have also played a crucial role in this transformation (Nguyen & Fisher 2014). Shrimp farming quickly established as an important economic sector that created
employment, increased farm-based incomes, and earned foreign currency for the country.
Ca Mau has the largest area (50% of the region’s total area) dedicated to shrimp raising.
The cultivation area increased from 90,551 ha in 1999 to 257,000 ha in 2008 (Mai Trong Thong
et al. 2006; Lan 2013). The area of shrimp farming in Ca Mau and Bac Lieu are shown below in Figure 64.
Figure 64: Shrimp farming areas in Ca Mau & Bac Lieu
In recent years, several major shrimp crop failures have occurred from disease and water
pollution in the delta peninsula. The large areas of land required for extensive and semi-intensive farming have led to significant natural habitat loss through conversion of wetlands
and mangroves into shrimp ponds. However, the negative environmental impacts from shrimp
disease outbreaks, natural resource degradation, water use conflicts, food safety problems, and most recently, tariff barriers, are major concerns for the shrimp farming sector (Khang 2008).
Globally, environmental problems associated with shrimp farming include destruction of mangroves and wetlands, salinity intrusion, freshwater pollution from chemicals and nutrients
and the biological contamination of wild fish and shrimp populations (Lan 2013).
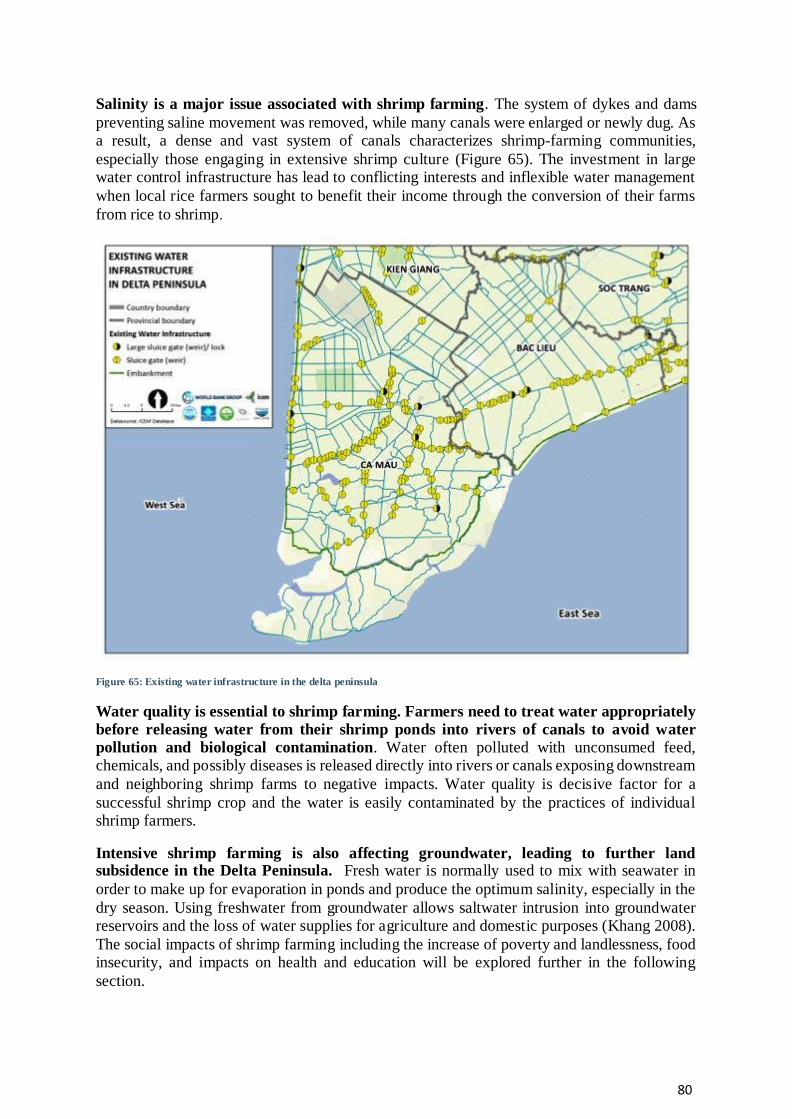
80
Salinity is a major issue associated with shrimp farming. The system of dykes and dams
preventing saline movement was removed, while many canals were enlarged or newly dug. As a result, a dense and vast system of canals characterizes shrimp-farming communities,
especially those engaging in extensive shrimp culture (Figure 65). The investment in large water control infrastructure has lead to conflicting interests and inflexible water management
when local rice farmers sought to benefit their income through the conversion of their farms
from rice to shrimp.
Figure 65: Existing water infrastructure in the delta peninsula
Water quality is essential to shrimp farming. Farmers need to treat water appropriately
before releasing water from their shrimp ponds into rivers of canals to avoid water
pollution and biological contamination. Water often polluted with unconsumed feed, chemicals, and possibly diseases is released directly into rivers or canals exposing downstream
and neighboring shrimp farms to negative impacts. Water quality is decisive factor for a
successful shrimp crop and the water is easily contaminated by the practices of individual shrimp farmers.
Intensive shrimp farming is also affecting groundwater, leading to further land subsidence in the Delta Peninsula. Fresh water is normally used to mix with seawater in
order to make up for evaporation in ponds and produce the optimum salinity, especially in the
dry season. Using freshwater from groundwater allows saltwater intrusion into groundwater reservoirs and the loss of water supplies for agriculture and domestic purposes (Khang 2008).
The social impacts of shrimp farming including the increase of poverty and landlessness, food insecurity, and impacts on health and education will be explored further in the following
section.
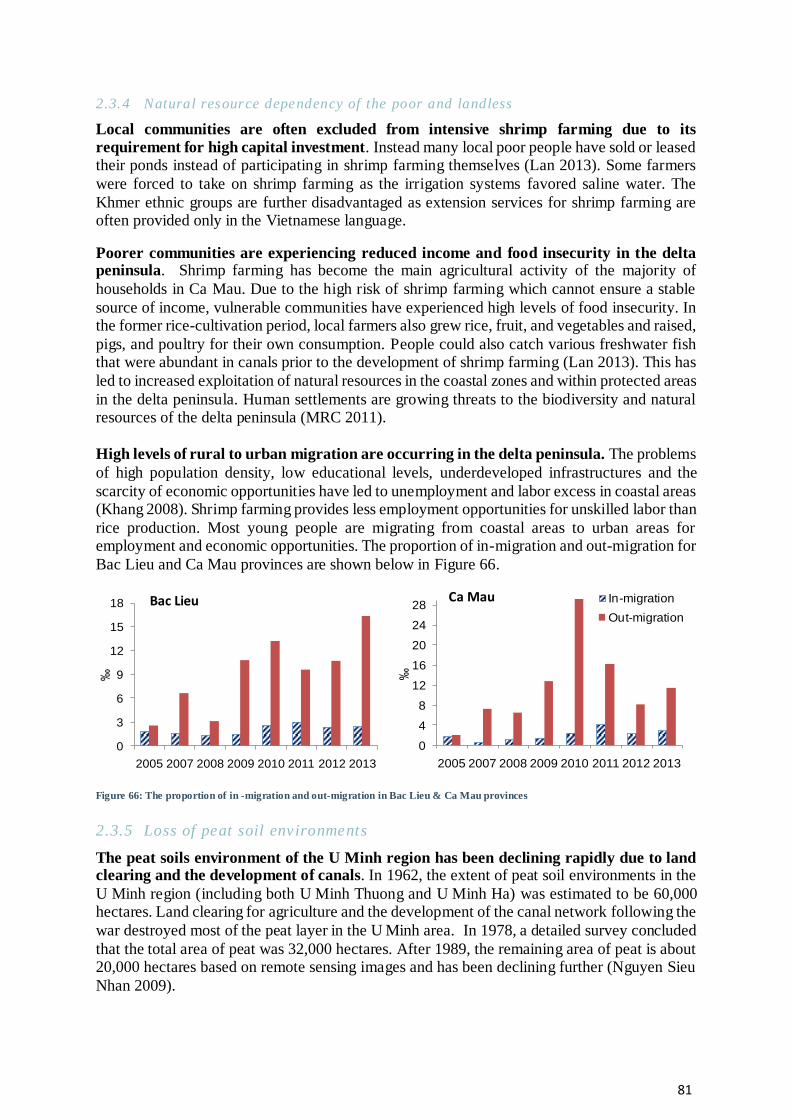
81
2.3.4 Natural resource dependency of the poor and landless
Local communities are often excluded from intensive shrimp farming due to its
requirement for high capital investment. Instead many local poor people have sold or leased their ponds instead of participating in shrimp farming themselves (Lan 2013). Some farmers
were forced to take on shrimp farming as the irrigation systems favored saline water. The
Khmer ethnic groups are further disadvantaged as extension services for shrimp farming are often provided only in the Vietnamese language.
Poorer communities are experiencing reduced income and food insecurity in the delta peninsula. Shrimp farming has become the main agricultural activity of the majority of
households in Ca Mau. Due to the high risk of shrimp farming which cannot ensure a stable
source of income, vulnerable communities have experienced high levels of food insecurity. In the former rice-cultivation period, local farmers also grew rice, fruit, and vegetables and raised,
pigs, and poultry for their own consumption. People could also catch various freshwater fish that were abundant in canals prior to the development of shrimp farming (Lan 2013). This has
led to increased exploitation of natural resources in the coastal zones and within protected areas
in the delta peninsula. Human settlements are growing threats to the biodiversity and natural resources of the delta peninsula (MRC 2011).
High levels of rural to urban migration are occurring in the delta peninsula. The problems
of high population density, low educational levels, underdeveloped infrastructures and the
scarcity of economic opportunities have led to unemployment and labor excess in coastal areas (Khang 2008). Shrimp farming provides less employment opportunities for unskilled labor than
rice production. Most young people are migrating from coastal areas to urban areas for employment and economic opportunities. The proportion of in-migration and out-migration for
Bac Lieu and Ca Mau provinces are shown below in Figure 66.
Figure 66: The proportion of in -migration and out-migration in Bac Lieu & Ca Mau provinces
2.3.5 Loss of peat soil environments
The peat soils environment of the U Minh region has been declining rapidly due to land clearing and the development of canals. In 1962, the extent of peat soil environments in the
U Minh region (including both U Minh Thuong and U Minh Ha) was estimated to be 60,000 hectares. Land clearing for agriculture and the development of the canal network following the
war destroyed most of the peat layer in the U Minh area. In 1978, a detailed survey concluded
that the total area of peat was 32,000 hectares. After 1989, the remaining area of peat is about 20,000 hectares based on remote sensing images and has been declining further (Nguyen Sieu
Nhan 2009).
0
3
6
9
12
15
18
2005 2007 2008 2009 2010 2011 2012 2013
‰
Bac Lieu
0
4
8
12
16
20
24
28
2005 2007 2008 2009 2010 2011 2012 2013
‰
In-migration
Out-migration
Ca Mau

82
The current remaining peat soils in the U Minh area in the Ca Mau province only are
estimated at only 13 million tons. The U Minh Ha National Park (Figure 67), 25km from Ca Mau, near the coast of the West Sea, was established in 2006, merging the Vo Doi Nature
Reserve and a part of U Minh III and Tran Van Thoi State Forestry Enterprises. The total area is 8,527 hectares, of which 3,600 hectares of the previous Vo Doi Nature Reserve is strictly
protected and the remaining area is a restoration zone. The park has 1,664 hectares of peat land
of 0.5 to 1.0 meter thick. Most of the area of the core zone is covered with natural or semi-natural melaleuca forest. The core zone has about 30 hectares of open area, which was created
by forest fires that took place some years ago. The park is surrounded by a buffer zone of 25,000 hectares, encompassing 4 communes in 2 districts of U Minh and Tran Van Thoi, with
a total of 5,000 households most of them, poor farmers relying on agriculture and natural
resources for income and livelihoods.
Figure 67: U Minh Ha & U Minh Thuong National Parks
Peatlands are critical for water regulation. Peat soils are generally meters deep and they store and maintain large quantities of water. Therefore, peatlands play an important role in protection
against floods after heavy rainfall and storm surges. The peat soil environments in the Mekong Delta support melaleuca forests and wetland ecosystems providing natural resources and non-
timber forest products for local livelihoods.
The key management issue of the park is the risks of the loss of its vast storage of peat soil, which is essentially carbon storage. The peat storage of the park is being lost through
two major causes namely fire and oxidation. The park is surrounded by a vulnerable population who depend on the exploitation of natural resources inside the park. The poaching activities
increase fire risks in-the park. In 2000, fires destroyed large areas of peat soils and approaches
were taken to submerge the entire park under water all year round. This resulted in the loss of hydrologic seasonality of the system that shaped and supported the ecosystem, destroying

83
melaleuca trees and wetland vegetation in the core zone. Since 2007 a dense network of around
120km of canals were installed as a firebreak and to provide access to fire fighting services.
Unfortunately, the canals installed for fire control have significantly increased the fire
risks in the peat zones. The canals have increased surface evaporation and lowered the water table, which is normally maintained naturally by the peat soil environments. In the dry season,
the water levels in the canals are below ground level so the water drains out and dries of the
peat, dramatically increasing fire risk. Even if fire control measures are effective the excessively dry conditions under the current management approach will exhaust the peat layer
through oxidation, the peat naturally decomposes when exposed to oxygen.
The main threats to the peat layer in the buffer zone are proposed peat extraction
projects, oxidation and fire. In 2009, the Ca Mau Department of Environment and Natural
Resources (DONRE) proposed a peat extraction project in the U Minh Ha area. The project document provides an estimate of a total harvestable stock of 4.273 million tons out of the
remaining 13 million tons. The main use of the extracted peat is for making microbial fertilizer. The project was proposed to take place in 3 phases with a total harvest of 1.856 million tons of
peat and total expected revenue from peat sale of USD 40 million. The peat harvest project is
currently due to concerns raised by scientists. However, the project is likely to be revived in the future due to the potential revenue from peat sales and real threat to the existence of the
remaining peat layer.
Farmers provided land in forested areas of the buffer zone also want to remove the peat
layer to improve cultivation. About 5,833 households who live in the forested area of the
buffer zones have been allocated forestry land with a total area of 30,000 ha. Farmers indicated that they want to remove the peat layer to improve cultivation as in the dry season the peat
layer is too dry to plant anything so they are limited to one crop per year. Although farmers are not permitted to extract peat to sell, they reported that they have been extracting and selling
some peat to private companies for making microbial fertilizers.
Peat soils are also being washed away during the rainy season. In the land plots allocated to farmers, there is no infrastructure for holding water during. In the rainy season, water flows
horizontally on the surface and through the peat soil environments to the rivers and the sea. This process is destroying the peat layer through washing the layers of peat soil away. At the
end of the rainy season, no water is retained in the peat layer resulting in drying out of the peat
layer making it impossible for cropping and increasing oxidation rates.

84
3 PROJECTED CHANG ES IN THE MEKONG
DELTA
3.1 External drivers of change
The Mekong Delta is governed by two major forcings: the fluvial processes of the Mekong
River Basin and the coastal processes of the East and West Sea. The interaction of these
two processes produces a wide range of hydro-ecological conditions and habitats that underpin the high productivity of the delta’s agro-ecology and the central role the region has played in
driving the national agricultural economy and securing national food security.
The success of the Mekong Delta’s agro-economy has largely been a result of how farming
systems in the delta control and/or work with these characteristics. Typically the scoping
and design of investments is made based on a historic understanding of these hydro-ecological characteristics; however, each of them is highly dynamic changing over time in response to
rapid internal and external drivers of change. There is growing evidence that changes in these characteristics are fundamentally changing the delta system.
From upstream, the fluvial processes of the Mekong River are changing in response to
rapid development of the basin by upstream countries over the past 20 years. The proliferation of large hydropower projects, deforestation and expansion of agricultural land and
irrigation infrastructure coupled with climate change has seen the Mekong’s hydrological regime exceed the natural bounds of variability captured in the long-term gauging station
records of the basin available since the early 1900s (ICEM, 2010). The timing, nature and
magnitude of the Mekong’s important flood pulse and hydro- biological seasons are changing, and most importantly for the delta, the supply of sediments and nutrients from the upstream
catchment has been reduced dramatically from an average load of 160MT/year in the early 2000s to 86Mt/y in 2014 (DHI, 2015).
From downstream, sea level rise and climate change are combining to change the relative
balance between land and marine environments. Groundwater abstraction coupled with the areas unique geology, and natural land consolidation processes of a young delta like the
Mekong have resulted in rates of land subsidence in the order of 0.5 – 3.3cm/year (Erban et al, 2014), with hotspots centered on the Cau Mau peninsula and the central floodplain areas of
Can Tho, Vinh Long, and Tien Giang. At the same time, sea levels have been rising. The rate
of global sea level rise has tripled in the past 100 years, with long term rates for the twentieth century ranging between 1.9 – 3.4mm/year (Rahmstorf, 2007; Cazenave, 2010; Church, 2008).
Analysis of sea levels at Vung Tau gauging station indicates that sea levels have risen by an average 3.0mm/yr between 1979 – 2006 (SIWRR, 2010). The combination of rising sea levels
and sinking delta land mass has resulted in a period of net erosion over the past two decades –
the first period in 6,000years in which the delta is no longer prograding (WWF, 2013).
Continued changes in the timing and magnitude of the Mekong’s flood pulse; reductions
in the Mekong’s sediment load and the net reversal of delta building processes will redefine the future hydro-ecological characteristics. This section will consider four basin-
wide drivers as external drivers of change for the Mekong Delta:
1. Hydropower development; 2. Land use change (deforestation);
3. Climate change; and 4. Sea level rise and land subsidence.
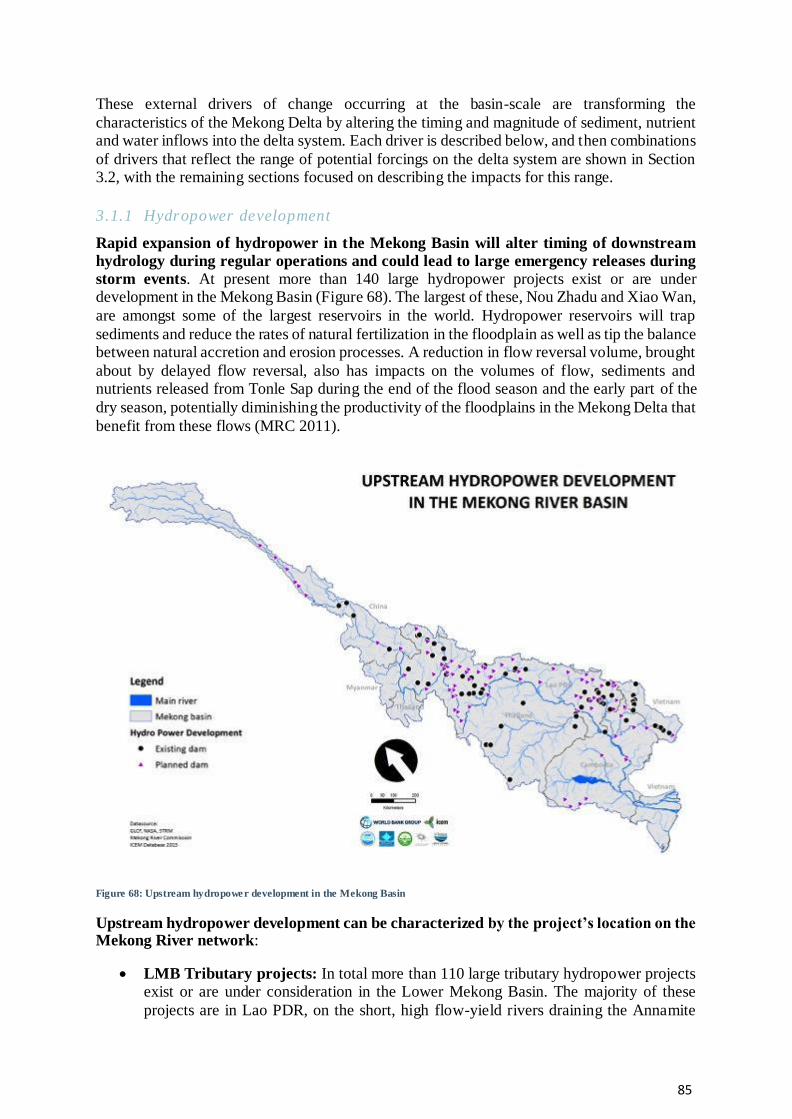
85
These external drivers of change occurring at the basin-scale are transforming the
characteristics of the Mekong Delta by altering the timing and magnitude of sediment, nutrient and water inflows into the delta system. Each driver is described below, and then combinations
of drivers that reflect the range of potential forcings on the delta system are shown in Section 3.2, with the remaining sections focused on describing the impacts for this range.
3.1.1 Hydropower development
Rapid expansion of hydropower in the Mekong Basin will alter timing of downstream
hydrology during regular operations and could lead to large emergency releases during
storm events. At present more than 140 large hydropower projects exist or are under development in the Mekong Basin (Figure 68). The largest of these, Nou Zhadu and Xiao Wan,
are amongst some of the largest reservoirs in the world. Hydropower reservoirs will trap
sediments and reduce the rates of natural fertilization in the floodplain as well as tip the balance between natural accretion and erosion processes. A reduction in flow reversal volume, brought
about by delayed flow reversal, also has impacts on the volumes of flow, sediments and nutrients released from Tonle Sap during the end of the flood season and the early part of the
dry season, potentially diminishing the productivity of the floodplains in the Mekong Delta that
benefit from these flows (MRC 2011).
Figure 68: Upstream hydropower development in the Mekong Basin
Upstream hydropower development can be characterized by the project’s location on the Mekong River network:
LMB Tributary projects: In total more than 110 large tributary hydropower projects exist or are under consideration in the Lower Mekong Basin. The majority of these
projects are in Lao PDR, on the short, high flow-yield rivers draining the Annamite

86
mountain ranges. LMB large tributary hydropower can be characterized as large
reservoirs with a high capacity for regulation relative to the flow in the hosting tributary. In addition to these large projects there are also hundreds of small and medium scale
reservoirs – primarily for irrigation – but little information is known on these projects;
Chinese mainstream projects: In total 7 mainstream hydropower projects have been
built on the Lancang River of the upper Mekong, at least an additional 10 projects are under consideration for this stretch of River extending from the Tibetan plateau,
through Yunnan province to the border with Lao PDR. These Chinese mainstream
projects are some of the largest projects in the Mekong basin (and in some cases the world). In Yunnan province the dams take advantage of the steep valley formations of
the Lancang to build high-head projects with reservoirs that have very large storage capacities. The development of a cascade of six hydropower projects on the Lancang
River since the mid-1990s has already begun reducing sediment loads entering the LMB; and
LMB mainstream projects: In total 11 LMB mainstream projects are under consideration in Lao PDR and Cambodia, with two projects Xayaburi and Don Sahong
under construction. These are large projects with very large reservoirs that will
transform more than 50% of the LMB mainstream12 from riverine to reservoir environment. Though the reservoirs are large, they have limited capacity to regulate
wet season flows given the size of wet season flow in the Mekong.
Upstream hydropower development has two main impacts on the Mekong system with
the scale of impact dependent on the type of hydropower project. First the reservoirs have
a regulating affect on flow, which allow the projects to store water from the wet season for release during the dry season. This regulation of flow dampens the flood-pulse signature of the
Mekong, which has been identified as the main driver behind the productivity of the Mekong’s floodplain and delta environment (Kummu et al, 2006). In the Mekong the regulatory affects
is highest in the Chinese mainstream projects and the LMB tributary dams where reservoirs
have the capacity to store up to 70% of the mean annual flow of their host rivers. The reservoirs with the most significant regulatory capacity are Nuozhadu and Xiaowan both Chinese
mainstream projects.
Second, the reservoirs have a barrier effect on the transport of sediment, nutrients and
biological organisms. In addition to the flow of water, the Mekong also transports vast
quantities of sediments, nutrients, fish and other aquatic productions. Sediments and nutrients are transported from the hillsides of the Mekong uplands to the floodplains, delta and coastal
environment of the Mekong. These sediments play an important role in both building and fertilizing the delta environment. The barrier effect on fish impacts on both upstream and
downstream migrations. Fish migrate along the Mekong River all year round, with the main
migrations focused on the start and end of the wet season. During these periods adult fish having fed in the rich wetland environments of the floodplain and delta move upstream to find
spawning grounds and nurseries. The fingerlings then travel downstream with the current reaching maturity in the floodplain and delta environments. In the Mekong the barrier effect
on sediment transport is highest for projects downstream of the basin’s high sediment yield
areas. This includes the Chinese mainstream projects (in the order of 50% of the Mekong’s natural sediment load originates from the Lancang catchment), the LMB mainstream projects
12 LMB mainstream is taken as the section of the Mekong River between the Lao-China border and Kratie in Cambodia, after which the river enters its floodplain and is no longer confined to the mainstream channel.

87
(especially those in Cambodia) and the large tributary hydropower in the Sesan, Srepok and
Sekong catchments (3S) where in the order of 22% of the Mekong’s natural sediment load originates. In terms of fish migration, the barrier effect is highest for projects on the mainstream
and for those closest to the floodplain environment. These include the LMB mainstream projects and the tributary projects in the 3S basin.
3.1.2 Land use change and defores tat ion
Deforestation and expansion of agricultural land and irrigation infrastructure coupled with
climate change has seen the Mekong’s hydrological regime exceed the natural bounds of variability captured in the long-term gauging station records of the basin available since the
early 1900s (ICEM, 2010). Rapid trends of deforestation, urbanization and agricultural
expansion will continue to alter the hydrological balance between surface run off and infiltration (MDP, 2011). The Mekong has some of the highest rates of deforestation in Asia
with more than one quarter of the total forest cover lost between 1973 and 2009 and rates of deforestation increasing over the past 10 years (Figure 69).
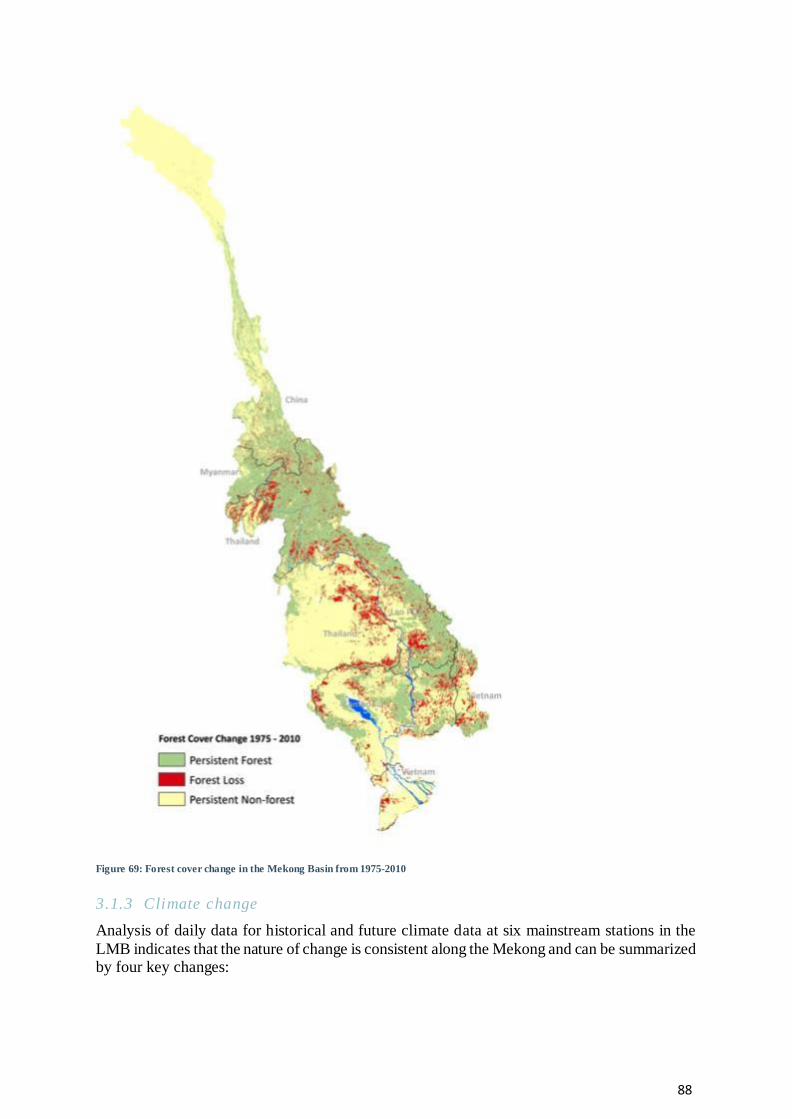
88
Figure 69: Forest cover change in the Mekong Basin from 1975-2010
3.1.3 Climate change
Analysis of daily data for historical and future climate data at six mainstream stations in the
LMB indicates that the nature of change is consistent along the Mekong and can be summarized by four key changes:
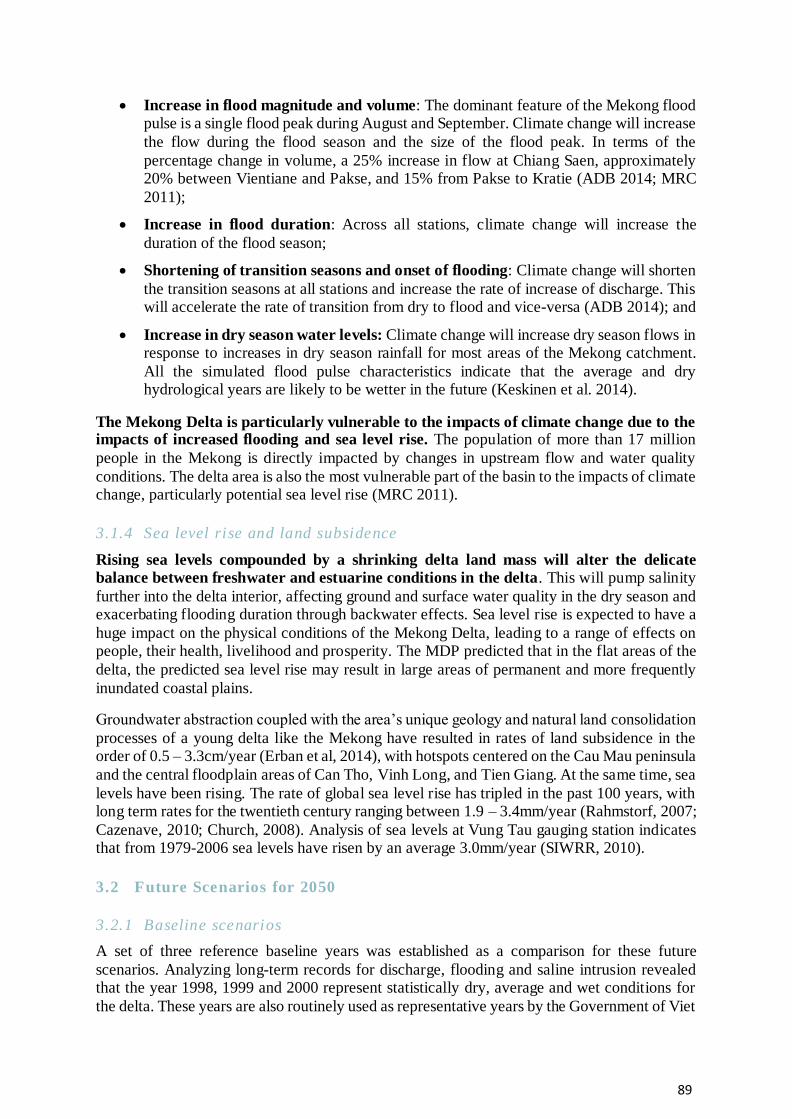
89
Increase in flood magnitude and volume: The dominant feature of the Mekong flood pulse is a single flood peak during August and September. Climate change will increase
the flow during the flood season and the size of the flood peak. In terms of the
percentage change in volume, a 25% increase in flow at Chiang Saen, approximately 20% between Vientiane and Pakse, and 15% from Pakse to Kratie (ADB 2014; MRC
2011);
Increase in flood duration: Across all stations, climate change will increase the
duration of the flood season;
Shortening of transition seasons and onset of flooding: Climate change will shorten
the transition seasons at all stations and increase the rate of increase of discharge. This will accelerate the rate of transition from dry to flood and vice-versa (ADB 2014); and
Increase in dry season water levels: Climate change will increase dry season flows in response to increases in dry season rainfall for most areas of the Mekong catchment.
All the simulated flood pulse characteristics indicate that the average and dry hydrological years are likely to be wetter in the future (Keskinen et al. 2014).
The Mekong Delta is particularly vulnerable to the impacts of climate change due to the impacts of increased flooding and sea level rise. The population of more than 17 million
people in the Mekong is directly impacted by changes in upstream flow and water quality
conditions. The delta area is also the most vulnerable part of the basin to the impacts of climate change, particularly potential sea level rise (MRC 2011).
3.1.4 Sea level rise and land subsidence
Rising sea levels compounded by a shrinking delta land mass will alter the delicate
balance between freshwater and estuarine conditions in the delta. This will pump salinity
further into the delta interior, affecting ground and surface water quality in the dry season and exacerbating flooding duration through backwater effects. Sea level rise is expected to have a
huge impact on the physical conditions of the Mekong Delta, leading to a range of effects on people, their health, livelihood and prosperity. The MDP predicted that in the flat areas of the
delta, the predicted sea level rise may result in large areas of permanent and more frequently
inundated coastal plains.
Groundwater abstraction coupled with the area’s unique geology and natural land consolidation
processes of a young delta like the Mekong have resulted in rates of land subsidence in the order of 0.5 – 3.3cm/year (Erban et al, 2014), with hotspots centered on the Cau Mau peninsula
and the central floodplain areas of Can Tho, Vinh Long, and Tien Giang. At the same time, sea
levels have been rising. The rate of global sea level rise has tripled in the past 100 years, with long term rates for the twentieth century ranging between 1.9 – 3.4mm/year (Rahmstorf, 2007;
Cazenave, 2010; Church, 2008). Analysis of sea levels at Vung Tau gauging station indicates that from 1979-2006 sea levels have risen by an average 3.0mm/year (SIWRR, 2010).
3.2 Future Scenarios for 2050
3.2.1 Baseline scenarios
A set of three reference baseline years was established as a comparison for these future
scenarios. Analyzing long-term records for discharge, flooding and saline intrusion revealed that the year 1998, 1999 and 2000 represent statistically dry, average and wet conditions for
the delta. These years are also routinely used as representative years by the Government of Viet

90
Nam and the MRC. Modelled and calibrated with observed data, these baseline years give users
the option to visualize data according to a low flood year (1998), an average flood year (1999), and a high flood year (2000).
3.2.2 Future scenarios
In order to understand the likelihood of these risks, we need credible projections of how the
future might change consolidated into an efficient set of scenarios. Definition of the scenarios
starts with the use of historic trends in the four drivers and other studies to extrapolate low, medium and high conditions for each driver separately. All possible permutations between
these drivers were than mapped in a 3D space, with each axis representing one driver of change (image). SLR and basin climate change were grouped together as they are not mutually
exclusive. Through this process, 27 scenarios were identified as bounding the limits of realistic
change for the four delta drivers:
Low Flood/High Salinity: Based on 27 scenarios combining low, medium and high changes in each of the four drivers, this projection identified the scenario which would
result in the greatest change in salinity intrusion for the delta and presents the extent
and duration of salinity intrusion under dry, average and wet years for the selected scenario. The scenario represents the upper bound of the maximum risk of salinity
intrusion by 2050 and when compared to baseline data allows delta planners to compare the maximum level of change which could be realistically expected in the delta system;
and
High Flood/Low Salinity: Based on 27 scenarios combining low, medium and high changes in each of the four drivers, this projection identified the scenario which would
result in the greatest change in flood risk for the delta and presents the extent, depth and duration of flooding under dry, average and wet years for the selected scenario. The
scenario represents the upper bound of the maximum risk of flooding by 2050 and when compared to baseline data allows delta planners to compare the maximum level of
change that could be realistically expected in the delta system.
By defining high, medium and low estimates for future conditions in these parameters and exploring the full range of possible combinations of these variables, scientists and engineers,
are able to estimate the total range in future hydro- sediment inputs to the delta system. In the worst case scenario, by 2050:
1. Sediment inflows to the delta will be reduced by 94%;
2. Dry season flow volumes will reduce by 18%;
3. Average annual flood flow volumes will decrease by 22%; and
4. Peak daily flood flows will increase dramatically with the historic 1 in 100year flood event becoming a 1 in 20 year event and the 1 in 10 year flood event becoming a 1 in 5
year event.
Given the dynamic nature of the Mekong delta and the rapid changes in the delta’s hydro-
ecological characteristics in response to external basin and global drivers of change as
well as unsustainable internal practices of water management, there is a need to present delta-planners with a realistic estimate of how the delta system is changing. This estimate
was made for a 25 year period centered on the year 2050 which presents a snap-shot of the
future delta conditions 35 years from now – a time horizon which encompasses the design life of most water resource and agricultural investments The scenarios are a systematic

91
characterization of the magnitude and range of realistic change in the four future drivers of
change identified as having the most significant impact on basin hydrological and sediment transport processes:
1. Rainfall and Temperature Changes: Climate change will increase the variability in seasonal rainfall, making the wet seasons wetter and the dry season drier and polarizing
the seasonal conditions of the Basin with more severe and frequent flood and drought
incidence;
2. Hydropower development in the Mekong Basin: Rapid expansion of hydropower in
the Mekong Basin will alter timing of downstream hydrology during regular operations and could lead to large emergency releases during storm events. Hydropower reservoirs
will also sever sediment transport processes, trapping sediments and reducing rates of
natural fertilization in the floodplain and offshore environments as well;
3. Land use change: Rapid trends of deforestation, urbanization and agricultural
expansion will continue to alter the hydrological balance between surface run off and infiltration; and
4. Sea level rise (SLR): Rising sea levels will alter the delicate balance between
freshwater and estuarine conditions in the delta, pumping salinization issues further into the delta interior affecting groundwater and permanently inundating large areas of the
Mekong Delta.
The scenarios use the historic trends in the four drivers and other studies to estimate low,
medium and high conditions for each driver separately. All possible permutations between
these drivers were than mapped in a 3D space, with each axis representing one driver of change SLR and basin climate change were lumped together as they are not mutually exclusive. Future
projections take the hydrographs for the three baseline representative years and then superimpose the future dry, average and wet conditions based on a realistic estimation of low,
medium and high change in the key external drivers of the delta’s hydro-ecology.
3.3 Regional threats to the Mekong Delta
For the Mekong Delta the scenarios have been used to model the future impacts of changes in
temperature and rainfall, flooding and saline intrusion
3.3.1 Temperature and rainfall
Of the four drivers considered, climate change is the only driver to modify the basin climate
conditions. Climate change will increase the variability in seasonal rainfall, making the wet seasons wetter and the dry season drier and polarizing the seasonal conditions of the Basin with
more severe and frequent flood and drought incidence. Average annual temperatures are expected to increase by 3-5oC by mid-century with average wet season precipitation increasing
by 3-14% (USAID, 2013). For the floodplain areas of The Mekong Delta increases in wet
precipitation will be coupled with increased peak daily precipitation events and drier dry seasons, compounding water availability issues by making wet seasons wetter and dry seasons
drier (USAID, 2013).
The yearly average rainfall in the Mekong Delta is 1733 mm and is mainly concentrated in the
rainy season. October has the highest rainfall and it is the period of flood peaks in the Mekong
Delta and also of water level rise due to strong winds. From January to March, average rainfall in this area is very low. The highest average rainfall (2200-2500 mm) occurs in Ca Mau and
Kien Giang provinces. Provinces with the lowest rainfall, ranging from 1300-1500 mm, are

92
Dong Thap, Tien Giang and Ben Tre (MDP 2011). Figure 70 below shows the changes in
precipitation in the wet season for 2050.
Figure 70: Changes in precipitation in Wet Season (%)
3.3.2 Flooding
Floods are a dominant feature of the Mekong Delta during the wet season. Historically
during large flood events, such as the year 2000 flood, in the order of 40% of the delta is
inundated to a depth of 1.0m or more. Maximum flood depths of 5-6m will be felt in An Giang, Dong Thap and Long An provinces where as much as 60-75% of these freshwater zone
provinces will be inundated. Of the external drivers assessed, climate change and its influence on both basin discharge and sea levels will have the strongest influence on future delta flood
dynamics. Under a 2050 scenario with high climate change and low hydropower and land use
change, eight of the 13 delta provinces will experience at least a 50% increase in flooded area.
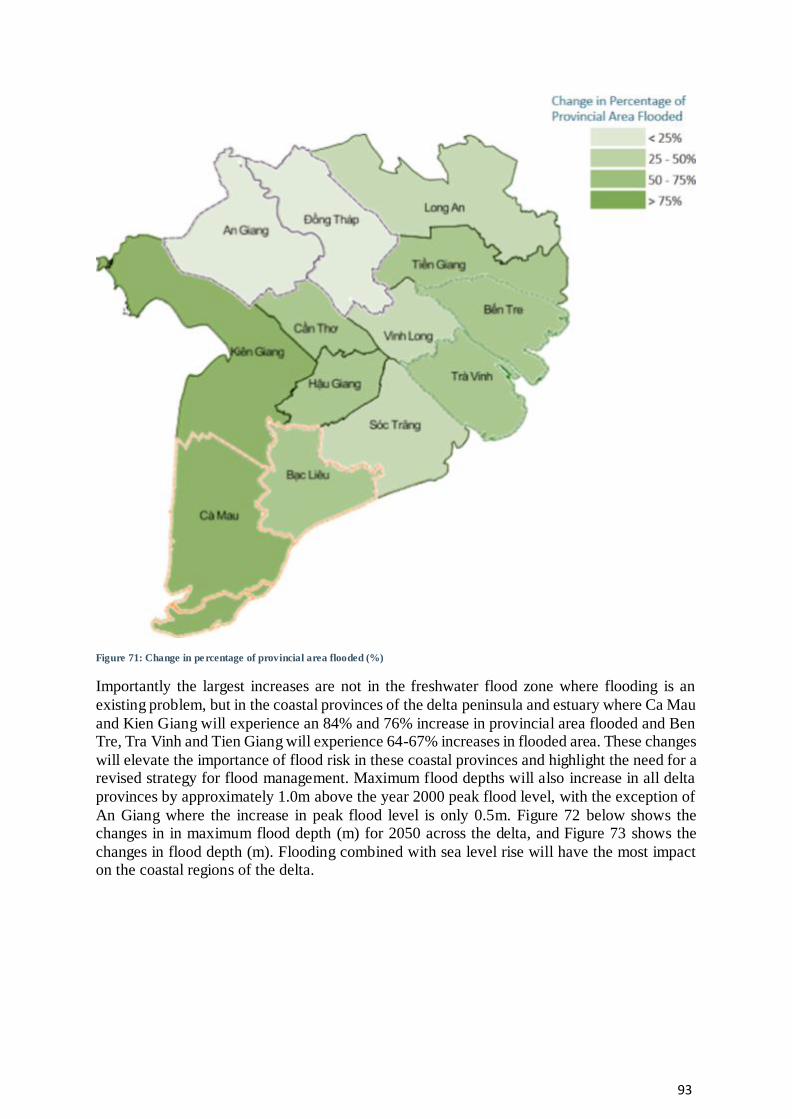
93
Figure 71: Change in percentage of provincial area flooded (%)
Importantly the largest increases are not in the freshwater flood zone where flooding is an
existing problem, but in the coastal provinces of the delta peninsula and estuary where Ca Mau
and Kien Giang will experience an 84% and 76% increase in provincial area flooded and Ben Tre, Tra Vinh and Tien Giang will experience 64-67% increases in flooded area. These changes
will elevate the importance of flood risk in these coastal provinces and highlight the need for a revised strategy for flood management. Maximum flood depths will also increase in all delta
provinces by approximately 1.0m above the year 2000 peak flood level, with the exception of
An Giang where the increase in peak flood level is only 0.5m. Figure 72 below shows the changes in in maximum flood depth (m) for 2050 across the delta, and Figure 73 shows the
changes in flood depth (m). Flooding combined with sea level rise will have the most impact on the coastal regions of the delta.

94
Figure 72: Increase in maximum flood depth (m)

95
Figure 73: Flood depth in meters
Figure 74 below shows the flood duration during a High flood year in a High Land Use
Change/High Hydropower Development/High Climate Change scenario. The delta estuary and
peninsula will have increased flood duration during the wet season impacting on agriculture and aquaculture productivity.

96
Figure 74: Day of flooding per year in the Mekong 2050
3.3.3 Saline intrusion
In dry years, such as 1998, salinity intrusion can be pervasive in the coastal and intertidal zones
of the delta, with as much as 35% of the delta experiencing salinity levels greater than 4g/l. Ca Mau is the most affected province in the delta with 90% of the province area affected in dry
years, followed by the delta estuary provinces of Ben Tre, Bac Lieu and Soc Trang (60-79%). In these provinces saline conditions can persist for more than 40 days during the year and up
to 100 days in Ca Mau, with maximum salinity concentrations reaching ocean-levels of 30-
35g/l. Of the external drivers assessed, climate change and its influence on both basin discharge and sea levels will have the strongest influence on delta salinity dynamics. Under a 2050
scenario with high climate change and low hydropower and land use change, three of the 13 delta provinces will experience at least a 20% increase in saline area. The percentage change
of area experiencing salinity intrusion by province is shown below in Figure 75.
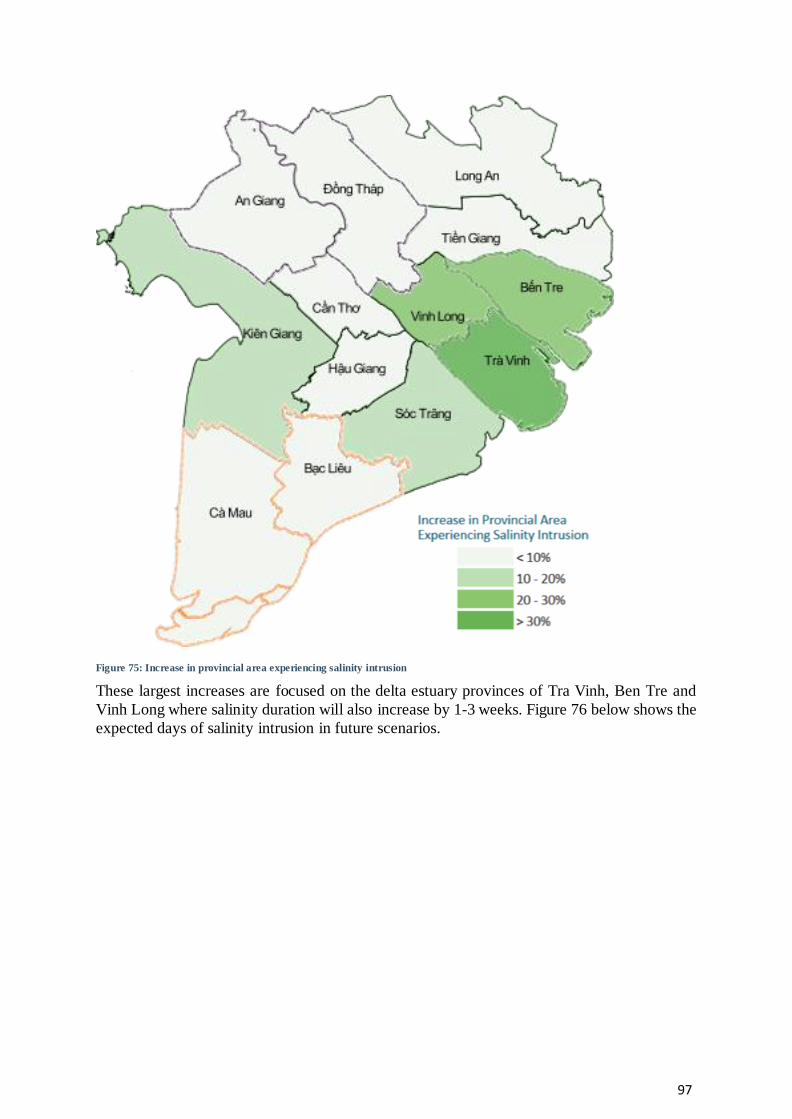
97
Figure 75: Increase in provincial area experiencing salinity intrusion
These largest increases are focused on the delta estuary provinces of Tra Vinh, Ben Tre and
Vinh Long where salinity duration will also increase by 1-3 weeks. Figure 76 below shows the
expected days of salinity intrusion in future scenarios.

98
Figure 76: Increase in number of days with salinity at higher than 4g/L
While salinity is a major existing problem for Ben Tre and Tra Vinh, the results for Vinh Long point to a deeper penetration of the salt-wedge up the Tien and Hau River channels elevating
the importance of salinity as an issue for the province where historically only 3% of the
province was affected compared to 26% under future worst- case conditions.
3.3.4 Coastal erosion
Coastal erosion is caused by the inter-play of three main drivers: 1) Sea level rise, 2) Land Subsidence, and 3) Reduced sediment Influx from upstream catchments. Marine and fluvial
processes of the delta maintain a balance between accretion and erosion of the delta land mass.
For the past 20 years the East Sea provinces of Ben Tre, Tien Giang, and Tra Vinh have been growing with net accretion rates of 1-10m/ year. Ca Mau has experienced net erosion over the
past 20 years with rates increasing from 1m/year to 16m/year during that period. The provinces of Bac Lieu and Soc Trang, aggrading before 2002 at rates of 16 – 24 m/year, are now eroding
at rates of 11-16m/year. Of the external drivers assessed, climate change coupled with the
impact of hydropower on sediment inflows will have the strongest adverse impact on coastal erosion. Under a 2050 scenario with high climate change and high hydropower expansion, all
six of the coastal provinces along the East Sea will experience rates of erosion between 34 to
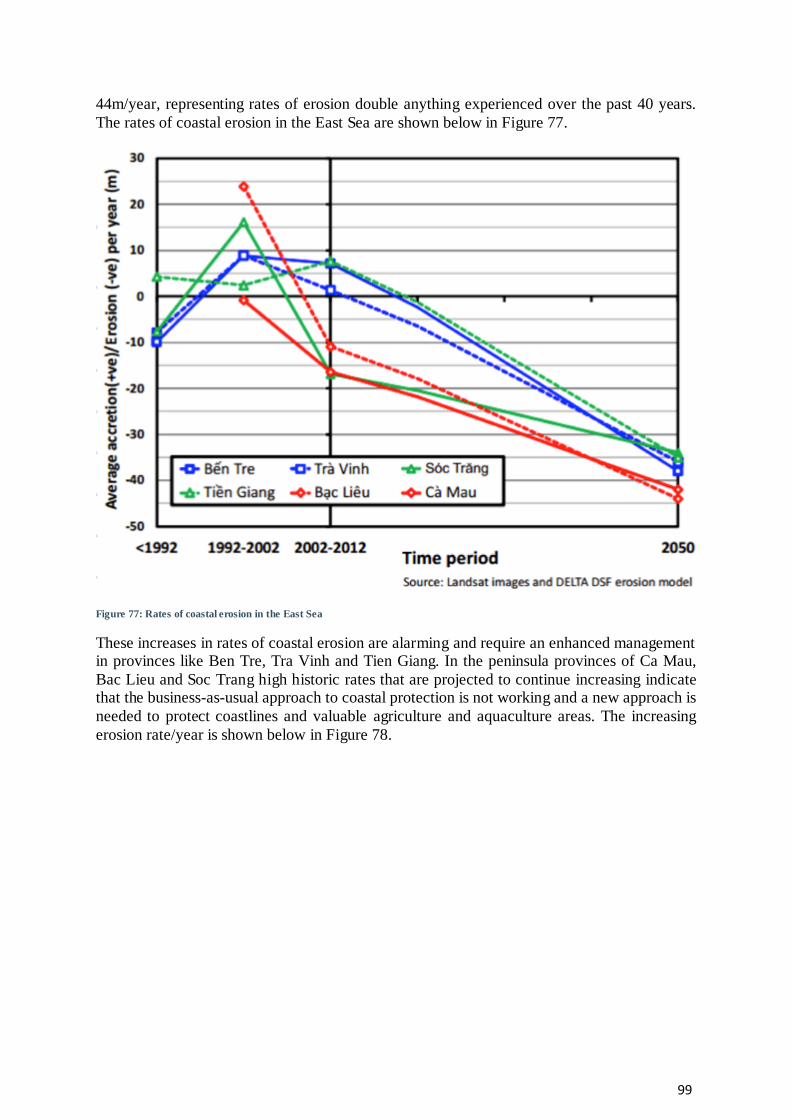
99
44m/year, representing rates of erosion double anything experienced over the past 40 years.
The rates of coastal erosion in the East Sea are shown below in Figure 77.
Figure 77: Rates of coastal erosion in the East Sea
These increases in rates of coastal erosion are alarming and require an enhanced management in provinces like Ben Tre, Tra Vinh and Tien Giang. In the peninsula provinces of Ca Mau,
Bac Lieu and Soc Trang high historic rates that are projected to continue increasing indicate that the business-as-usual approach to coastal protection is not working and a new approach is
needed to protect coastlines and valuable agriculture and aquaculture areas. The increasing
erosion rate/year is shown below in Figure 78.
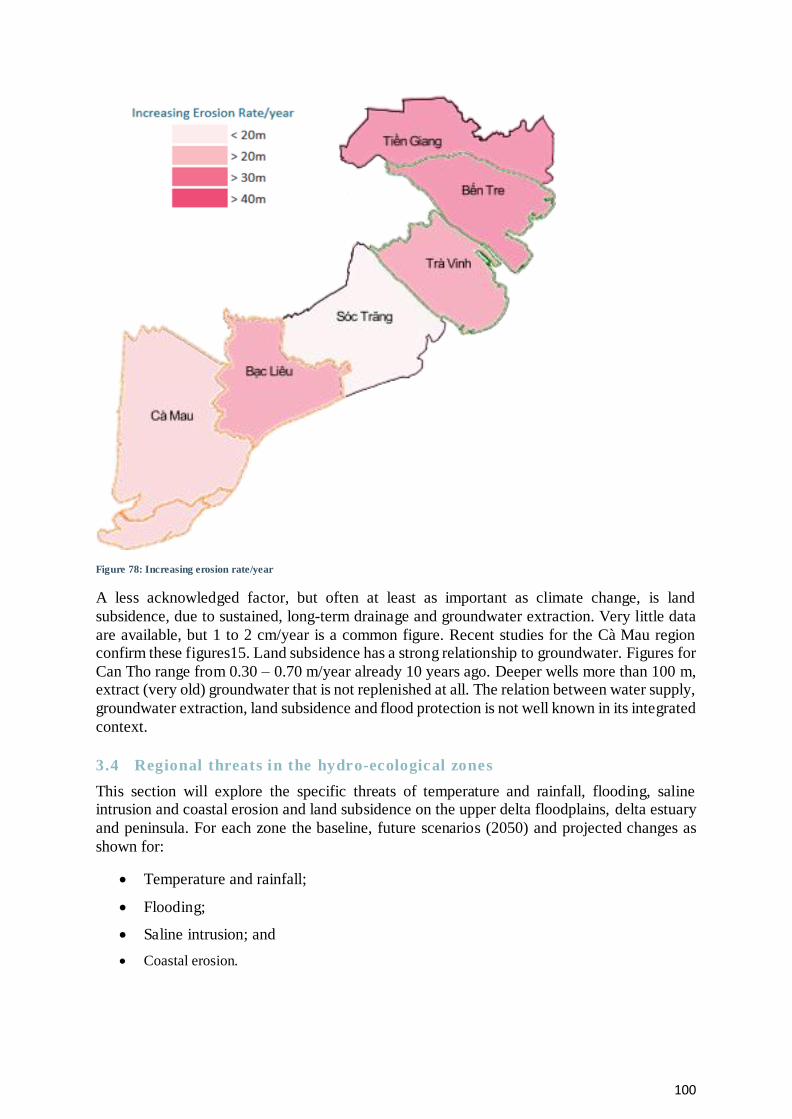
100
Figure 78: Increasing erosion rate/year
A less acknowledged factor, but often at least as important as climate change, is land
subsidence, due to sustained, long-term drainage and groundwater extraction. Very little data
are available, but 1 to 2 cm/year is a common figure. Recent studies for the Cà Mau region confirm these figures15. Land subsidence has a strong relationship to groundwater. Figures for
Can Tho range from 0.30 – 0.70 m/year already 10 years ago. Deeper wells more than 100 m, extract (very old) groundwater that is not replenished at all. The relation between water supply,
groundwater extraction, land subsidence and flood protection is not well known in its integrated
context.
3.4 Regional threats in the hydro-ecological zones
This section will explore the specific threats of temperature and rainfall, flooding, saline intrusion and coastal erosion and land subsidence on the upper delta floodplains, delta estuary
and peninsula. For each zone the baseline, future scenarios (2050) and projected changes as
shown for:
Temperature and rainfall;
Flooding;
Saline intrusion; and
Coastal erosion.

101
3.4.1 Component 2: Upper delta f loodplain
3.4.1.1 Temperature and rainfall
In 2050, the dry season temperatures are expected to increase by 2.5-2.75oC in An Giang and
Kien Giang, with changes of 1.75-2.5 oC for the rest of the upper delta floodplain (Figure 79).
Figure 79: Changes in average maximum temperature in the dry season in the upper delta floodplain
Rain in the dry season is expected to decrease in the upper delta floodplain. In 2050 the average dry season rainfall is expected to decrease by -3.5-3.9 in An Giang and by -4.5-4.9 in Dong
Thap (Figure 80). Some areas of the LXQ near the An Giang and Kien Giang provincial border
are already experiencing freshwater shortages in the dry season. In 2050 the average wet season rainfall in the upper delta floodplains will increase by 9.1-9.5% in An Giang and Dong
Thap (Figure 81).
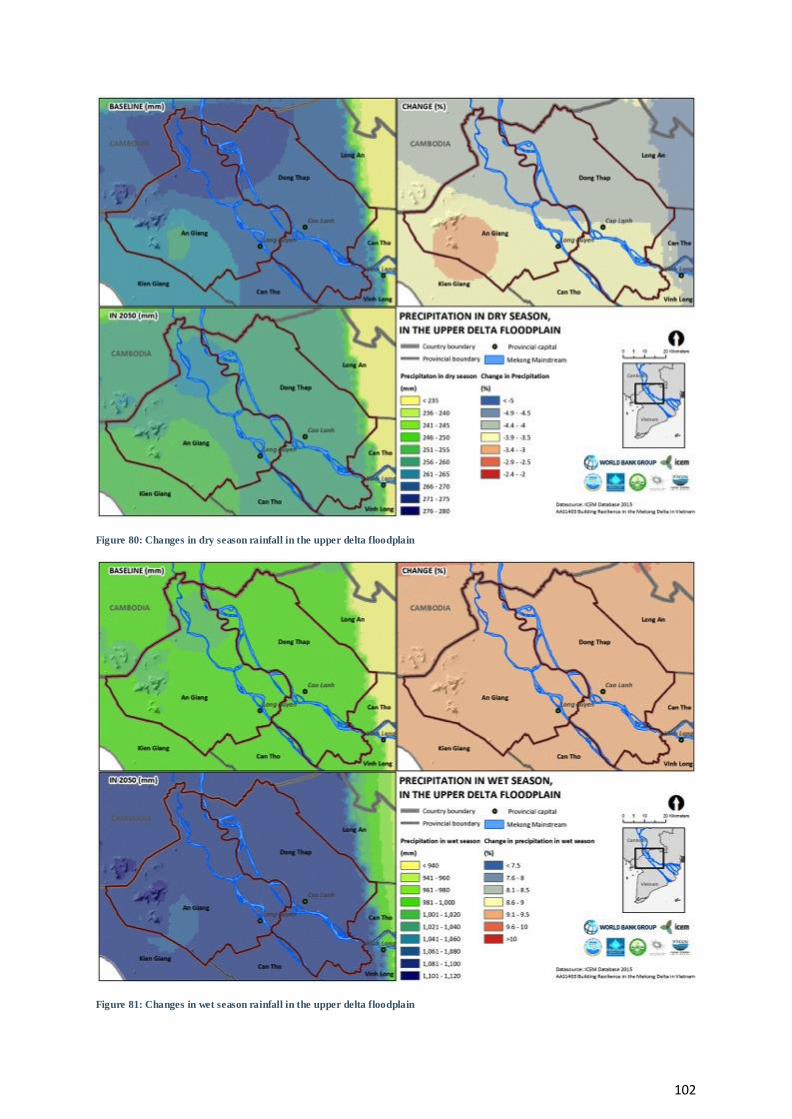
102
Figure 80: Changes in dry season rainfall in the upper delta floodplain
Figure 81: Changes in wet season rainfall in the upper delta floodplain

103
3.4.1.2 Flooding
In 2050 changes in maximum flood depth (meters) under extreme high conditions will increase
flood depth by 0.1-0.5 m and 0.6-1.0 in areas of the upper delta floodplain (Figure 82). The floodplains are inundated annually and existing flood-control systems developed to protect
infrastructure. The flood inundation (days) will increase by up to 1-10 and 11-20 days in areas
of An Giang and Dong Thap (Figure 83). This map also highlights the impacts of increased flooding on Can Tho province downstream of the upper delta floodplain that will experience
increased of 31-40 and 41-50 days of flood inundation (days).
Figure 82: Changes in maximum flood depth under extreme high condition in the upper delta floodplain
The changes in flood duration (<1m) under extreme high conditions will increase flooding inundation from 21-30 and 31-40 day in areas of the delta floodplain (Figure 83).
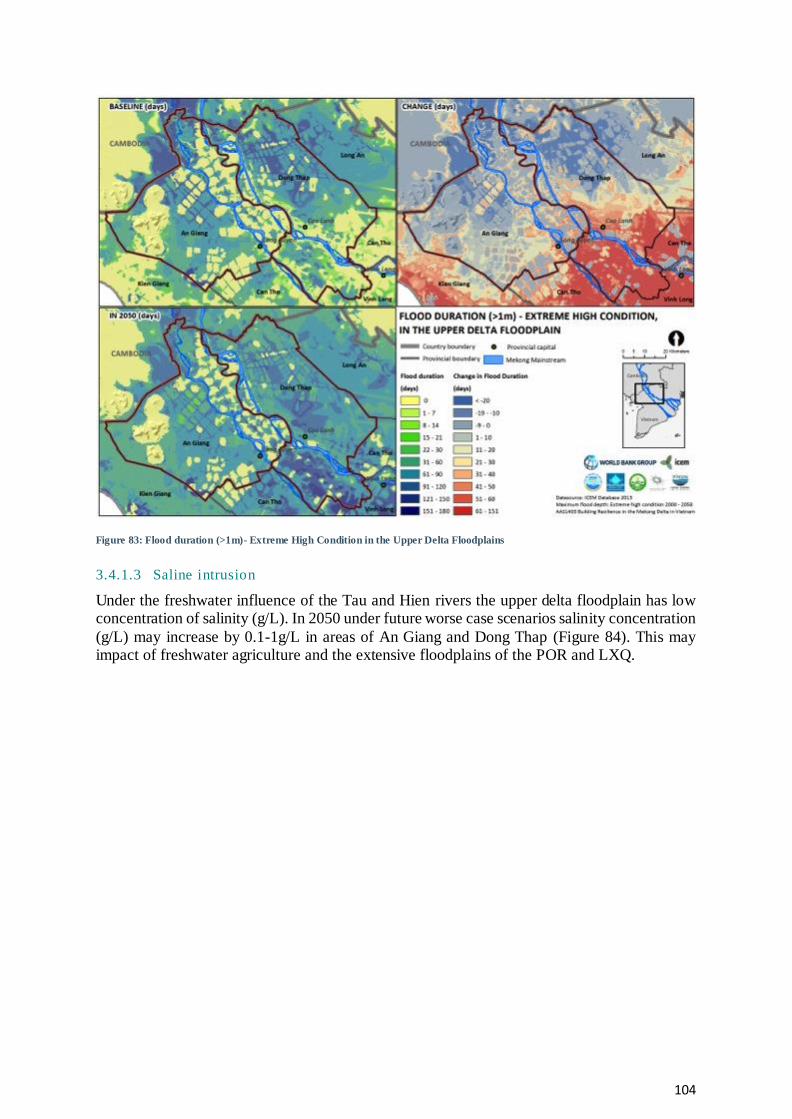
104
Figure 83: Flood duration (>1m)- Extreme High Condition in the Upper Delta Floodplains
3.4.1.3 Saline intrusion
Under the freshwater influence of the Tau and Hien rivers the upper delta floodplain has low concentration of salinity (g/L). In 2050 under future worse case scenarios salinity concentration
(g/L) may increase by 0.1-1g/L in areas of An Giang and Dong Thap (Figure 84). This may impact of freshwater agriculture and the extensive floodplains of the POR and LXQ.

105
Figure 84: Changing maximum salinity concentration under future worst case in the Upper Delta Floodplain
3.4.2 Component 3: Delta estuary
3.4.2.1 Temperature and rainfall
In 2050 the average maximum temperatures in the dry season will increase by 2-2.5oC in the delta estuary and up to 2.25-2.55oC in some areas of Soc Trang and Ben Tre (Figure 85). The
maximum average wet season temperatures will increase by 2.26-2.5oC in the coastal areas and up to 2.51 to 2.75oC further inland in the delta estuary (Figure 86).
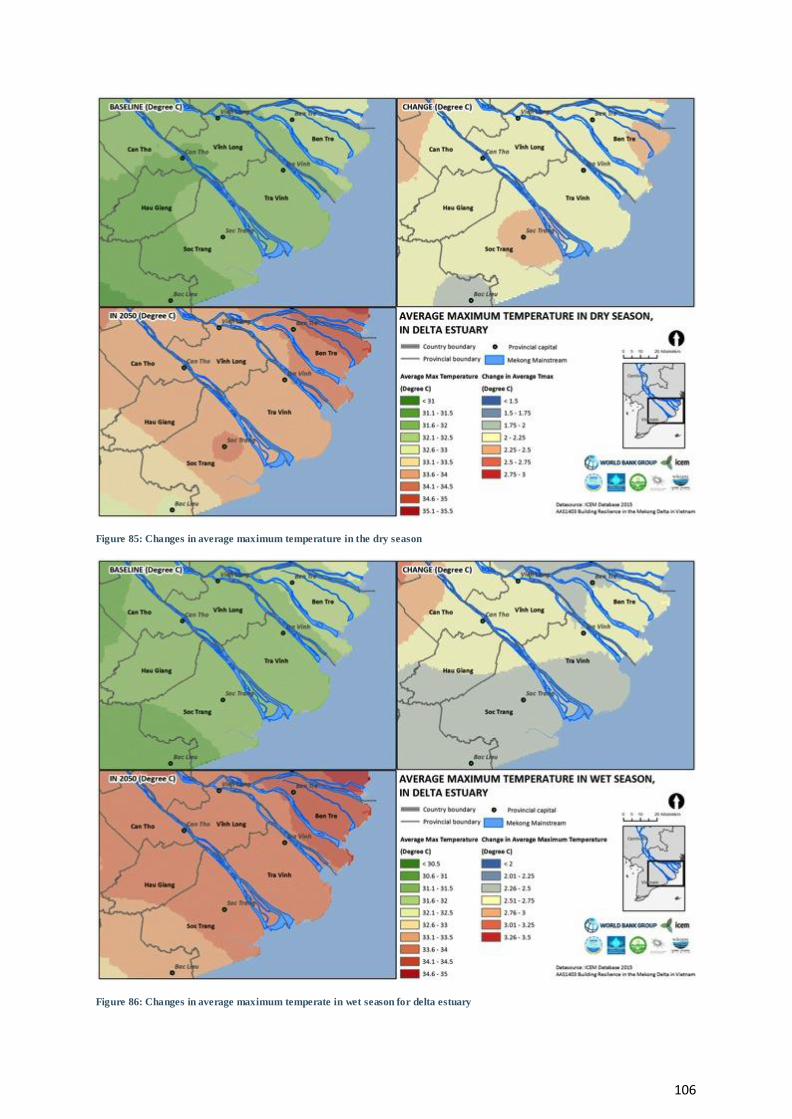
106
Figure 85: Changes in average maximum temperature in the dry season
Figure 86: Changes in average maximum temperate in wet season for delta estuary
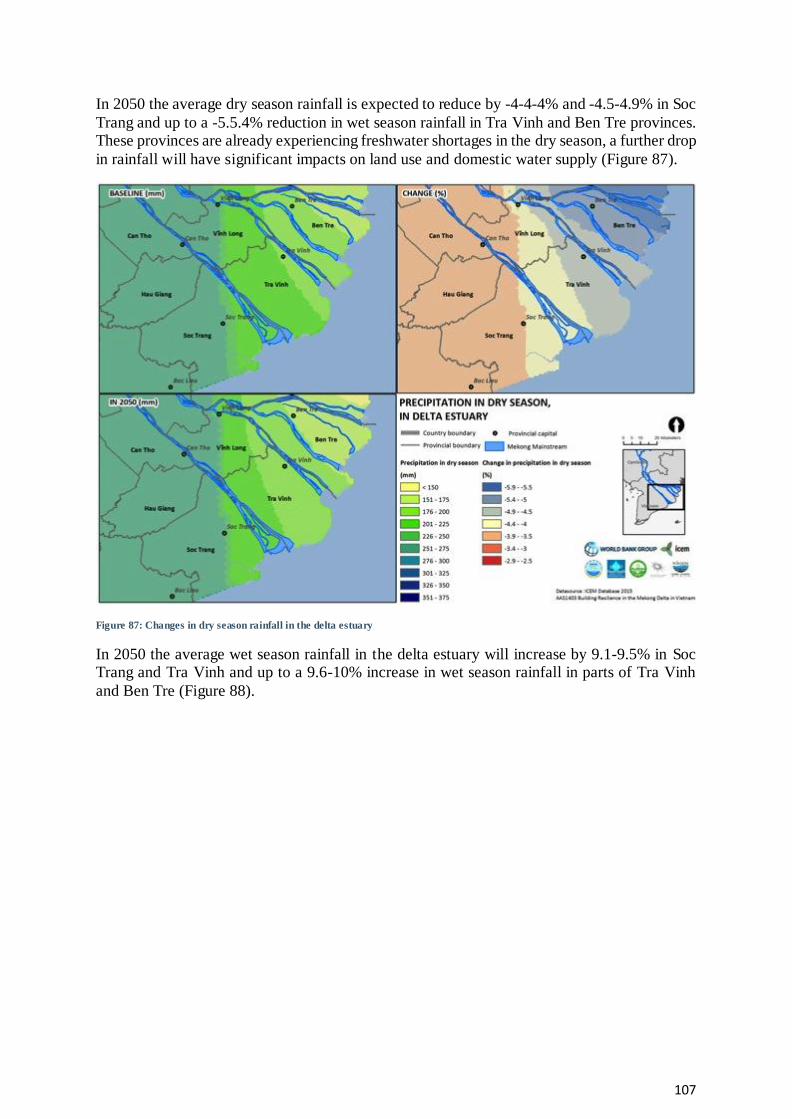
107
In 2050 the average dry season rainfall is expected to reduce by -4-4-4% and -4.5-4.9% in Soc
Trang and up to a -5.5.4% reduction in wet season rainfall in Tra Vinh and Ben Tre provinces. These provinces are already experiencing freshwater shortages in the dry season, a further drop
in rainfall will have significant impacts on land use and domestic water supply (Figure 87).
Figure 87: Changes in dry season rainfall in the delta estuary
In 2050 the average wet season rainfall in the delta estuary will increase by 9.1-9.5% in Soc Trang and Tra Vinh and up to a 9.6-10% increase in wet season rainfall in parts of Tra Vinh
and Ben Tre (Figure 88).
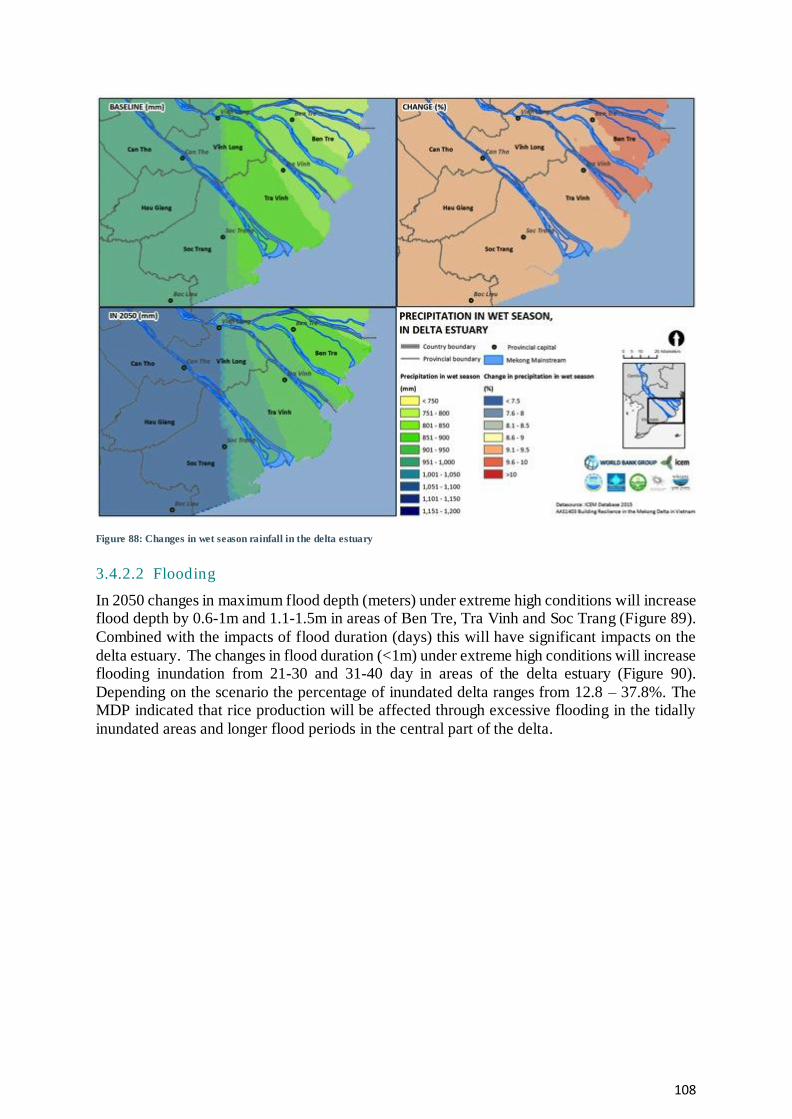
108
Figure 88: Changes in wet season rainfall in the delta estuary
3.4.2.2 Flooding
In 2050 changes in maximum flood depth (meters) under extreme high conditions will increase flood depth by 0.6-1m and 1.1-1.5m in areas of Ben Tre, Tra Vinh and Soc Trang (Figure 89).
Combined with the impacts of flood duration (days) this will have significant impacts on the
delta estuary. The changes in flood duration (<1m) under extreme high conditions will increase flooding inundation from 21-30 and 31-40 day in areas of the delta estuary (Figure 90).
Depending on the scenario the percentage of inundated delta ranges from 12.8 – 37.8%. The MDP indicated that rice production will be affected through excessive flooding in the tidally
inundated areas and longer flood periods in the central part of the delta.
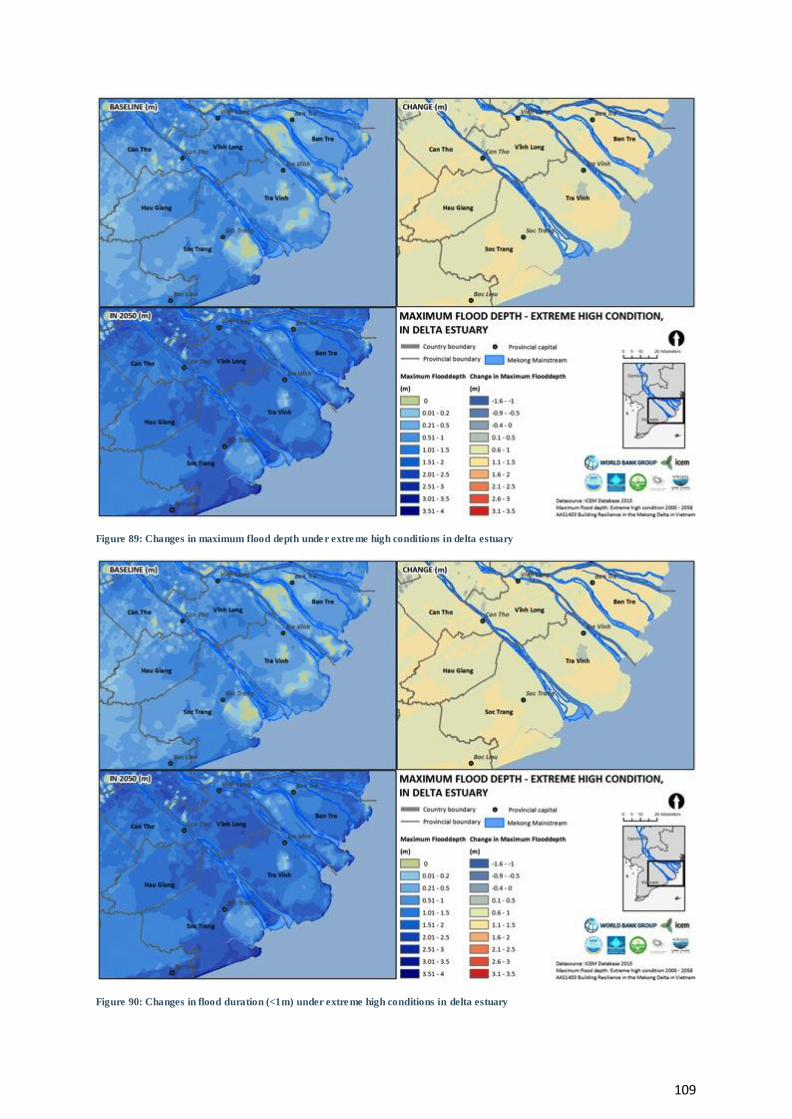
109
Figure 89: Changes in maximum flood depth under extreme high conditions in delta estuary
Figure 90: Changes in flood duration (<1m) under extreme high conditions in delta estuary
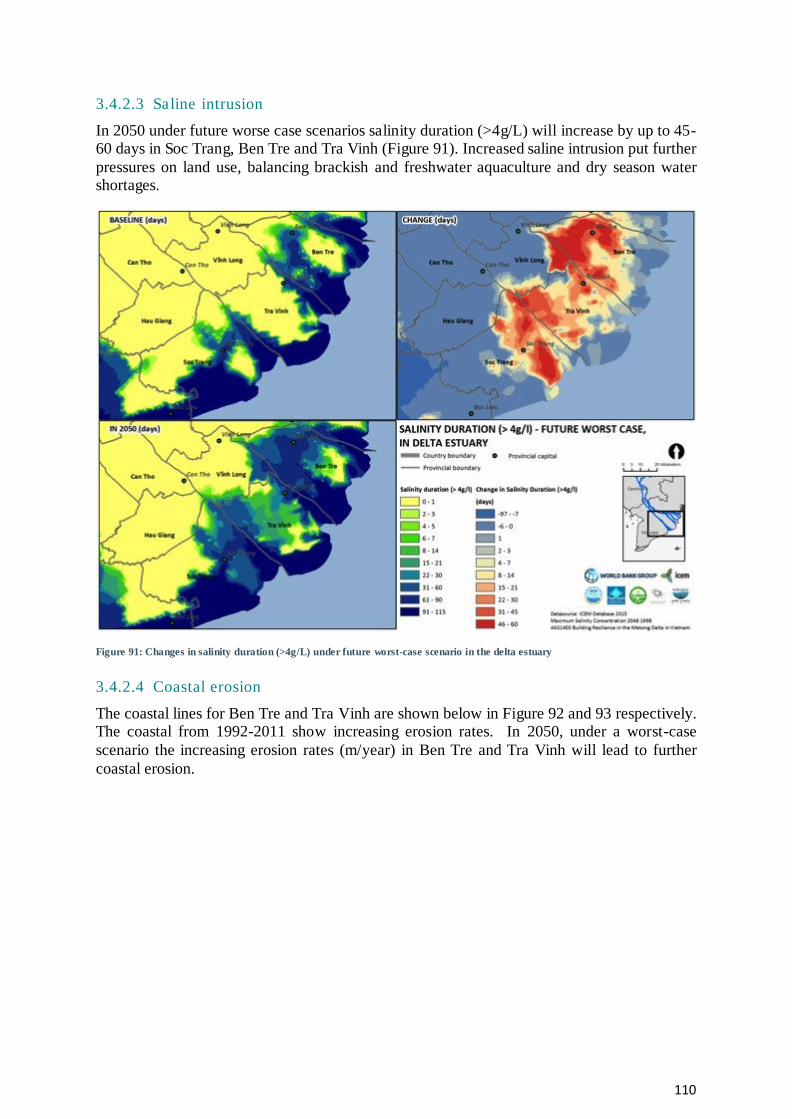
110
3.4.2.3 Saline intrusion
In 2050 under future worse case scenarios salinity duration (>4g/L) will increase by up to 45-60 days in Soc Trang, Ben Tre and Tra Vinh (Figure 91). Increased saline intrusion put further
pressures on land use, balancing brackish and freshwater aquaculture and dry season water shortages.
Figure 91: Changes in salinity duration (>4g/L) under future worst-case scenario in the delta estuary
3.4.2.4 Coastal erosion
The coastal lines for Ben Tre and Tra Vinh are shown below in Figure 92 and 93 respectively. The coastal from 1992-2011 show increasing erosion rates. In 2050, under a worst-case
scenario the increasing erosion rates (m/year) in Ben Tre and Tra Vinh will lead to further
coastal erosion.
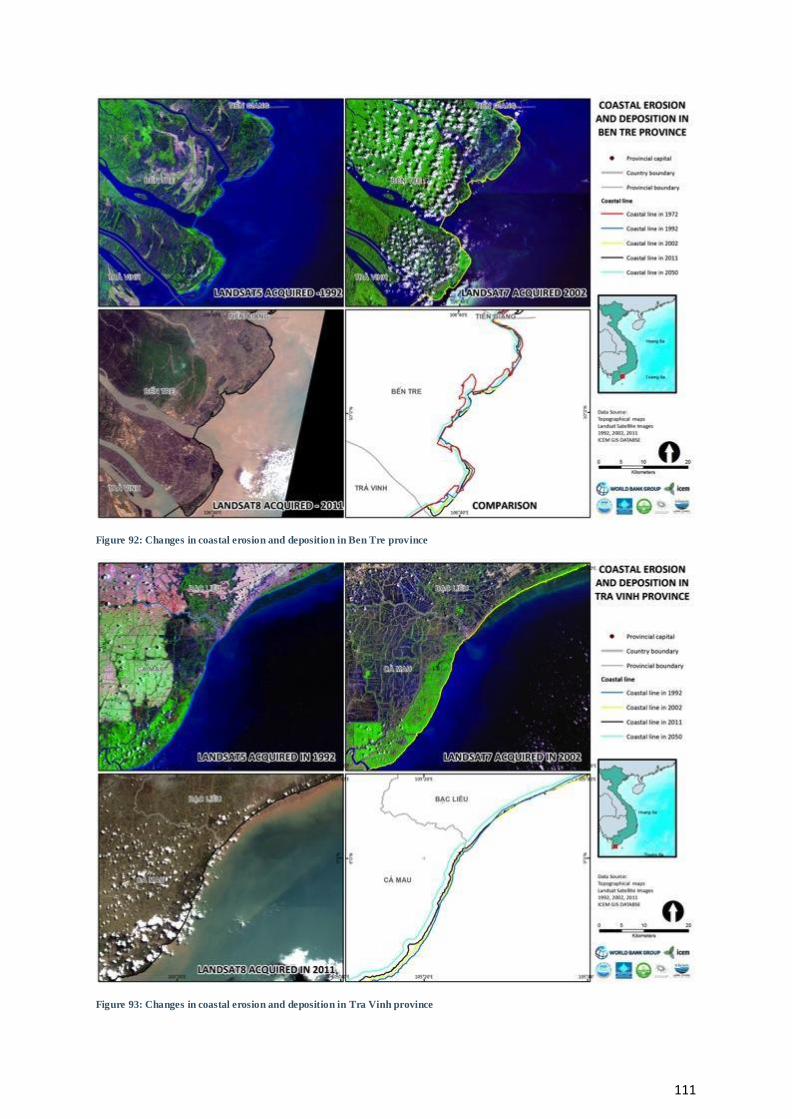
111
Figure 92: Changes in coastal erosion and deposition in Ben Tre province
Figure 93: Changes in coastal erosion and deposition in Tra Vinh province

112
3.4.3 Component 4: Delta peninsula
3.4.3.1 Temperature and rainfall
In 2050 the average maximum temperatures in the dry season will increase by 2-2.5oC in most
areas of Ca Mau and Bac Lieu (Figure 94). The maximum average temperatures in the dry season in Bac Lieu are expected increase from around 30.6oC to 32.6oC. The maximum average
wet season temperatures will increase by 1.75-2oC in the Ca Mau peninsula to 2.0-2.25oC
further inland in Bac Lieu (Figure 95).
Figure 94: Changes in dry season average maximum temperatures

113
Figure 95: Changes in wet season average maximum temperatures for delta peninsula
In 2050 the average dry season rainfall is expected to reduce by -3.5-3.9%. Some areas of Ca
Mau are already experiencing freshwater shortages in the dry season, a further drop in rainfall
will have significant impacts of water supply for agricultural and domestic uses (Figure 96).
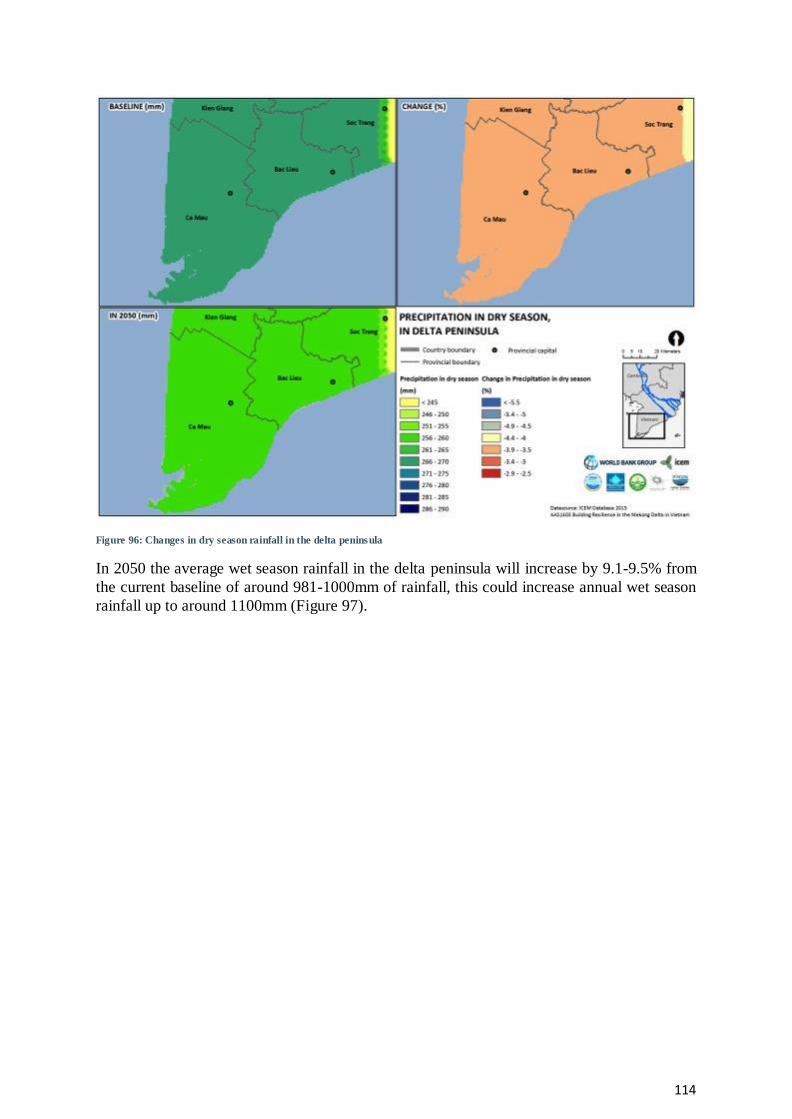
114
Figure 96: Changes in dry season rainfall in the delta peninsula
In 2050 the average wet season rainfall in the delta peninsula will increase by 9.1-9.5% from
the current baseline of around 981-1000mm of rainfall, this could increase annual wet season
rainfall up to around 1100mm (Figure 97).

115
Figure 97: Changes in wet season rainfall in the delta peninsula
3.4.3.2 Flooding
In 2050 under extreme high conditions the maximum flood depth (meters) will increase by 0.6-
1m and 1.1-1.5m in the delta peninsula (Figure 98). The delta peninsula is highly vulnerable to flooding with the combination of sea level rise and increased wet season rainfall. In 2050 under
extreme high conditions, coastal areas of Ca Mau, Bac Lieu will experience an increase of flood duration by up to 101-140 days (Figure 99). The baseline only some areas of Bac Lieu
experience flood duration (days) of 8-21 days.

116
Figure 98: Changes in maximum flood depth under extreme high conditions for delta peninsula
Figure 99: Changes in flood duration (>1m) under extreme high conditions for delta peninsula
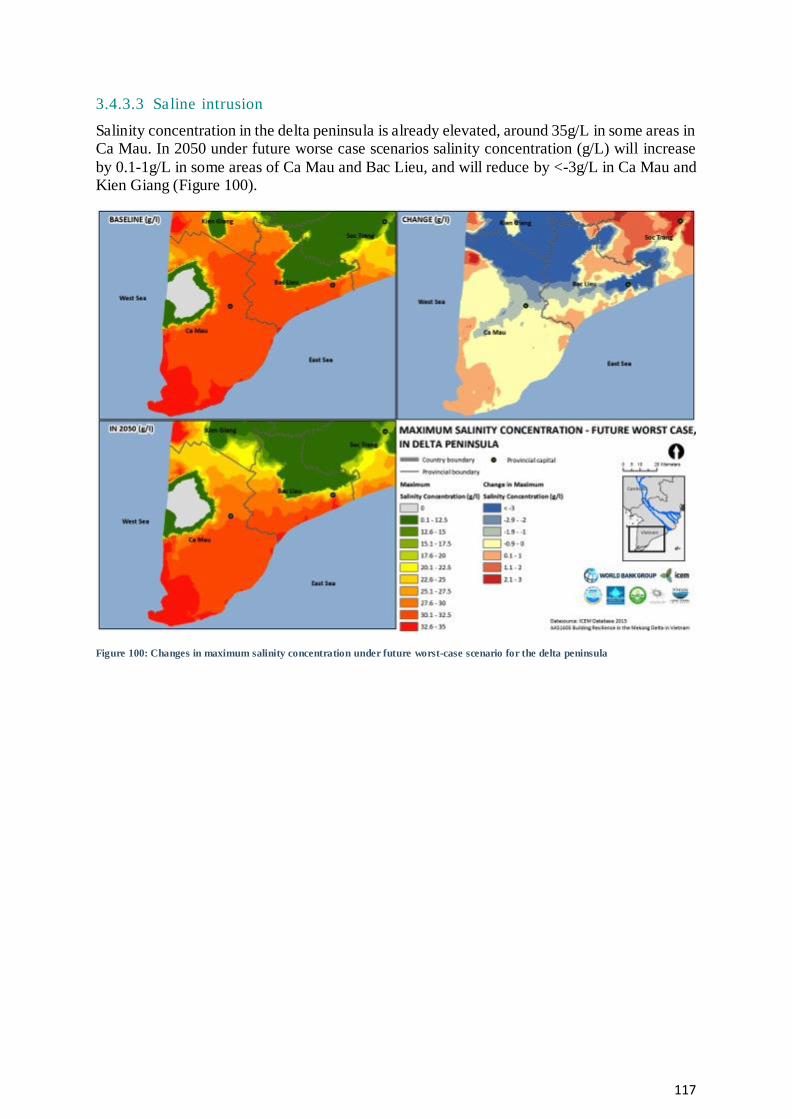
117
3.4.3.3 Saline intrusion
Salinity concentration in the delta peninsula is already elevated, around 35g/L in some areas in Ca Mau. In 2050 under future worse case scenarios salinity concentration (g/L) will increase
by 0.1-1g/L in some areas of Ca Mau and Bac Lieu, and will reduce by <-3g/L in Ca Mau and Kien Giang (Figure 100).
Figure 100: Changes in maximum salinity concentration under future worst-case scenario for the delta peninsula

118
Figure 101: Changes under salinity duration (4g/L) under future worst-case scenario in the delta peninsula
3.4.3.4 Coastal erosion
The coastal lines for Soc Trang and Bac Lieu (Figure 102) and Bac Lieu and Ca Mau (Figure 103) show increasing rates of erosion from 1992-2011. In 2050 under a worst-case scenario
the increasing erosion rates (m/year) will lead to further coastal erosion in the delta peninsula, especially the Ca Mau peninsula that is influenced by both the East and West Sea.

119
Figure 102: Changes in coastal erosion in Bac Lieu and Soc Trang
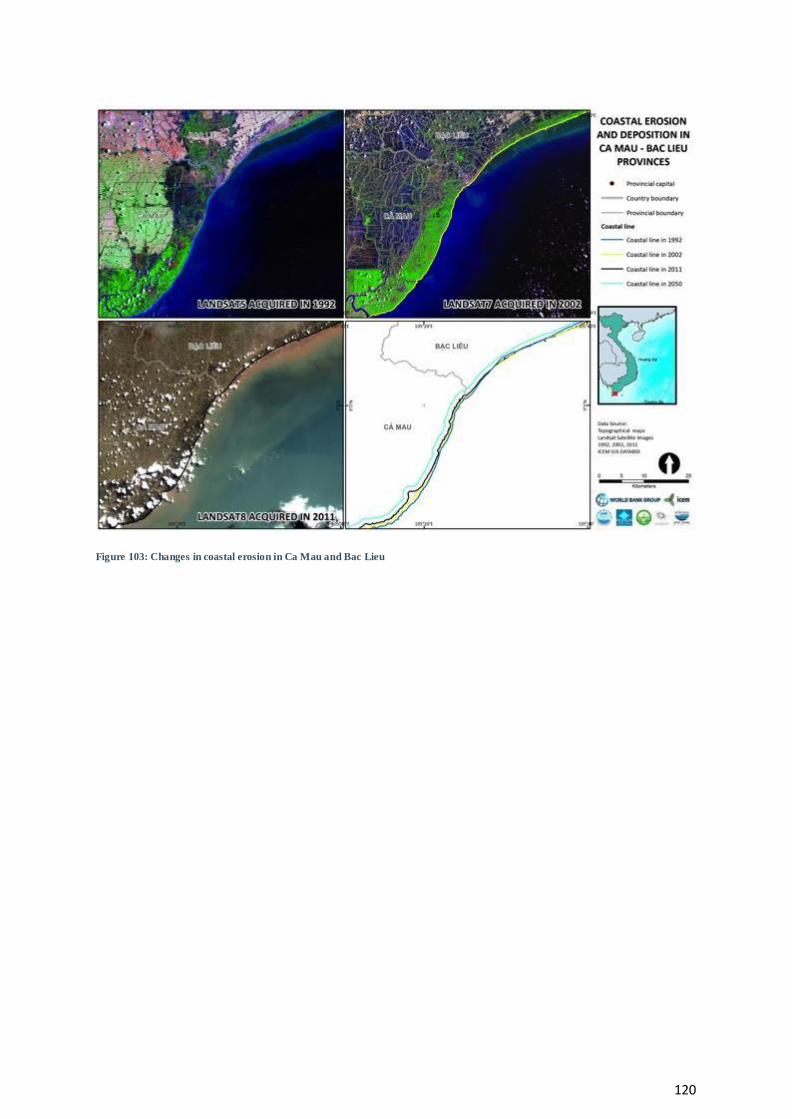
120
Figure 103: Changes in coastal erosion in Ca Mau and Bac Lieu

121
4 LEG AL AND INSTITUTIO NAL
ASSESSMENT
This section examines at the legal and institutional framework in Vietnam for climate change
adaptation and mitigation and recommendations for improving environmental management in the water resources management and agricultural sectors.
Globally, climate change is expected to seriously impact production, livelihoods and the environment. Rising temperatures, sea level rise, flooding, dry season water shortages and
salinity intrusion will affect agriculture, posing a major risk to economic growth and
livelihoods. The global average temperature and sea levels rose rapidly in the last 100 years, especially in the last25 years. El Niño, La Niña had increasingly strong impact. Climate change
has increased the prevalence and severity of natural disasters, including storms, flooding and drought (IPCC 2012).
4.1 Projected climate change impacts in Vietnam
Vietnam is likely to be highly impacted by climate change, due to a very long coastline, dependence on agriculture, largely rural population (70 percent), low levels of development in
rural areas, and the location of Ho Chi Minh City- the largest urban center in a low-lying coastal zone. Vietnam has been identified as one of the top 15 countries in the world already vulnerable
to natural hazards like drought and storms, in terms of number of people and scale of exposure
(Dilley et al. 2005). Forecasted temperature increases will exacerbate this condition to levels previously not experienced. The increase in temperature would be in the range of 1.6 to 2.8oC
in different climate zones. Temperatures in Northern and Northern Central climate zones of Vietnam are predicted to increase faster than those in Southern zones.
Vietnam has already begun to feel the effects of climate change: average surface temperature has risen 0.7°C since 1950, prolonged typhoon and flood seasons, droughts in areas previously
not vulnerable to aridity have been recorded, increased incidences of heavy rainfall and
flooding; and storms are tracking into new coastal areas (Carew-Reid 2008; Ho Long Phi 2008). Further, the season for storms will likely extend, meaning that areas that have not
typically experienced severe storms (the southeastern portion of the country and HCMC) may become increasingly vulnerable
The forecasted climate changes impacts to 2100 predicted; increased wet season rainfall,
reduced dry season rainfall of around 10% or more, higher intensity and frequency of storms and floods and sea level rise of at least 1 meter (GOV 2008). Different regions of Vietnam are
likely to have unique climate impacts, making a single national policy for adaptation difficult. Climate changes impacts will be experienced amid a host of ongoing national trends that can
increase vulnerability to change, including:
extensive losses of mangroves to shrimp farming for global export;
declines in agricultural crop diversity;
household livelihoods that are becoming less diverse;
privatized natural resource commons; and
eroded public social safety nets.
4.1.1 Social aspects of climate change
122
A recent study on social aspect13 aims to highlight how vulnerability to climate change is
socially differentiated and what elements are needed to strengthen the adaptive capacity of poor people and regions, and how governments can support adaptation that addresses the needs of
the poorest and most vulnerable, while maximizing co-benefits with development goals. In addition, the study draws attention to 'soft' or institutional and policy measures of adaptation
that is well placed to complement 'hard' infrastructure investments. Vietnam was among the
five countries studied. Among the key findings, the most relevant to Mekong delta are summarized below:
Vulnerability to climate change is socially differentiated and exposure to climate risk will pose different risks to different groups of people. Those who are most vulnerable
to climate risk were those already socially vulnerable (elderly, women, children, sick, disabled); ethnic minorities; indigenous peoples; people dependent on natural resources
for their livelihoods; and migrants.
The poor were identified as particularly vulnerable, this finding highlights the target
groups that need priority attention for adaptation measures and development interventions in order to build local resilience;
‘One size fits all’ adaptation planning does not work; different communities among different regions will have different ideas about how to match their development
objectives to the realities of climate change impacts on these development trajectories.
Experience with climate events to date and past coping measures hold valuable lessons for the future; but future adaptation requires new knowledge and improved access to information to reduce the risk.
Decisions to invest in hard adaptation measures may be “high‐regrets” options in social
and economic terms and require careful review while investing on “soft investment” such as increasing knowledge and building response capacity (i.e. investing in disaster
risk management; having yearly evacuation drills, providing weather data to local
authorities, etc.) could be more cost-effective given the level of future uncertainties.
Interventions therefore need to be designed in an integrated and cross‐sectoral manner in order
to address risks and benefits of adaptation options for different stakeholders across scales.
4.2 Governance arrangements for responding to climate change
4.2.1 National Target Programme to Respond To Climate Change (NTPRCC)
The Government of Vietnam has ratified the UNFCC and the Kyoto Protocol. In response to climate change, the government has created a legal framework for the prevention and
mitigation of natural disasters. The National Target Programme to Respond to Climate Change
(NTPRCC) was approved in December 2008 and the National Strategy on Climate Change was approved in December 2011. These are important achievements of the Government with the
support of international donors and development partners in response to respond to climate change in Vietnam.
The Ministry of Natural Resources and Environment (MONRE) MONRE in co-ordination with
other agencies are responsible for the implementation of the NTPRCC and have implemented
13 The Economics of Adaptation to Climate Change (EACC): Social Component (draft May 27, 2010).
123
core tasks on institutional development, policy and planning, building scenarios of climate
change and sea level rise and assessing the impact of climate change on different sectors and regions and building science and technology.
Vietnam has adopted a strategy of ‘no regrets’ for climate change mitigation. The Government is balancing the priorities of economic development and energy with social and environmental
issues. Investments in the technology industry and other sectors will significantly reduce the
amount of waste and wastewater on a national scale. Policies on reducing energy use in combination with economic instruments such as charges and taxes is slowly changing habits to
reduce emissions in the industry and manufacturing sectors to promote more sustainable use of energy and resources.
4.2.2 Climate change adaptation
Adapting to climate change is the core strategy of the Government of Vietnam climate policy. The IPCC reported that sea levels will rise 19-59cm by 2100, however many scientists predict
sea levels will rise by at least one meter by 2100 and will generate serious costs to the coastal areas of Vietnam, especially the Mekong Delta. This will require investments in infrastructure
for flood and salinity control and coastal protection. The environmental and social concerns
related to the construction of dike and water control structures needs s to be considered in detail prior to any new investments. The policy for the development of structural measures is
necessary and focused on protecting urban areas and key economic zones, including agriculture.
In recent years, nine participating national target programs have been implemented across a
number of sectors to cope with climate change development and 122 policy actions, led by: MONRE, MARD and the Ministries of Industry and Trade, Construction, Communications
and Transport, Health, Planning and Investment, Education and Training, and Finance. Within this policy framework, 122 policy actions on climate change have been approved.
4.2.3 Implementat ion of climate change program
MONRE was responsible for leading and coordinating the implementation of the climate change program. The following results have been achieved:
Developed and issued the guidance framework to build an action plan to respond to climate change and help the ministries, branches and localities to study and develop a
plan of action to respond to climate change;
Formulated and submitted to the Prime Minister the assessment criteria for priority
projects under the Support Programme to Respond to Climate Change (SP-RCC) (Decision No. 1719 / QD-TTg dated 04/10/2011 of the Prime Minster);
Issued guidelines for the construction of priority projects proposed under the SP-RCC (Document No. 3939 / BTNMT -KTTVBDKH day in November 2011 to the ministries,
branches and localities);
The Council established interdisciplinary evaluation and determined the list of priority
projects under the SP-RCC (Decision No. 1985 / QD-BTNMT, October 27, 2011);
Working Regulation issued by the Interagency Council (Decision No. 1986 / QD-
BTNMT October 27, 2011); and
124
Coordinated with the Ministry of Finance (MOF) and Ministry of Planning and Investment (MPI) to issue ‘Joint Circular No. 07/2010 / MPI TTLT BTNMT-BTC
guiding the management and use of State budget implementation National Target
Programme to Respond to Climate Change 2009-2015’.
4.2.4 Regional coordination of LMB countries
Climate change also poses a new challenge to the countries in the LMB countries. While the models predict overall temperature increases, predictions regarding precipitation are less
certain. However extreme weather events, both floods and droughts, are likely to become more
frequent and there is likely to be less predictability in weather patterns. Longer term climate forecasting must be an essential building block in decision-making regarding development of
new water related developments including hydropower. The MRC has started a regional analysis on climate change impacts on the hydrology of the LMB using a modeling approach.
However, existing data and information collection systems are still largely inadequate to capture the complexities of the basin. At the same time, the LMB countries have recognized
the need to upgrade their own hydro-meteorological (hydro-met) networks to address the risks
posed by both present and future weather events and to share information among riparian countries and develop improved regional and national systems for flood and drought
forecasting and warning.
4.3 Results of CC adaptation action plan in Vietnam
Based on the results of the climate change impact assessment, there are seven Ministries that
have issued 7 action plans to respond to climate change. A number of key activities have been implemented.
4.3.1 Natural resources and environment Based on the National Strategy on Climate Change, MONRE in collaboration with other
Ministries and the construction sector, the PM issued the ‘National Action Plan on Climate
Change 2012-2020’, which included the following objectives:
Strengthening climate monitoring, early warning of natural disasters;
Ensuring food and water security;
Proactively responding to natural disasters to protect against flooding and strengthening of river dykes, sea dykes and reservoir safety;
Reducing greenhouse gas emissions through low carbon development;
Strengthening management and policy mechanisms to respond to climate change;
Mobilizing the participation of all economic sectors, scientific institutions and NGOs
in responding to climate change and improving community resilience to climate change; and
Raising awareness and develop human resources.
Developing science and technology as the basis for policy development, impact
assessment and identifying measures to adapt to and mitigate climate change impacts;
Promoting international cooperation, empowerment and role of Vietnam in
international activities on climate change; and
Mobilizing financial resources and coping with climate change.
4.3.2 Agricultural sector
Vietnam needs to focus on building sustainable agriculture through the application of advanced
technologies to maintain and develop the quality and quantity of agricultural products in the context of climate change. MARD develops the technical solutions for the management and

125
sustainable development of agriculture to respond to climate change in the Mekong Delta,
including:
protecting mangrove forests;
modelling greenhouse gas emissions by water saving irrigation techniques in rice cultivation;
building early warning systems for flood and drought risk of food insecurity in the Red
River and the Mekong Delta in 2030; and
Assessing the impacts of climate change on safety and efficiency of reservoirs and
response solutions.
4.3.3 Land use planning
The GoV issued land use planning to 2020, on the implementation of the Land Law 2013 this plan was superseded by the development of the 2016-2020 land use planning that focused on
meeting requirements in socio-economic development, national defense and security,
protecting natural resources and adapting to climate change and sea level rise. MONRE other ministries, relevant agencies and People’s Provincial Committees (PPCs) also reviewed
land use plans. The MPI also forecasted the country’s socio-economic development in the 2016-2020 period, making it easier for adjustments to be made to land use planning from 2016-
20. This forecasting included a review of the planning of industrial zones, golf courses, costal
and border economic zones to 2020. MARD reviewed forest and agricultural development planning and recommended a list of projects for land use, as well as adjusting the area for rice
planting at provincial administrative level.
4.3.4 Agricultural Restructuring Plan
Recently, the Government has issued an instruction to accelerate the implementation of the
‘Agricultural Restructuring Plan’ towards higher added value and sustainable development. The new instruction targets close cooperation in value chains from production to consumption
among farmers, collectives, and enterprises. Further research on scientific and technological advances, market information and especially trade commitments for the agro-forestry and
fishery sectors was undertaken to improve market development, appropriate protection of
domestic production, the enhancement of brand names and removal of trade barriers.
A the Provincial level, local authorities were required to effectively implement the
‘Agricultural Restructuring Plan’, renew projects, programs, and action plans in socio-economic development plans in the 2016-2020 period. The new instruction aims to establish
interdisciplinary steering committees on agricultural restructuring and new rural
area building at the local level. The instruction also promotes effective models of production and encourages enterprises to boost investment and to connect with local communities in favor
of large-scale value production.
4.3.5 Forestry sector
The GoV has been implementing afforestation programs and biodiversity conservation in order
to strengthen the resilience of forest ecosystems to protect the environment and for carbon storage to improve socio-economic development of the community forest areas (e.g. REDD
and REDD +). This is a concrete example of the combination of adaptation and mitigation, taking advantage of the support mechanisms and strong international growth to ensure
sustainable socio-economic development of local communities. These projects are in the
preparatory phase, but the lessons in the implementation should be extended to other areas such
126
as agriculture and land use to leverage the investment of the private sector and international
community.
The Plan on coastal forest protection and development to response the climate change in
the 2015-2020 phase also has been approved. The Plan aims to expand the coastal forest area to 356,753 ha, and achieve coastal forest coverage of 19.5% by 2020. It will enhance the
protective function of the coastal forests in response to climate change, sea-level rise, and
disaster risk management and biodiversity conservation. The plan will implement five solutions on land, investment, science and technology, communications, education, capacity
enhancement and policy completion.
The GoV allocated VND3,000 billion in the 2015 State budget towards 16 transition projects
under the SP-RCC in Vietnam to support mangrove forest projects, riverhead protective forest
projects and other urgent projects in the SP-RCC list. MARD will host and cooperate with other relevant agencies to assess and assume technical responsibilities for these projects and
the investment levels of afforestation projects. The PPCs will launch the projects after completing investment procedures.
4.3.6 Carbon market
Vietnam is making preparing for the carbon market, implementing new projects to:
build database son greenhouse gas emissions;
develop roadmaps on participating in carbon market for solid waste;
pilot the NAMA and develop roadmaps for steel production; and
supervise and investigate operation of NAMA and carbon credits.
Of US$3.6 million of investment, the project gets US$3 million of non-refundable funds. The
government contributes the rest of money (US$600,00) the implementing agencies include:
MONRE (US$1.26 million), MOIT (US$760,000), MOC (US$700,000), MPI (US$140,000) and MOF (US$140,000). The carbon market is an important tool for cutting greenhouse gas
emissions and offering substantial economic benefits to participating countries.
4.3.7 Construction sector
The Ministry of Construction (MOC) was assigned to review the master plan on developing
the country’s urban system to 2020 and plans on developing urban areas, hi-tech parks, economic and processing zones nationwide to 2020 and other projects under its management
in the 2016-2020 period. Construction and urban planning has to incorporate solutions for coping with climate change and rising sea levels and adjust and supplement standards for
planning investments in response to climate change.
4.3.8 Transport and energy sectors The government is encouraging the use of clean energy sources, bio-energy and renewable
energy in the transport and energy sector to reduce energy consumption. These polices are been supported by actions to promote public transport use and reduce domestic energy consumption
to develop a green pathway in the energy and transport sectors.
4.4 Disaster risk management
Vietnam has a well-established disaster risk management (DRM) mechanism and coordination from the central to local levels that is largely related to hydro-meteorological hazards. Given
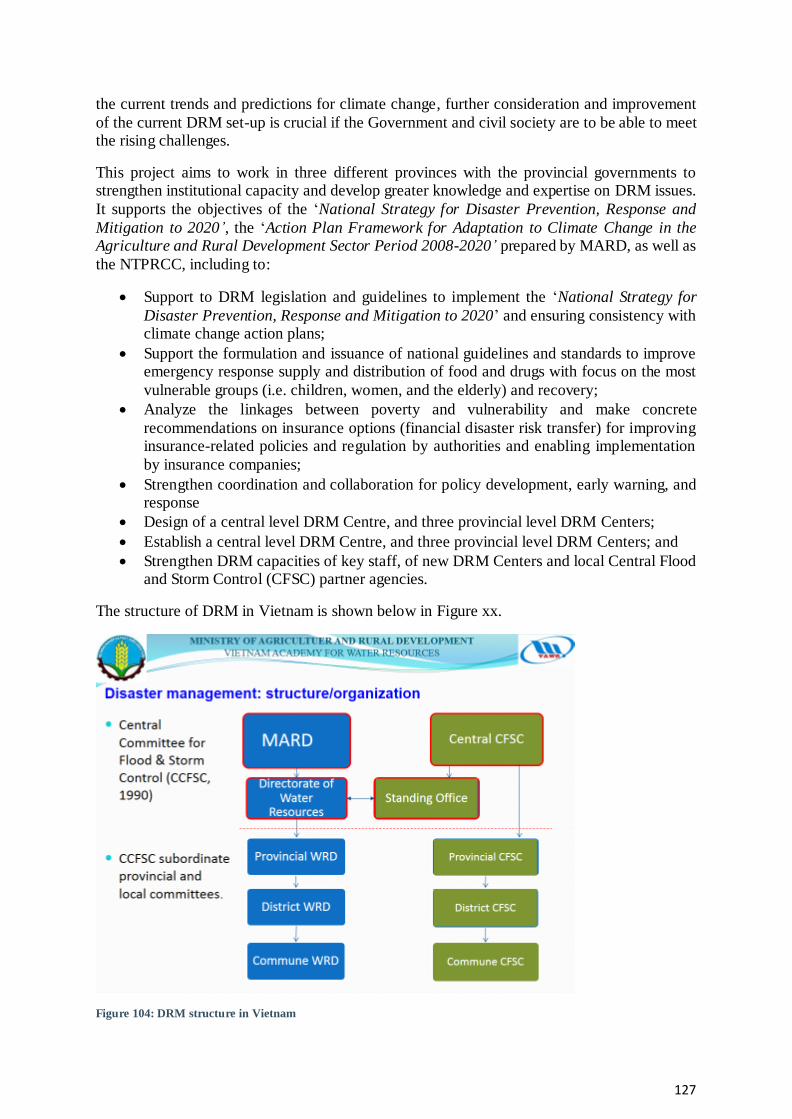
127
the current trends and predictions for climate change, further consideration and improvement
of the current DRM set-up is crucial if the Government and civil society are to be able to meet the rising challenges.
This project aims to work in three different provinces with the provincial governments to strengthen institutional capacity and develop greater knowledge and expertise on DRM issues.
It supports the objectives of the ‘National Strategy for Disaster Prevention, Response and
Mitigation to 2020’, the ‘Action Plan Framework for Adaptation to Climate Change in the Agriculture and Rural Development Sector Period 2008-2020’ prepared by MARD, as well as
the NTPRCC, including to:
Support to DRM legislation and guidelines to implement the ‘National Strategy for
Disaster Prevention, Response and Mitigation to 2020’ and ensuring consistency with climate change action plans;
Support the formulation and issuance of national guidelines and standards to improve emergency response supply and distribution of food and drugs with focus on the most
vulnerable groups (i.e. children, women, and the elderly) and recovery;
Analyze the linkages between poverty and vulnerability and make concrete
recommendations on insurance options (financial disaster risk transfer) for improving insurance-related policies and regulation by authorities and enabling implementation
by insurance companies;
Strengthen coordination and collaboration for policy development, early warning, and response
Design of a central level DRM Centre, and three provincial level DRM Centers;
Establish a central level DRM Centre, and three provincial level DRM Centers; and
Strengthen DRM capacities of key staff, of new DRM Centers and local Central Flood and Storm Control (CFSC) partner agencies.
The structure of DRM in Vietnam is shown below in Figure xx.
Figure 104: DRM structure in Vietnam

128
4.4.1 Integrated Water Resources Management (IWRM) in the LMB
There is broad recognition within the region that the accelerated pace of water resources development in the Mekong Basin needs to be complemented by effective management
arrangements for water and related resources to ensure that development of the water resources is sensitive to the maintenance of vital ecosystems and the productivity of capture fisheries, on
which many of the poor depend for their livelihoods, and that water resources development
becomes a negotiated process, which synthesizes the differing interests both within the different countries and between them.
At this moment, the delta faces two major challenges:
1. growing competition between rice farmers and shrimp farmers, triggered by their
competing demands on water resources (freshwater vs. brackish water); and
2. deteriorating water quality resulting from increased levels of pollutants due to rapid urban development.
In the future, the Delta will face further challenges as upstream developments including hydropower and water diversions could change reduce the level of sediments and nutrients that
fertilize agricultural lands and changing seasonal flow patterns could increase saline intrusion.
In view of the above, the GoV is actively pursuing IWRM planning to tackle present and future water use needs in the LMB. In the Central Highlands, where Vietnam is an upper riparian
country to Laos and Cambodia, water management is based on recognising the importance of the hydrological cycle to minimize and prevent conflicts over water utilization. Improved water
resources management is also a key to reduce rural poverty. Vietnam is strengthening its hydro-
met systems in the LMB to support data sharing with other riparian countries.
4.5 International support
Along with approving and implementing the NTPRCC, the efforts and actions in recent years has confirmed the efforts of the GoV to respond to climate change has been supported by
international donors, a number of programs have been implemented.
4.5.1 Program SP-RCC In 2010, the International Cooperation Agency of Japan (JICA) and the French Development
Agency (AFD) signed a loan agreement for the SP-RCC program with a total budget respectively, 10 billion yen (about 110 million US dollars) and 20 million euros (about 28
million US dollars).
Responding to climate change is one of the strategic objectives of AFD’s action in Vietnam. Between 2006 and 2014, the agency allocated €471 million to Viet Nam to implement 16
Climate projects for both climate change mitigation (public transport, energy) and for adaptation to its consequences: water infrastructure against flooding, for irrigation and the
promotion of conservation and mountain farming. 47% of AFD’s total commitments over this
period were allocated to climate change. In addition to these investment projects, since 2009, AFD has been co-financing the (SP-RCC) It is in the form of budget support to the
Government, co-financed with the other development partners (JICA, World Bank). As much as €100 million have been allocated to the SP-RCC.
In 2011, the Programme Coordinating Board of the SP-RCC implemented procedures for
receiving funding including: AFD 25 million Euro, Development Cooperation Agency of Canada (CIDA) 4.45 million (funded non-refundable), JICA $ 110 million (funded 2nd),
Import-Export Bank (Korean Eximbank) $ 30 million, Australian Department of Foreign

129
Affairs and Trade (DFAT) $8 million each year in Australian Aid. There is also technical aid
for the sector to perform the duties of the SP-RCC program. Other programs and international support include:
‘Programme to adapt and mitigate the impacts of climate change in Vietnam’: The Danish government grant in the amount equivalent to US $ 40 million. Of which 10
million USD for the program to use energy-saving, efficient management by MOIT, $ 30 million for the National Target Programme to Respond to Climate Change, including
the two provinces of Quang Nam and Ben Tre is 20 million USD.
‘Program to adapt to climate change and water management area Mekong Delta’: the Dutch Government has committed funds for coping with climate change in the Mekong Delta.
‘Program Reducing emissions of greenhouse gases through efforts to reduce deforestation and forest degradation’: the Government of Norway has pledged about $
100 million aid for piloting in some areas of Vietnam to improve and enhance forest
carbon stocks (REDD ++)
4.6 Legal and institutional policy on environmental management
The Government has ‘Decree 18/2015/ND-CP regulating planning on environmental protection and evaluating the environment as well as its effects and environmental protection
plans’. Environmental protection plans will be devised at national and provincial levels in line
with the 2021-2030 socio-economic development plan with a vision to 2040. The national plan will focus on managing forest environment, preserving bio-diversity and improving the
environment of seas, islands and river basins. The plan will also cover emission and air quality; targets and solutions for planning on development activities producing large quantity of
emission; the situation of land pollution and degradation; targets and solutions for preventing
land pollution and degradation, recovering polluted and degraded land. In addition, the national plan will also include improving surface water pollution, and solutions to manage sewage and
protect water resources.
4.6.1 Vietnam's Environmental and Social Safeguards Policies and Legislations
The ‘Law on Environmental Protection (No.55/2014/QH13) dated June 23, 2014’ and ‘Decree
on Environmental Protection Planning, Strategic Environmental Assessment, Environmental Impact Assessment and Environmental Protection Plans (No. 18/2015/ND-CP) dated February
14, 2015’ are key legal frameworks for environmental management in Vietnam. The Law on Environmental Protection (LEP) provides statutory provisions on environmental protection
activities, measures and resources used for the purpose of environmental protection, the rights, powers, duties and obligations of regulatory bodies, agencies, organizations, households and
individuals who are tasked with the environmental protection. The LEP is applicable to
regulatory bodies, public agencies, organizations, family households and individuals within the territory of the Socialist Republic of Vietnam, including mainland, islands, territorial waters
and airspace. LEP is on regulating strategic environmental assessment, environmental impact assessment and environmental protection commitment. Other related regulations for
environmental protection and climate resilience include:
Law on Disaster Prevention and Mitigation (2013);
National climate change strategy (2012);
National Action Plan on Climate change (2012);
NTPRCC (2008)
130
National strategy for natural disaster prevention, response and mitigation toward 2020 (2007 – QD/TTg); and
Action Plan Framework for Adaptation & Mitigation of Climate Change in the Agriculture and Rural Development Sector Period 2008-2020
The following regulations also apply to construction, land use planning, DRM, construction of dykes, flood protection, forests and water resources:
Law on Construction (2003);
Law on Land (2013);
Law on Dykes (2006);
Law on Forest Development and Protection (2004);
Law on Labor (1994);
Law on Cultural Heritage (2001); and
Law on Water Resources (2012).
These laws in combination with World Bank safeguards and IFC requirements will need to be
complied with during the implementation of the MD-ICRSL project. There are a number of Vietnam Environmental standards developed by MONRE and Ministry of Public Health (See
Annex 2).
4.6.2 Application of World Bank Safeguard Policies The MD-ICRSL project is proposed as Category A for Environmental Assessment due to its
regional impacts, spatial extent, its focus on adaptive delta management, and civil works. The following World Bank (WB) safeguard policies have been triggered: (a) Environmental
Assessment (OP 4.01); (b) Natural Habitat (OP 4.04); (c) Pest Management (OP 4.09); (d)
Physical Cultural Resources (OP 4.11); (e) Forests (OP 4.36); (f) Safety of Dams (OP 4.37); and (g) Projects on International Waters (OP 7.50).
4.6.2.1 IFC Environmental, Health and Safety Guidelines The Environmental, Health and Safety (EHS) Guidelines of the World Bank Group
(WBG)/International Finance Corporation (IFC), 2008 is the safeguard guidelines for
environment, health and safety for the development of the industrial and other projects. They contain performance levels and measures that are considered to be achievable in new facilities
at reasonable costs using existing technologies. These guidelines can be accessed in the following website: http://www.ifc.org/ifcext/sustainability.nsf/Content/EHSGuidelines.
When host country regulations differ from the levels and measures presented in the EHS
Guidelines, projects are expected to achieve whichever is more stringent. If less stringent levels or measures than those provided in these EHS Guidelines are appropriate, in view of specific
project circumstances, a full and detailed justification for any proposed alternatives is needed as part of the site-specific environmental assessment. This justification should demonstrate that
the choice for any alternate performance levels is protective of human health and the
environment. The section 4 of EHS Guidelines for “Construction and Decommissioning” provides additional, specific guidance on prevention and control of community health and

131
safety impacts that may occur during new project development, at the end of the project life-
cycle, or due to expansion or modification of existing project facilities.
4.6.2.2 World Bank Policy on Access to Information
In addition to the safeguard policies, the Access to Information Policy also relates to safeguards. To promote transparency and facilitate accountability, Bank Access to Information
Policy supports decision making by the Borrower and Bank by allowing the public access to
information on environmental and social aspects of projects in an accessible place and understandable form and language to key stakeholders. The Bank ensures that relevant project-
related environmental and social safeguard documents, including the procedures prepared for projects involving subprojects, are disclosed in a timely manner before project appraisal
formally begins. The policy requires disclosure in both English and Local language and must
meet the World Bank standards.
4.6.3 Capacity in government environmental organizations
MONRE has been coordinating with other Ministries to improve the capacity of government organizations to implement relevant environmental legislation and standards. The Ministries
of Industry and Trade, Public Security, Transportation, MARD, MOH and Science and
Technology have developed units responsible for environmental management.
MONRE has also been monitoring the success of legislation introduced to improve SEA, EIA
and environmental protection (EP) commitment. Since the implementation of ‘Strategic environmental assessment, environmental impact assessment and environmental protection
commitment (Decree No. 29/2011/ND-CP)’ the following outcomes have been achieved:
SEA: 14 pilot projects, 40 SEA reports were reviewed in which 27 were submitted to PM for approval;
EIA: 125 – 150 report/ year (from 2011 to now: 470). 95 were not approved and very
few approved without adjustment;
EP program: 125.
Human resources: 62 divisions for EP, 1 division for environment management, 1126 officers, 323 work in EIA and SEA
Outcomes (57/63 provinces, cities): 5,623 EIA reports, 1,960 EP programs approved. Number of reports reviewed varies between different provinces, average ~ 33 EIA
reports/year /province.
EP program: Data of (57/63 provinces), 1,788 EP programs prepared, 1193 not been prepared; and 27.746 simple EP programs preempted and 83,445 simple EP programs
not been prepared.
4.6.4 Improving environmental management in the Mekong De lta
The Government of Vietnam has approved the Law on Environmental Protection 2014 and the Law on Biodiversity 2015 to support improved environmental management at the national and
regional level. The law on environmental protection provides the legal framework for strategic environment assessment (SEA), environmental impact assessment (EIA) and environmental
management plan (EMP). Relevant sub decrees are being prepared and implemented for
managing environmental impacts in the transport, agricultural, industrial and other sectors.

132
Enhanced coordination between MONRE the provincial Department of Natural Resources and
Environment (DONRE) and MARD, MOT and other ministries is being promoted to address environmental issues in the Mekong Delta. For the MD-ICRSL project the environmental
management will need to consider regional impacts including flooding, salinity intrusion, surface water quality, groundwater extraction and sea level rise. At the provincial level this
will require:
Enhanced access to data and scientific evidence on the current status and future trends of the key Delta dynamics that shape the system;
Promotion and awareness of integrated spatial approaches to development; and
Cooperation between sectors and provinces during delta-wide and provincial planning approaches.
133
5 STRATEGIES FOR BUILDING
RESILIENCE IN THE MEKONG DELTA
This section will discuss the strategies for Components 1-4 of the MD-ICRSL including:
Component 1: Enhancing Monitoring, Analytics, and Information Systems
Component 2: Flood management in the upper delta floodplain;
Component 3: Adapting to salinity intrusion in the delta estuary; and
Component 4: Protecting coastal areas in the delta peninsula.
5.1 Component 1: Enhancing Monitoring, Analytics and Information Systems
Component 1 of the project takes a much more comprehensive and regional approach to
building resiliency in the Delta by investing in enhanced monitoring, analytics, and information
systems to help guide planning and policy making. This strategy aligns closely with the overall
MDP priority and “no-regret” measures to ensure the integrated development of the Delta.
Component 1 provides the framework for updating and sharing information, knowledge, and
data among stakeholders—researchers, policy makers and decision makers, planners –and
between different levels and places are critical for resilient decisions. Component 1 comprised
two subcomponents:
Sub-component 1.1: Investing in Monitoring Systems and Related Products to Enhance
Mekong Delta Knowledge Base:
Subcomponent 1.2: Infrastructure and Integrated Information Systems for Enhanced
Decision-Making
Component 1 supports the following initiatives:
Formulation of a Mekong Delta Climate Sustainability Assessment : This will be comprehensive assessment of Delta sustainability issues, including status, trends, and
recommendations on how to adaptively manage the Delta in context of rapidly changing environmental conditions. It will be a document that informs the government’s next
five year regional, local, and sectoral planning in the Delta.
Upgrading Monitoring Programs: Including remote sensing, land use, water
quantity and quality, groundwater, coastal and river morphology, coastal zone protection, etc. to provide better information
Establishment of the Mekong Delta Center: This will be the Center for data, information, education, knowledge, and advocacy for adapting to climate change and
promoting sustainability.
MARD Real Time Operations System for Hydraulic Infrastructure: This will be
a decision support center to provide real-time information on salinity, floods, and droughts to allow for better operation of infrastructure to meet real-time conditions
and demands.
The summary of costs, activities and further analysis on Component 1 is provided in Chapter 7: Building Adaptive Management Capacity in the Mekong Delta.
This strategy will improve sectoral and inter-provincial coordination in the Mekong

134
Delta. There is a well-defined legal framework for water management (i.e. the Law on Water
Resources) and a network of institutions for water management. There are a number of key actors at the national, provincial and district level and research institutes, civil society, NGOs,
regional organizations and development partners that need to be engaged in operationalizing the Mekong Delta Centre (Table 8).
Table 8: Key actors in the Mekong Delta
National Ministry of Natural Resources and Environment (MONRE)
Ministry of Agriculture and Rural Development (MARD)
Vietnam National Mekong Committee (VNMC)
Ministry of Construction (MOC)
Ministry of Transport (MOT)
Ministry of Planning and Investment (MPI)
Provincial 13 People’s Provincial Committees (PPC)
Department of Natural Resources and Environment (DONRE)
Department of Agriculture and Rural Development (DARD)
Academic and
research institutes Institute of Meteorology, Hydrology and Environment (IMHEN)
Southern Institute of Water Resources Research (SIWRR)
Southern Institute of Water Resources Planning (SIWRP)
Division for Water Resources Planning and Investigation for the South of Vietnam (DWRPIS)
Sub-national Institute of Agricultural Planning and Projection (Sub-NIAPP),
Sub-institute of Hydrometeorology and Environment of South Vietnam
(SIHYMETE)
Southern Regional Hydro-meteorological Center (SRHC), and
Can Tho University (CTU)
Civil society Water users organizations (WUOs)
NGOs WWF, Oxfam Australia
Development
partners
World Bank, ADB, JICA, UNDP, IFAD, IUCN, Australian DFAT, USAID, NL, GIZ
River basin
organizations
(RBOs)
Mekong River Commission (MRC)
The MDP identified that delta planning and coordination mechanisms are needed to
ensure that sectoral master plans consider flood management, irrigation, land use and
cropping in an integrated manner. Understanding the policy context and the overlapping
and competing priorities of sectoral and provincial master plans in the Mekong Delta is critical for implementing future investments. National policies and master planning have been strong
drivers for rice intensification, flood and salinity-control control structures, agricultural diversification (i.e. encouraging transition from rice to aquaculture, horticulture and shrimp
farming), mangrove restoration, sea dykes and water resources management. The existing
Vietnamese strategies and master plans for the Mekong Delta are outlined below in Table 9.

135
Table 9: Vietnamese Strategies and Master Plan for the Mekong Delta
Ministry of Agriculture
and Rural
Development
Ministry of Natural
Resources and
Environment
Ministry of Transport
Ministry of
Construction
Ministry of Planning
and Investment /
Mekong Delta
provinces
Masterplan for
Agriculture Mekong
Delta 2020-2030
Masterplan for Irrigation
Mekong Delta
Restructuring program
Strategy for Agriculture
Strategy for Fisheries
Strategy for Forestry
Climate Change program
NTP for Climate Change
Masterplan for Water
Resources Planning
(Mekong Delta Plan)
Strategy for Water
Resources Planning
Masterplan for
Transportation Mekong
Delta
Masterplan for
Construction Mekong
SEDP Mekong Delta
Provincial masterplans
(13x) incl. landuse
The MDP recognized that improving governance and planning would assist in implementing futures strategies for climate resilience and livelihoods. A coordination
effort should focus in particular on an overall master planning, which takes into account specific provincial characteristics and provides sufficient detail and guidance, infrastructure
development, capacity building (for institutions and people) and monitor and evaluate activities
in the Delta.
Investments proposed within the hydro-ecological zones need to consider both regional
and sub-regional impacts. The MDP recommended that measures for flood control, fresh (surface) water, salinity intrusion and the regulation and management of freshwater and
brackish farming systems need to be considered at the delta level as the impacts and influences
go beyond district and provincial boundaries. Further assessment of regional and sub-regional impacts is detailed in Chapter 6: Assessing Regional Project-Financed Impacts.
The investments also consider the existing and proposed projects being implemented by development partners in the Mekong Delta. Table 10 below provides an example of on-
going and proposed investments in the focal provinces An Giang, Ca Mau, Ben Tre and Soc
Trang.
Table 10: Agriculture and water management investments in An Giang, Ca Mau, Ben Tre & Soc Trang
Province Key investments Development
partners
An Giang AGRICULTURE
On-going investments in alternative agricultural and use
and farming systems in the LXQ– in particular floating
rice, winter cash crops, fruit trees, freshwater
aquaculture and shrimp farming
Proposed investments in enhancing rice-value chain
WATER MANAGEMENT
Proposed investments in community-based flood risk
ADB, GIZ
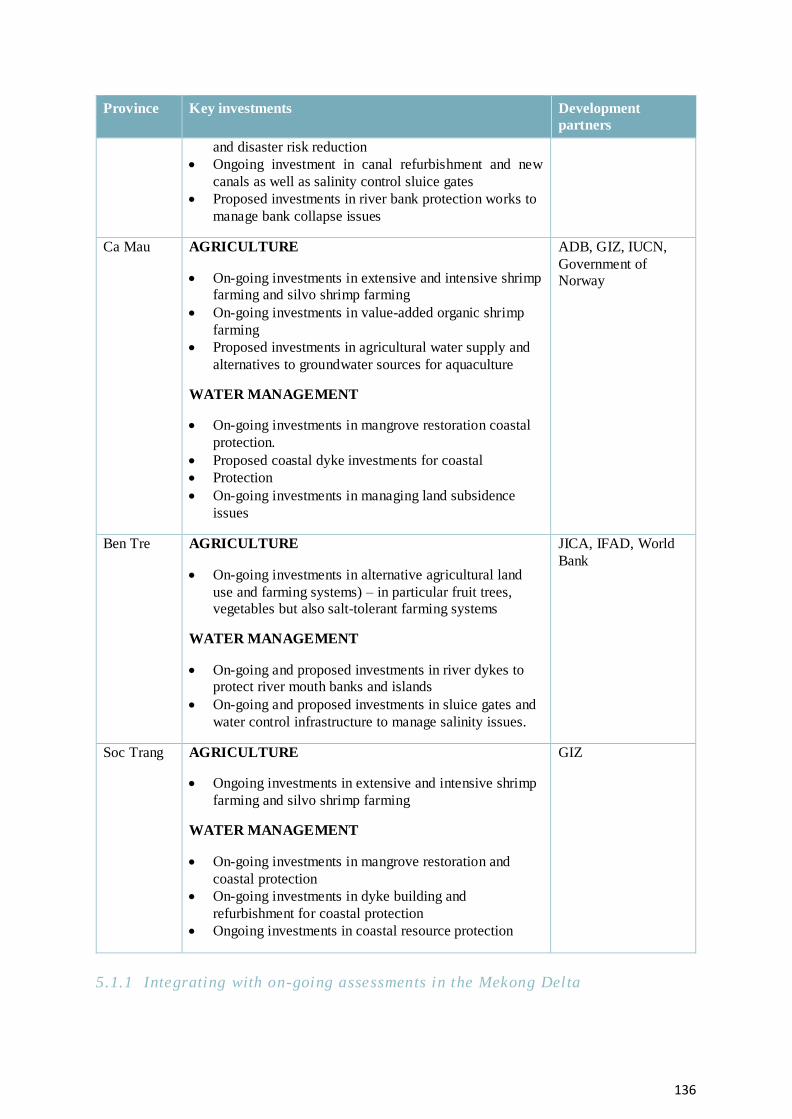
136
Province Key investments Development
partners
and disaster risk reduction
Ongoing investment in canal refurbishment and new
canals as well as salinity control sluice gates
Proposed investments in river bank protection works to
manage bank collapse issues
Ca Mau AGRICULTURE
On-going investments in extensive and intensive shrimp
farming and silvo shrimp farming
On-going investments in value-added organic shrimp
farming
Proposed investments in agricultural water supply and
alternatives to groundwater sources for aquaculture
WATER MANAGEMENT
On-going investments in mangrove restoration coastal
protection.
Proposed coastal dyke investments for coastal
Protection
On-going investments in managing land subsidence
issues
ADB, GIZ, IUCN,
Government of
Norway
Ben Tre AGRICULTURE
On-going investments in alternative agricultural land
use and farming systems) – in particular fruit trees,
vegetables but also salt-tolerant farming systems
WATER MANAGEMENT
On-going and proposed investments in river dykes to
protect river mouth banks and islands
On-going and proposed investments in sluice gates and
water control infrastructure to manage salinity issues.
JICA, IFAD, World
Bank
Soc Trang AGRICULTURE
Ongoing investments in extensive and intensive shrimp
farming and silvo shrimp farming
WATER MANAGEMENT
On-going investments in mangrove restoration and
coastal protection
On-going investments in dyke building and
refurbishment for coastal protection
Ongoing investments in coastal resource protection
GIZ
5.1.1 Integrating with on-going assessments in the Mekong Delta
137
Since 2012, the Government of Viet Nam has self-financed a USD 9 million assessment of the
impact of the proposed Mekong River mainstream hydropower cascade on the natural, social, and economic systems of downstream floodplains of Cambodia and Viet Nam with a particular
focus on impacts in the Mekong Delta. The MDS is being implemented by MONRE Dept. of Water Resources and Viet Nam National Mekong Committee (VNMC) and now has financial
and technical support from DFAT, the US State Department and the World Bank Group.
Through the study the VNMC has developed its own Mekong basin-wide modelling system, which complements the MRC’s modelling tools, as well as a model of the Delta’s coastal zone.
This modelling will be further enhanced under Component 1 of the MD-ICRSL project.
The Delta Study explored how physical changes in flow regime, sediment loading, water
quality, and longitudinal connectivity (barrier effects) associated with upstream hydropower
development will impact on fisheries, biodiversity, agriculture, navigation and livelihoods. The projected economic consequences of these changes were evaluated for commercial activities
in agriculture, fisheries, and navigation as well as for ecosystem services.
Capture fisheries and agriculture are expected to be the hardest hit from upstream hydropower
development. For example, the study predicts total losses of capture fishery and other aquatic
animals of 366,470 (t) in Vietnam and 267,428 (t) in Cambodia mainly due to the barrier effect of dams and, to a lesser extent, from reduction in sediment loading and nutrients. The reduced
sediment and nutrient load is predicted to decrease rice and maize production by 2.3% and 10% respectively in Vietnam, with greatest impacts in An Giang and Dong Thap provinces. In
Cambodia, rice and maize production is also expected to also decrease by 3.7% and 21%
respectively.
5.1.2 Summary of trends, challenges and regional changes for Components 2, 3
and 4
The existing trends and challenges for the hydro-ecological zones were analyzed in Section 2
and 3, a summary of the trends and challenges for the three zones is shown below in Figure
105.

138
Figure 105: Summary of trends and challenges in the hydro-ecological zones
The regional changes in the Mekong Delta and the three hydrological zones were assessed
further in Section 3 based on the following four key basin-wide drivers of change (Figure 106):
1. Rainfall and Temperature Changes: Climate change will increase the variability in seasonal rainfall, making the wet seasons wetter and the dry season drier and polarizing
the seasonal conditions of the Basin with more severe and frequent flood and drought incidence;
2. Hydropower development in the Mekong Basin: Rapid expansion of hydropower in
the Mekong Basin will alter timing of downstream hydrology during regular operations and could lead to large emergency releases during storm events. Hydropower reservoirs
will also sever sediment transport processes, trapping sediments and reducing rates of natural fertilization in the floodplain and offshore environments as well;
3. Land use change: Rapid trends of deforestation, urbanization and agricultural
expansion will continue to alter the hydrological balance between surface run off and infiltration; and
4. Sea level rise (SLR): Rising sea levels will alter the delicate balance between freshwater and estuarine conditions in the delta, pumping salinization issues further into
the delta interior affecting groundwater and permanently inundating large areas of the
Mekong Delta.
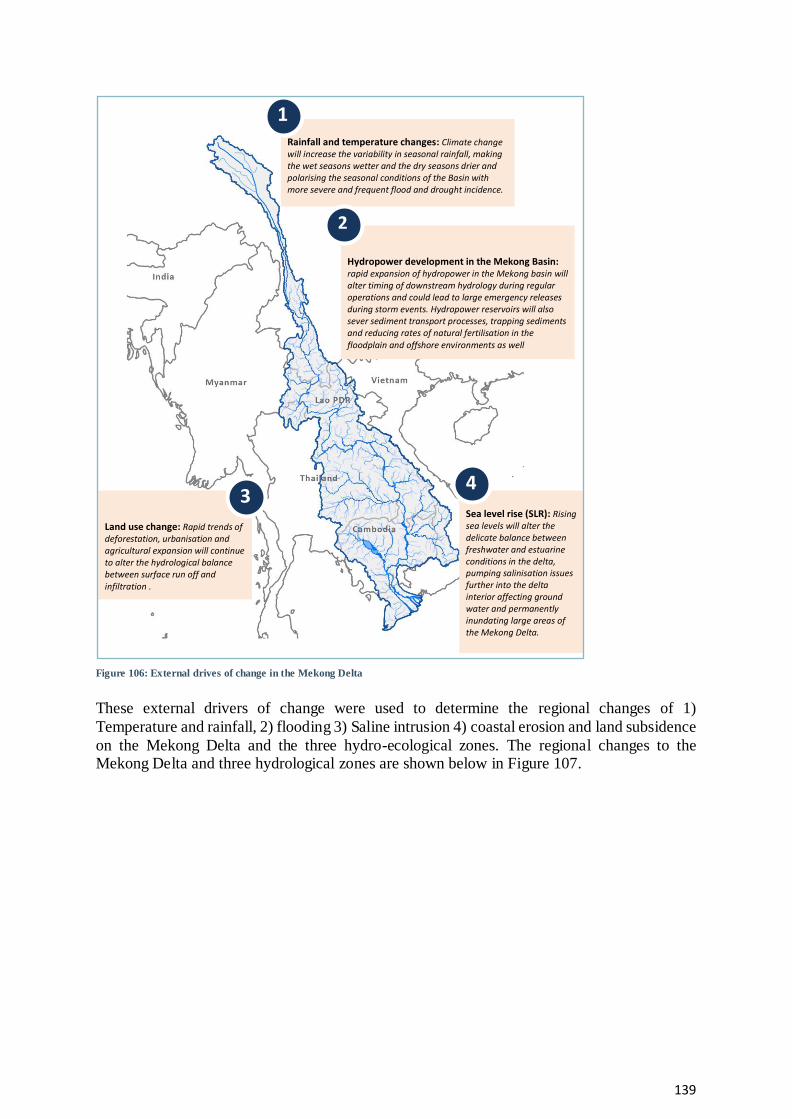
139
Figure 106: External drives of change in the Mekong Delta
These external drivers of change were used to determine the regional changes of 1)
Temperature and rainfall, 2) flooding 3) Saline intrusion 4) coastal erosion and land subsidence
on the Mekong Delta and the three hydro-ecological zones. The regional changes to the Mekong Delta and three hydrological zones are shown below in Figure 107.
Rainfall and temperature changes: Climate change will increase the variability in seasonal rainfall, making the wet seasons wetter and the dry seasons drier and polarising the seasonal conditions of the Basin with more severe and frequent flood and drought incidence.
Hydropower development in the Mekong Basin: rapid expansion of hydropower in the Mekong basin will alter timing of downstream hydrology during regular operations and could lead to large emergency releases during storm events. Hydropower reservoirs will also sever sediment transport processes, trapping sediments and reducing rates of natural fertilisation in the floodplain and offshore environments as well
Land use change: Rapid trends of deforestation, urbanisation and agricultural expansion will continue to alter the hydrological balance between surface run off and infiltration .
Sea level rise (SLR): Rising sea levels will alter the delicate balance between freshwater and estuarine conditions in the delta, pumping salinisation issues further into the delta interior affecting ground water and permanently inundating large areas of the Mekong Delta.
1
2
3 4
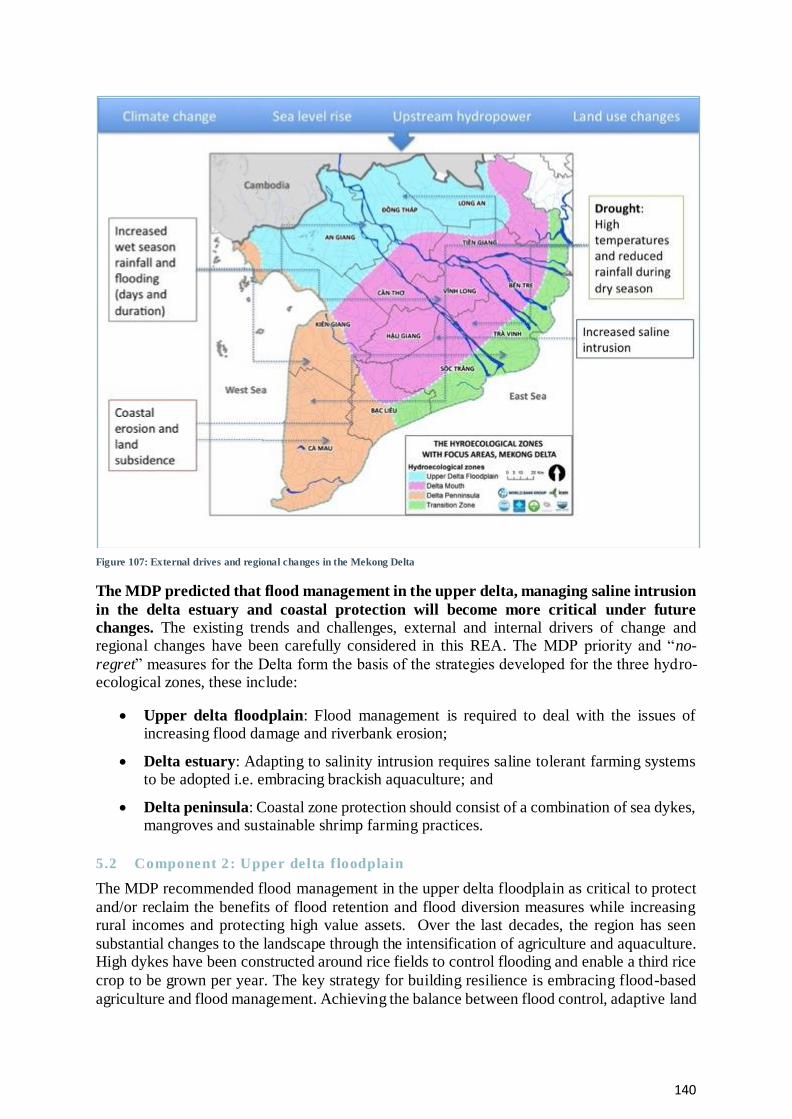
140
Figure 107: External drives and regional changes in the Mekong Delta
The MDP predicted that flood management in the upper delta, managing saline intrusion
in the delta estuary and coastal protection will become more critical under future
changes. The existing trends and challenges, external and internal drivers of change and regional changes have been carefully considered in this REA. The MDP priority and “no-
regret” measures for the Delta form the basis of the strategies developed for the three hydro-ecological zones, these include:
Upper delta floodplain: Flood management is required to deal with the issues of increasing flood damage and riverbank erosion;
Delta estuary: Adapting to salinity intrusion requires saline tolerant farming systems to be adopted i.e. embracing brackish aquaculture; and
Delta peninsula: Coastal zone protection should consist of a combination of sea dykes, mangroves and sustainable shrimp farming practices.
5.2 Component 2: Upper delta f loodplain
The MDP recommended flood management in the upper delta floodplain as critical to protect
and/or reclaim the benefits of flood retention and flood diversion measures while increasing rural incomes and protecting high value assets. Over the last decades, the region has seen
substantial changes to the landscape through the intensification of agriculture and aquaculture. High dykes have been constructed around rice fields to control flooding and enable a third rice
crop to be grown per year. The key strategy for building resilience is embracing flood-based
agriculture and flood management. Achieving the balance between flood control, adaptive land
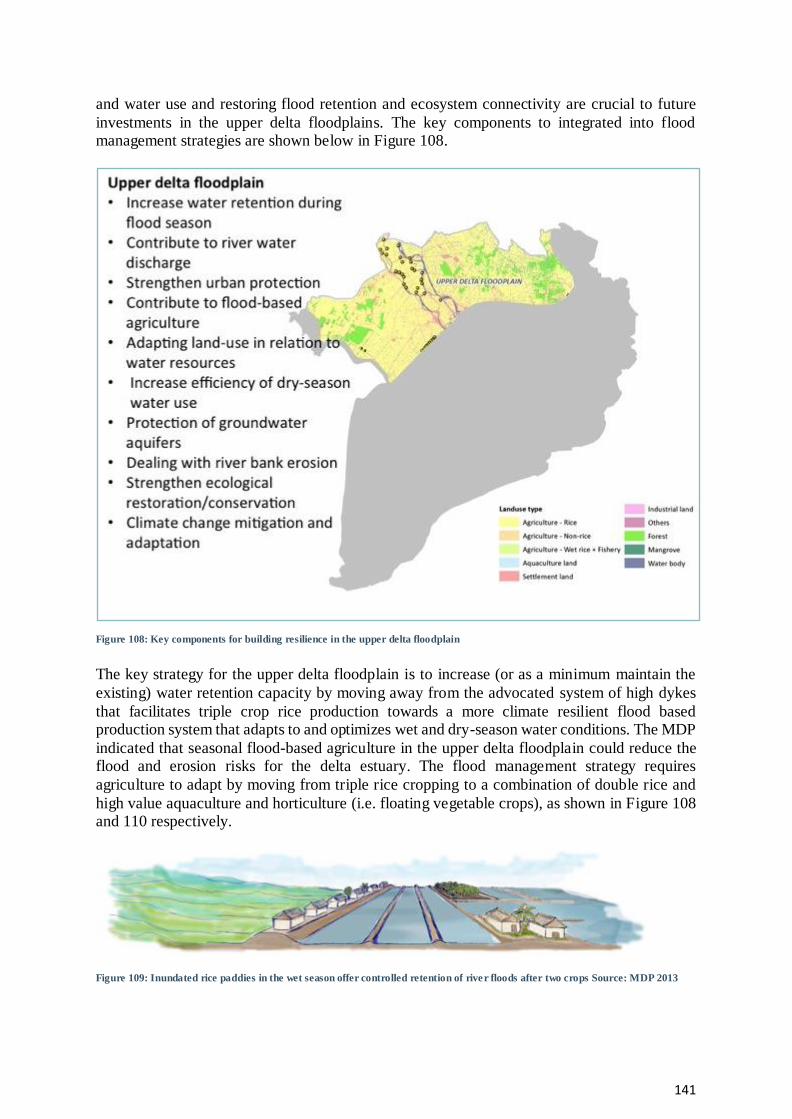
141
and water use and restoring flood retention and ecosystem connectivity are crucial to future
investments in the upper delta floodplains. The key components to integrated into flood management strategies are shown below in Figure 108.
Figure 108: Key components for building resilience in the upper delta floodplain
The key strategy for the upper delta floodplain is to increase (or as a minimum maintain the
existing) water retention capacity by moving away from the advocated system of high dykes
that facilitates triple crop rice production towards a more climate resilient flood based production system that adapts to and optimizes wet and dry-season water conditions. The MDP
indicated that seasonal flood-based agriculture in the upper delta floodplain could reduce the flood and erosion risks for the delta estuary. The flood management strategy requires
agriculture to adapt by moving from triple rice cropping to a combination of double rice and
high value aquaculture and horticulture (i.e. floating vegetable crops), as shown in Figure 108 and 110 respectively.
Figure 109: Inundated rice paddies in the wet season offer controlled retention of river floods after two crops Source: MDP 2013

142
Figure 110: Controlled flooding in the upper delta floodplain, using the inundate paddies for fish farming in wet season of "floating
vegetables” offering an attractive economic proposition Source: MDP 2013
Discussion in the Mekong Delta has centered on the need to consider current rice intensification policies in the upper delta and a more sustainable pathway for land and water resources
development that considers potential cross-provincial impacts. Strategies that adopt (semi-
controlled) flooding of upstream provinces that addresses the issues of water retention within the floodplains adjacent to the Hau and Tien rivers related to increasing risks of flood damage
resulting from existing rice production policies and infrastructure planning and urbanization. The challenges, solutions and key trade-offs are summarized below in Table 11.
Table 11: Challenges, solution and key trade-offs for upper delta floodplain
Challenges Solutions Key trade-offs
Within existing
agriculture policies there
is a strong pressure to
create full flood-controlled areas that
enable the production of a
3rd annual crop during the
August flood season. This
increased the risks of flood damage in urbanized
downstream areas.
Livelihoods improvement.
Reinstate water retention
areas in LXQ and POR
(reduce full flood-
controlled areas
Transition form triple
crop irrigated rice to
double crop or floating
vegetables combined with
up scaling or other cash
crops with fish breeding
Develop vertical product
value chain/farmer
cooperatives.
Upstream yield losses
resulting from a policy
shift towards semi-
controlled flooding and initial costs of transition
to a mixed production
system versus benefits in
downstream areas (Can
Tho, Hau Giang, Vinh Long, Tien Giang
provinces) due to reduce
flood damages and costs
for flood prevention
measures.
Flood management strategies in the upper delta floodplain will protect provinces in the
delta estuary from flooding. The LXQ represents a 500,000ha component of the Mekong
Delta natural floodplain connecting the Hau River channel with the coastal zone of the West Sea. Historically, during the flood season the Mekong’s distributaries would overtop its banks
sending floodwaters into the LXQ. These floodwaters would remain in the quadrangle keeping the area inundated for up to 6-8 months a year and supporting a vast wetland ecosystem, as
well as reducing the magnitude of downstream flood flows. Rapid development of the delta
and intensification of multiple crop rice farming over the past 20 years has reduced the flood relief capacity of upstream areas while urbanization of Long Xuyen, Can Tho and the
connecting riverbanks has simultaneously increased downstream flood risk.
5.3 Component 3: Delta es tuary
Adapting to salinity intrusion is required to address the challenges related to salinity
intrusion, flooding through transitions to sustainable aquaculture and improved
livelihoods for communities living in the coastal areas. The key strategies for the delta estuary and other coastal areas, as outlined in the MDP, are to strengthen coastal protection
through a mix of 'building with nature' type (where possible) and infrastructural measures

143
(where needed) and to facilitate a gradual transition from existing fresh water based rice
production towards a brackish and diversified aquaculture system that adapts to increasingly saline conditions. An additional priority is the protection of groundwater aquifers, due to
increasing evidence that excessive groundwater extraction accelerates land subsidence (Figure 111).
Figure 111: Key components for building resilience in the delta estuary
The strategy for the delta estuary, based on the priority and “non-regret” measures from the
MDP, focus on flood protection and freshwater supply for the horticultural/agricultural areas
of Ben Tre and Tra Vinh, more sustainable use of groundwater livelihoods improvements. The challenges, solutions and key trade-offs are summarized in Table 12.
Table 12: Challenges, solutions and key-trade-offs for the delta estuary
Challenges Solutions (ideas) Key trade-offs
Increasing salt intrusion (km)
in dry years affecting
agricultural productivity
Coastal protection (flooding
and coastal erosion)
Fresh water supply (including
water quality) for domestic and commercial use
Depletion of groundwater
aquifers
Livelihoods improvement
Sluice gate systems
(completion)
Crop variety (saline tolerant)
Mangrove restoration
Embankments
Upstream intake of fresh water
(combined with wastewater treatment plant)
Local water storage
Water saving technologies
Aquifers as reserves
Maintaining the existing
agricultural strategies with
focus on fresh water based
production systems (rice)
versus transition towards
brackish and saline systems
with diversified production (rice, coconut, fish, shrimp)
Provincial (local) freshwater
supply versus upstream water

144
Strengthening of integrated
sectoral planning
supply and inter-provincial
cooperation
The key issues to consider are the trade-offs between saline and fresh water management strategies and their economic use across the coastal provinces. The coastal provinces of the
Vietnamese Mekong Delta face critical challenges in the sustainability of their agricultural
systems due to increasing fresh water supply shortages, increasing salinity intrusion and deteriorating water quality.
The provinces of the delta estuary suffer from several climate and human-induced
negative trends like increased salinity intrusion, decreasing availability of high quality
fresh water, and depletion of aquifers. Sea-level rise and dry-season salinity intrusion limit
the possibilities for fresh water agriculture and horticulture. Water quality problems put strain on (saline) aquaculture. There is a conflict in water use and availability between brackish areas
and fresh areas, calling for an assessment of the effectiveness and practicality of horticulture, fresh agriculture and brackish aquaculture, both now and in view of long-term trends.
Transition from rice towards brackish aquaculture (fish and shrimp) and salt tolerant systems
(coconut, cocoa and fruit trees) is required to build the resilience of local communities.
5.4 Component 4: Delta peninsula
Developing coastal protection measures and sustainable livelihoods and reducing groundwater abstraction is critical for the delta peninsula. The key components of the
strategy for the delta peninsula developed in the MDP is to address the increasing vulnerability
of the brackish economy resulting from sea level rise (flood risk and salinization), coastal erosion, fresh water supply for agriculture and shrimp farming systems and livelihoods
improvement (Figure 112).

145
Figure 112: Key components for building resilience in the delta peninsula
The MDP priority and “no-regret” measures for the delta peninsula aim to strengthen coastal
protection through a mix of 'building with nature' type (where possible) and infrastructural measures (where needed) and facilitate a gradual transition from existing fresh water based rice
production towards a brackish and diversified aquaculture system that adapts to increasingly
saline conditions. An additional priority is the protection of the fresh water aquifers, due to increasing evidence that excessive groundwater extraction accelerates land subsidence. The
challenges, solutions and key-trade offs are summarized below in Table 13.
Table 13: Challenges, solutions and key trade-offs for the delta peninsula
Challenges Solutions Key trade-offs
Increasing salt intrusion
(km) in dry years
Coastal erosion leading to
a loss of agricultural
production areas
Mangrove losses (human
induced)
Fresh water supply
(including water quality)
for domestic and
commercial use
Depletion of groundwater
aquifers
Livelihood improvement
Combination of hard and
soft protection measures:
Concrete sea-dyke system
Mangrove rehabilitation
Foreshore stabilization
Adoption of a poly-
aquaculture system (shrimp
and fish farming
Local (rain) water storage
Develop vertical product
value chain/farmer
cooperatives
Maintaining the existing
agricultural strategies with
partial focus on fresh water
based rice production
versus dedicated
development of brackish
and saline systems with
diversified production
(fish, shrimp, mangrove
forest products)
Provincial (local) fresh
water supply versus
upstream water supply and
inter-provincial
cooperation
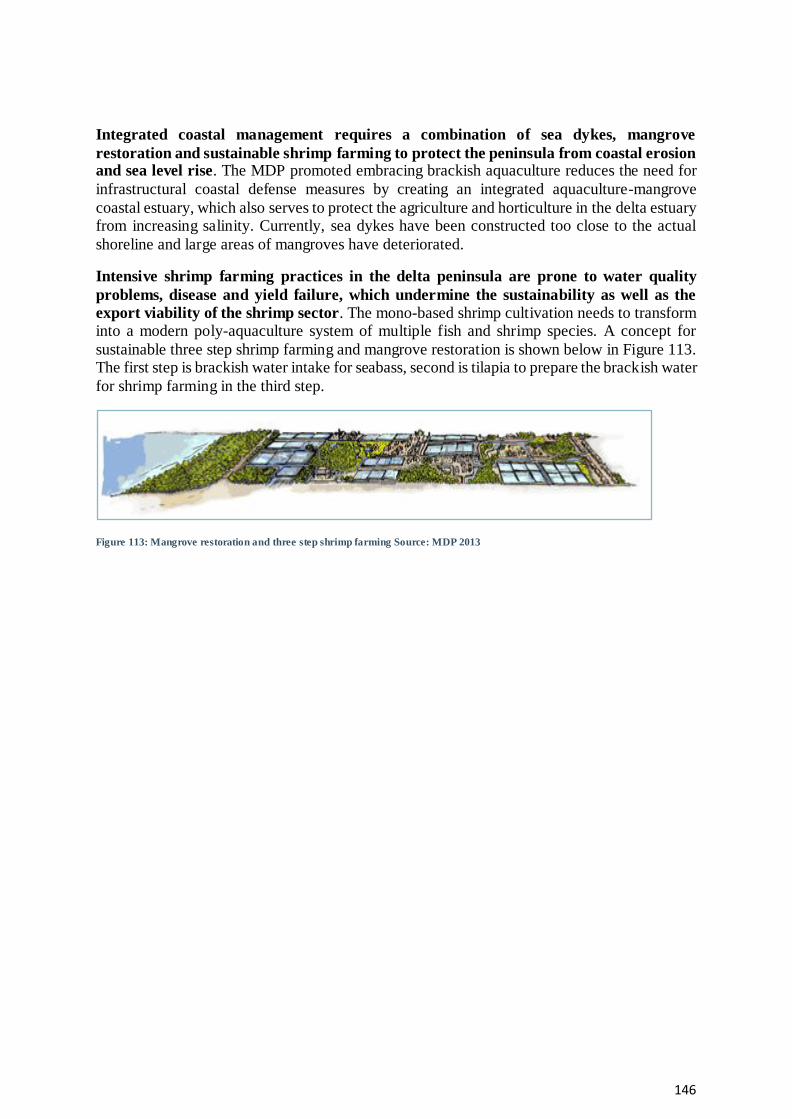
146
Integrated coastal management requires a combination of sea dykes, mangrove
restoration and sustainable shrimp farming to protect the peninsula from coastal erosion and sea level rise. The MDP promoted embracing brackish aquaculture reduces the need for
infrastructural coastal defense measures by creating an integrated aquaculture-mangrove
coastal estuary, which also serves to protect the agriculture and horticulture in the delta estuary from increasing salinity. Currently, sea dykes have been constructed too close to the actual
shoreline and large areas of mangroves have deteriorated.
Intensive shrimp farming practices in the delta peninsula are prone to water quality
problems, disease and yield failure, which undermine the sustainability as well as the
export viability of the shrimp sector. The mono-based shrimp cultivation needs to transform into a modern poly-aquaculture system of multiple fish and shrimp species. A concept for
sustainable three step shrimp farming and mangrove restoration is shown below in Figure 113. The first step is brackish water intake for seabass, second is tilapia to prepare the brackish water
for shrimp farming in the third step.
Figure 113: Mangrove restoration and three step shrimp farming Source: MDP 2013

147
6 ASSESSING PROJECT-FINANCED
REGIONAL IMP ACTS
6.1 Environmental assessment
The MD-ICRSL project is proposed as Category A for Environmental Assessment due to
its regional impacts, spatial extent, its focus on adaptive delta management, and civil works largely carried out under Components 2, 3 and 4. The following World Bank (WB)
safeguard policies have been triggered: (a) Environmental Assessment (OP 4.01); (b) Natural Habitat (OP 4.04); (c) Pest Management (OP 4.09); (d) Physical Cultural Resources (OP 4.11);
(e) Forests (OP 4.36); (f) Safety of Dams (OP 4.37); and (g) Projects on International Waters
(OP 7.50). The four first phase subprojects have been screened and categorized as category B projects.
The subprojects involves medium/large infrastructure schemes, while overall environmental impacts are expected to positive, potential adverse regional impacts may arise from:
construction related impacts;
increased pollution load in soil and water from the potential expansion of shrimp
farming,
possible increase in the use of pesticides and fertilizer from more diversified cropping
options; and
changes in the ecological flow of the Mekong River as a result of the installation of
potential water/ flood/salinity control infrastructure and similar measures.
This section will assess the potential regional impacts (positive and negative) of the activities proposed under the subprojects in the upper delta, delta estuary and peninsula.
6.1.1 Sub projects under Component 2, 3 and 4
The full list of the 11 proposed subprojects for components 2, 3 and 4 is provided in Annex 1, a summary of the first year subprojects are provided in the following sections.
6.1.1.1 Component 2 (Upper Delta) Sub-projects selected for Component 2 include those aimed at increasing water retention,
irrigation and upgrading of reservoirs, livelihoods improvement (support for transition from
triple rice to alternative cropping), and ecosystem restoration. The sub-projects in the upper delta sub-region amount to $99 million. The first year sub-project is the following:
Improving Flood Retention Capacity in An Phu District, An Giang province: This sub-project aims to improve the ability of communities to take advantage of the natural
condition (flood season), and improve incomes through an appropriate alternative. This includes a combination of reinforced low embankments; sluice gates to provide suitable
water environment for a double rice crop plus an third season option (floating vegetables or fish).
Under Component 2, sub-projects selected for subsequent years will be implemented in Long
Xuyen Quadrangle (An Giang/Kien Giang) and Dong Thap that follow the same approach of the sub-project in An Phu, An Giang.
6.1.1.2 Subprojects in Component 3 (Delta Estuary)

148
Sub-projects in Ben Tre, Tra Vinh, Vinh Long and Soc Trang provinces cover financing for
river and coastal embankments, sluice gates, dredging and mangrove restoration, with accompanying adjustments to land-use plans. These proposed sub-projects in the delta estuary
sub-region amount to $149 million. The first year sub-projects are the following:
Enabling Sustainable Coastal Livelihoods In The Face Of Salinity Intrusion in Ba Tri, Ben
Tre Province: This sub-project aims to improve the ability to adapt to salinity intrusion, protect and enhance the livelihoods of people living in the 14,153 ha area of Ben Tre –
using a combination of structural (sluice gates, culverts) and non-structural measures (land-
use changes, mangrove-shrimp pilot models etc.).
Under Component 3, sub-projects selected for subsequent years will be implemented in Thanh
Phu, Ben Tre, Tra Vunh, and Cu Lao Dung, Soc Trang.
6.1.1.3 Subprojects in Component 4 (Delta Peninsula)
Sub-projects in the Ca Mau, Kien Giang and Bac Lieu provinces include eco-forest and mangrove-shrimp innovations, expansions of rice-aquaculture, mangrove restoration, and
infrastructure relating to aquaculture, with accompany adjustments to land-use plans. These
proposed sub-projects amount to about $95 million. The first year sub-project is the following:
Sustainable Infrastructure for Coastal Protection and Protecting Livelihoods Against
Climate Change Impacts In An Minh-An Bien District, Kien Giang province. The primary objective of this sub-project is to improve the ability to adapt to coastal erosion, protect and
enhance the livelihoods of people living in the area of An Minh and An Bien in Kien Giang. This will include sluice gates to be operated to maintain a suitable saline environment for
rice-shrimp cropping; dredging of select canals to increase rainwater storage; mangrove
rehabilitation to serve as a coastal buffer etc. See Attachment on Subprojects for details
Under Component 4, sub-projects selected for subsequent years will be implemented in Ca
Mau and Bac Lieu.
6.2 Assessing the regional impacts
Section 3 and Section 4 of this REA identified the existing trends and challenges and the
projected impacts of hydropower development, land use changes climate change and sea level rise on the upper delta (Component 2), delta estuary (Component 3) and delta peninsula
(Component 4). The following strategies will be adopted under the MD-ICRSL project:
Component 2: Managing Floods in the Upper Delta;
Component 3: Adapting to Salinity Transitions in the Delta Estuary; and
Component 4: Protecting Coastal Areas in the Delta Peninsula.
This section of the REA will assess the regional impacts of the proposed subprojects in
Components 2, 3 and 4 to:
a) Determine the regional impacts (positive and negative) of subprojects under components 2, 3 and 4 of the MD-ICRSL; and
b) Provide general guidance for subproject ESIAs to appropriately mitigate regional impacts.

149
6.3 Regional impact evaluation methodology
Positive and negative impact evaluations will be summarized for components 2, 3 and 4 based on 1) intensity 2) spatial extent, and 3) duration. Using this three-pronged format as a basis,
the impact will be rated as having major, moderate, or minor significance.
Impact intensity is evaluated as high (H), medium (M), or weak (W):
High intensity. Negative impact—a component of the environment is destroyed or so altered as to eliminate the ecological functions it performs or to cause a major shift in
abundance or distribution in the Mekong Delta. Positive impact—there is a definite
improvement in condition, function, abundance, or general distribution in the Mekong Delta.
Medium intensity. Negative impact—a component is altered so it results in a reduction of ecological function or a limited shift of abundance or distribution in the Mekong
Delta, but the integrity of the component is not altogether damaged. Positive impact—there is a moderate improvement in condition, function, abundance or distribution.
Weak intensity. Negative impact—there is very little impact on the component in terms of ecological functions, or abundance or distribution is only slightly modified. Positive
impact—there is a small improvement in condition, function, abundance, or distribution
Spatial extent is evaluated as regional (R), sub-regional (Sr), or local (Lo):
Regional extent is defined as affecting the entire Mekong Delta or a significant part of it. If the impact extends beyond the Mekong Delta—is global or national, for instance—
that will be separately noted.
Sub-regional extent signifies that the impact is felt in one zone (upper delta, estuary or
peninsula) is broader than that immediately affected by the activity in question.
Local extent implies that the impact does not extend beyond the area directly affected
by the activity.
Duration is evaluated as long-term (Lt), medium term (Mt), or short term (St):
Long-term indicates that the impact is essentially permanent or is felt continuously or sporadically over period of more than 10 years. When an impact is irreversible, that
will be separately noted.
Medium-term applies to an impact that is continuous or sporadic over a period of from
1 to 10 years, hence not in any sense permanent or irreversible.
Short-term means an impact that is felt over a period of less than 1 year.
The evaluation criteria are provided below in Table 14.
Table 14: Regional impact evaluation criteria
Regional impact evaluation rules
Criteria of analysis Significance of impact
Intensity Extent Duration Negative Positive

150
High Regional Long-term
Major Major
Medium-term
Short-term
Sub-regional Long-term
Medium-term
Short-term Moderate Moderate
Local Long-term Major Major
Medium-term Moderate Moderate
Short-term
Medium Regional Long-term Major Major
Medium-term
Moderate Moderate
Short-term
Sub-regional Long-term
Medium-term
Short-term
Local Long-term
Medium-term
Short-term Minor Minor
Weak Regional Long-term Moderate Moderate
Medium-term
Short-term Minor Minor
Sub-regional Long-term Moderate Moderate
Medium-term
Minor Minor
Short-term
Local Long-term
Medium-term
Short-term
6.3.1 Regional impacts of Components 2, 3 and 4
The regional impacts related to the following activities will be considered:
Upgrading and constructing new infrastructure;
Dredging;
Installing water/flood control structures in the upper delta;
New livelihood models in the upper delta;
Installing water/salinity control structures in the estuary and peninsula;
New livelihood models in the estuary and peninsula;
Expanding aquaculture and shrimp farming;
Protecting mangrove forests in coastal area; and
Below ground reservoir in the delta peninsula.
The following text describes the regional impacts (positive and negative) of the subprojects
under components 2, 3 and 4, a summary is provided in Table 15.
6.3.1.1 Impacts of upgrading and constructing new infrastructure
The civil works carried out in the process of implementing the subprojects under the project would generally increase the level of air, noise, vibration, and water pollution and traffic
151
congestion they would also raise the potential for accidents and risks to public safety as well
as disturbances to local residents. However, these impacts would be localized and temporary and could be mitigated by (a) ensuring that contractors apply good construction practices and
initiate/maintain close consultation with local authorities and communities throughout the construction period and (b) close supervision of field engineers and/or environmental officer.
Environmental Code of Practices (ECOP) will be prepared with the following: (a) general
provisions, (b) managing construction, (c) dredging, and (d) construction of small civil works. ECOP is part of the subproject EMPs, and appropriate parts of the ECOP will be included in
the bidding and contract documents and be closely monitored by supervision engineers.
Changes in the ecological flow of the Mekong River as a result of the installation of potential
water/ flood/salinity control infrastructure and similar measures for the investments in the
upper delta, delta estuary and peninsula will be assessed in the following sections.
6.3.1.2 Impacts of dredging
The main possible impacts on the local environment during maintenance dredging and/or construction of secondary and/or tertiary sluices would be: (a) contamination of the lands and
water resulting from the disposal of dredged materials; (b) contamination of the roads and lands
resulting from the transportation of the dredged materials; and (c) an increase in suspended solids in water due to disturbances of bottom sediment. A sampling survey suggested that
dredged materials are mainly silt and clay with high organic content with the content of the heavy metals and residual pesticides being below the national thresholds. Therefore, the risk
of contamination to the disposal land and ground water is small.
In the Mekong Delta, it is customary that dredged materials be stored on the land next to the canal for drying for one or two years and then used as a basis for roads or dykes. However, it
should be noted that the dredging would take place over extensive areas and over the whole project implementation period. Important information such as estimated quantity and likely
quality of the sediments, availability of lands for disposal is at the detailed design stage. In this
context, it is appropriate to develop a detailed plan for the disposal of the dredged materials at the detailed design stage.
6.3.1.3 Impacts of installing water/flood control structures in the upper delta Flooding in the delta is a natural process that maintains productivity and drives the dynamic
evolution of the Mekong Delta. The annual flood event is responsible for replenishing the
fertile sediments that is vital to agricultural productivity. Climate change is expected to bring higher and more pronounced season flood regimes, the key challenges are to retain the natural
flood based agriculture and protect downstream provinces from flooding.
The subprojects in the upper delta involve the upgrading of existing low embankments/dykes
and the construction of culverts and sluices to expand flood retention capacity in the wet season.
The culverts and sluices will allow annual floodwaters to pass through embankments and dykes, expanding the floodplain agriculture of the POR and LXQ in Dong Thap, An Giang and
Kien Giang provinces. This infrastructure will support the conversion of triple rice to double cropping plus floating vegetables or aquaculture (i.e. freshwater fish or shrimp farming). The
new embankments will reduce impacts to cropping associated with failure of existing
embankments during the flood season. Upgrading low embankments (August dykes) from earthen to concrete material will also reduce yearly maintenance costs and facilitate waterway
transportation. The project will protect high value agriculture (i.e. fruit trees) and downstream provinces from flood damage.
152
The construction of the sluices under the subproject would provide water for farming during
the wet season. Currently, the high dykes constructed for flood control and rice intensification prevent water from entering the floodplains to allow for planting of the third crop. The
operation of the sluice gates will control the water levels in the project areas and promote floating vegetables, aquaculture and freshwater shrimp farming. Conflicts over water use could
occur between farmers of different crops, and areas where increased flood retention does not
provide benefits. Some of the positive impacts will be that the increased flood retention will replenish the floodplains with sediments and nutrients from the Mekong River and may reduce
the amount of fertilizers and pesticides used in agricultural activities. Climate smart farming and sustainable agricultural practices should be included to support the transition to new
agriculture and aquaculture.
The subprojects may change the hydrological flow from the upper delta affecting natural resources and habitats of aquatic species (OP 4.04). However, improving flood retention is
likely to increased biodiversity in the floodplain ecosystems. The existing August dykes fragmented the floodplains and reduced ecosystem connectivity leading to a decline in capture
fisheries and aquatic species in the upper delta floodplains.
6.3.1.4 Impacts of new livelihood models in the upper delta The development of livelihood models in the upper delta will support farmers to transition from
triple rice cropping. Providing support measures to farmers so they have alternatives to the wet season rice crop is an important measure to transition from triple rice cropping to double rice
plus floating vegetables, flowers, aquaculture and freshwater shrimp farming. Triple cropping
in the upper delta ahs lower total yield and higher rice production costs. Rice intensification has also driven farmers to apply more pesticides and fertilizers, reducing the cost benefits of
the winter-autumn crop and increasing surface water pollution. Farmers have also reported that their rice fields are less fertile from reduced alluvial deposition from the high dykes and flood
control structures.
Appropriate livelihood support during flooding season in retention areas including diversifying
agriculture and aquaculture models with strengthening of the value chains and linking farmers to business and markets. The transition to high value agriculture will provide many positive
social benefits to local communities and households involved in the livelihood models. To
ensure sustainability the project must also consult with communities in the surrounding areas to enable all farmers to transition to alternative farming mechanisms.
Restoring flood retention will provide more nutrients and sediments during the flood season, however the impacts of the possible increase in the use of pesticides and fertilisers from more
diversified cropping needs to be considered. The livelihood models for high-value agriculture
(i.e. fruit trees, flowers, vegetables, mushrooms, watermelons) may require higher inputs of fertilisers and pesticides. The potential environmental impacts of aquaculture (i.e. catfish) and
freshwater shrimp farming including the release of organic wastes, agro-chemicals, antibiotics, the transmission of diseases and the ecological impact on endemic fish species in the Mekong
Delta and floodplains will also need to be considered. In order to mitigate these environmental
impacts, an integrated pest management plan (IPM) program will be implemented for each applicable subproject as a part of the EMP.

153
6.3.1.5 Impacts of installing water/salinity control structures in the estuary and
peninsula The subprojects in Component 3 and 4 involve the construction/ rehabilitation of coastal dykes
in erosion areas and the modification of water control infrastructure along the coastal zone to adapt to changing salinity levels. Ca Mau, Bac Lieu and Soc Trang high historic rates of coastal
erosion, which are projected to continue increasing, indicate that the business-as-usual
approach to coastal protection is not working and a new approach is needed to protect coastlines, ecosystems and valuable agriculture and aquaculture areas.
The traditional approach to protecting the coastline in Vietnam consists of constructing sea dykes, many of them armed with rocks and/or concrete. Previously, water control infrastructure
was constructed in coastal provinces to control salinity intrusion into the estuaries. Saline water
is prevented to enter the canals by the construction of sluices that can be closed when the seawater rises with the tide above river water levels. Where sluices exist, this creates conflicts
between the freshwater needs of agriculture and the brackish water needs for aquaculture. To mange conflicting water uses zones will need to be established for saline, brackish and
freshwater farming areas. The operation of sluices and farming zones would need to be flexible
to consider salinity intrusion in wet, average, dry years and future sea level rise.
Recently, the function of salinity-control structures has been modified from a control oriented
to adaption-oriented approach. For instance, shrimp culture relying on saline water in the dry season is followed by rice culture depending on rainwater in the wet season through proper
adjustments in the design and operation of existing water structures and additional investments
in small-scale infrastructure. The MD-ICRSL project builds on this approach and the infrastructure will support the transition to more sustainable brackish water activities such as
mangrove-shrimp, rice shrimp and other aquaculture activities, adapting to further challenges of salinity intrusion.
The proposed project would only include construction of secondary and tertiary sluices, and
the environmental impacts would be mainly local, and mitigation measures can be implemented at the subproject level. The operation of sluices also needs to consider the impacts to local
waterway transportation for fishers and farmers. The operating rules of sluice gates should be developed in consultation with all stakeholders, including local waterway users. Changes in
the ecological flow of the Mekong River may result due to the installation of flood/salinity
control measures; leading to a reduction in the diversity and quantity of fish populations (OP 4.04). Overfishing and loss of habitat and spawning sites due to changes in the river threaten
fish species in the Mekong Delta.
6.3.1.6 Impacts of new livelihood models in the estuary and peninsula
The livelihood models in the delta estuary and peninsula will support to farmers to transition
(where suitable) to more sustainable brackish water activities such as mangrove-shrimp, rice-shrimp, and other aquaculture activities and to implement climate smart agriculture by
facilitating water use efficiency in the dry season. Livelihood programs are very important in the delta estuary and coastal provinces as households in the transition between fresh and
brackish water had lower income than those in other zones. Livelihoods of people in this zone
are more vulnerable to freshwater availability from the upstream, to salinity intrusion from estuaries and/or adjacent shrimp farming areas and to extreme dry season freshwater shortages.
Providing livelihoods support measures to farmers to adapt to salinity intrusion and transition to brackish aquaculture is an important initiative. Salinity issues in the estuary areas have
caused production losses to rice and high value agriculture. The transition to high value

154
agriculture will provide many social benefits to local communities and households involved in
the livelihood models. Construction of salinity control infrastructure in the past has been inflexible and locked farmers into development pathways. A high number of Khmer people are
living in Soc Trang and Tra Vinh, the Khmer are some of the poorest households in the Mekong Delta. It is important that support and livelihood programs are provided to Khmer and other
ethnic groups. The transition to aquaculture in the estuary areas will be complex as currently
high value crops provide more farm-based income than aquaculture and supports employment opportunities for local people.
The mangrove-shrimp and rice-shrimp are more sustainable options for aquaculture. The development of livelihood models will need to consider the potential environmental impacts of
aquaculture and shrimp farming including the release of organic wastes, agro-chemicals,
antibiotics, the transmission of diseases and the ecological impact on freshwater and coastal fisheries in the Mekong Delta. In order to mitigate these environmental impacts, an integrated
pest management plan (IPM) program will be implemented for each applicable subproject as a part of the EMP. In order to mitigate these environmental impacts, an integrated pest
management plan (IPM) program will be implemented for each applicable subproject as a part
of the EMP. The PMF stipulates: prohibition of the use of very toxic chemicals, and provides directions and approach for Integrated Pest Management (IPM).
6.3.1.7 Expanding aquaculture and shrimp farming The large areas of land required for intensive and semi-intensive shrimp farming have led to
significant natural habitat loss through conversion of mangroves and wetlands into shrimp
ponds. The investment in large water control infrastructure has lead to conflicting interests and inflexible water management when local rice farmers sought to benefit their income through
the conversion of their farms from rice to shrimp.
The project will promote integrated rice-shrimp and mangrove-shrimp farming that are
considered to be more environmentally sustainable aquaculture because it is extensive and uses
less agro-chemicals (i.e. fertilizers, antibiotics) and can lead to restoration of mangrove areas. Environmental concerns such as effluents from the shrimp farms, disposal of the sediments in
the shrimp ponds into canals and rivers need to be managed. Applying sustainable rice-shrimp model using VietGap standard to develop operational guidelines for water management
systems in the project area will lead to more sustainable shrimp farming in the estuary and
peninsula.
Nevertheless, there are some environmental concerns relating to the current rice-shrimp
farming systems. First, the current shrimp farming method is based on high water exchange, which would result in high accumulation of sediment in the rice farms in the long-term. Many
farmers reportedly dispose of accumulated sediment back into the canals or nearby river, which
would induce negative environmental impacts. Furthermore, recent introduction of exotic species and introduction of more intensive shrimp aquaculture may also lead to more pollution
in the effluent of the wastewater from the shrimp farming.
The project will contribute to the improving current water management practices for shrimp
aquaculture, covering the following aspects: (a) developing a categorized inventory of the
current farms; (b) analyzing the current use of fertilizers and antibiotics; (c) identifying areas with acute environmental issues; and (d) establishing and disseminating best practices.
Wastewater treatment systems are required for aquaculture and shrimp farming to reduce surface water pollution. Increasingly, groundwater is being used an additional source of fresh
water to control salinity levels in shrimp farming and enable the diversification of production

155
into vegetables (both in rice and shrimp areas). The transition to sustainable shrimp farming
will reduce groundwater abstraction.
6.3.1.8 Impacts of protecting mangrove forests in coastal areas
To adapt to saline intrusion and prevent coastal erosion in Ca Mau and Bac Lieu, measures will include ecosystem-based aquaculture, resilient infrastructure for aquaculture and mangrove
reforestation. Mangroves play a critical role in biodiversity and ecosystem productivity in the
coastal areas of the Mekong Delta. In some areas of the delta, dykes are already being strengthened or heightened and mangroves are being planted to improve protection from storm
surges and coastal erosion The GIZ Integrated Coastal and Mangrove Protection (ICMP) programme is supporting Vietnam to manage its coastal ecosystems in order to strengthen
resilience to climate change. To manage environmental impacts, a forest Management Plans
(0P 4.36) will be prepared for all mangrove reforestation work undertaken as part of the project.
Integrated coastal management requires a combination of sea dykes, mangrove restoration and sustainable shrimp farming to protect the peninsula from coastal erosion and sea level rise.
Increasing the mangrove area will protect against costal erosion, storm surges and may increase
biodiversity. This activity should be supported by biodiversity conservation and monitoring to protect saline and estuarine species in the mangrove areas. The sustainable management of
coastal (near-shore) fisheries and other aquatic animals is important to support livelihoods of landless and protect biodiversity.
6.3.1.9 Impacts of building reservoir for freshwater storage
Surface water serves as one of the main water sources in the freshwater zone while groundwater is still the main supply source in the coastal zone, especially during the dry season. Coastal
provinces suffer from several negative trends, like increased salinity intrusion, decreasing availability of fresh water of sufficient quality, depletion of aquifers. Coping with dry season
fresh water shortages and droughts and securing fresh water supply is a critical challenge for
the Peninsula. Water supply in many areas, such as Ca Mau, Bac Lieu and Soc Trang water is used without treatment, so water quality is below the required standards. This activity will have
positive impacts for 11,000 households in the Ca Mau peninsula.
The investments in Cau Mau will also support the construction of a below ground reservoir to
store freshwater from the wet season and release during the dry reason for domestic and
agricultural uses. The reservoir responds to the challenges of dry season freshwater shortages in the dry season and if implemented in combination with climate smart agriculture will reduce
groundwater dependence. Reviewing the operational rules, multipurpose uses (i.e. irrigation, flood control) and dam safety aspects will be important to consider in the subproject safeguard
instruments. A combination of hydrological and hydraulic modelling should be used to predict
the irrigation area (ha), total storage (ML) and operating rules for the reservoir. The reservoir will be constructed in a flat area and will be below ground, thus there is no need to construct a
high dam wail (i.e. above 10 m).
Dam safety issues based on flood retention structures (OP 4.37). Given that the dam wall and
flood retention structures will not be higher than 10 meters, the team will agree on appropriate
safety measures with the Borrower to ensure the involvement of qualified engineers, and will confirm that the ESIAs for relevant subprojects have determined that there would be no or
negligible risk of significant adverse impacts due to potential failure of the structure to local communities and assets, including assets to be financed as part of the proposed project.
156
The development of freshwater supplies for domestic use will have important positive impacts
in preventing further groundwater depletion and land subsidence. These investments should be supported by climate smart agriculture and groundwater studies to determine the existing
agricultural, industrial and domestic use and to identify hotspot areas for groundwater extraction. There are links between groundwater abstraction, land subsidence and
coastal/riverbank erosion so increasing freshwater storage is an important subproject under the
MD-ICRSL.
Potential increase in wastewater resulting from increased services of rural water supply has
been identified, but the impacts would not be significant. The water is available through canals and rivers in the Mekong Delta, and incremental use of the domestic water consumption would
not be significant.
6.3.1.10 Utilizing enhanced information systems to monitor regional impacts The investments to enhance monitoring systems under Component 1 of the project can be used
to monitor the regional impacts (positive and negative) of the investments in the upper delta floodplains, delta estuary and peninsula and from future environmental challenges. The
investments include remote sensing, land use studies, water quantity/quality and groundwater
monitoring, coastal and river morphology and coastal zone protection. The MARD Operation System for Hydraulic Infrastructure will provide real-time information on salinity, floods, and
droughts to allow for better operation of infrastructure, this may reduce the impacts of installing and operating water/salinity control structures.

157
Table 15: Summary of regional impacts for Components 2, 3 & 4
Summary of regional impacts for Components 2, 3 & 4
Activity Demand on natural
resources
Significant impacts Impact Management measures
Intensity/Extent/Duration Rating
Upgrading and
constructing new
infrastructure
Physical conversion
of land for
embankments, dykes,
sluices and
associated
infrastructure.
Change in landform M/Lo/Lt
Moderate Subproject safeguards instruments and
EMP, national and district
MARD/MONRE to monitor.
Loss of grasslands, agricultural land and habitat W/Lo/Lt Minor
Subproject safeguards instruments and EMMP, national and district
MARD/MONRE to monitor.
Increased dust, noise, vibration, wastes, and
possible social issues such as graveyard relocation M/Lo/Lt
Moderate Subproject safeguards instruments and
EMMP, national and district
MARD/MONRE to monitor.
Local traffic disturbed during construction
W/Lo/Lt Minor Subproject safeguards instruments and
EMMP, national and district
MARD/MONRE to monitor.
Dredging Dredging of land for
canals and
construction of
embankments and
dykes.
Loss of grasslands, agricultural land and habitat W/Lo/Lt Minor
Subproject safeguards instruments and
EMP, national and district
MARD/MONRE to monitor.
Increase in suspended solids in water due to
disturbances of bottom sediment W/Lo/St
Minor Subproject safeguards instruments and
EMP, national and district
MARD/MONRE to monitor.
Contamination of land and water from disposal of dredged material (volume)
M/Lo/St Moderate
Subproject safeguards instruments and
EMP, national and district
MARD/MONRE to monitor.
Installing
water/flood
control structures
in the upper delta
Increased flood
retention in project
area. Changes in
hydrological flow
and land use.
Surface water quality issues from conversion to aquaculture and freshwater shrimp M/Sr/Mt
Moderate Climate smart farming and sustainable
agricultural practices implemented
Component 1 of MD-ICRSL
Increased flood retention in the upper Delta H/R/Mt Major
Modelling and flood forecasting to
determine areas flooded and non-flooded in
wet, average and dry years.
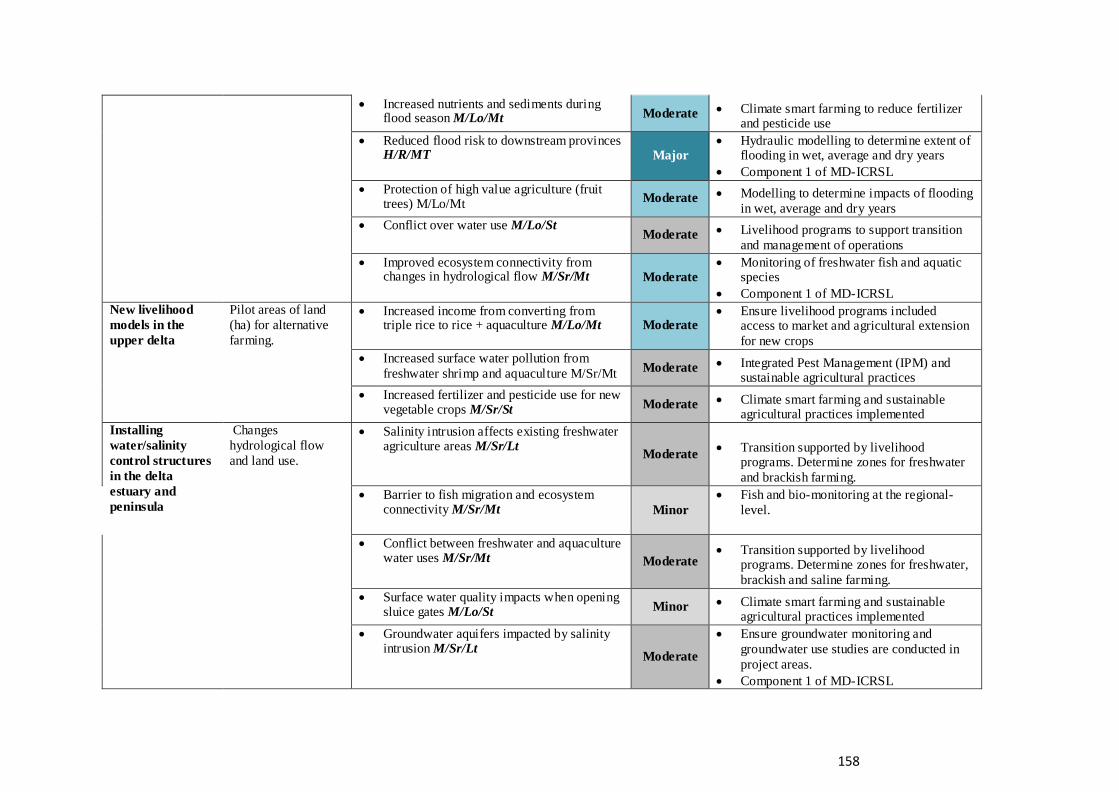
158
Increased nutrients and sediments during flood season M/Lo/Mt Moderate Climate smart farming to reduce fertilizer
and pesticide use
Reduced flood risk to downstream provinces H/R/MT Major
Hydraulic modelling to determine extent of flooding in wet, average and dry years
Component 1 of MD-ICRSL
Protection of high value agriculture (fruit trees) M/Lo/Mt Moderate Modelling to determine impacts of flooding
in wet, average and dry years
Conflict over water use M/Lo/St Moderate Livelihood programs to support transition
and management of operations
Improved ecosystem connectivity from changes in hydrological flow M/Sr/Mt Moderate
Monitoring of freshwater fish and aquatic species
Component 1 of MD-ICRSL
New livelihood
models in the
upper delta
Pilot areas of land
(ha) for alternative
farming.
Increased income from converting from triple rice to rice + aquaculture M/Lo/Mt Moderate
Ensure livelihood programs included access to market and agricultural extension
for new crops
Increased surface water pollution from
freshwater shrimp and aquaculture M/Sr/Mt Moderate Integrated Pest Management (IPM) and sustainable agricultural practices
Increased fertilizer and pesticide use for new vegetable crops M/Sr/St Moderate Climate smart farming and sustainable
agricultural practices implemented
Installing
water/salinity
control structures
in the delta
estuary and
peninsula
Changes
hydrological flow
and land use.
Salinity intrusion affects existing freshwater agriculture areas M/Sr/Lt
Moderate Transition supported by livelihood
programs. Determine zones for freshwater
and brackish farming.
Barrier to fish migration and ecosystem connectivity M/Sr/Mt Minor
Fish and bio-monitoring at the regional-
level.
Conflict between freshwater and aquaculture water uses M/Sr/Mt Moderate
Transition supported by livelihood programs. Determine zones for freshwater,
brackish and saline farming.
Surface water quality impacts when opening sluice gates M/Lo/St Minor Climate smart farming and sustainable
agricultural practices implemented
Groundwater aquifers impacted by salinity intrusion M/Sr/Lt
Moderate
Ensure groundwater monitoring and
groundwater use studies are conducted in
project areas.
Component 1 of MD-ICRSL

159
Reduced coastal erosion H/R/Lt
Major Remote sensing technology to monitor
changes in coastal erosion.
Component 1 of MD-ICRSL
Reduced damage from storm surges and sea level rise M/Sr/Mt Moderate Monitor sea dykes and embankments
following storm surges and flooding.
Improved resilience of farmers H/Lo/Mt
Moderate
Transition supported by livelihood programs. Monitoring to determine
boundaries for freshwater and brackish
farming.
Development of
livelihood models
in delta estuary
and peninsula
Pilot areas of land
(ha) for brackish
aquaculture.
Increased income from high value aquaculture M/Lo/Mt Moderate
Ensure livelihood programs included access to market, agricultural extension and
capacity building for new crops
Livelihood programs not provided to Khmer, other ethnic minorities and women M/Lo/Mt Moderate
Ensure livelihood models are
communicated to all communities in pilot
and surrounding areas
Surface water quality issues of aquaculture and shrimp farming M/Sr/St Moderate Integrated Pest Management (IPM) and
sustainable agricultural practices
Expanding
aquaculture and
shrimp farming
Conversion of land
for sustainable
shrimp farming.
Reduced income for intensive shrimp farmers M/Lo/St Moderate
Transition supported by livelihood programs.
Conflict between fresh and brackish water uses M/Lo/St Minor
Transition supported by livelihood
programs. Monitoring to determine land
use changes in the project area.
Improved surface water quality from reduced intensive shrimp M/Sr/Lt Moderate VietGap standard to develop operational
guidelines for water management systems
Reduced use of groundwater M/Sr/Mt
Moderate Groundwater use studies and monitoring
implemented in project areas.
Component 1 of MD-ICRSL
Protecting
mangrove forests
in coastal areas
Increased area of
mangroves in coastal
areas.
Increased mangrove forest areas and biodiversity H/Sr/Mt Major Implement coastal fisheries management
and Forest Management Plan
Increased protection from coastal erosion and sea level H/Sr/Mt Moderate
MARD/MONRE to monitor sites of mangrove restoration zone and establish
area for protection.
Establish mangrove-clam farming systems M/Lo/Mt Moderate Reduces need for intensive shrimp farming,
and promotes sustainable use of resources.

160
Reservoir for
freshwater
storage
Physical conversion
of land for
freshwater storage
(ML) and flood
control.
Surface water pollution during collecting of wastewater M/Lo/St Minor
Water quality monitoring programs during construction and operation.
Component 1 of MD-ICRSL
Improved access to water and sanitation M/Lo/Mt Moderate
Infrastructure development supported by water and sanitation livelihood programs.
Increased freshwater for agricultural and domestic use in dry season M/Sr/Lt Major
Implemented with climate smart agriculture and water conservation measures
Reduced groundwater abstraction in dry season M/Sr/Mt Moderate
Groundwater use studies and monitoring implemented in project areas.
Component 1 of MD-ICRSL
Dam safety risks to surrounding communities W/Lo/Mt
Minor EA and dam safety assessment for subproject

161
6.4 Summary of regional impacts
The impacts of upgrading and constructing new infrastructure and dredging are likely to only
have local or sub-regional impacts and can be managed through subproject safeguard instruments and environmental management plan (EMP). Further information will be provided
in the ESMF and the subproject ESIAs, where required.
Installing water/flood control structures in the upper delta will change the hydrological flow and is likely to have major positive regional impacts by increasing flood retention and restoring
floodplain ecosystems and agriculture. Hydrological and hydraulic modelling is needed to determine the extent of flood protection in wet and average years. Flooding will provide
nutrients and sediment in the wet season reducing the use of fertilizers and pesticides. Under
the new livelihood models farmers will be transitioning from triple rice cropping to double rice plus crops and aquaculture. This will be a step-by-step process that includes agricultural
extension, access to markets and sustainable agricultural practices. Surface water monitoring will be important to detect whether the use of agro-chemicals, fertilizers and pesticides has
increased or reduced in the project areas.
Installing water/salinity control structures in the estuary and peninsula will have major positive impacts by increasing protection from coastal erosion, and major negative regional impacts by
blocking the movement and migration of coastal and estuarine fisheries in the Delta. The loss in capture fisheries may be offset by increasing the area of mangrove forests, that in
combination with improved coastal management are likely to increase biodiversity. The
combination of mangroves and sea dykes will also provide positive benefits by reducing the damages caused by storm surges and sea level rise.
The operation of the sluice gates will need to be flexible, and incorporate hydrological modelling and surface water monitoring of salinity to determine zones for freshwater, brackish
and saline farming. The operations and zones may need to be altered depending on wet, average
or dry years. For example, the provinces of Vinh Long are impacted by salinity in dry years only. The MARD Operation System for Hydraulic Infrastructure to be developed under
Component 1 will inform more sustainable operation of existing and proposed water control structures.
The development of livelihood programs in the delta estuary should help farmers to transition
to adapt to salinity intrusion and improve climate resilience. A step-by-step process is needed as some high value aquaculture (i.e. sugar cane) in the estuary earns higher income and
provides more employment opportunities than aquaculture and shrimp farming. The livelihood models will need to provide support to Khmer and other ethnic groups. Promoting sustainable
aquaculture, extensive shrimp and mangrove-shrimp should lead to reduced groundwater
abstraction and surface water pollution associated with intensive shrimp farming. The groundwater and surface water monitoring developed under Component 1 can monitor any
regional impacts or changes.
Constructing the reservoir in Ca Mau to increase freshwater storage in the delta peninsula is
likely to have major positive regional impacts. Dry season freshwater shortages and access to
water and sanitation are critical challenges in coastal areas. The reservoir, if operated effectively, and complemented by climate smart agriculture should decrease the exploitation
of groundwater. Dam safety measures and further hydraulic modelling is required to enhance the benefits and reduce any negative impacts during construction and operation of the reservoir.
Overall the subprojects are designed to have positive environmental and social impacts and
monitoring changes during construction and operation of water control infrastructure and
162
livelihood models is required. The additional surface and groundwater monitoring and
assessing changes in coastal and riverbank erosion under Component 1 will be important for measuring and managing the regional impacts of the subprojects 2, 3 and 4. The investments
under Component 1 are outlined in Chapter 7 of the REA.
The implementation of subprojects in Phase I will provide important insights into the design
and safeguard instruments for the Phase II subprojects. The World Bank is also investing in a
number of climate resilience, sustainable agriculture, sustainable coastal management and IWRM projects that provide important linkages to the MD-ICRSL. These investments and the
relevance to the MD-ICRSL are described in the next section.
6.5 Public consultation on REA
The key findings of the REA were presented at a Public Consultation in Can Tho on Friday 29th January. The provincial and district representatives provided the following comments in
relation to environmental and social issues
6.5.1 Upper Delta
The operation of low embankments will replenish coastal ecosystems with freshwater during August and also flush salinity, the potential negative hydrological impacts of embankments to
surrounding areas should also be considered. Surface water pollution from upstream intensive
aquaculture (catfish) is affecting rice, horticulture and shrimp farming downstream and improving wastewater treatment and water management at the farm-level is required.
Aquaculture is capital intensive and not all areas have access to electricity, support is required to transition from triple rice to double rice + shrimp/aquaculture.
6.5.2 Delta Es tuary
Need to establish zones for areas with freshwater and brackish farming, these should be flexible
to adapt to wet, average and dry years. For example, Vinh Long is impacted by saline intrusion in dry years, so land use would need to be adapted. Adaptive management of sluices for both
flood control and salinity control is required to deal with both wet and dry years. Sluices and
dykes may impact on local waterway transportation, for farmers to transport goods and fishers to access estuary and coastal areas. Embracing saline conditions should also consider impacts
on water uses for poultry, pigs and domestic water supply. Erosion is still happening near the operation of the sluices in the South Mang Thit and required further investigation.
Currently, the ‘Ba Lai’ provides freshwater for triple/double rice, a step-by-step approach for transitioning to brackish aquaculture needs to be considered. For example, there may be
reduced income in moving from sugar cane to shrimp (Soc Trang). Local farmers agree with more sustainable mangrove-shrimp farming, but also acknowledged that there is reduced
income for farmers when transitioning to new crops.
6.5.3 Peninsula
The proposed sea dykes/embankments need to consider waterway transportation and applying
new technology to combine ship locks and salinity control. The operation of sluices for salinity will be important for dry years, especially during El Nino. Coastal erosion is still
occurring in West Sea Dykes (Ca Mau) and more investment is needed to address this issue. Further mangrove restoration will protect farming areas inside the dike areas to maintain
livelihoods. The livelihood models in Ben Tre could also be applied to the Kien Giang
province.

163
6.6 Linkages with other World Bank projects in the Mekong Delta
The investments in the MD-ICRSL align with other World Bank projects implemented in the
Mekong Delta in water resources, flood protection, coastal management, flood protection and climate change adaptation (Table 16).
Table 16: Ongoing World Bank projects relevant to the MD-ICRSL project
Project name Project development objective (PDO) Total project
cost (In USD
million)
Vietnam Sustainable
Agriculture
Transformation
(VNSAT) Project
(P145055)
Improve farming practices and value chains in the
targeted project areas, and promote institutional
strengthening of relevant public agencies in effective
support to implementation of the Agricultural
Restructuring Plan.
351.00
Coastal Resources for
Sustainable
Development Project
(CRDSP) (P11879)
Improve the sustainable management of coastal
fisheries in the Project Provinces.
126.90
Mekong Delta Water
Management for Rural
Development
(Mekong Water)
(P113949)
Protect and enhance the utilization of water
resources in the project provinces of the Mekong
Delta region in order to sustain gains in agricultural
productivity, raise living standards, and contribute to
climate change adaptation.
160.0
Mekong Integrated
Water Resources
Management (Mekong
IWRM) - Phase II
(P124942)
Establish key examples of integrated water resources
management practices in the LMB at the regional,
national, and sub-national levels, thus contributing to
more sustainable river basin development in the
Lower Mekong.
25.0
Mekong Delta Region
Urban Upgrading
Project (UUP)
(P113904)
Improve infrastructure services in Low Income
Areas in the Project Cities in the Mekong Delta
Region.
100.0
Mekong Transport
Infrastructure
Development Project
Improve access to markets by businesses, farmers
and the poor with lower logistics costs resulting from
the alleviation of key physical and institutional
bottlenecks of the main transport corridors in the
Mekong Delta region.
99.0
The VNSAT project aims to support rice and coffee farmers to adopt improved farming practices to promote reduction in the use of chemical fertilizers, agro-chemicals, water and
GHG emissions from rice and coffee farming. The sustainable rice-based systems component will be implemented in eight Mekong Delta provinces of Kien Giang, An Giang, Hau Giang,
Tien Giang, Can Tho, Soc Trang, Dong Thap, and Long An. This project will provide important
insights to the development of livelihood models in the Upper Delta and Estuary in the MD-ICRSL project.
164
The Mekong IWRM project has important links to Component 1 of the MD-ICRSL project as
the project is supporting Vietnam to improve trans-boundary water resources monitoring through the development of water resources monitoring networks in the Central Highlands and
the Mekong Delta provinces; Long An, Dong Thap, Kien Giang, Tay Ninh, and An Giang. This project also includes improving hydro-meteorological information network, flood
forecasting and early warning systems.
The CRDSP is being implemented in the Ca Mau and Soc Trang provinces (Mekong Delta Cluster) and promotes good practices for sustainable aquaculture and coastal management,
including near-shore capture fisheries. The MD-ICRSL also supports the increased area of mangroves, biodiversity conservation and sustainable coastal management to increase
livelihoods and protect natural resources in coastal areas.
The UUP included investments in improving water and sanitation, flood protection and drainage systems in low-income areas of six cities in the Mekong Delta, including Ca Mau and
Tra Vinh. Improving flood retention in the Upper Delta under the MD-ICRSL project will reduce flood risks to cities in the middle delta.
The Mekong Delta Water Management for Rural Development project includes similar civil
works to the MD-ICRSL, including
Major maintenance of existing under-performing infrastructure (e.g., canal dredging, re-sectioning and lining repairs, and rehabilitation of dykes);
Completion and/or minor upgrading of existing infrastructure (construction of secondary and tertiary sluices gates, construction of small canal bridges, upgrading
canal dykes); and
Rehabilitation of the tertiary and quaternary irrigation facilities.
The lessons learned during the construction and operation of this infrastructure will inform the
ESMF and subproject safeguards. The following TA packages and studies provide important inputs to the MD-ICRSL
Building resilience in the Mekong Delta (TA)(P149017): Provided inputs for the design of the proposed project through the development of the DSF, and accompanying interactive
tools, GIS tools and maps. This TA contributed to the trend, challenges and future scenarios described in this REA based on the scenarios and land-use classes developed under the
MDP 2013;
Review of the Study on the Impacts of Mainstream Hydropower on the Mekong River
(TA): Knowledge generated from the impacts of upstream development in the Mekong Delta was used to inform the design of the DSF and ‘low regret’ investment screening; and
6.7 Recommendations:
Following this REA, a number of environmental safeguard instruments and assessment will be
conducted for this project, including ESMF, three EMPs and four ESIAs. These documents will primarily focus on the 11 subprojects to be implemented. The MD-ICRSL project will
implement measures to monitor and manage the potential regional impacts by:
Enhancing monitoring of surface water, groundwater and fisheries in project areas during construction and operation of water control infrastructure, supported by
groundwater use studies;
165
Using remote sensing tools to monitor riverbank and coastal changes to determine the effectiveness of investments in coastal protection;
Establishing zones and flexible management for freshwater and brackish aquaculture and consider participatory approaches for determining operating schedules of water
control infrastructure;
Ensuring the step-by-step implementation of livelihood models including agricultural
extension and market services;
Incorporating lessons learned from ongoing WB projects in the Mekong Delta,
including: o CRDSP- improve coastal management to protect biodiversity in mangrove areas
o VNSAT- climate smart agriculture and integrated pest management (IPM) o UUP- flood retention, drainage and water and sanitation facilities
o Mekong Delta Water Management for Rural Development- constructing and
operating water control infrastructure o Mekong IWRM- improve hydro-met and water monitoring to inform future
investments and to strengthen Component 1.
Involve the VNMC, MONRE and other agencies to use the modelling developed for
the MDS for coastal erosion, salinity intrusion and the transport of sediments and nutrients to the delta;
Apply the lessons from the implementation of the three first-year subprojects into the design and operation of subprojects in Phase II, activities could involve:
o Project area environmental and social surveys; o GIS mapping of any problem areas or hotspots;
o Hydrological modelling to determine changes in flow in the upper delta, estuary
and peninsula; o Hydraulic modelling to determine effectiveness of sluices, canals and water
control infrastructure; o Reviewing yield (t/ha), price and farm-based income for alternative cropping.
Enhance flood and drought early warning systems in relation to agriculture and aquaculture in the three hydro-ecological zones.
Investing in monitoring systems for surface water, groundwater and coastal and riverbank
erosion and establishing integrated information systems will enhance decision making in the Mekong Delta. Significant investments to enhance monitoring, analytics, and information
systems are included in Component 1 of the MD-ICRSL and are outlined in Chapter 7.
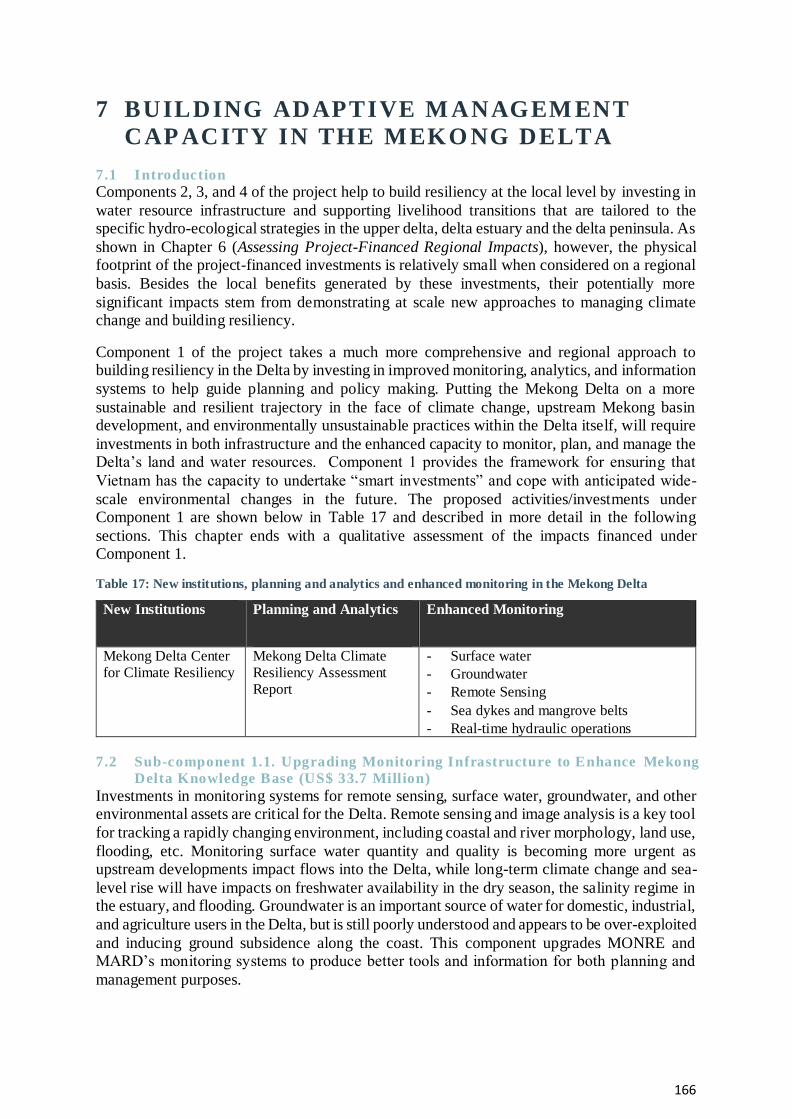
166
7 BUILDING ADAPTIVE M ANAGEM ENT
CAP ACITY IN THE MEKO NG DELTA
7.1 Introduction
Components 2, 3, and 4 of the project help to build resiliency at the local level by investing in
water resource infrastructure and supporting livelihood transitions that are tailored to the specific hydro-ecological strategies in the upper delta, delta estuary and the delta peninsula. As
shown in Chapter 6 (Assessing Project-Financed Regional Impacts), however, the physical footprint of the project-financed investments is relatively small when considered on a regional
basis. Besides the local benefits generated by these investments, their potentially more
significant impacts stem from demonstrating at scale new approaches to managing climate change and building resiliency.
Component 1 of the project takes a much more comprehensive and regional approach to building resiliency in the Delta by investing in improved monitoring, analytics, and information
systems to help guide planning and policy making. Putting the Mekong Delta on a more
sustainable and resilient trajectory in the face of climate change, upstream Mekong basin development, and environmentally unsustainable practices within the Delta itself, will require
investments in both infrastructure and the enhanced capacity to monitor, plan, and manage the Delta’s land and water resources. Component 1 provides the framework for ensuring that
Vietnam has the capacity to undertake “smart investments” and cope with anticipated wide-
scale environmental changes in the future. The proposed activities/investments under Component 1 are shown below in Table 17 and described in more detail in the following
sections. This chapter ends with a qualitative assessment of the impacts financed under Component 1.
Table 17: New institutions, planning and analytics and enhanced monitoring in the Mekong Delta
New Institutions Planning and Analytics
Enhanced Monitoring
Mekong Delta Center
for Climate Resiliency
Mekong Delta Climate
Resiliency Assessment
Report
- Surface water
- Groundwater
- Remote Sensing
- Sea dykes and mangrove belts
- Real-time hydraulic operations
7.2 Sub-component 1.1. Upgrading Monitoring Infrastructure to Enhance Mekong
Delta Knowledge Base (US$ 33.7 Million)
Investments in monitoring systems for remote sensing, surface water, groundwater, and other environmental assets are critical for the Delta. Remote sensing and image analysis is a key tool
for tracking a rapidly changing environment, including coastal and river morphology, land use,
flooding, etc. Monitoring surface water quantity and quality is becoming more urgent as upstream developments impact flows into the Delta, while long-term climate change and sea-
level rise will have impacts on freshwater availability in the dry season, the salinity regime in the estuary, and flooding. Groundwater is an important source of water for domestic, industrial,
and agriculture users in the Delta, but is still poorly understood and appears to be over-exploited
and inducing ground subsidence along the coast. This component upgrades MONRE and MARD’s monitoring systems to produce better tools and information for both planning and
management purposes.

167
7.2.1 Upgrading MONRE’s Surface Water Quality Monitor ing Network (US$ 9.5 million)
MONRE’s Department of Water Resources Management will be responsible for overseeing this sub-component. The project will finance civil works and equipment for: i) upgrading six
existing hydrological stations; ii) six new hydrological stations; and iii) eight new salinity intrusion monitoring stations. The stations will monitor both flow and water quality. The
proposed stations will complement the existing hydrological monitoring system in the Delta,
which is composed of 39 hydrological stations (managed by the Department of Water Resources), and 35 salinity intrusion stations (managed by National Center for Hydro-
Meteorological Forecasting). Under an on-going MONRE hydro-met modernization program, data from all sources will be standardized and transmitted to central receiving station.
7.2.2 Upgrading MONRE’s Groundwater Monitor ing Network (US$ 10.0 million)
MONRE’s National Center for Water Resources Planning Investigation (NAWAPI) will be
responsible for implementing this sub-component. Seven distinct aquifers exist in the Delta, ranging in depth from roughly 25 meters to 500 meters. The project will finance the
development of 171 monitoring wells, including: i) rehabilitation of 34 existing wells; and ii)
137 new wells. For each monitoring site, there are typically multiple wells to monitor distinct aquifers; in total the project will construct/upgrade around 34 monitoring sites (16 upgrades,
and 18 new). The wells will include equipment for monitoring levels and water quality, as well as transmission equipment to send the data to the centralized MONRE center. Since NAWAPI
is the only organization in Vietnam licensed to construct groundwater monitoring wells, this
activity will be undertaken by NAWAPI on a Force Account basis.
This sub-component will also finance a “Groundwater Survey” which undertake a survey of
groundwater users in selected groundwater “hot-spots” and further develop groundwater models in order to better understand issues such as falling groundwater levels, land subsidence,
and groundwater saline intrusion. After the Study is completed, an assessment will be
undertaken to determine if additional groundwater monitoring wells need to be developed.
7.2.3 Upgrading of MONRE’s Remote Sensing Infrastructure and Associated Studies
(US$ 11.0 million)
This activity will be led by MONRE’s National Remote Sensing Department. The Department’s existing satellite receiving station in Hanoi will be upgraded to allow it to receive
the latest data from SPOT 6 and Spot 7 satellites. SPOT (Satellite Pour l’Observation de la
Terre) is a commercial high-resolution optical imaging Earth observation satellite system operating from space. The MONRE remote sensing laboratory in Hanoi will also be upgraded
with new equipment and analytical tools. The project will also finance the purchase of SPOT images during the period when the receiving station is out-of-operation during the upgrading
period.
The sub-component includes specific studies the use the new remote sensing imagery to monitor environmental conditions in the Delta. The first identified study is for monitoring and
evaluation of river and coastal morphology; historical images of river and coastal changes will be combined with new more precise imagery to track shoreline and river changes. Depending
on available resources, the project may also finance other studies related to land use, cropping
patterns, flooding, etc., in the Delta.
7.2.4 Upgrading MARD’s Water Resource Monitoring Sys tems (US$ 3.2 million)
MARD has assigned the Southern Institute of Water Resources Research (SIWRR) to carry out
the annual prediction of salinity intrusion and flood forecasting in the Mekong Delta. The sub-
168
component will finance the development of a “Real-Time Operation System for Hydraulic
Infrastructure in the Mekong Delta” (US$ 2.5 million). This consists of: i) updating the hydraulic, agricultural, and monitoring databases; ii) upgrading existing Delta water resource
models; iii) simulate different flood and drought scenarios to develop operational protocols; and iv) enhanced sharing of information, communication, and warning systems.
This component will also finance the development of a “Database on Mekong Delta Sea Dykes
and Mangrove Forests” (US$ 0.7 million) which will be overseen by the Southern Institute of Water Resources Planning (SIWRP). The sea dyke system and mangrove belt in the Delta is
over 700km long, yet there is insufficient information with respect to the condition of neither the sea dykes nor a systematic assessment and monitoring of mangrove belts. This study will
create a database on both sea dykes and mangroves, which will allow for better monitoring,
maintenance, and investments for these critical coastal assets.
7.3 Subcomponent 1.2. Infrastructure and Information Systems for Enhanc ed
Decisions (US$ 13.8 million)
Monitoring networks and remote sensing systems are critical in gathering the evidence base (data, information, trends) relating to land-use, surface and groundwater (quality and quantity),
flooding, cropping, and infrastructure impacts. These results need to feed into decision support
systems (comprising of modelling, tools, scenario analysis etc.) to contribute to evidence-based decision-making. This sub-component will finance infrastructure and enhance integrated
information systems to improve the ability of government and other stakeholders to access, and analyze information related to the challenges and risks facing the livelihoods and assets in the
Mekong Delta. It will also significantly enhance policy and planning for greater climate
resilient development in the Mekong Delta.
7.3.1 Mekong Delta Center for Climate Resilience (US$ 12.0 million)
Several research institutes and departments are involved in gathering and analyzing data and
information on the Delta; however, there are no current mandates for data sharing, which would
contribute to the integrated and multi-sectoral solutions that are often needed. The Center is envisioned to serve as a hub for Delta-wide information, including water, land use,
environmental and climate change information, education and outreach, and provide support to specialized studies and research projects that inform decisions and investments in the
Mekong Delta.
7.3.2 Constructing and Equipping the Mekon g Delta Center (US$ 5 million)
This subcomponent will finance the construction of a state-of-the-art modern building (located
in Can Tho) including associated equipment and software. The Center shall be under the auspices of MONRE but serve multiple stakeholders as a one-stop shop for accessing data on
the Mekong Delta. It will also serve as the repository for all real-time monitoring information related to water flows, water quality, salinity, etc. collected from the monitoring networks and
other sources. A Mekong Center business plan will be developed during the project and will
examine options for sustainable funding and possible expansion, including: commercial services such as selling of data or analytical products, government budget, donor support, and
corporate and individual donations.
7.3.3 Formulation of Mekong Delta Climate Res iliency Assessment (US$ 3.5 million)
The foundation of the Center will be a “knowledge management platform” (KMP) which will be a state-of-art computer system providing MONRE and other stakeholders with the capability
to investigate the environmental and socio-economic impacts of climate change and basin developments on the Mekong Delta. A consulting firm will be contracted to design the KMP
169
which, drawing upon the existing Mekong River Commission (MRC) experience, is envisioned
to consist of: i) Knowledge Base: databases containing time series data sets, GIS data sets, models, and other miscellaneous data (e.g. reports), etc.; ii) GIS Viewer capable of showing a
wide range of standard GIS formats plus the capability to search data by location; and iii) Toolbox Manager that holds a list of available tools (e.g. models) with a description of each
tool that allows the user to select and utilize these tools.
The consulting firm will also work with MONRE in the formulation of a Mekong Delta Climate Resiliency Assessment. The Assessment should be completed by 2019 and will help to inform
planning exercises in the Vietnam government, including the MPI’s “Socio-Economic Development Plan for the Mekong Delta”, provincial socio-economic development and land
use plans, and sector master plans for the next planning cycle (2021-2025). The Assessment
will develop a set of key environmental and socio-economic indicators related to Mekong Delta sustainability, and then assess the status, trends, and driving factors related to those indicators.
The Assessment will also identify any data or knowledge gaps, which need to be addressed for the next Assessment process, which ideally should take place every five years. Finally, the
Assessment will provide a set of recommendations related to the next planning cycle in order
promote adaptive management of the Delta. Much of the information for the Assessment is expected to flow through the Mekong Delta Center’s KMP and thus there is one consultancy
for system integration design and development of the Mekong Delta Climate Resiliency Assessment Report.
7.3.4 Development of Databases and Models for the Mekong Delta Center (US$ 3. 5 million)
As described in Subcomponent 1.1 above, there will be significant expansion of the monitoring systems producing data related to remote sensing, water quality, groundwater, modelling, etc.
which will be generated by a wide variety of MONRE and MARD entities as well as other stakeholder. This information will be fed into the Mekong Delta Centre’s KMP. Although a
consultancy firm is expected to design the KMP, the actual work of constructing the KMP and
feeding in standardized data and information will be undertaken by specialized institutes and national consultant companies.
7.3.5 Vietnam National Mekong Committee (VNMC) Mekong Basin Databas es and
Models (US$ 1.8 million)
Approximately 95% of the water that flows through the Vietnam Mekong Delta is generated
outside of the Vietnamese part of the Delta within the Mekong River Basin, which includes
land in China, Myanmar, Lao PDR, Thailand, Cambodia, and Vietnam. In 1995 the four lower basin countries signed the Mekong Agreement, which established the MRC; China and
Myanmar are dialogue partners with the MRC. The VNMC is the government’s official representative for interacting with the MRC. The VNMC recently completed a large-scale
exercise to develop Vietnam’s own Mekong basin wide modelling system, which complements
the MRC’s modelling tools, as well as a model of the Delta’s coastal zone. This sub-component will upgrade the VNMC’s Mekong basin modelling package, help address data gaps, and
include the integration of the VNMC’s databases/models into the Mekong Delta Center’s KMP. The summary of Component 1 is provided in Table 18 below.
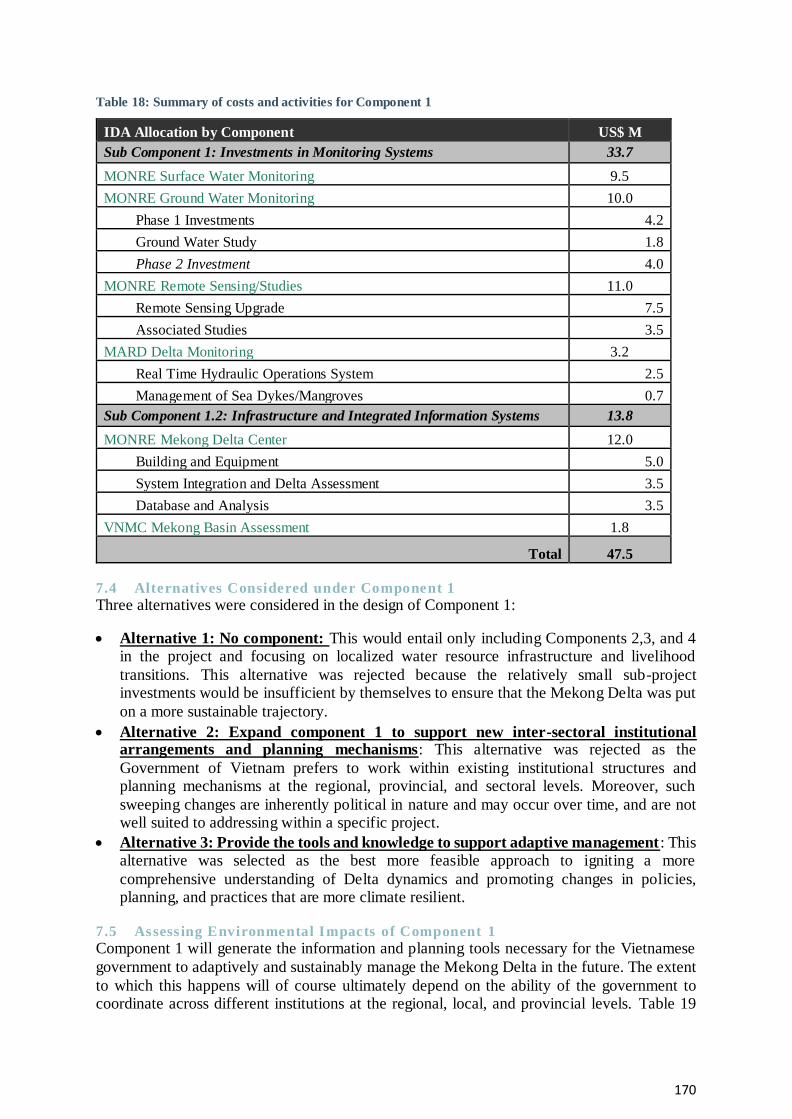
170
Table 18: Summary of costs and activities for Component 1
IDA Allocation by Component US$ M
Sub Component 1: Investments in Monitoring Systems 33.7
MONRE Surface Water Monitoring 9.5
MONRE Ground Water Monitoring 10.0
Phase 1 Investments 4.2
Ground Water Study 1.8
Phase 2 Investment 4.0
MONRE Remote Sensing/Studies 11.0
Remote Sensing Upgrade 7.5
Associated Studies 3.5
MARD Delta Monitoring 3.2
Real Time Hydraulic Operations System 2.5
Management of Sea Dykes/Mangroves 0.7
Sub Component 1.2: Infrastructure and Integrated Information Systems 13.8
MONRE Mekong Delta Center 12.0
Building and Equipment 5.0
System Integration and Delta Assessment 3.5
Database and Analysis 3.5
VNMC Mekong Basin Assessment 1.8
Total 47.5
7.4 Alternatives Considered under Component 1
Three alternatives were considered in the design of Component 1:
Alternative 1: No component: This would entail only including Components 2,3, and 4 in the project and focusing on localized water resource infrastructure and livelihood
transitions. This alternative was rejected because the relatively small sub-project investments would be insufficient by themselves to ensure that the Mekong Delta was put
on a more sustainable trajectory.
Alternative 2: Expand component 1 to support new inter-sectoral institutional arrangements and planning mechanisms: This alternative was rejected as the
Government of Vietnam prefers to work within existing institutional structures and planning mechanisms at the regional, provincial, and sectoral levels. Moreover, such
sweeping changes are inherently political in nature and may occur over time, and are not well suited to addressing within a specific project.
Alternative 3: Provide the tools and knowledge to support adaptive management : This alternative was selected as the best more feasible approach to igniting a more
comprehensive understanding of Delta dynamics and promoting changes in policies, planning, and practices that are more climate resilient.
7.5 Assess ing Environmental Impacts of Component 1
Component 1 will generate the information and planning tools necessary for the Vietnamese
government to adaptively and sustainably manage the Mekong Delta in the future. The extent
to which this happens will of course ultimately depend on the ability of the government to coordinate across different institutions at the regional, local, and provincial levels. Table 19

171
below summarizes the predicated and potential environmental impacts of the general
interventions.
Table 19: Summary of potential environmental impacts of general interventions under Component 1.
Component
Interventions
Positive Impacts Negative Impacts
Mekong Delta Center
for Climate Resiliency
Potentially serve as a Center for knowledge,
education, and advocacy for building resiliency in
the Mekong Delta; help promote inter-sectoral
cooperation and facilitate the exchange of data and
information.
Minor and mitigated
impacts associated
with the
construction of the
Center
Mekong Delta Climate
Resiliency Assessment
Report
Potentially have a significant impact by promoting
the consideration of climate resiliency and
sustainability in Vietnamese government planning
processes at the regional, provincial, and sector level. Potentially identifying knowledge gaps and
guiding new research efforts.
None
Enhanced Monitoring:
- Surface water
- Groundwater
- Remote sensing
- Sea Dykes/mangrove
belts
- Hydraulic operations
Providing new information and knowledge for
planning and management decision-making.
Minor and mitigated
impacts associated
with the
construction of
monitoring stations.
7.6 Mekong Delta Climate Res iliency Assessment
Under Component 1, the project will also finance the “Mekong Delta Climate Resiliency Assessment,”
which will extend this current REA. The assessment is expected to be completed by 2020, and will
develop a set of key environmental and socio-economic indicators related to Mekong Delta
sustainability, and then assess the status, trends, and driving factors related to those indicators. The
assessment will also identify any data or knowledge gaps, and provide a set of recommendations related
to the next planning cycle in order to promote adaptive management of the Delta. This assessment
would help mainstream climate issues into next round of planning (2021-2025): i) MPI’s Mekong Delta
Socio-Economic Plan; ii) sectoral master plans and iii) provincial land use plans.
172
8 REFERENCES
Albers, T., Cong San, D., & Schmitt, K. (2013). Coastal Protection in the Lower Mekong Delta. GIZ,
Soc Trang.
Anderson, Henry R (1969). Hydrogeological reconnaissance of the Mekong Delta in South Vietnam
and Cambodia, Contributions to the hydrology of Asia and Oceania. (Geological Survey Water-
Supply Paper 1608-R).
Anthony, E. Brunier, G. Manon, B, Goichot, M. Dussouillez, P. Nguyen, VL. (2015). Linking rapid erosion of the Mekong River delta to human activities, Nature Publishing Group DOI:
10.1038/srep14745
An Giang’s Statistical Office (2014). Statistical Yearbook of An Giang province, An Giang Publishing
House, Long Xuyen city.
AusAid (2004). Mekong Delta poverty analysis, A final report.
Baird, I. (2009). The Don Sahong Dam: Potential Impacts on Regional Fish Migrations, Livelihoods and Human Health, POLIS Project on Ecological Governance, University of Victoria.
Baran, E. (2010). Mekong fisheries and mainstream dams. Fisheries sections in: ICEM 2010. Mekong
River Commission Strategic Environmental Assessment of hydropower on the Mekong mainstream,
International Centre for Environmental Management. Hanoi, Vietnam.
Baran, E., & Guerin, E. (2012). Fish bioecology in relation to sediments in the Mekong and in tropical
rivers. Report for the Project "A Climate Resilient Mekong: Maintaining the Flows that Nourish Life"
led by the Natural Heritage Institute, World Fish Centre, Phnom Penh, Cambodia.
Bravard, J.-P., Goichot, M., & Gaillot, S. (2013). Geography of Sand and Gravel Mining in the Lower
Mekong River. EchoGeo , 26.
Buckton, S. T., Nguyen Cu, Ha Quy Quynh and Nguyen Duc Tu (1999). Conservation of Key Wetland Sites in the Mekong Delta, BirdLife International Vietnam Programme Conservation Report No. 12.
BirdLife International Vietnam Programme, Hanoi, Vietnam
Buschmann, J., Berg, M., Stengel, C., Winkel, L., Sampson, M.L., Trang, P.T.K., Viet, P.H. (2008).
Contamination of drinking water resources in the Mekong delta floodplains: Arsenic and other trace
metals pose serious health risks to population. Environment International 34, 756 – 764.
Campbell, IC (2012). Biodiversity of the Mekong Delta, The Mekong Delta System, Springer
Environmental Science and Engineering 2012, pp 293-313.
Dan, TY. (2015). A Cost-Benefit Analysis of Dike Heightening in the Mekong Delta, Economy and
Environment Program for Southeast Asia (EEPSEA), May 2015
Day, J. W. (2007). Restoration of the Mississippi Dela: Lessons from Hurricanes Katrina and Rita.
Science , 315, 1679-1684.
Day, J. W., Hall, C., Kemp, W. M., & Yanez-Arancibia, A. (1989). Estuarine Ecology. John Wiley and
Sons Inc.
Dung, L.C, Tuan, V.V., Ha, V.V., Nhan, D.K. (2014), Livelihoods of rice farmers in the Mekong Delta.
An internal technical report of CLUES project.
Environment Monitoring Center (2012). National Environment Report 2012, Chapter 3 Surface Water
Quality.
Erban, L. E., Gorelick, S. M., & Zebker, H. A. (2014). Groundwater extraction, land subsidence, and
sea-level rise in the Mekong Delta, Vietnam. Environmental Research Letters

173
FAO (2006). Coastal protection in the aſtermath of the Indian Ocean tsunami: What role for forests and trees?, Proceedings of the regional technical workshop, Khao Lak, Thailand, 28–31 August 2006.
FAO (2011). Aquastat: Mekong River Basin:
http://www.fao.org/nr/water/aquastat/basins/mekong/index.stm
GSO (2007, 2011, 2013, 2014, 2015) Statistical Yearbook of Vietnam. Statistical Publishing House,
Hanoi.
GSO (2009) Population census in Vietnam. GSO, Hanoi
GSO (2014) Labor and employment census in Vietnam. GSO, Hanoi.
Hashimoto, Takehiko ‘Riko’ (2001). Environmental Issues and Recent Infrastructure Development in
the Mekong Delta: Review, Analysis and Recommendations with Particular Reference to Large-scale
Water Control Projects and the Development of Coastal Areas ISBN 1 86487 180 6.
Herbst, S., Benedikter, S., Koester, U., Phan, N., Berger, C., Rechenburg, A., Kistemann, T. (2009).
Perceptions of water, sanitation and health: a case study from the Mekong Delta, Vietnam. Science
& Technology 60 (3), 699-707.
Hoa, L.T.V., Shigeko, H., Nhan, N.H., Cong, T.T., (2008). Infrastructure effects on floods in the Mekong River Delta in Vietnam, Hydrological Processes 22, 1359–1372.
Hoang, Q.H., Kubo, E.N., Hoang, N.G., Tanji, H. (2009). Operation of the Ba Lai irrigation system in the Mekong Delta, Vietnam. Paddy Water Environ 7, 123–133.
Hortle, K. G. (2007). Consumption and the yield of fish and other aquatic animals from the Lower
Mekong Basin. MRC Technical Paper No. 16, Mekong River Commission, Vientiane.
Hung D.T., Bang N.H., Giang P.V., Ghassemi F. (2000). An evaluation of the sustainability of farming
systems in the brackish water region of the Mekong Delta: availability and quality of groundwater
resources, Department of Geology and Minerals, Division of Hydrogeology and Engineering
Geology for the South, Ho Chi Minh City & ACIAR, ANU, Canberra.
Hung, N. N., Delgado, J. M., Guntner, A., Merz, B., Bardossy, A., & Apel, H. (2014). Sedimentation in the floodplains of the Mekong Delta, Vietnam Part II: deposition and erosion. Hydrological
Processes, 28, 3145-3160.
ICEM. (2010). MRC Strategic Environmental Assessment (SEA) of hydropower on the Mekong mainstream: summary of the final report. Hanoi.
IUCN (2011). Mekong Water Dialogues Project. Groundwater in the Mekong Delta, Discussion Paper.
Kawahigashi , W., Do, M.N., Nguyen, N.B., Sumida, H. (2008). Effects of drying on the release of solutes from acid sulfate soils distributed in the Mekong Delta, Vietnam, Soil Science and Plant
Nutrition 54, 495-506.
Koehnken, L. Discharge and sediment monitoring program review, recommendations and data
Analysis: Part 2—Data analysis of preliminary results. Information and Knowledge Management
Programme (IKMP), Mekong River Commission, Phnom Penh, 53 pp (2012). 42.
Koponen, J., Lamberts, D., Sarkkula, J., & Inkala, A. (2010). Productivity Modelling Report. DMS - Detailed Modelling Support Project. Vientiane, Laos: Mekong River Commission.
Kummu M. and Sarkhula J. (2008). Impact of the Mekong River Flow Alteration on the Tonle Sap Flood
Pulse, Ambio Vol. 37, No. 3, May 2008. Royal Swedish Academy of Sciences 2008.
Lan, N . (2013). Social and ecological challenges of market-oriented shrimp farming in Vietnam,
SpringerPlus 2013, 2:675 http://www.springerplus.com/content/2/1/675 a
Lenhart, H. J., Radach, G., & Ruardij, P. (1997). The effects of river input on the ecosysten dynamics
in the continental coastal zone of the North Sea using ERSEM. Journal of Sea Research, 38, 249-274.
174
Lu XX, Siew RY. 2006. Water discharge and sediment flux changes over the past decades in the Lower Mekong River: possible impacts of the Chinese dams, Hydrology Earth System Science10: 181–195.
Le Cong Kiet (1994). Native freshwater vegetation communities in the Mekong Delta. International
Journal of Ecology and Environment Sciences. 20: 55-71.
Luong Quang Xo (2013). Water Resources Planning of the Mekong Delta under the context of climate
change and sea level rise, An internal technical report. Southern Institute for Water Resources
Planning (in Vietnamese).
Mai Trong Thong, Hoang Luu Thu Thuy, Vo Trong Hoang (2013). Ecosystem Assessment of Cuu Long
River Delta Wetland, Vietnam, Journal of Environmental Science and Management 16(2): 36-45
(December 2013). ISSN 0119-1144
Manh, N. V. Dung, N. N. Hung, B. Merz, and H. Apel (2014). Large-scale suspended sediment transport and sediment deposition in the Mekong Delta, Hydrol. Earth Syst. Sci., 18, 3033–3053,
2014
MARD (2005). Mekong Delta suffers drought damages of US$42 million. Press release by the Ministry
of Agriculture and Rural Development, Viet Nam, 18 May 2005
Milliman JD, Meade RH. (1983). World-wide delivery of river sediment to the oceans, Journal of
Geology 91: 1–21
MDP (2011). Towards a Mekong Delta Plan, Vietnam-Netherlands Co-operation, Water Sector
Synthesis, Hanoi, Vietnam
MDP (2013). Mekong Delta Plan, Vietnam-Netherlands Co-operation, Water Sector Synthesis, Hanoi,
Vietnam, February 2013
MRC (2005). Overview of the Hydrology of the Mekong Basin, Mekong River Commission, Vientiane,
November, 2005. 73pp.
MRC (2009). MRC Management Information booklet series No. 2, Mekong River Commission,
Vientiane, April 2005
MRC. (2010). State of the Basin Report. Vientiane, Laos: Mekong River Commission.
MRC. (2011). Basin Development Plan Programme Phase 2, Vientiane, Laos: Mekong River
Commission
Nguyen, H. McApline, C. Pullar, D. Johansen, K. Duke, NC. (2013). The relationship of spatial-
temporal changes in fringe mangrove extent and adjacent landuse: Case study of Kien Giang coast, Vietnam, Ocean & Coastal Management 76, pp 12-22.
Nguyen, TK. Fisher, T. (2014). Efficiency analysis and the effect of pollution on the shrimp farms in
the Mekong River Delta, Aquaculture Economics and Management, November 2014
Nguyen, V.L., Ta, T.K.O. and Tateishi, M., (1997). Late Holocene depositional environments and coastal evolution of the Mekong River Delta, southern Vietnam, In: Yonekura, N. and Kayanne, H.
(Eds), Program and abstracts, International symposium on Quaternary environmental change in the
Asia and Western Pacific Region, October 14-17, Univ of Tokyo, Japan. 68.
Nguyen, V. L., Ta, T. K., & Tateishi, M. (2000). Late Holocene depositional environments and coastal
evolution of the Mekong River Delta, Southern Vietnam. Journal of Asian Earth Science , 427-439.
Nhan, D.K. (2015). Farming system and socio-economic analysis for the Mekong Delta, An internal
technical report of CLUES project.
Nhan, D.K., Be, N.V., Trung, N.H., (2007). Water use and competition in the Mekong Delta, In: Be,
T.T., Sinh, B.T., Miller, F. (eds), Challenges to sustainable development in the Mekong delta: regional
and national policy issues and research needs. Summernet, 143-188.
Nhan, D.K., Binh, N.T., Tri, V.P.D. (2012). Water competition and conflicts in the Mekong Delta of Vietnam, Technical report submitted to the World Bank in Vietnam.

175
Phuc, D. D. (2008). General on Groundwater Resources, Department of Water Resources Management.
Hanoi: Water Sector Review Project
Saito, Y., Chaimanee, N., Jarupongsakul, T., & Syvitski, J. (2007). Shrinking megadeltas in Asia: Sea-level rise and sediment reduction impacts from case study of the Chao Phraya Delta. LOICZ.
Syvitski, J. P., Kettner, A. J., Overeem, I., Hutton, E. W., Hannon, M. T., Brakenridge, R., et al. (2009).
Sinking deltas due to human activities. Nature Geoscience , 2, 681-686.
Szczucinski, W., Jagodzinski, R., Hanebuth, T. J., Stattegger, K., Wetzel, A., Mitrega, M., et al. (2013).
Modern sedimentation and sediment dispersal pattern on the continental shelf off the Mekong River
delta, South China Sea. Global and Planetary Change , 110, 195-213.
Ta, T. K., Nguyen, V. L., Tateishi, M., Kobayashi, I., & Saito, Y. (2001). Sedimentary facies, diatom
and foraminifer assemblages in a late Pleistocene–Holocene incised-valley sequence from the Mekong River Delta, Bentre Province, Southern Vietnam: the BT2 core. Journal of Asian Earth
Sciences , 20, 83-94.
Ta, T. K., Nguyen, V. L., Tateishi, M., Kobayashi, I., Saito, Y., & Nakamura, T. (2002). Sediment facies and Late Holocene progradation of the Mekong River Delta in Bentre Province, southern Vietnam: an example of evolution from a tide-dominated to a tide- and wave-dominated delta. Sedimentary
Geology , 152, 313-325.
Thinh P.T (2003). Findings from wetlands classification and inventory wetlands/aquatic ecosystem in the Mekong Basin in Vietnam. Environment Programme: Mekong River Commission.
Toan, P.V. , Sebesvari, Z., Bläsing, M., Rosendahl, I., Renaud, F.G. (2013). Pesticide management and their residues in sediments and surface and drinking water in the Mekong Delta, Vietnam. Science of
the Total Environment 452-453, 28 –39.
Tri, V.P.D., Trung, N.H., Tuu, N.T. (2011). Flow dynamics in the Long Xuyen Quadrangle under the impacts of full-dyke systems and sea level rise, VNU Journal of Science, Earth Sciences 28, 205-214.
Tuyet L. Cosslett, Patrick D. Cosslett (2014). Water Resources and Food Security in the Vietnam
Mekong Delta. ISBN 978-3-319-02197-3. ISBN 978-3-319-02190-0 (eBook).
Ut, T.T. (2004). Land and Water Resource Management in Coastal Areas: Assessing the Socio-Economic Impact of Government Intervention, Bac Lieu province, Mekong Delta, Vietnam, Working
Paper Series No.1. Regional Center for Social Science and Sustainable Development (RCSD) Faculty
of Social Sciences, Chiang Mai University, Thailand
Viet Nam Environment Protection Agency (2005). Overview of Wetlands Status in Viet Nam Following 15 Years of Ramsar Convention Implementation, Hanoi, Viet Nam. 72 pp.
Viet Nam - Netherlands Strategic Partnership Arrangement. (2013). Mekong Delta Plan.
Vo, K.T., Pham, D.N. (2005). Study on the management and operation of large-scale surface irrigation systems in the Mekong Delta, Vietnam (the case study in Go Cong Irrigation System), In: Proceedings
of the 1st international symposium on sustainable development in the Mekong River Basin, 143–151
Voss, M. D., Bomar, N., Loick, N., & Dippner, J. (2006). Riverine influence on nitrogen fixation in the
upwelling region off Vietnam, South China Sea. Geophysical Research Letters , 33.
Wagner, F., Tran, V. B., & Renaudk, F. B. (2012). Groundwater resources in the Mekong Delta:
availability, utilization and risks. In F. G. Renaud, & C. Kuenzer (Eds.). Springer.
Walling D.E., 2005. Evaluation and analysis of sediment data from the Lower Mekong River,
Unpublished report for the Mekong River Commission, 61 p.
Wyatt, A. B., Phuong, N. T., & Gian, T. P. (2012). Vietnam Situation Analysis. Hanoi, Vietnam: IUCN.
Xue Z., iu J.P, DeMaster D, Lap N.V, Oanh T.T.K, (2009). Late Holocene Evolution of the Mekong
Subaqueous Delta, Southern Vietnam. Marine Geology 269 (2010) 46–60. Elsivier.
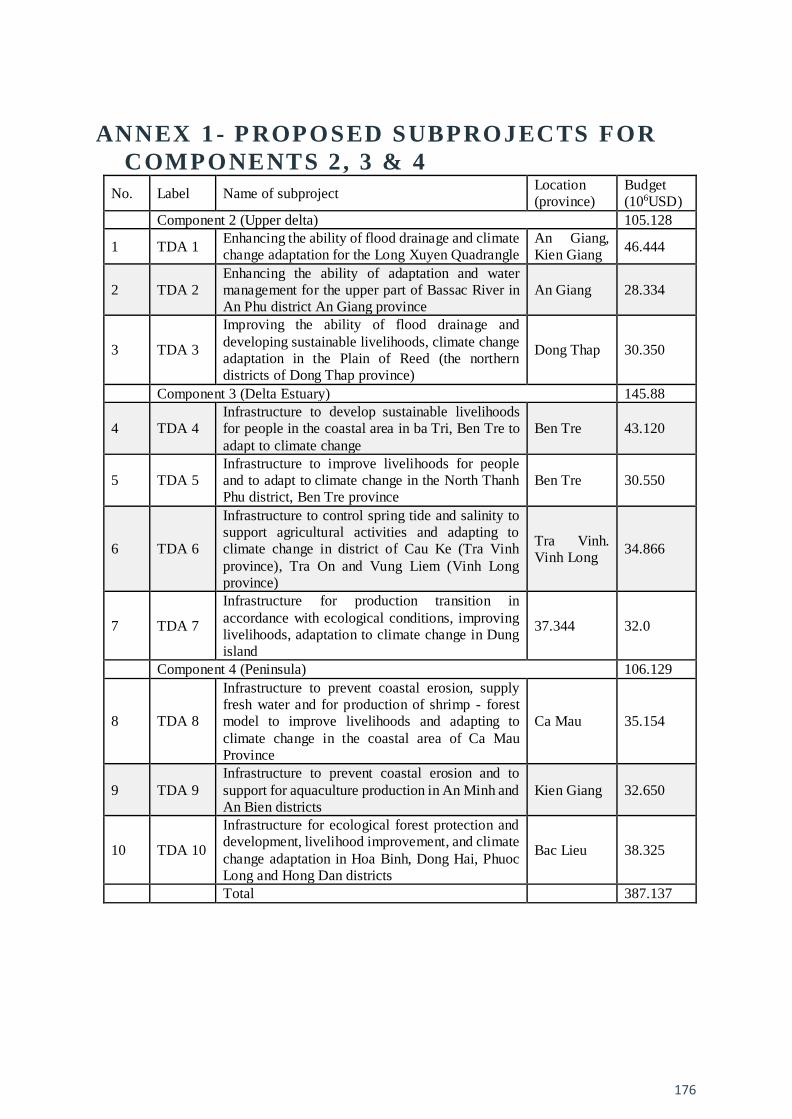
176
ANNEX 1- P ROPOSED SUBPROJECTS FOR
COMPONENTS 2 , 3 & 4 No. Label Name of subproject
Location
(province)
Budget
(106USD)
Component 2 (Upper delta) 105.128
1 TDA 1 Enhancing the ability of flood drainage and climate
change adaptation for the Long Xuyen Quadrangle
An Giang,
Kien Giang 46.444
2 TDA 2
Enhancing the ability of adaptation and water
management for the upper part of Bassac River in
An Phu district An Giang province
An Giang 28.334
3 TDA 3
Improving the ability of flood drainage and
developing sustainable livelihoods, climate change
adaptation in the Plain of Reed (the northern
districts of Dong Thap province)
Dong Thap 30.350
Component 3 (Delta Estuary) 145.88
4 TDA 4
Infrastructure to develop sustainable livelihoods
for people in the coastal area in ba Tri, Ben Tre to
adapt to climate change
Ben Tre 43.120
5 TDA 5
Infrastructure to improve livelihoods for people
and to adapt to climate change in the North Thanh
Phu district, Ben Tre province
Ben Tre 30.550
6 TDA 6
Infrastructure to control spring tide and salinity to
support agricultural activities and adapting to
climate change in district of Cau Ke (Tra Vinh
province), Tra On and Vung Liem (Vinh Long
province)
Tra Vinh.
Vinh Long 34.866
7 TDA 7
Infrastructure for production transition in
accordance with ecological conditions, improving livelihoods, adaptation to climate change in Dung
island
37.344 32.0
Component 4 (Peninsula) 106.129
8 TDA 8
Infrastructure to prevent coastal erosion, supply
fresh water and for production of shrimp - forest
model to improve livelihoods and adapting to
climate change in the coastal area of Ca Mau
Province
Ca Mau 35.154
9 TDA 9
Infrastructure to prevent coastal erosion and to
support for aquaculture production in An Minh and
An Bien districts
Kien Giang 32.650
10 TDA 10
Infrastructure for ecological forest protection and
development, livelihood improvement, and climate
change adaptation in Hoa Binh, Dong Hai, Phuoc
Long and Hong Dan districts
Bac Lieu 38.325
Total 387.137
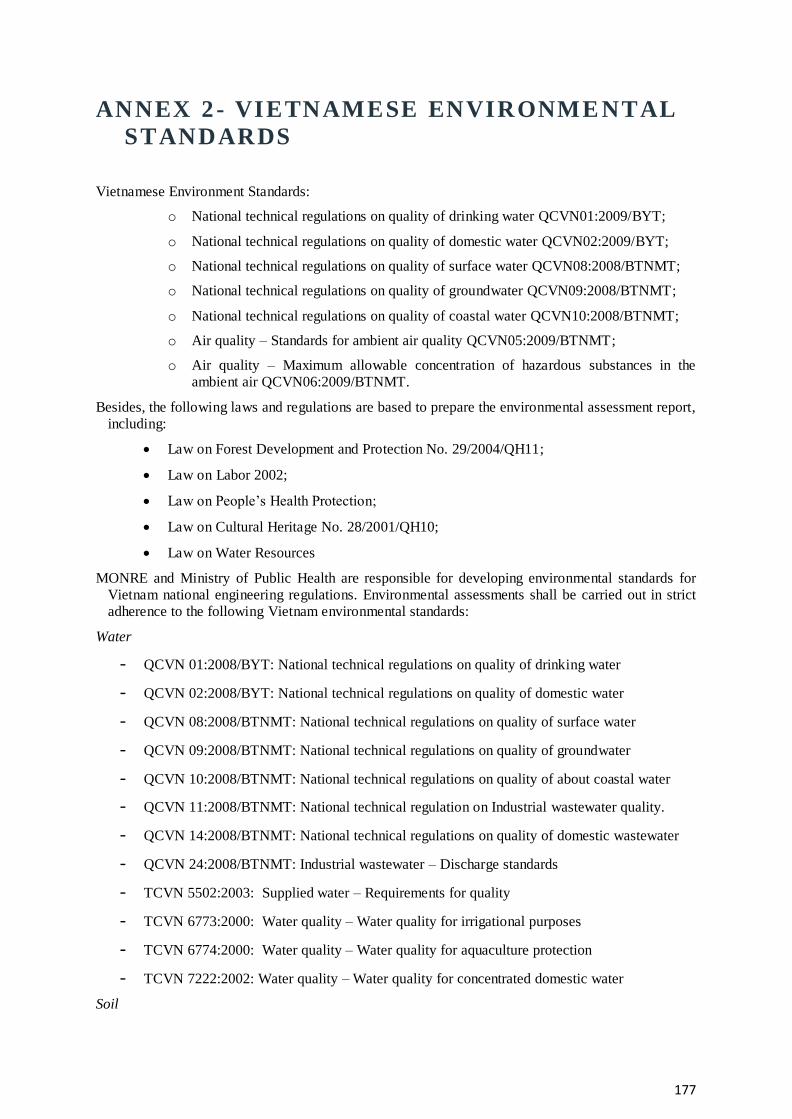
177
ANNEX 2- VIETNAMESE ENVIRONME NTAL
STANDARDS
Vietnamese Environment Standards:
o National technical regulations on quality of drinking water QCVN01:2009/BYT;
o National technical regulations on quality of domestic water QCVN02:2009/BYT;
o National technical regulations on quality of surface water QCVN08:2008/BTNMT;
o National technical regulations on quality of groundwater QCVN09:2008/BTNMT;
o National technical regulations on quality of coastal water QCVN10:2008/BTNMT;
o Air quality – Standards for ambient air quality QCVN05:2009/BTNMT;
o Air quality – Maximum allowable concentration of hazardous substances in the
ambient air QCVN06:2009/BTNMT.
Besides, the following laws and regulations are based to prepare the environmental assessment report,
including:
Law on Forest Development and Protection No. 29/2004/QH11;
Law on Labor 2002;
Law on People’s Health Protection;
Law on Cultural Heritage No. 28/2001/QH10;
Law on Water Resources
MONRE and Ministry of Public Health are responsible for developing environmental standards for
Vietnam national engineering regulations. Environmental assessments shall be carried out in strict
adherence to the following Vietnam environmental standards:
Water
- QCVN 01:2008/BYT: National technical regulations on quality of drinking water
- QCVN 02:2008/BYT: National technical regulations on quality of domestic water
- QCVN 08:2008/BTNMT: National technical regulations on quality of surface water
- QCVN 09:2008/BTNMT: National technical regulations on quality of groundwater
- QCVN 10:2008/BTNMT: National technical regulations on quality of about coastal water
- QCVN 11:2008/BTNMT: National technical regulation on Industrial wastewater quality.
- QCVN 14:2008/BTNMT: National technical regulations on quality of domestic wastewater
- QCVN 24:2008/BTNMT: Industrial wastewater – Discharge standards
- TCVN 5502:2003: Supplied water – Requirements for quality
- TCVN 6773:2000: Water quality – Water quality for irrigational purposes
- TCVN 6774:2000: Water quality – Water quality for aquaculture protection
- TCVN 7222:2002: Water quality – Water quality for concentrated domestic water
Soil

178
- QCVN 03:2008/BTNMT – National technical regulation on the allowable limits of heavy
metals in the soils;
- QCVN 15:2008/BTNMT: National technical regulation on pesticide existence in soil.
- Decision No.27/2004/QĐ - BXD dated on 09-11-2004 by the Minister of Ministry of
Construction on the promulgation of TCXDVN 320:2004 "Landfill for hazardous waste –
Design standards"
Atmosphere
- QCVN 05:2008: Air quality – Standards for ambient air quality
- QCVN 06:2008: Air quality – Maximum allowable concentration of hazardous substances in
the ambient air.
- QCVN 07:2008: Air quality – Thresholds of hazardous substances in the air.
- TCVN 6438:2001: Road vehicles – Maximum permitted emission limits of exhausted gases
- Solid waste management
- TCVN 6438:2001 - Road vehicles - Maximum permitted emission limits of exhaust.
- TCVN 6696:2009: Solid waste - Sanitary landfill. General requirements for environmental
protection.
- QCVN 07:2009: National technical regulations for classification of hazardous wastes
- QCVN 25:2009: National technical regulations for wastewater of solid waste sites
Vibration and Noise
- QCVN 27:2010/BTNMT – National technical regulation on Vibration (replace TCVN
6962:2001 - Vibration emitted by construction works and factories - Maximum permitted levels
in the environment of public and residential areas;
- QCVN 26:2010/BTNMT – National technical regulation on Noise (replace TCVN 5948:1999
Acoustics - Noise caused by transportation means when speeding - Allowable level)
- TCVN 5949:1998 Acoustics - Noise in public and residential areas - Allowable level
Labor Health and Safety
- Decision No.3733/2002/QĐ-BYT dated 10/10/2002 by Ministry of Healthcare on the
application of 21 Labor health and safety standards concerning microclimate, noise, vibration,
Chemicals – Permitted level in the working environment.
Recommended