Effect of Selenium Supplementation from Various Dietary Sources on the Antioxidant and Selenium
Status of Dairy Cows and Trace Element Status in Dairy Herds
D i s s e r t a t i o n
zur Erlangung des akademischen Grades doctor rerum agriculturarum
(Dr. rer. agr.)
eingereicht an der Landwirtschaftlich-Gärtnerischen Fakultät der Humboldt-Universität zu Berlin von Salman Saeed, M.Sc (Hons.) Animal Nutrition aus Pakistan (geboren am 05.11.1974, Lahore)
Präsident
der Humboldt-Universität zu Berlin
Prof. Dr. Dr. h.c. Christoph Markschies
Dekan der
Landwirtschaftlich-Gärtnerischen Fakultät
Prof. Dr. Dr. h.c. Otto Kaufmann
Gutachter: 1. PD Dr. Helmut Schafft
2. Prof. Dr. Jürgen Zentek
Tag der mündlichen Prüfung: 08. 03. 2010

2
In the sweet memories of my loving brother
Abul’Aala Sultan Saeed (May Allah shower His blessings upon him)
who always inspired me towards higher ideals in life

3
ACKNOWLEDGEMENT
All praises be to Allah Almighty who bestowed upon me His uncountable and
immeasurable blessings. And peace be upon His noble messengers, the last of
whom was Prophet Muhammad (SAW), who brought the light of knowledge and
wisdom to the mankind.
Firstly, I am grateful to Dr. Claudia Kijora and Prof. Dr. Ortwin Simon, Director of the
Institute of Animal Nutrition FU, for their kind guidance towards my acceptance as
PhD student. I am heartily thankful to my supervisor, Prof. Dr. Jürgen Zentek, whose
encouragement, guidance and support from the initial to the final level enabled me to
develop an understanding of the subject. I owe my deepest gratitude to Dr. Helmut
Schafft, for co-supervising my project and for especially giving his valuable
suggestions during the process of thesis writing and final submission. This project
would not have been possible without the sincere and kind cooperation extended by
Dr. Monika Lahrssen-Wiederholt, Prof. Dr. Howard Hulan, Dr. Annabella Khol-
Parisini, Mrs. Heide-Marie Lochotzke and many friendly and supportive workers
taking care of the dairy facility at the Bundesinstitut für Risikobewertung (BfR). I owe
my special thanks to Dr. Klaus Schäfer and Dr. Matthias Schreiner, Department of
Food Science and Technology, Universität für Bodenkultur (BOKU), Vienna, for the
valuable guidance and help in establishing the analytical methods. I am indebted to
Prof. Dr. Klaus Männer and Dr. Wilfried Vahjen for their kind help during the whole of
my stay at the institute.
I would like to thank my colleagues Anett Kriesten, Daniela Dinse, Petra Huck, Marita
Eitinger and Sybille Weinholz who have always been there to help me in the labs
whenever I needed. The limitation of space on this page bars me to mention the

4
names; however, I can’t forget the friendly environment offered by all other
colleagues in the institute of animal nutrition.
It would have a dream to complete my studies abroad without the devout prayers of
my parents, family, brother and sisters. Particularly, I feel myself greatly indebted to
my wife and my only son for their support in the form of patience, love and care they
offered to me and the whole family and how they kept the gap of my absence at
home filled.
Lastly, I offer my regards to all of those who supported me in any respect during the
completion of my studies. My friends Hafiz Zahid, Ahsanullah, Hafiz Haroon, Abdul
Jabbar, Usman, Husnain, Rizwan ul Haq, Qasim Mushtaq, Sulaiman Khan, Dr. Abid
Riaz, Adeel Zaffar, Ilyas Sadiq, Shahid Qureshi, Imtiaz Rabbani, Sultan, Haroon-ur-
Rasheed, Imran Gul, Waqas Latif and many others made it possible for me to feel “at
home” in Germany. I am also obliged to Higher Education Commission (HEC) of
Pakistan and German Academic Exchange Service (DAAD) for granting me the
scholarship and my home institution for the study leave. The grant provided by the
Sächsisches Landesamt für Umwelt, Landwirtschaft und Geologie for the survey part
of this work and cooperation from Dr. Olaf Steinhöfel and Mrs. Fröhlich is also highly
acknowledged.
Thanks a lot to all of you!
Salman Saeed
December 18, 2009

5
TABLE OF CONTENTS
LIST OF TABLES ................................................................................................................................................. I�
LIST OF FIGURES .............................................................................................................................................. II�
ABBREVIATIONS ............................................................................................................................................. III�
ZUSAMMENFASSUNG ...................................................................................................................................... V�
ABSTRACT ...................................................................................................................................................... VIII�
1.� INTRODUCTION ......................................................................................................................................... 1�
2.� REVIEW OF LITERATURE ....................................................................................................................... 3�
2.1� SELENIUM: FROM TOXICITY TO ESSENTIALITY .................................................................................... 3�2.2� SELENIUM AND MECHANISM OF OXIDATIVE STRESS .......................................................................... 4�2.3� METABOLISM OF SELENIUM IN MAMMALS ........................................................................................... 7�2.4� SELENIUM NUTRITION OF DAIRY COWS .............................................................................................. 9�2.5� BIOMARKERS FOR SELENIUM STATUS............................................................................................... 10�2.6� SOMATIC CELL COUNT AND SELENIUM STATUS ............................................................................... 13�2.7� MASTITIS SUSCEPTIBILITY AND SELENIUM STATUS .......................................................................... 14�2.8� MAMMARY GLAND IMMUNE SYSTEM – INTERACTIONS WITH SELENIUM ........................................... 15�
2.8.1� Physical Barriers ......................................................................................................................... 16�2.8.2� Cellular Factors ........................................................................................................................... 16�2.8.3� Soluble Factors ........................................................................................................................... 23�
2.9� CONCLUDING REMARKS .................................................................................................................... 28�
3.� MATERIALS AND METHODS ................................................................................................................ 29�
3.1� FEEDS AND ANIMALS ......................................................................................................................... 29�3.2� SAMPLING .......................................................................................................................................... 31�3.3� CHEMICALS AND INSTRUMENTS ......................................................................................................... 31�3.4� ESTIMATION OF SELENIUM ................................................................................................................ 31�3.5� ESTIMATION OF ANTIOXIDANT ACTIVITY ............................................................................................ 32�3.6� STATISTICAL ANALYSIS ...................................................................................................................... 32�
4.� RESULTS ................................................................................................................................................... 33�
4.1� COLOSTRUM AND MILK SELENIUM STATUS ...................................................................................... 33�4.2� MILK TROLOX EQUIVALENT ANTIOXIDANT CAPACITY (TEAC) ......................................................... 34�4.3� MILK PRODUCTION ............................................................................................................................. 35�4.4� SERUM SELENIUM IN COWS .............................................................................................................. 36�4.5� SERUM SELENIUM LEVEL IN CALVES ................................................................................................ 37�4.6� BODY MASS OF CALVES .................................................................................................................... 38�4.7� SERUM TEAC IN COWS..................................................................................................................... 39�4.8� SERUM TEAC IN CALVES .................................................................................................................. 40�
5.� DISCUSSION ............................................................................................................................................. 42�
5.1� COLOSTRUM AND MILK SELENIUM STATUS ...................................................................................... 42�5.2� TOTAL ANTIOXIDANT CAPACITY IN MILK ............................................................................................ 44�5.3� MILK SELENIUM AND TEAC RELATIONSHIP ...................................................................................... 45�5.4� MILK PRODUCTION ............................................................................................................................. 46�5.5� SERUM SELENIUM CONTENT IN COWS .............................................................................................. 47�5.6� SELENIUM TRANSFER FROM COWS TO CALVES ............................................................................... 48�5.7� SERUM TROLOX EQUIVALENT ANTIOXIDANT CAPACITY (TEAC) IN COWS ...................................... 49�5.8� SERUM TEAC IN CALVES .................................................................................................................. 51�
6.� TRACE ELEMENT STATUS IN LARGE DAIRY HERDS ................................................................... 52�
6.1� INTRODUCTION ................................................................................................................................... 52�6.2� FARMS, ANIMALS AND SAMPLING ...................................................................................................... 53�6.3� STATISTICAL ANALYSIS ...................................................................................................................... 54�6.4� RESULTS AND DISCUSSION ............................................................................................................... 54�

6
7.� CONCLUSION ........................................................................................................................................... 65�
8. REFERENCES ................................................................................................................................................. 66�
APPENDIX 1 DATA ON FEEDING TRIAL WITH DAIRY COWS CONDUCTED AT BFR ..................... 83�
APPENDIX 2 SAXONIAN DAIRY HERDS DATA – FEED COMPOSITION ............................................. 85�
APPENDIX 3 SAXONIAN DAIRY HERDS DATA – TRACE ELEMENTS, HEALTH AND PRODUCTION PARAMETERS ........................................................................................................................ 91�

i
LIST OF TABLES
Table 1 Dairy cattle immune responses as affected by selenium ............................ 26�
Table 2 Bovine udder health and mastitis susceptibility as affected by selenium .. 27�
Table 3 Composition of total mixed ration (TMR) fed as basal diet during the
feeding trial ..................................................................................................... 30�
Table 4 Mineral composition (DM basis) of total mixed ration (TMR) fed as basal
diet during the feeding trial (n=3) ................................................................... 30�
Table 5 Milk and nutrients yield in different treatment groups during the feeding
trial .................................................................................................................. 36�
Table 6 Health status of experimental cows during feeding trial ............................ 36�
Table 7 Body mass (kg) of cows and calves in various treatment groups .............. 39�
Table 8 Regression equations describing the relationship between milk TEAC and
selenium levels in various treatment groups ................................................... 46�
Table 9 Regression equations describing the relationship between calves and dams
serum selenium levels in various treatment groups ........................................ 49�
Table 10 Regression equations describing the relationship between serum selenium
and TEAC in dams .......................................................................................... 50�
Table 11 Descriptive summary of feed composition (DM basis) data collected from
11 different farms in Saxonia (Germany) ....................................................... 55�
Table 12 Component matrix resulted from the principal component analysis of feed
data of 11 dairy herds ...................................................................................... 56�
Table 13 Descriptive summaries of various parameters measured in samples
collected from 11 different farms in Saxonia (Germany) ............................... 58�
Table 14 Pearson correlation matrix for various trace elements in liver tissues ..... 59�
Table 15 Regression equations describing relationship between feed and liver
tissues concentrations of various trace elements ............................................. 63�
Table 16 Multiple linear regression models describing the relationship among liver
trace elements (dependent) and feed composition (independent) ................... 63�
Table 17 Multiple linear regression models describing the relationship among liver
trace elements and various parameters of herd performance .......................... 64�
ii
LIST OF FIGURES
Figure 1 The redox states of oxygen with standard reduction potential (volts). ................ 5�
Figure 2 Selenium incorporation in proteins (Suzuki 2005) .............................................. 9�
Figure 3 Selenium metabolism in mammals (Suzuki 2005) .............................................. 9�
Figure 4 Chemical structure of ABTS molecule .............................................................. 32�
Figure 5 Colostrum and milk selenium concentrations in various treatment groups. ...... 34�
Figure 6 Milk TEAC values at various lactation stages in different groups. ................... 35�
Figure 7 Serum selenium concentrations of dams in different groups during various
physiological stages. ................................................................................................. 37�
Figure 8 Serum selenium concentrations of calves borne to dams in different treatment
groups. ...................................................................................................................... 38�
Figure 9 Differences in body mass of calves at various time points ................................ 39�
Figure 10 Serum TEAC values in cows of various treatment groups. ............................. 40�
Figure 11 Serum TEAC in calves of various treatment groups. ...................................... 41�
Figure 12 Overall milk selenium and TEAC regression model. ...................................... 46�
Figure 13 Regression model describing the relationship between dams and calves serum
selenium levels. ........................................................................................................ 48�
Figure 14 Regression model describing the relationship between serum selenium and
TEAC in dams. ......................................................................................................... 50�
Figure 15 Regression model describing the relationship between calves’ serum selenium
and TEAC values. .................................................................................................... 51�
Figure 16 Trace elements results measured compared to a standard ............................... 54�
Figure 17 Screeplot diagram of the feed components ...................................................... 57�
Figure 18 Feed and liver selenium relationship in Saxonian dairy farms ........................ 60�
Figure 19 Feed and liver zinc relationship in Saxonian dairy farms ................................ 61�
Figure 20 Feed and liver copper relationship in Saxonian dairy farms ........................... 61�
Figure 21 Feed and liver iron relationship in Saxonian dairy farms ................................ 62�
Figure 22 Feed and liver manganese relationship in Saxonian dairy farms ..................... 62�

iii
ABBREVIATIONS ADF Acid detergent fiber
DTNB 5,5´-dithio-bis(2-nitrobenzoic acid)
EDTA Ethylene-diamine-tetraacetic acid
FRAP Ferric reducing ability of plasma
GSH Reduced glutathione
GSHPx Glutathione Peroxidase
GSSG Glutathione disulfide
KS Kolmogorov-Smirnov
NADPH Nicotinamide adenine di nucleotide phosphate
NDF Neutral detergent fibre
NK Natural killer
ORAC Oxygen radical absorption capacity
RNS Reactive nitrogen species
ROS Reactive oxygen species
SEM Standard error of mean
SeY Selenium yeast
SeI Selenium inorganic (sodium selenite)
TEAC Trolox equivalent antioxidant capacity
TMR Total mixed ration
TRAP Total peroxyl radical trapping parameter
TROLOX 6-hydroxy-2, 5, 7, 8-tetramethychroman-2-carboxylic acid

iv
Reactive Species
H2O2 Hydrogen peroxide
-OH Hydroxyl radical
NO Nitric oxide
ONOO- Peroxynitrite
O2- Superoxide radical anion
Amino Acid Codes
Asp Aspartate
Cys Cyteine
Glu Glutamate
Met Methionine
SeMet Selenomethionine
SeCyS Selenocysteine
Val Valine

v
ZUSAMMENFASSUNG
Einleitung: Selen (Se) ist ein essenzielles Spurenelement in der Ernährung von
Mensch und Tier. In der Tierernährung wird Milchkühen Selen über das Futter
supplementiert, um einerseits die Tiere vor einem Mangel zu schützen und
andererseits, um die Menge an Selen zu erhöhen, die aus dem Futter in die Milch
übergeht. Mit einer fütterungsbedingten Anreicherung von Selen in der Milch eröffnen
sich Möglichkeiten einer verbesserten Selenversorgung sowohl der Kälber als auch
die Selenversorgung der Bevölkerung über den Konsum von Milch und
Milchprodukten. Fragen der Qualität der erzeugten Milch und der daraus
hergestellten Milchprodukte sowie Fragen der Lebensmittelsicherheit insgesamt
haben dabei im Vordergrund der Betrachtungen zu stehen. Erreicht werden können
diese Ziele nur dann, wenn eine hinreichende Balance zwischen Pro- und
Antioxidantien bei der Nährstoffzufuhr gegeben ist. Selen kann durch seine
biologische Rolle bei der genetischen Kodierung von Selenocystein (SeCys),
welches als Bestandteil von Selenoproteinen vorkommt, als Antioxidations wirken.
Ziel der Arbeit war herauszufinden, ob ein erwarteter Anstieg der Selenkonzentration
in der Milch als Folge der Supplementierung der Futterrationen von Kühen mit
Selenhefe mit einer Verbesserung des Status hinsichtlich der antioxidativen
Kapazität sowie der Immunfunktionen bei den Milchkühen in der frühen Laktation
verbunden ist. Es galt die Arbeitshypothese zu testen, nach der ein verbesserter
Selenstatus der Milch auch zu einer Steigerung der Gesamtleistung der
Antioxidantien beiträgt.
Material und Methoden: 16 Holstein-Friesian-Kühe erhielten drei unterschiedliche
Futterrationen während des Zeitraums von sechs Wochen vor der Kalbung bis 15
Wochen post partum. Die tierexperimentellen Untersuchungen wurden durchgeführt
auf dem Versuchsgut des Bundesinstitutes für Risikobewertung (BfR) in Berlin. Die
Tiere der Kontrollgruppe (n = 5) erhielten dabei eine Basisration (verfüttert als Totale
Mischration, TMR) mit einem mittleren Selengehalt von ~ 0.2 mg/kg
Trockensubstanz, welches ausschließlich aus den Rationskomponenten stammte.
Die Tiere der Versuchsgruppen erhielten die Basisration, allerdings supplementiert
einerseits mit Natrium-Selenit (SeI) (n = 5) und andererseits mit Selenhefe (SeY) (n =
6), was zu mittleren Selengehalten in der TMR von 0,4 mg/kg TS bzw. 0,6 mg/kg TS

vi
führte. Die Selensupplemente wurden individuell täglich jeweils vor dem Melken in
Form von 20 bzw. 30 Gramm einer selenhaltigen Vormischung den Kühen
verabreicht. Milch- und Serumproben wurden genommen am ersten Tag nach der
Kalbung sowie in der 9., 12. und 15. Woche der Laktation. Die Selengehalte wurden
ermittelt auf Basis der Hydrid-Atomabsorptionsspektrophotometrie, die Bestimmung
der antioxidativen Kapazität (TEAC) erfolgte nach der Methode von Miller et al.
(1996), adaptiert für ein Mikroplattenphotometer. Weiterhin wurde eine Untersuchung
zum Spurenelementstatus in 11 großen Milchviehbetrieben in Sachsen durchgeführt,
um den Spurenelementstatus anhand von Futter-, Blut- und Leberbioptatproben zu
bestimmen.
Ergebnisse: Die mittleren Gehalte an Selen (± SEM) im Kolostrum der Tiere der
Kontrollgruppe bzw. derjenigen Tiere, deren Futterration mit Natriumselenit (SeI)
bzw. Selenhefe (SeY) supplementiert waren, beliefen sich auf 35,3 ± 1,03 μg/l, 39,1
± 2,56 μg/l bzw. 67,7 ± 4,11 μg/l. Die Selengehalte im Kolostrum der Tiere der
Gruppe SeY unterschieden sich dabei (P < 0.01) von denjenigen der Tiere der
beiden anderen Gruppen. Ebenso unterschieden sich aus die mittleren
Konzentrationen an Selen in der Milch (± SEM) signifikant (P < 0.01) bei den Tieren,
deren Ration mit Selenhefe supplementiert waren: 11,6 ± 1,55 μg/l (Kontrolle), 15,4 ±
3,24 μg/l (SeI) und 28,3 ± 6,84 μg/l (SeY). Die Selengehalte in der Milch der Tiere
der Kontrollgruppe und diejenigen der Kühe der Na-Selenit-Gruppe wiesen keine
statistisch gesicherten Unterschiede auf (P > 0.05), jedoch zeigte sich bei den Tieren
der Natriumselenit-Gruppe eine Erhöhung der mittleren Gehaltswerte um relativ 32%.
Die TEAC-Werte für die Tiere der SeY-Gruppe unterschieden sich in allen drei
Prüfzeiträumen (P < 0.01) sowohl von denjenigen der Tiere der Kontroll- sowie
denen der SeI-Gruppe. Insgesamt zeigten sich geringgradige Unterschiede in den
Gehaltswerten der Milch in Abhängigkeit vom Laktationsstadium. So beliefen sich die
über die Beobachtungszeiträume gemittelten Milch-TEAC-Werte (mittlere Gehalte
über den gesamten Versuchszeitraum ± SEM) auf 586 ± 0,95 μMol/l, 557 ± 0,97
μMol/l sowie 540 ± 0,64 μMol/l für die Tiere der SeY-Gruppe, der SeI-Gruppe bzw.
der Kontrolltiere. Mit Blick auf die Gehaltswerte an Selen im Serum zeigten sich
ähnlich Tendenzen wie bei den TEAC-Werten. Die Untersuchung des
Spurenelementstatus von Milchkühen zeigte eine erhebliche Variabilität bei den
Futterproben innerhalb und zwischen den Betrieben, die durch die tierbezogenen
Proben (Plasma, Leber) nicht entsprechend reflektiert wurden. Die mittleren (± SEM)

vii
Gehalte von Selen, Kupfer, Zink, Mangan und Eisen in den Leberbiopsien betrugen
0.7 (± 0.04), 134.6 (± 6.81), 18.3 (± 0.9), 7.2 (± 0.71) und 89.2 (± 6.35) mg/kg.
Schlussfolgerung: Beim Einsatz von Selenhefe in der Fütterung von Milchkühen
scheint ein Anstieg der antioxidativen Kapazität sowohl der Rindermilch als auch des
Serums hervorgerufen zu werden. Weitere Studien sind angezeigt, um die
Mechanismen aufzuklären, denen diese Effekte unterliegen.
Die Praxisstudie zeigte, dass viele Rationen für Milchkühe mehr Spurenelemente
enthalten als die gegenwärtig empfohlenen Werte. Zwischen den verschiedenen
Spurenelementen traten nach den Ergebnissen der Leberbiopsien Interaktionen auf,
deren Ursachen und Konsequenzen unter praktischen Bedingungen weiter
untersucht werden sollten.

viii
ABSTRACT Introduction: Selenium (Se) is an essential trace element for animal and human
nutrition. Dietary selenium supplementation of dairy cows is practised to protect the
animals from the risk of deficiency and to increase selenium transfer to the milk
consequently benefiting the offspring and vulnerable human populations as milk and
other dairy products make an important part of their diet. Milk quality and safety are
both important. It cannot be ensured unless a proper balance between pro and
antioxidant nutrients is maintained. Selenium, through its biological role by
genetically encoded selenocysteine (SeCyS) residue in selenoproteins, can act as an
antioxidant. The objective of this study was to find out whether the expected increase
in milk selenium levels after supplementing the dairy rations with organic selenium
yeast can affect the milk antioxidant status in the early lactating dairy cows. It was
presumed that milk total antioxidant capacity might be boosted by the enhanced milk
selenium status.
In addition to these experiments, a survey of the trace elements selenium, copper,
zinc, iron and manganese was conducted in large dairy herds of Saxonia to
determine their intake, bioavailability and interactions.
Materials and Methods: Sixteen Holstein-Friesian dairy cows were subjected to
three dietary treatment groups from 6 weeks before calving to 15 weeks of lactation
at the experimental station of the Bundesinstitut für Risikobewertung (BfR), Berlin,
Germany. The control group (n=5) was maintained exclusively on the basal total
mixed ration (TMR) containing ~ 0.2 mg/kg dietary DM selenium from the natural
sources whereas sodium selenite (SeI) group (n=5) and selenium yeast (SeY) group
(n=6) were supplemented with selenium at 0.4 mg/kg DM in the pre and 0.6 mg/kg
DM in the post partum rations respectively. Each cow received the supplement
individually in the form of 20 or 30 gram premix given before milking time. Samples
were collected at one day after calving and at 9th, 12th and 15th week of lactation.
Selenium content was analysed using the hydride generation atomic absorption
spectrometry whereas Trolox equivalent antioxidant capacity (TEAC) was measured
following the method of Miller et al. (1996) adapted for a microplate reader to
accommodate the large number of samples in duplicates.
For trace elements survey, representative TMR samples and blood and liver samples
from 11 selected farms were used to be analysed for trace element status.

ix
Results: The mean (± SEM) selenium level in colostrum for the control, SeI and SeY
groups was found to be 35.3 ± 1.03 μg/l, 39.1 ± 2.56 μg/l and 67.7 ± 4.1 μg/l
respectively in this study. Selenium yeast group was different (P < 0.01) from both
others. Average steady state milk (± SEM) selenium content was 11.6 ± 1.55, 15.4 ±
3.24 and 28.3 ± 6.84 μg/l for control, SeI and SeY groups respectively with SeY
group differing (P < 0.01) from other groups. Control and SeI groups were not
different (P > 0.05); however a relative increase of 32% was noted in SeI group. It
has been noted that TEAC values for the SeY group were significantly different (P <
0.01) from that of control and SeI groups at all time points. However, negligible
differences have been observed between different time points in all groups. Milk
TEAC values of (mean of all time points ± SEM) were 586 ± 0.95 μMol/l, 557 ± 0.97
μMol/l and 540 ± 0.64 μMol/l for the SeY, SeI and control groups respectively. Similar
trends in serum selenium and TEAC values have been noted. The investigation of
the trace element concentrations in the total mixed rations of dairy cows indicated a
huge variability within and between the farms that were not clearly reflected by the
plasma and liver samples taken from the animals.
The mean (± SEM) concentrations of selenium, copper, zinc, manganese and iron in
the fresh liver biopsy samples from Saxonian dairy herds were 0.7 (± 0.04), 134.6 (±
6.81), 18.3 (± 0.9), 7.2 (± 0.71) and 89.2 (± 6.35) mg/kg respectively.
Conclusion: This study reveals some sort of selenium-related increase in the total
antioxidant capacity of bovine milk and serum. This can have implications for the
health of the animals and public health concerns over milk safety. Further studies will
help delineate the actual underlying mechanisms. Survey findings revealed that
generally there is a trend of supplementing the dairy rations with trace elements
above the requirements. Positive and negative interactions among the trace
elements have been observed and will need further studies to explain effects under
practical conditions.


1
1. INTRODUCTION Efficient livestock and poultry production and the maintenance of normal health in
animals require that essential nutrients be provided in appropriate amounts and in
forms that are biologically utilizable. Deficiencies of certain nutrients occur in diets
consisting of common feed ingredients and this has led to the common practice
around the globe of supplementing the diets of farm animals with essential nutrients.
Degree of the bioavailability of the nutrients does not only influence the dietary
requirement but also the tolerance for a nutrient. Advances in the nutritional
technologies have resulted in the development of innovative products to be used as
animal feed supplements. These products must be designed to deliver the
incremental nutrients in a safe and economical way in the food chain. Among various
products used as animal feed supplements, amino acids, macro and micro minerals
and enzymes are most important and popular. The trace element selenium (Se) has
attracted substantial research efforts during the current and the last decade owing to
its special place in the animal and human nutrition. Its essentiality and the toxicity are
within narrow margins. Essentiality of this nutrient is based on its major role in the
antioxidant defence system of the living cells.
Apart from being naturally found as sodium selenate (Na2SeO4) and sodium selenite
(Na2SeO3), selenium can be incorporated biologically in proteins containing
methionine. Plants and yeast exposed to selenium salts accumulate the trace mineral
in the form of selenomethionine (Se-Met). Sodium selenite and selenium enriched
yeast are in common use as sources of selenium in farm animals. Although
substantial amount of work has been carried out in the field of selenium nutrition of
dairy cows, gaps still exist in the knowledge regarding comparative efficacy of
supplementation from various sources. Moreover, some work in this regard has been
done in Germany. It has been shown in several studies that dietary selenium yeast
significantly increases selenium concentrations in blood, milk and other tissues as
compared to inorganic selenium sources. Phenomenon of non-specific pooling of
selenomethionine from selenium yeast into tissue proteins instead of methionine is
accounted for this increase. However, Juniper et al. (2006), after conducting an
experiment with selenium supplementation in the range of 0.27-0.4 mg/kg DM with

2
selenium yeast, reported that only 25-33% of total milk selenium increase could be
attributed to selenomethionine and there are other selenoproteins in milk which might
play a role as an antioxidant. Hence, the present study investigates the effect of
selenium supplementation from sodium selenite and selenium yeast on the selenium
status and Trolox equivalent antioxidant capacity (TEAC) in pregnant and lactating
cows and their calves. It is hypothesized that increased selenium status in the
supplemented cows’ serum and milk will be reflected in the form of heightened
antioxidant status. No such attempt has been made previously to get information
regarding the effect of selenium from sodium selenite and selenium yeast on the total
antioxidant capacity in dairy cows. This study provides basic information on the topic
in addition to generate the data on selenium and revolves around the following
objectives:
Investigations into selenium and antioxidant status on various time points of
physiological importance during the periparturient and lactation stage
The assessment of selenium transfer into milk, risk assessment depending on the
dietary level and source of selenium
Selenium transfer to calves and its impact on their health and well-being
Studies into the intake, bioavailability and interactions among essential trace
elements in large dairy herds under practical conditions

3
2. REVIEW OF LITERATURE This chapter is based on the review article “The Role of Dietary Selenium in the
Bovine Mammary Gland Health and Immune Function” by Salman et al. (2009).
2.1 Selenium: From Toxicity to Essentiality
Selenium (Se, atomic number 34 and atomic weight 78.96) is placed in 4th period and
16th group of metalloids and non-metal chemical elements of the periodic table. Many
of its chemical properties (outer valence electronic configuration, atomic size, bond
energy, ionization potential and electronegativity) are similar to that of sulphur.
Selenium occurs in oxidation states –II (selenide), 0 (elemental selenium), +IV
(selenite) and +VI (selenate) forms. In isolated form, it is found like grey-black
metallic cluster.
Discovered by Jöns Jacob Berzelius in 1817, the semi-metal selenium was named
after the Greek Goddess of the moon, Selene (McKenzie et al. 1998). Dietary
importance of selenium dates back in history when it was first reported to cause the
toxic symptoms in the members of the caravan of the great adventurer, Marco Polo.
Livestock disorder, commonly referred as alkali disease or blind stagger, was found
endemic in areas with selenium rich soils. Similarly, symptoms of chronic selenium
intoxication, depression and fatigue, and loss of hair and nails, were noticed in
human beings living geographic in regions with high soil selenium before it was
known to be the causative agent. That is why early scientists showed interest in
selenium because of its toxic effects. However, the approach towards selenium
research in life sciences began to change as early as 1916 when selenium was
detected in normal human tissue samples. It was suggested “it may have a position
in the organism which will without doubt be of the utmost significance in the study of
life processes” (Gassmann 1916). The earliest evidence that selenium is involved in
the immune function was found in 1957 with the observation that dogs injected with 75Se incorporated the isotope into a leukocyte protein (now known to be the
cytoplasmic glutathione peroxidase cGSHPx) (Schwarz and Foltz 1957). In sheep
and humans, selenium is concentrated in tissues involved in the immune response
such as spleen, liver and lymph nodes (Spallholz 1990). The question how this trace

4
element exerts its biochemical role was solved when it was discovered in 1973 to be
the essential component of GSHPx and the cellular antioxidant defence system
(Rotruck et al. 1973). The subsequent discoveries in rats about the fact that two
thirds of the dietary selenium are not bound to this enzyme but are part of other
compounds (Behne and Wolters 1983) led to the assumption that other
selenoproteins may exist. Thus far 55 selenoproteins, including glutathione
peroxidases (1-6), thioredoxin reductases (1-3) and iodothyronine deiodinase
families of selenoenzymes have been reported. Consequently, dietary selenium
deficiency has been known to cause various ailments in a number of animal species
and humans. Keshan and Kashin-Beck diseases in humans, muscular dystrophy in
sheep and cattle and exudative diathesis in poultry are notable among selenium
deficiency disorders. This voyage of selenium from toxicity to essentiality is still in
progress with revelation of new discoveries and facts about selenium and its related
compounds and their role in diverse physiological functions of the body. The narrow
margin of safety (average dietary intake for selenium and the tolerable upper intake
level for both sexes has been reported by National Research Council (2001) as 113-
220 μg and 400 μg/day respectively for adult humans) is sufficient to stress its
importance in the diets.
2.2 Selenium and Mechanism of Oxidative Stress
Oxygen is the prerequisite of life and ultimate source of energy for its sustainability.
Animals, plants and many microorganisms rely on oxygen for efficient energy
production. In doing so, free radicals capable of initiating further chain reactions are
generated. These free radicals are capable of damaging the biologically relevant
molecules such as DNA, proteins, lipids and carbohydrates. Superoxide (O2-) is the
main free radical produced in biological systems during normal respiration in
mitochondria and by autooxidation reactions at 37°C. It is notable that superoxide, by
itself, is not extremely dangerous and does not rapidly cross the lipid membrane
bilayer. However, it is a precursor of other more powerful free radicals collectively
known as reactive oxygen species (ROS) and reactive nitrogen species (RNS). An
imbalance in the production and accumulation of these highly reactive oxygen
species (ROS) - activated derivatives of molecular oxygen, including singlet oxygen,
O2-, H2O2, hydroxyl radical, hypohalous acids and peroxynitrites - may lead to the
most inevitable of the biological problems, the oxidative stress, because it derives

5
from the least-specific type of reaction: univalent electron transfer which can occur if
the oxygen species come across with the redox cofactors at a lower potential than
themselves . Reactions of this type (Figure 1) are responsible both for the formation
of ROS and for their subsequent inactivation of various biomolecules. It has been
experimentally manifested in the E. coli devoid of cytoplasmic superoxide dismutase
(SOD) that these strains grew well anaerobically but exhibited a variety of aerobic
growth defects that derived from endogenous O2-. Similarly, E. coli
catalase/peroxidase mutants were poisoned by micromolar levels of H2O2 that
accumulated inside the cell (Park et al. 2005). Both sets of mutants exhibited
catabolic and biosynthetic defects that stem from the inactivation of a family of
dehydratases.
Figure 1 The standard concentration of oxygen was regarded as 1M. Abbreviations: H2O2, hydrogen peroxide; O2
-, superoxide (Imlay 2008)
The other best-understood mechanisms of oxidative injury involve the oxidation of
inactivation of exposed enzymic iron-sulphur clusters and the production of hydroxyl
radicals within proteins and on the surface of DNA (Imlay 2008). Superoxides can
also participate in the production of powerful radical ions by donating an electron and
thereby reducing. It is speculated that basic biochemistry of the oxidative damage is
likely shared by most cells, and most contemporary organisms have inherited from
their ancestors a common set of strategies by which to defend themselves.
Although much remains to be understood about how cellular defences against the
oxidative stress work, through its natural homeostatic balance the animal body must
be able to keep free radicals in control. Defensive tactics revealed thus far include
various free radical scavenger enzymes and isozymes for example superoxide
dismutase, catalases, peroxidases and repair mechanisms. Inability or loss of
oxidant-resistance strategies can be manifested in terms of many disease conditions
in man and animals.
Figure 1 The redox states of oxygen with standard reduction potential (volts).
6
The transition period and early lactation in dairy cows is critically important for health,
production and profitability (Drackley 1999). Dairy cows vigorous physiological
activities during periparturient period concerning the rapid differentiation of secretary
parenchyma, intense mammary gland growth and the onset of copious milk synthesis
and secretion are accompanied by high energy demand and increased oxygen
requirement . This increased oxygen demand can result in the augmented production
of ROS, which are potential source of the cells and tissues injury, commonly referred
as the oxidative stress leading to a high susceptibility of dairy cows to a variety of
infections and metabolic disorders during the transition period. Vulnerability of the
transition period in cattle is marked by reproductive problems and prevalence of
mastitis. This can be ascribed to findings that various components of the host
defence mechanisms, particularly the immune cells, are depressed during this
period. It has been reported that functional capabilities of mammary macrophages
decrease during the periparturient period and this alteration has been linked with an
increased incidence of mastitis. Presence of neutrophils at the site is inversely
correlated with the risk of mammary infections. In vitro efficacy of neutrophils
obtained from selenium-deficient mice, rats and cattle in killing ingested microbes is
significantly reduced as compared to that from selenium-sufficient animals. It is
because of the reduced activity of the antioxidant enzyme Glutathione peroxidase
(GSHPx), responsible to protect neutrophils to be damaged by their own superoxide-
derived radicals, in selenium-deficient animals as selenium is an integral component
of the enzyme. Supplementing the dairy rations with vitamin E and selenium has
become a widely accepted practice throughout the world to address the issue of
prooxidants and antioxidant balance. As being an essential component of the
GSHPx, selenium is able not only to convert toxic hydrogen peroxides to water but
also the lipid hydroperoxides to non reactive compounds participating in the
antioxidant defence system of the body at initial and secondary levels of blocking the
chain of reactions .
Selenium performs its biological role through the genetically encoded selenocysteine
residue (SeCys) of selenoproteins. Selenium can affect three broad areas of cellular
functions: antioxidant activities, thyroid hormone metabolism, and the regulation of
redox-active protein activity. Out of 30-50 known selenoproteins (Köhrle 2000) at
least 12 have been relatively well characterized as having wide-ranging implications

7
for immune function, malignancy and viral pathogenesis. The best-known
selenoenzyme with respect to dairy cattle nutrition is glutathione peroxidase
(GSHPx). Indeed, it is an essential component of the cellular antioxidant defence
mechanism, which removes potentially damaging lipid hydro-peroxides and hydrogen
peroxides and protects the immune cells from oxidative stress induced damage. A
recent report describes that thioredoxin reductase (TrxR) may be an important
antioxidant defence mechanism in peripheral blood mononuclear cells (PBMC) that is
compromised during the periparturient period. Indeed the most of the functional
capabilities of selenoproteins are related to their crucial role in regulating the ROS
and redox status in nearly all tissues. However, some effects on the regulation of
arachidonate metabolism in peripheral blood lymphocytes resulting in the partial
reversal of proliferation have also been reported. New insight in the role of free
radicals as signalling molecules and understanding the role of nutrients in gene
expression have created new demands for further research related to the biological
roles of selenium.
2.3 Metabolism of Selenium in Mammals
It is interesting to note that selenium is unique in its metabolism compared with
typical essential trace elements such as copper and zinc. As with other dietary
nutrients, selenium from organic and inorganic dietary sources has to be metabolized
by the ruminal microorganisms before being absorbed by separate mechanisms in
the small intestine of ruminants. Not much is known about selenium metabolism in
the rumen. In sheep, ruminal absorption of 75Se has been reported to be only 34%
probably because of the conversion of dietary selenium to insoluble forms such as
elemental selenium and selenide (Spears 2003). More recently, it has been
demonstrated that inorganic selenium has a lower ruminal microbial uptake than
organic selenium sources in dairy cows (Mainville et al. 2009). In the small intestine,
amino acid derivatives of selenium (selenomethionine and selenocysteine), mainly
found in the organic selenium sources such as selenium yeast, use the same carriers
as their sulphur analogues methionine and cysteine (Glass et al. 1993), whereas
selenate uses a sodium sulphate cotransporter for its absorption, which is driven by
the activity of Na+/K+-ATPase at the basolateral enterocyte membrane (Mehta et al.
2004). In the lumen of the small intestine, selenite partially reacts with glutathione or
other thiols to selenotrisulfides, which are presumably taken up into the enterocytes

8
by amino acid transporters. Another part of selenite diffuses through the apical
membrane and reacts with thiols in cytosol of enterocytes. Subsequently, selenium
compounds are liberated in the blood stream at the basolateral enterocytes
membrane and distributed to various peripheral tissues. The exact transport
mechanism of various selenium compounds is not yet fully understood.
Selenomethionine associates with hemoglobulin while selenate and the remaining
free selenite were found to be transported by � and �-globulins (Beilstein and
Whanger 1986b, a). Ionic selenium forms of selenite and selenate follow bicarbonate
and phosphate, respectively, in their transport in the body because of similarity in
their ionic forms (Suzuki 2005). In fact selenite ions are readily taken up by red blood
cells (RBCs) through band three protein without being excreted into urine (Suzuki et
al. 1998) while selenate ions are not taken up by RBCs but directly taken up by
hepatocytes through transport system of phosphate and partly excreted directly into
urine (Kobayashi et al. 2001). Selenite taken up by RBCs is readily reduced to
selenide and then effluxed into the blood stream in the presence of albumin and
transferred to liver in the form bound to albumin (Shiobara and Suzuki 1998). It can
be concluded that selenide of selenite and selenate origin are taken up differently by
the liver and utilized for the synthesis of selenoproteins. A surplus of inorganic
selenium is stored in peripheral organs as “acid labile selenium”. This selenium
fraction consists of selenium bound unspecifically to proteins presumably via the
formation of selenium-sulphur bonds (Diplock et al. 1973; Ganther and Kraus 1984).
The main excretion products of selenium detected in urine are the methylated
metabolites monomethylselenol (MMS) and trimethylselenonium (TMS). Methylated
selenium metabolites are formed from selenium reduced to the oxidation state –II as
well as from selenium stored unspecifically in proteins as selenomethionine and from
acid labile selenium (Hassoun et al. 1995). Selenium exhalation as dimethylselenide
only takes place when selenium is ingested in toxic doses. The metabolism and the
fate of dietary selenium has been summarised demographically in the following
representations (Figure 2 and Figure 3).

9
Figure 2 Selenium incorporation in proteins (Suzuki 2005)
Figure 3 Selenium metabolism in mammals (Suzuki 2005)
2.4 Selenium Nutrition of Dairy Cows
The nutritional status of the animal is related to its overall health and its capacity to
combat disease. The nutritionally modulated improvement of the immune system
should culminate in increased resistance to disease. Research on micronutrients and
their immunoregulatory role regarding udder health and bovine mastitis has focused
mainly on selenium, vitamin A, vitamin E, �-carotene, copper and zinc. Among these,

10
selenium has been the most characterized trace element affecting bovine mammary
gland health through its role in cell function.
Having been recognized as a dietary essential, selenium is being routinely
supplemented in the rations of farm animals. In the United States, 0.1 mg selenium
/kg dry matter (DM) is recommended for ruminant rations to correct symptoms of a
selenium deficiency. However, owing to the beneficial effects of the additional
selenium supplementation, the recommendation was increased to a level of 0.3
mg/kg DM (National Research Council 2001). The German Society for Nutritional
Physiology (GfE) has recommended that selenium intake levels for dairy cattle
should range from 0.2 mg/kg DM (GfE 2001) whereas the recommendations by the
British authorities are 0.1 mg/kg DM (MAFF 1983). Supplementation of this nutrient
to dairy animals can be one of the best options, not only to protect the animal from
disease threats, but also to raise the selenium level in milk and subsequently transfer
this essential element to the human population, many of whom are marginal deficient
in selenium.
2.5 Biomarkers for Selenium Status
The scientific controversy regarding the identification of the best biomarker for
selenium status assessment is still unresolved. In dairy cows, several approaches
have been followed to assess the status of the herd or the individual animal. These
approaches include the direct estimation of selenium in whole blood, serum or
plasma, milk and others tissues of interest; and indirect measures such as the intra-
and extra-cellular activity of the selenium containing enzyme, glutathione peroxidase
(GSHPx) in whole blood, serum or plasma. A number of studies have shown that
serum selenium or GSHPx activity represents the short-term selenium status, while
parameters for the whole blood or erythrocytes reflect the long-term selenium status.
Stowe and Herdt (1992) determined the reference range of serum selenium level of
70-100 ng/ml. This value has been described as an adequate level. Earlier reports
(Maus et al. 1980; Detoledo and Perry 1985) suggested that an adequate selenium
level in blood serum should be in the range of 40-120 ng/ml. Variations in these
findings may be the result of dietary concentration and nutritional management
practices. Gerloff (1992), on review of the data from various research groups,
considered the value of 70-100 ng/ml for serum selenium as a consensus of opinion

11
regarding the adequacy of selenium, particularly when the dietary source is inorganic
selenate or selenite.
With the discovery, that glutathione peroxidase (GSHPx) has selenocysteine as its
essential component; the activity of this enzyme has been regarded as the pertinent
parameter for the assessment of selenium status. Although numerous studies have
associated the activity of GSHPx with the selenium status of the animal because of a
linear response of GSHPx activity with selenium supplementation, GSHPx activity as
the parameter of selenium status assessment has been criticized (Stowe and Herdt
1992). Inconsistency of units used in expressing the enzyme activities, difficulty in
ensuring the proper storage conditions of samples, enzyme concentrations that reach
a plateau while serum selenium concentrations continue to rise and delayed
response to supplementation and different cellular and extra cellular forms are all
points which need to be taken into account when considering GSHPx activity as a
criterion for selenium status of the animal. On the other hand, the relationship
between GSHPx and health is better explained than between plasma selenium
concentration and health. Awadeh et al. (1998a) showed that only one-third of total
selenium intake is incorporated into GSHPx, and that GSHPx activity is largely
confined to the erythrocytes.
Milk selenium concentrations can potentially be used as a simple parameter for the
selenium status assessment of dairy herds. In a study conducted with large dairy
herds over several seasons, a sigmoid relationship with an adjusted R2 value of .92
(P < 0.0001) was observed between the bulk tank milk selenium and mean serum
selenium values (Wichtel et al. 2004). A plateau effect was noted in serum selenium
concentrations when milk concentrations exceeded 20 μg/l. Tentative reference
values for bulk tank milk selenium have been generated based on the relationship
observed. Milk selenium concentrations less than 9.6 ng/ml are considered to
indicate a deficiency, whilst a value of 21.8 ng selenium/ml appears to represent an
adequate selenium supply. The value 15.7 ng/ml is the median between the marginal
range of the low and high categories. However, it is notable that the source of the
selenium has not been kept considered while making the bulk tank milk selenium as
an accurate measure of the herd selenium status. Many studies have reported that
milk selenium concentrations were significantly higher when diets were

12
supplemented with selenium yeast as compared to sodium selenite at the same level
(Ortman and Pehrson 1999; Muniz-Naveiro et al. 2005; Juniper et al. 2006). Positive
correlations, irrespective of the source of selenium supplementation, of 0.59, 0.64
and 0.68 have been observed between the cows’ milk and their calves erythrocytes
GSHPx activity, whole blood, and plasma selenium concentrations, respectively
(Pehrson et al. 1999). A cautious estimate of the herd selenium status can be made
by bulk tank milk selenium concentrations, keeping the source of selenium
supplementation in mind.
The source and dietary level of the nutrient are important in determining the
nutritional status of the animal. Different supplements of selenium are categorised
based on organic and inorganic forms. Sodium selenite and sodium selenate are
common inorganic forms whereas the organic form of selenium is produced from the
yeast Saccharomyces cerevisiae, with almost 90% of the total selenium represented
by selenomethionine (Muniz-Naveiro et al. 2005). As far as the bioavailability of
selenium from organic versus inorganic sources is concerned, whole blood selenium
concentration, GSHPx activity and milk selenium concentration in dairy cattle
increase more efficiently after dietary selenium supplementation using organic
sources compared to inorganic ones (Malbe et al. 1995; Awadeh et al. 1998b;
Knowles et al. 1999; Ortman and Pehrson 1999; Gunter et al. 2003). However,
selenium yeast and selenite follow a similar pattern of distribution among serum
proteins (Awadeh et al. 1998b). Cattle fed selenium yeast have a higher percentage
of selenium in whole blood (average 20%), milk (average 90%) and increased activity
of GSHPx (16%) compared to cattle fed inorganic selenium (Weiss 2005).
Previously, Knowles et al. (1999) had reported no difference in the blood GSHPx
activity between cows fed selenite and those fed a selenium yeast compound,
provided the cows consumed 4 mg/day of supplemental selenium (approximately 0.2
ppm). However, when cows were fed 2 mg/day, the GSHPx activity was 50% higher
than when selenium yeast was used as source of dietary selenium. Comparative
increases in milk and blood selenium levels after supplementing the diet of cows with
a selenium yeast source have been largely attributed to non-specific incorporation of
selenomethionine from the diet into the tissue proteins (Weiss 2005). However,
Juniper et al. (2006), after conducting a study with selenium supplementation in the
range of 0.27-to 0.4 ppm from a selenium-containing yeast source, reported that only

13
25-33% of total milk selenium increase could be attributed to selenomethionine and
that there are other selenoproteins in milk, which might play a role as an antioxidant.
Interactions between the selenium status of dairy cows and the udder defence
system have been explored. Parameters of milk somatic cells and microbial counts,
incidence and duration of clinical mastitis cases in dairy herds, and controlled
experiments with or without the experimental challenge of pathogenic microbes, have
been the prime focus in this area. With the advent of selenium yeast products on the
market, research is now focussing on safety and comparative efficacies. Based on
the information cited above, it can be inferred that the selenium status of the animal
is directly correlated with dietary level and source, and organic selenium sources
tend to be comparatively more efficient in maintaining the selenium status of the
animal than are inorganic sources.
2.6 Somatic Cell Count and Selenium Status
The somatic cell count (SCC) of milk is used as a benchmark parameter to estimate
udder health and consequently milk quality. Cell concentration of the milk varies
widely as a function of the lactation cycle. In healthy udder conditions, very few
leukocytes should migrate into milk during full lactation. At cessation of milking, the
SCC might increase owing to the intense physiological changes occurring in the
udder. Milk from a healthy bovine udder should contain very few somatic cells (<
20,000/ml), and whenever the SCC rises above 20,000/ml, there has been
histological evidence of inflammation in the udder (Schalm et al. 1971). Rainard and
Riollet (2006) reported that the SCC in most uninfected and uninflamed quarters is
considerably less than 100,000/ml, with a low portion of neutrophils, which can
increase up to 40% near the drying off period. Somatic cell concentrations increase
to reach 2-5 ×10⁶/ml during the first 7-10 days of the dry period. They then remain
stabilized in the range of 1-3 ×10⁶/ml. After parturition, the SCC decreases to 105/ml
in the first 7-10 days after calving.
Higher SCC values in milk reflect a diseased udder making the milk less valuable. It
is evident (Table 2) that milk SCC is negatively correlated to the selenium status of
the animal. It was reported that the cow’s udder is more prone to infection if GSHPx
activity in the blood is below 3.3 μkat/g of haemoglobin (Malbe et al. 2003). Lack of

14
GSHPx activity causes oxidative damage to soft tissue, thus making the udder more
vulnerable to mastitis pathogens. Consequently, infiltration of neutrophils in the udder
tissue will cause the SCC to rise to higher levels. The effective role of neutrophils in
combating the microbial threat is also dependent on GSHPx activity. Enhanced
viability and vitality of neutrophils in response to optimum GSHPx activity could be a
plausible explanation for the low SCC in the milk of cows having improved selenium
status and consequent enhanced GSHPx activity.
Few studies failed to find a correlation (Grace et al. 1997; Wichtel et al. 2004)
between the selenium status of cows and disease susceptibility. This has been
attributed to the fact that the data involved the results of surveys conducted with
herds having different management practices. Marginal bulk tank milk selenium
levels of (0.018 μg/ml), and corresponding marginal serum selenium levels, could
have been the reason why Wichtel et al. (2004) did not find any substantial
relationships between bulk tank milk selenium levels and the general parameters
used to assess udder health.
2.7 Mastitis Susceptibility and Selenium Status
Low selenium status is linked to increased susceptibility of dairy cows to
intramammary infections (Table 2). Marked reduction (up to 60%) in infected
mammary gland quarters has been observed in dairy cows after selenium
supplementation for a period of 8 weeks at 0.2 ppm dietary level (Malbe et al. 1995;
Ali-Vehmas et al. 1997). Duration of clinical mastitis was reduced by 46% in cows
supplemented with selenium and by 62% in cows supplemented with selenium and
vitamin E (Smith et al. 1984).
Supplementation with selenium and/or vitamin E at levels far above those required
for growth and normal physiological function can result in the improvement of various
components of the immune system and general animal health (Surai 2006). This is
particularly important for cows infected with pathogens. In an experiment described
by Hemingway (1999), 14 of 36 cows receiving intramammary antibiotic infusions at
drying off needed extra treatment in the subsequent lactation whereas only 5 of 36
cows which received additionally 4 mg selenium at drying off needed such treatment.
Udder health benefits have been attributed to antibacterial activities against S.
15
aureus in milk whey protein (Ali-Vehmas et al. 1997; Malbe et al. 2006). The
underlying mechanism of this antibacterial activity is not well understood. However, it
was proposed that impaired microbial growth rate in the whey fraction exhibiting high
GSHPx activity may account for the results. The absence of both glutathione and
GSHPx in bovine milk has been reported (Stagsted 2006). Therefore, further
generation of more reactive radical oxygen species by phagocytes or the presence of
other selenoproteins in milk may account for the results obtained. It can be
concluded that selenium may affect mastitis susceptibility of the mammary gland by
improving the phagocyte recruitment to the infected quarters, increasing their vitality
and inducing unspecified antibacterial activity in milk whey against various
pathogens.
2.8 Mammary Gland Immune System – Interactions with Selenium
The immune response is characterized by heterogeneity of reactive cells and their
products, having specificity for the response and memory following subsequent
antigen exposures. The bovine mammary gland produces colostrum which is rich in
antibodies that can protect the newborn from infectious agents (Sordillo et al. 1997).
The bovine mammary gland is itself protected by a variety of defence mechanisms,
which can be separated into two distinct categories: innate immunity and adaptive
immunity, each having sensing and effectors arms (Rainard and Riollet 2006). The
innate and acquired immune systems interact closely in an attempt to provide
protection against pathogens (Sordillo et al. 1997; Burvenich et al. 2003). The
acquired immune response uses many innate immune effector mechanisms to
eliminate microorganisms and its action frequently increases innate antimicrobial
activity (Oviedo-Boyso et al. 2007). The efficacy of the adaptive immune response
rests in its specificity, memory of the immune cells and also, to some extent, on the
immune stimulus, which is augmented by repeated exposure to the antigen. On the
other hand, innate immunity is non-antigen-specific, exists prior to the encounter with
the pathogens, and is related to the processes of acute and chronic inflammation and
sepsis (Finlay and Hancock 2004).

16
2.8.1 Physical Barriers The first lines of defence against foreign molecules and invading pathogenic
microorganisms are the natural physical barriers of the body. Mastitis can occur
when bacteria gain entrance into the mammary gland via the teat canal. The teat end
contains sphincter muscles that maintain tight closure between milkings and hinder
bacterial penetration. Increased patency of these muscles is directly related to an
increased incidence of mastitis (Murphy and Stuart 1953; Myllys et al. 1994). The
teat canal is lined with keratin, which is crucial to the maintenance of the barrier
function of the teat and removal of the keratin correlates with increased susceptibility
to bacterial invasion and colonization (Capuco et al. 1994; Sordillo and Streicher
2002). Teat keratin is a waxy material derived from stratified squamous epithelium
that traps invading bacteria and exhibits bactericidal properties (Hibbitt et al. 1969;
Craven and Williams 1985). Esterified and non-esterified fatty acids (myristic,
palmitoleic and linoleic) function as bacteriostatic agents, and are associated with
keratin of the teat canal (Miller et al. 1992). More recently, it has been noted that
certain cationic proteins associated with keratin can bind to pathogenic
microorganisms, thus increasing their susceptibility to osmolarity changes leading to
the lyses and death of the invading pathogens (Paulrud 2005). Because of the
efficacy of the teat canal barrier, the intra-mammary lumen is an aseptic chamber to
which the aseptic character of normal milk can be attributed. Thus, the teat canal is
an important barrier against intra-mammary infections.
There may be a role for selenium in teat canal keratin function as it has been found
that in mammalian spermatozoa phospholipid hydroperoxide glutathione peroxidase,
a selenoprotein, is functionally associated with the cross linking of the structural
elements of the cytoskeleton via the oxidation of high sulphur keratin-associated
proteins (Maiorino et al. 2005a; Maiorino et al. 2005b). There is no direct evidence of
the association of selenium with the bovine mammary gland teat canal.
2.8.2 Cellular Factors
Bacteria and other pathogens, upon entry into the body tissues, are only able to
cause disease by overcoming the body’s natural cellular defence mechanism.
Different types of cells in combating the pathogens play a pivotal role. Cellular factors

17
of the bovine mammary gland immune system come from two main types: the
mammary epithelial cells (MECs) and the immune cells comprising macrophages,
neutrophils, Natural Killer (NK) and dendritic cells. Collectively these constitute the
somatic cells of the milk.
Mammary epithelial cells (MEC) were previously considered the major cell type in
milk (Schalm et al. 1971). However, a later study confirmed that MECs are rarely
found in the milk and the major cell type of the tissue and secretion of the bovine
mammary gland is the macrophages (McDonald and Anderson 1981). The presence
of sub- and intra-epithelial leukocytes, and the repertoire and distribution of sensor
receptors on MECs makes the immune system of the mammary gland peculiar,
resembling the urinary tract system and differing from the intestine (Rainard and
Riollet 2006). Mammary epithelial cells express mRNA for TLR 2, 4 and 9 and �-
defensin 5, thus contributing positively towards the sensing of pathogens
(Goldammer et al. 2004). Adhesion of bacteria and the interaction of bacterial toxins
with the epithelial cells has been reported to induce the synthesis of tumour necrosis
factor alpha (TNF-�), interleukin-6 (IL-6) and IL-8 (Rainard 2003).
Phagocyte Responses
Much of the uptake of foreign antigens is performed by macrophages, neutrophils
and natural killer cells in the mammary gland. During the defence of the mammary
gland against bacterial infection, tissue and milk macrophages recognise the
invading pathogen and initiate the inflammatory response by releasing pro-
inflammatory cytokines (TNF�- and IL-1�), that induce neutrophils recruitment to the
mammary gland (Bannerman et al. 2004).
Macrophages are the major cell type in milk, secretions of the involuted udder, and
mammary tissue (Jensen and Eberhart 1981; Mcdonald and Anderson 1981).
Although macrophages can ingest common mastitis pathogens, they are less active
phagocytes than are milk neutrophils. Furthermore, both milk cell types are less
efficient than their blood counterparts (Mullan et al. 1985). In addition to phagocytic
activity, macrophages also play a role in antigen presentation (Politis et al. 1992) and
are responsible for the removal of neutrophils following the elimination of bacterial
pathogens. The functional capabilities of mammary macrophages decrease markedly

18
during periparturient periods and this alteration has been linked to an increased
mastitis incidence (Waller 2000; Sordillo and Streicher 2002). Apart from the stress
associated with parturition and the start of lactation, the underlying mechanism of the
periparturient immunosuppression is still unclear.
Ndiweni and Finch (1995) worked with bovine mammary gland macrophages
obtained from cows fed a selenium adequate diet. They investigated the effect of
various doses of vitamin E, sodium selenite and combination of both on cellular
functions in vitro. Sodium selenite supplementation in vitro from 1 nM-10 μM to S.
aureus-stimulated macrophages enhanced the production of chemotactic factors
significantly (P < 0.003). Similar effects were recorded with vitamin E
supplementation in the range from 5 ng/ml to 50 μg/ml. There were no synergistic
effects of both nutrients. Concentrations of selenium above 0.1 mM depressed
chemotaxin production. It was suggested that the stimulatory effect of selenium might
be attributed to its role as cofactor of LTB4 synthase or hydrase, as peritoneal
macrophages from rats fed selenium-deficient diets are not able to produce a
respiratory burst reaction and as a result, their antimicrobial function is compromised
(Parnham et al. 1983).
Neutrophil numbers in normal milk from healthy bovine mammary gland are too low
for efficient phagocytosis (Leijh et al. 1979). Pro-inflammatory cytokines released by
macrophages and MECs activate the expression of cellular adhesion molecules by
endothelial cells that cause the binding and subsequent migration of blood
neutrophils from blood to the site of infection, or in the milk where they are further
localised. Following bacterial entry into the mammary gland, neutrophils are the first
cells that are recruited into the milk and represent the predominant cell type.
Neutrophils recruitment from the circulation to the site of infection is essential in the
defence of the mammary gland against invading bacteria. The promptness of the
recruitment and the number of recruited neutrophils, which vary in intensity according
to pathogen type and the cow, determines the outcome of the infection.
Neutrophil concentrations increase rapidly between 3-12 h post-challenge and can
reach more than 107/ml in milk following E. coli infusion in the mammary gland,
whereas in the case of a S. aureus challenge, the recruitment is delayed (between

19
24-48 h and remains below 106/ml (Riollet et al. 2000; Rainard and Riollet 2006).
Recruited neutrophils at the site of infection phagocytose bacteria and produce
reactive oxygen species, low molecular weight antibacterial peptides, and defensins,
which eliminate a wide variety of pathogens (Mehrzad et al. 2002; Paape et al. 2002;
Sordillo and Streicher 2002; Paape et al. 2003). The increase in the concentration of
milk neutrophils is in fact the origin of high SCC during mastitis and this is the reason
why their presence is inversely correlated with the risk of intramammary infections
(Burton and Erskine 2003).
The most important and widely investigated association between selenium and the
immune function in dairy cows is the effect of this micronutrient on neutrophils
function. Neutrophils perform their microbe killing function by producing super-oxide
derived radicals. This type of process is a balance between sufficient radical
production for microbial killing and the system that protects the neutrophils
themselves from these radicals. This balance is attributed to the cytosolic glutathione
peroxidase activity within the neutrophils, which is impaired in selenium deficiency,
which permits neutrophils to be self-destroyed. The earliest evidence regarding the
effect of selenium on neutrophils function was reported by Boyne and Arthur (1979).
In that study, it was noted that the ability of neutrophils to phagocytise Candida
albicans cells was not different (P < 0.05) between selenium-deficient and selenium-
supplemented calves receiving 0.1 mg of dietary selenium/day. However, the number
of neutrophils with the ability to kill phagocytosed C. albicans cells was about three
times less for selenium-deficient animals having undetectable levels of blood GSHPx
activity. On the other hand, both phagocytosis (P < 0.05) and killing (P < 0.01) of S.
aureus by blood PMN leukocytes were higher (P < 0.05) when the dairy cows
received between 10-17 mg selenium/day, along with an additional 350-1000 mg
vitamin E/day for a period of 16 days (Gyang et al. 1984). However, phagocytosis by
neutrophils from cattle supplemented with selenite or selenate at low levels (2
mg/day or 0.2 mg/kg DM, respectively) was not different from that of neutrophils from
unsupplemented cows.
Direct and indirect measures of bacterial killing were higher (P < 0.05) in neutrophils
isolated from selenium-supplemented cattle as compared to those from
unsupplemented cows (Grasso et al. 1990; Hogan et al. 1990). In a survey

20
conducted by Cebra et al. (2003) higher blood selenium levels (> 300 ng/ml) were
associated with enhanced neutrophils adhesion and intracellular kill by the
neutrophils obtained from post parturient cows. With PMN cells isolated from the
blood of selenium-adequate cows, it was found that in vitro supplementation of
selenium (10 μM) had greater stimulatory effect (129%) on their random migration
than did vitamin E (71%) and, at the highest concentration of selenite used (1 mM),
random migration of PMN was inhibited (Ndiweni and Finch 1996). On the other
hand, vitamin E enhanced phagocytosis of S. aureus to a greater extent than did
sodium selenite after a 2 h incubation period (Ali-Vehmas et al. 1997). Both nutrients
were not significantly different in their ability to stimulate PMN cells to produce
superoxide. Enhanced recruitment of neutrophils at the site of infection in selenium-
supplemented cows has also been reported previously (Ali-Vehmas et al. 1997).
Organic and inorganic sources of selenium at 0.3 mg/kg DM intake have been
compared for their effect on the function of neutrophils obtained from the blood of
lactating cows (Weiss and Hogan 2005). There were no significant differences
regarding either the ability of neutrophils to phagocytise bacteria or the percentage of
E. coli that were killed, although there was a slight increase in the percentage kill for
the selenium yeast group. These observations agree with those of Malbe et al.
(1995) regarding the effect of selenium source on bovine neutrophils’ phagocytosis of
S. aureus. A plausible explanation for this effect might be the non-specific pooling of
selenomethionine from organic selenium sources into tissue proteins instead of
methionine and the presence of 0.2% sulphur in the diets. However, it is difficult to
interpret such data, as a negative control was not included. More recently, Mukherjee
(2008) has reported an improvement (P < 0.05) in phagocytosis of S. aureus by milk
neutrophils obtained from mastitic riverine buffaloes that had been injected with a
selenium/vitamin E preparation containing sodium selenite and had been treated with
enrofloxacin.
Lymphocyte Responses
Long-term cellular specific immunity is a function of both antigen-presenting cells and
lymphocytes, which are the only cells of the immune system that recognize antigens
by membrane receptors specific to invading pathogens. If the invading pathogens
survive the activities of macrophages and neutrophils, T and B lymphocytes and

21
monocytes become the predominant cell type. Leitner et al. (2003) observed that
lymphocytes were the most common infiltrating cell type within the two-layer
epithelium lining the teat cistern; monocytes and macrophages were present in lower
number. Nevertheless, neutrophils remain most important in chronic mastitis
(Rainard and Riollet 2006). T lymphocytes are classified into two main groups: T��
and T��. T�� include CD4+ (helpers) and CD8+ (suppressors) cells. In healthy
mammary glands CD8+ lymphocytes are the prevailing type, whereas in mastitis
infected mammary glands CD4+ cells are predominantly activated by the formation of
a molecular complex between the major histocompatibility complex class II (MHC II)
and antigens presented by B lymphocytes and macrophages (Park et al. 2004).
Through their ability to secrete certain cytokines, CD4+ cells help B lymphocytes to
proliferate and secrete antibodies. CD4+ cells are mainly found in the inter-alveolar
tissue of the mammary gland whereas CD8+ cells surround the alveoli (Leitner et al.
2003).
In contrast with the milk, cells obtained from blood exhibit a higher ratio of CD4+ to
CD8+ cells; however, the functional significance of this elevated frequency has not
been clearly established. CD8+ cells may be either cytotoxic or suppressor type. Post
partum they are mainly of the cytotoxic type, whereas during mid and late lactation
they are of the suppressor type (Sordillo et al. 1997). Cytotoxic T cells recognise and
eliminate altered self cells via antigen presentation in conjunction with MHC I
molecules. They act as the scavengers of old and damaged secretory cells and their
secretions are related to the susceptibility of the bovine mammary gland to infections
(Oviedo-Boyso et al. 2007). Although T�� cells are not well characterized, they are
associated with the epithelial surface where they destroy damaged epithelial cells
(Yamaguchi et al. 1999).
Natural Killer cells, B cells and dendritic cells are also part of the bovine mammary
gland immune system. Natural Killer (NK) cells are large granular lymphocytes that
have cytotoxic activity independent of MHC, through antibody-dependent cell
mediated cytotoxicity. In contrast to neutrophils and macrophages, they are critical to
the removal of intracellular pathogens. Bovine NK-like cells (CD2+ CD3- T
Lymphocytes), express bactericidal activity against S. aureus upon stimulation with
IL-2 in a non-specific manner (Sordillo et al. 2005). These cells destroy both gram

22
positive and gram-negative bacteria and are fundamental to the prevention of bovine
mammary gland infections (Sordillo and Streicher 2002). The primary role of B
lymphocytes is to produce antibodies against invading pathogens. In doing so, they
utilize their cell surface receptors to recognize specific pathogens and process the
antigens. Processed antigens are thus presented to T helper cells, which secrete
cytokine IL-2 that, in turn, induces the proliferation and differentiation of B
lymphocytes into either plasma cells that produce antibodies or memory cells. Not
much is known about the density and role of dendritic cells in the bovine mammary
gland immune system. Normally they are associated with antigen presentation.
It has been suggested that selenium and vitamin E deficiencies affect T lymphocytes
to a greater extent than B lymphocytes (Larsen et al. 1988). This was suggested to
be the result of higher levels of polyunsaturated fatty acids in T lymphocytes and
associated with higher membrane fluidity. Selenium and vitamin E deficiencies may
affect both the maturation of specific lymphocyte subpopulations and proliferative
capabilities of peripheral lymphocytes (Surai 2006). In an experiment with dairy cows
fed either basal diet (~ 0.05 mg selenium/kg DM) or a diet supplemented with sodium
selenite (~ 0.20 mg selenium/kg DM), it was noted that Con A stimulated lymphocyte
proliferation was significantly higher in the selenium-supplemented group (Cao et al.
1992). Similar findings have been reported when bovine peripheral blood
lymphocytes were supplemented with sodium selenite in vitro from 1 nM to 10 μM
concentrations (Ndiweni and Finch 1995).
Selenium supplementation or deficiency in mice altered the kinetics of IL-2 receptor
expression (Roy et al. 1994). Supplementation in vitro or in vivo resulted in an earlier
expression of high affinity IL-2 receptors, whereas selenium deficiency resulted in a
delayed expression of receptors. This may explain the stimulatory role of selenium in
the enhanced T cell function. In healthy aged humans, selenium supplementation
(400 μg/day, for 6 months) enhanced NK cell cytotoxicity over pre-treatment levels by
58% (Wood et al. 2000). There is no information on the effect of selenium on NK cell
and dendritic cell function in dairy cows. It is interesting to note that enhanced
immune cell function resulted from selenium supplementation levels, which are
higher than normally recommended.

23
2.8.3 Soluble Factors
Soluble factors of the bovine mammary gland immune system are made up of
various proteins that include complement proteins, cytokines and immunoglobulin.
Each class performs its physiologically defined function with a high level of
specificity.
The bovine complement system is a collection of proteins that is present in serum
and milk, and has an important role in the defence of the mammary gland.
Complement proteins are predominantly produced by hepatocytes, though they are
also produced by monocytes and macrophages in different tissues. In the presence
of antibodies, they lyse invading pathogens. Complement component C3b binds the
antibody bacteria complex for efficient phagocytosis by neutrophils and macrophages
(Paape et al. 2003) whereas C5a stimulates the recruitment of neutrophils, which
augments their phagocytic and bactericidal activities (Rainard and Poutrel 2000).
Cytokines are produced by both immune and non-immune cells and are essential in
almost all aspects of host defence. They regulate the activities of cells involved in the
immune function. A variety of cytokines such as interleukins (IL) -1�, -2, -6, -8, -12,
colony stimulating factor (CSF), interferon gamma (IFN-�) and TNF-� have been
detected in healthy and infected bovine mammary glands (Sordillo and Streicher
2002; Alluwaimi 2004). TNF-� is the main cytokine produced by macrophages,
neutrophils and epithelial cells during the early stage of infection and participate in
the neutrophil chemotactic activity (Persson et al. 2003). CD4+ and CD8+
lymphocytes and NK cells in response to mitogenic and antigenic stimuli produce
IFN-�. Interferon-� functions in activating the acquired immune response and
phagocytic activity of neutrophils and is important in viral infections (Shtrichman and
Samuel 2001). Monocytes, macrophages, and epithelial cells produce IL-1�. During
the inflammatory response, IL-1� regulates the expression of adhesion molecules
and neutrophils chemotaxis in E. coli infections (Yamanaka et al. 2000). IL-2,
produced by CD4+ lymphocytes, regulates the acquired immune response by
stimulating the growth and differentiation of B lymphocytes and the activation of NK
and T cells. Alterations in IL-2 production cause a decrease in the mammary gland

24
immune response capacity, which facilitates mastitis (Sordillo et al. 1991; Sordillo
and Streicher 2002).
Immunoglobulins (Ig) are synthesized by plasma cells that are differentiated from B
lymphocytes upon activation by IL-2. In milk, immunoglobulin either are synthesized
locally or originate from blood (Sordillo and Nickerson 1988). The role of antibodies in
the natural defence mechanisms of the udder is to opsonise bacterial pathogens,
thereby aiding the neutrophils and macrophages in phagocytosis.
Four classes of Ig are known to influence mammary gland defence against bacteria
causing mastitis: IgG1, IgG2, IgA and IgM. Each of these classes differs in
physicochemical and biological properties (Gershwin et al. 1995). The concentration
of each immunoglobulin in the mammary secretion varies with the stage of lactation,
increasing during dry periods and approaching peak concentrations during
colostrogenesis (Sordillo and Nickerson 1988). The largest part of the opsonic
antibodies in adult serum and milk of cows is IgM (Williams and Hill 1982; Hill et al.
1983). The presence of IgM in cows, without a previous history of mastitis, suggests
that they are mainly auto-antibodies directed against self-antigens and are poly-
reactive in nature (Rainard and Riollet 2006). In this regard, the cow is not different
from humans or rodents, who also have these types of antibodies in their blood (Saini
et al. 1999).
Non-specific proteins such as lactoferrin, lysozyme, transferrin, xanthine oxidase and
the lactoperoxidase system, exhibit bacteriostatic and bactericidal activities against
common mastitis pathogens. In normal function, various components of the innate
and adaptive immune system are coordinated to provide protection to animals
against invasion by pathogens.
Improved selenium status of animals results in enhanced immunoglobulin titre in
colostrum from cows receiving a high dose of selenium, administered by
intramuscular injection pre-partum (Pavlata et al. 2004). Earlier studies reported
lower (P < 0.05) concentrations of IgG and IgM in plasma and colostrum of beef cows
and calves fed a free-choice salt/mineral mixture containing 20 ppm selenium as
sodium selenite, compared to the cows and calves fed a salt mixture containing 60

25
ppm selenium in the form of selenium yeast compound, or 120 ppm sodium selenite.
The source of selenium affects only the IgM concentration of plasma with higher
concentrations (P < 0.05) when cows are fed a selenium yeast supplement (Awadeh
et al. 1998b).
It was recommended that consideration should be given to the concentrations of T3
(thyroid hormone) and IgG whilst determining the nutritional requirement of cattle for
selenium. Swecker et al. (1989) also confirmed higher concentrations of colostral Ig
G in beef cows fed higher selenium levels in free choice mineral mixtures. Enhanced
proliferation of B lymphocytes in cell cultures containing 100 ng/ml selenium
suggests a mechanism for the increased IgM production (Stabel et al. 1991).
Contradictory observations of a no effect (P < 0.05) of selenium on the
immunoglobulin have also been reported (Lacetera et al. 1996; Leyan et al. 2004). It
is noteworthy that positive effects have been observed only when higher selenium
doses were used. Depression in several leukocyte function parameters, including the
forced antibody response, was noted in pre-parturient beef cows consuming 6 ppm
or 12 ppm selenium as sodium selenite from their diets (Yaeger et al. 1998).
Studies on the interactions of selenium with the immune system of the mammary
gland, general udder health and mastitis susceptibility are summarized in Table 1
and Table 2. There is little data on the effect of selenium on cytokines and other
soluble factors in dairy cows available.

26
Tabl
e 1
Dai
ry c
attle
imm
une
resp
onse
s as
affe
cted
by
sele
nium
R
efer
ence
St
udy
Type
Se
leni
um
Supp
lem
enta
tion/
Con
cent
ratio
nSe
leni
umSo
urce
Im
mun
eR
espo
nse
Stud
ied
Mat
rix
Obs
erva
tions
Wei
ss a
nd H
ogan
(2
005)
C
ontro
l E
xper
imen
t w
ith E
.Col
i ch
alle
nge
0.3
mg/
kg D
M in
die
t S
elen
ium
ye
ast a
nd
Sod
ium
S
elen
ite
Neu
troph
il fu
nctio
n B
lood
N
eith
er p
hago
cyto
sis
nor
perc
enta
ge k
ill w
as
sign
ifica
ntly
affe
cted
by
sele
nium
sou
rce
Pav
lata
et a
l. (2
004)
C
ontro
l E
xper
imen
t 44
-88
mg
IM in
ject
ion
Sod
ium
S
elen
ite
Imm
unog
lobu
lin
Col
ostru
m
Sig
nific
ant i
ncre
ase
(P <
0.0
5)
in tu
rbid
ity u
nits
was
obs
erve
d in
sup
plem
ente
d gr
oup
Ceb
ra e
t al.
(200
3)
Sur
vey
>
300
ng/m
l in
bloo
d S
odiu
m
Sel
enite
N
eutro
phil
func
tion
Blo
od
Incr
ease
d ad
hesi
on o
f ne
utro
phils
and
incr
ease
d in
trace
llula
r kill
alo
ng w
ith
high
er m
ilk p
rodu
ctio
n in
cow
s w
ith h
igh
sele
nium
sta
tus
Pan
ousi
s et
al.
(200
1)
Con
trol
Exp
erim
ent
IM in
ject
ion
of 0
.1 m
g/kg
bod
y w
eigh
t S
odiu
m
Sel
enite
S
peci
fic
antib
odie
s ag
ains
t E. C
oli
Ser
um
Ser
um c
once
ntra
tion
of
spec
ific
antib
odie
s ag
ains
t E.
coli
incr
ease
d (P
< 0
.05)
in
supp
lem
ente
d co
ws
at d
ay 6
3
Cao
et a
l. (1
992)
C
ontro
l E
xper
imen
t 0.
05-0
.2 m
g/kg
DM
S
odiu
m
Sel
enite
Ly
mph
ocyt
es
Blo
od
Sig
nific
antly
enh
ance
d (P
<
0.05
) lym
phoc
ytes
pro
lifer
atio
n w
ith C
on A
was
obs
erve
d in
th
e ce
lls fr
om s
elen
ium
su
pple
men
ted
cow
s du
ring
48-
96 h
ours
G
rass
o et
al.
(199
0)
Con
trol
Exp
erim
ent
with
E .C
oli
chal
leng
e
2 m
g/da
y in
die
t (90
day
s)
Sod
ium
S
elen
ite
Neu
troph
ils
func
tion
Milk
P
hago
cyto
sis
rem
aine
d un
affe
cted
but
sig
nific
ant
incr
ease
(P<
0.05
) in
killi
ng o
f in
gest
ed b
acte
ria w
as
obse
rved
in s
uppl
emen
ted
cow
s

27
Tabl
e 2
Bov
ine
udde
r hea
lth a
nd m
astit
is s
usce
ptib
ility
as
affe
cted
by
sele
nium
5
Ref
eren
ce
Stud
y Ty
pe
Sele
nium
Supp
lem
enta
tion
/Con
cent
ratio
n
Sele
nium
Sour
ce
Para
met
ers
Stud
ied
Obs
erva
tions
Muk
erje
e R
. (20
08)
Con
trol
Exp
erim
ent
1.5
mg/
day
in th
e fo
rm o
f in
tram
uscu
lar
inje
ctio
n (5
day
s)
Sod
ium
S
elen
ite
SC
C
GS
HP
x S
CC
dec
reas
ed s
igni
fican
tly(P
< 0.
05) f
rom
296
1x10
3to
630
x103
in
buffa
loes
scr
eene
d po
sitiv
e fo
r int
ra m
amm
ary
infe
ctio
ns w
here
as G
SH
Px
activ
ity in
crea
sed
sign
ifica
ntly
Mal
be e
t al.
(200
6)
Con
trol
Exp
erim
ent
4 m
g/da
y in
die
t (8
wee
ks)
Se-
yeas
t M
ilk p
rote
ins
antib
acte
rial
activ
ity
agai
nst S
.au
reus
G
SH
Px
Sel
eniu
m s
uppl
emen
ted
cow
s ex
hibi
ted
prof
ound
ant
ibac
teria
l act
ivity
in
milk
whe
y fra
ctio
ns w
hen
the
activ
ity o
f blo
od G
SH
Px
incr
ease
d si
gnifi
cant
ly fr
om <
1.0
2 μk
at/g
Hb
to >
4 μ
kat/g
Hb
Kom
mis
rud
et a
l. (2
005)
S
urve
y 20
-230
μg/
l in
bloo
d U
nspe
cifie
d S
CC
M
astit
is
Ret
aine
d P
lace
nta
Sig
nific
antly
low
(P =
0.0
3) b
ulk
milk
SC
C (1
37x1
03 /ml)
was
obs
erve
d in
he
rds
with
hig
h bl
ood
sele
nium
leve
l as
com
pare
d to
155
x103 /m
l in
herd
s w
ith lo
w b
lood
sel
eniu
m le
vel.
Red
uced
inci
denc
es o
f dis
ease
trea
tmen
t re
gard
ing
mas
titis
and
reta
ined
pla
cent
a w
ere
obse
rved
in a
nim
als
with
hi
gh b
lood
sel
eniu
m le
vels
Ju
kola
et a
l. (1
996)
S
urve
y
191
μg/l
in b
lood
U
nspe
cifie
d S
CC
In
cide
nce
of
clin
ical
m
astit
is
A 1
7.7%
and
70.
6% d
ecre
ase
in in
fect
ions
cau
sed
by S
. aur
eus
and
Cor
yneb
acte
rium
spe
cies
resp
ectiv
ely
was
foun
d to
be
asso
ciat
ed w
ith
high
blo
od s
elen
ium
leve
l
Wic
htel
et a
l. (1
994)
C
ontro
l E
xper
imen
t 6-
12 m
g/da
y (w
hole
lact
atio
n)
Sod
ium
S
elen
ite
SC
C
Sig
nific
ant d
ecre
ase
(P <
0.0
2) in
SC
C fr
om th
e le
vel o
f 235
x103 /m
l to
112x
103 /m
l in
diffe
rent
her
ds w
ith s
elen
ium
sup
plem
enta
tion
was
ob
serv
ed
Mad
dox
et a
l. (1
991)
C
ontro
l E
xper
imen
t w
ith E
. col
i ch
alle
nge
0.05
-0.3
5 m
g/kg
D
M
Sod
ium
S
elen
ite
Milk
bac
teria
l co
unt
Milk
bac
teria
l cou
nt w
as s
igni
fican
tly h
ighe
r(P
< 0
.05)
in s
elen
ium
-def
icie
nt
grou
p an
d th
is g
roup
requ
ired
ther
apeu
tic tr
eatm
ent w
here
as
supp
lem
ente
d gr
oup
reco
vere
d w
ithou
t the
rape
utic
inte
rven
tion
Wei
ss e
t al.
(199
0)
Sur
vey
70-9
0 μg
/l (h
erd
mea
n pl
asm
a)
Uns
peci
fied
SC
C
Inci
denc
e of
m
astit
is
Sig
nific
ant (
P <
0.0
5) n
egat
ive
corr
elat
ions
(-0.
84, -
0.68
) wer
e ob
serv
ed
betw
een
herd
mea
n pl
asm
a se
leni
um c
once
ntra
tion
and
SC
C in
the
rang
e of
724
-744
x103 /m
l and
mas
titis
inci
denc
e du
ring
the
who
le la
ctat
ion

28
2.9 Concluding Remarks
Survey findings and controlled studies with or without experimental challenge
indicate a role for selenium in the immune function and improvement in bovine
mammary gland health. Although selenium status has been noted to increase
markedly as a result of the supplementation with selenium yeast as compared to
inorganic sources, whether this increase is completely translated in terms of health
benefits to the animal is not clear. Most recent findings have confirmed that selenium
levels higher than those considered adequate can potentially enhance the natural
defence mechanisms of the bovine mammary gland at maximum, especially the
humoral responses.
There are limited studies on the clinical aspects of the health of the bovine mammary
gland, as affected by organic versus inorganic selenium sources, or a combination of
the two sources of selenium. Moreover, there are many gaps in our knowledge of the
interactions of selenium with the immune function of the bovine mammary gland.
Neutrophilic function has been the major point of focus of the research. Other
aspects of the immune response, notably, the activity of Natural Killer (NK) cells as
affected by selenium supplementation in combating both gram-positive and gram-
negative mastitis pathogens, has not been studied. Furthermore, certain cytokines
and mammary epithelial cells and lymphocyte proliferation response have great
implications for mammary gland health and mastitis control. More work is required to
delineate these interactions.

29
3. MATERIALS AND METHODS
3.1 Feeds and Animals
The experiment was performed with 16 pluriparous Holstein-Friesian cows
maintained at the research station of German Federal Institute for Risk Assessment
(BfR) in Marienfelde, Berlin (50°, 24.6´, N; 13°, 22.1`). The research station is
facilitated with the modern individual feeding chambers and milking parlour. The
individual cow data were recorded using leg-band transponders fitted on the cows.
All the experimental cows were in between their 1st and 3rd lactation and calved
during June 2008 to February 2009. At drying off, cows were blocked based on parity
and expected calving date into three groups (5, 5 and 6 cows) in a way to have
minimum variation regarding the parity between different groups and then randomly
allotted to receive additional supplementation. Each cow received either selenium
supplement or placebo individually in addition to the basal diet (Table 3) containing
0.15-0.20 mg selenium/kg DM presuming a dry matter intake of 10 Kg daily and
offered in the form of total mixed ration during the experimental period. Organic and
inorganic selenium supplements were prepared by mixing the ground corn with Sel-
Plex-1000 (Batch No. 71658-2, CNCM-I 3060) and sodium selenite (Na2SeO3)
supplements obtained from the local feed company to give the final selenium content
of 200 mg/kg in the product. All the cows were given a three months adaptation
period with the basal diet before the start of the experiment. Each cow was fed 20
gram of either supplement or placebo at the time of morning milking during the pre
partum period and 30 g during the post partum experimental period. Supplementation
corresponded to an additional intake of 4 and 6 mg selenium/day during the
prepartum and postpartum experimental phases respectively.

30
Table 3 Composition of total mixed ration (TMR) fed as basal diet during the feeding trial
Ingredients %TMR Selenium (µg/kg DM) ±SEM n
Maize silage 75.5 12.2 222653
Hay 4.4 20.6 Straw 4.4 27.0 Beet pulp 4.4 153.2 16.66 Soybean meal 2.2 227.4 15 Rapeseed meal 4.4 87.6 9 Vitamin-mineral mix1 4.4 1680.5 110.4 5Milk concentrate2 177.7 10.22 9
Nutrient composition
Dry matter (%) 49.5 0.88 6Crude protein (%DM) 10.7 0.005 6Crude fat (%DM) 2.7 0.005 6Crude ash (%DM) 5.3 0.015 6Crude fiber (% DM) 17 0.15 6Neutral detergent fiber (%DM) 53.1 4.05 4Acid detergent fiber (%DM) 17.3 0.277 4
1 Contains 5.5% Ca, 1.5% P, 2.5% Mg, and 4.2 % Na, 460000 IU vitamin A, 33500 IU vitamin D3, 500 IU vitamin E and 490 mg CuSO4.5H2O per kg; 3.6 MJ NEL/kg 2 Contains 0.78% Ca, 0.5% P, 0.3% Na, and 10000 IU vitamin A, 800 IU vitamin D3, 90 IU vitamin E and 13 mg CuSO4.5H2O per kg; 7.0 MJ NEL/kg; offered extra as 1 kg for every 3 kg increase in milk production during the lactation
Table 4 Mineral composition (DM basis) of total mixed ration (TMR) fed as basal diet during the feeding trial (n=3)
Minerals Mean ±SEM Calcium (g/kg) 5.6 0.06 Phosphorus (g/kg) 3.4 0.02 Sodium (g/kg) 1.6 Magnesium (g/kg) 2.2 Potassium (g/kg) 10.7 0.07 Manganese (mg/kg) 87.0 0.73 Copper (mg/kg) 19.0 1.09 Cobalt (mg/kg) 0.7 0.06 Zinc (mg/kg) 136.0 0.54 Iron (mg/kg) 398.7 2.58 Selenium (mg/kg) 0.18 0.01
31
3.2 Sampling
All the procedures regarding the management and sampling from the animals were
approved by the Landesamt für Gesundheit und Soziales (LAGeSo). Cows were
sampled 6 and 3 weeks before anticipated calving, within 12 hours after the calving,
and 1 and 12 weeks after calving for blood samples. Colostrum and milk samples
were collected at day 1 after calving and 1, 9, 12, and 15 weeks after calving.
Aliquots of milk samples were frozen at -80°C for subsequent analysis.
3.3 Chemicals and Instruments
Selenium standard solution (1000 mg selenium/l) and hydrochloric, nitric and
perchloric acids were purchased from Merck (Darmstadt, Germany). Skim milk
powder (Standard reference material, NIST 8435) was obtained from LGC Standards
(Wesel, Germany) whereas, 2, 2´-azinobis (3-ethylbenzothiazoline 6-sulfontate)
(ABTS), Trolox standard antioxidant (6 Hydroxy, 2, 5, 7, 8-tetramethylchroman 2-
carboylic acid) and activated manganese oxide were purchased from Sigma-Aldrich
(Steinheim, Germany). The atomic absorption spectrometer (Vario 6 equipped with
H52 hydride system and auto sampler) was made by Analytik Jena AG (Jena,
Germany) whereas microplate reader (Sunrise TC) was from Tecan (Salzburg,
Austria).
3.4 Estimation of Selenium
Total selenium in feeds, supplements and milk was estimated by the hydride
generation atomic absorption spectrometry (HG-AAS). Samples were digested using
a programmable electrically heated digestion block (Tecon, TZP-500). The digestion
process was carried out in a mixture of nitric and perchloric acids by using the quartz
digestion tubes. In the end stage of digestion process 6M hydrochloric acid was
added in the tubes to reduce selenium (VI) to selenium (IV) for hydride generation in
the system. The samples were diluted before measurement to a final volume of 40
ml. The method was standardised using whole milk powder (Standard reference
material, NIST 8435). The analyses of the milk standard reference material resulted
in 121.8 ± 6.62 μg/kg (mean ± SD, n=15) as compared to the reference range value
of 131.0 ± 14 μg/kg. Reference standards were used for every twenty analyses. Ultra
pure deionised water of 18.2 M� cm (4 ppb TOC) obtained from Milli-Q apparatus
was used for making dilutions and washing.

32
3.5 Estimation of Antioxidant Activity
Total antioxidant activity was measured using the Trolox Equivalent Antioxidant
Capacity (TEAC) according to the method of Miller et al. (1996). However, the
method was modified keeping in view the changes suggested by Wang et al. (2004)
regarding the endpoint measurement and adapted to carry out large number of
samples in the standard conditions using the microplate plate reader. The TEAC
assay was originally based on the suppression of the absorbance of the radical
cations of 2, 2´-azinobis (3-ethylbenzothiazoline 6-sulfontate) (ABTS) by antioxidants
in the test sample when ABTS (Figure 4) incubates with peroxidase (metmyoglobin)
and H2O2. The modified procedure requires the production of long living radical cation
(ABTS•+) by the action of ABTS and activated manganese oxide. Briefly, pure ABTS
was dissolved in 5 mM PBS buffer with pH 7.4 to have a final solution of 5 mM ABTS.
The solution was filtered through Wattmann filter paper across the activated
manganese oxide while keeping it under light protection for 12-16 hours for efficient
radical generation. The filtrate was finally passed through 0.2 μm syringe filter (VWR-
cellulose acetate) and kept under light protection. Standard calibration curve was
generated with the average of two values corresponding to blank, 50, 100, 150, 200
and 250 μM/l Trolox solution prepared from 97% Trolox standard antioxidant (6-
hydroxy-2, 5, 7, 8-tetramethylchroman 2-carboylic acid) for the each run. The
absorbance was recorded at 620 nm after the inhibition period of 20 minutes in the
96-well micro plate containing 190 μl of ABTS•+ and 10 μl pre-diluted sample (milk).
Figure 4 Chemical structure of ABTS molecule
3.6 Statistical Analysis
Data obtained was analysed statistically using SPSS 15 (Chicago, USA). Dunett’s
test of Post Hoc comparisons was performed for significance testing of the means of
various groups in a multivariate ANOVA (Field 2005). This test was applied because
it tests the significance of means of treatment groups in comparison with that of a
control. Level of statistical significance was set as 0.05 during the data analysis.
Correlations and regression equations were computed using the same software.

33
4. Results
4.1 Colostrum and Milk Selenium Status
The mean (± SEM) selenium level in colostrum for the control, SeI (Sodium Selenite)
and SeY (selenium yeast) groups was 35.3 ± 1.03 μg/l, 39.1 ± 2.56 μg/l and 67.7 ±
4.11 μg/l respectively in this study. Statistical analysis has revealed that mean
colostrum selenium content of the SeY group is different (P = 0.032) from that of the
SeI and control group animals (P = 0.018). Furthermore, no difference (P = 0.754)
has been observed between the SeI and control groups regarding colostrum
selenium levels. In control group, colostrum selenium content ranged from 20.6 –
60.4 μg/l, whereas for SeI and SeY groups this range was found to be as 25.9 - 58.0
and 39.9 – 106.7 μg/l respectively. The large variation in colostrum selenium content
might be attributed to the genetic factors and to some extent to the health problems
as the intake of the supplement and the placebo was not largely different in all
groups.
In milk, a decrease of 60, 42 and 35 percent has been observed in selenium content
after one week of calving for the control, SeI and SeY groups respectively. It can be
assumed from the results of the present research that milk selenium content has a
declining trend still the steady state is obtained after about 12 weeks of milking. The
average steady state milk (± SEM) selenium content for the control, SeI and SeY
groups has been noticed as 11.6 ± 1.55, 15.4 ± 3.24 and 28.3 ± 6.84 μg/l,
respectively. Statistical analysis of the data revealed that control and SeI groups milk
selenium content at first week after calving was nearly different (P = 0.072) and after
ninth weeks of calving it differed significantly (P < 0.05). No difference (P > 0.05)
could be found between control and SeI groups after 12 and 15 weeks of the
experimental period. It could also be observed that SeY group exhibited more
variations in terms of standard deviations as compared to both others. The results
have been shown graphically in the following figure 5.

34
Figure 5 Colostrum and milk selenium concentrations in various treatment groups.
Each graphical symbol represents the mean ± SEM of respective treatment groups. SeY group differs (P < 0.05) from other groups at all time points. SeI and control cows are not different (P > 0.05)
4.2 Milk Trolox Equivalent Antioxidant Capacity (TEAC)
Milk Trolox equivalent antioxidant capacity (TEAC) values for various treatment
groups in the study have been graphically represented in Figure 6. The results are
the mean of duplicate values measured for each sample on the specific time point
regarding the day of lactation. Each group’s samples have been measured on a
separate 96 well microplate. Separate calibration curves for Trolox concentrations
ranging from 0-250 μM/l generated for each microplate. From the regression
equation and the trend line it was evident that standard calibration curves exhibited
good linearity (R2 = .998 - .999) and were within the comparable absorption range. It
has been noted that TEAC values for the SeY group are significantly different (P <
0.001) from that of control and SeI groups at all time points and SeI group differed (P
< 0.001) from that of control in the same manner. However, negligible differences
have been observed between different time points in all groups. Milk TEAC values of
(mean of all time points ± standard error) have been observed as 586 ± 0.95 μMol/l,

35
557 ± 0.97μMol/l and 540 ± 0.64 μMol/l for the SeY, SeI and control groups
respectively.
Figure 6 Milk TEAC values at various lactation stages in different groups.
All groups differ (P < 0.01) from each other. There is no difference within the groups (P > 0.05)
4.3 Milk Production
Milk production data has been presented in the Table 5. Milk yield was recorded
digitally at the milking parlour during the milking process of the individual cows. Milk
samples from each cow were taken fortnightly during the experimental period for
subsequent analysis of the milk nutrients. No differences among the control and
treatment groups have been observed regarding the milk and nutrient yield. Weiss
and Hogan (2005) have reported the same previously. It can be assumed from the
milk and nutrients yield data that experimental cows were normal producers.

36
Table 5 Milk and nutrients yield in different treatment groups during the feeding trial
Table 6 demonstrates that treatment groups did not differ much regarding their reproductive
and udder health. However, it can be noted that SeI group was less concerned whereas in both
other groups’ number of affected animals remained three during the experimental period.
Seeing the total number of treatments, it can be observed that udder health disorders are not
much different whereas SeY group suffered more (9) as compared to SeI (2) and control (5)
with regard to reproductive health disorders.
Table 6 Health status of experimental cows during feeding trial
Cows No. of times treated Udder Health Reproductive Health Control 1 + 4 + 1 2 + 1 + 2 SeI 1 + 4 1 + 1 SeY 2 + 3 + 1 3 + 1 + 5
Each digit represents an animal and number of treatments it received during the feeding trial.
4.4 Serum Selenium in Cows
Figure 7 exhibits the profile of serum selenium concentration in various treatment
groups on different sampling time points starting from 6 weeks before anticipated
calving until 12th weeks after calving. Experimental cows were not different (P > 0.05)
before supplementation started at 6th week before expected calving. Trend lines for
the control and treatment groups follow different pattern. Control group cows serum
selenium content declines 3 weeks before calving and at the calving from 47.9 ± 5.94
μg/l (Mean ± SEM) to 38.5 ± 4.67 μg/l and 30.6 ± 9.88 μg/l, respectively, after which it
appears to plateau around 35.0 ± 6.56 μg/l. Trend in both the supplemented groups
resembles showing a relative decrease of 8% and 16 % at calving for SeY and SeI

37
groups reactively. This decrease at calving in control group was found as 30%. It has
been noted that both groups differ significantly (P < 0.05) from that of control except
that SeI groups is not different (P = 0.141) at calving from both others. However, it is
indicated that in spite of substantial relative increase, 8-34% at various time points in
the serum selenium level of selenium yeast supplemented cows, SeI and SeY groups
are not different (P > 0.05) in raising the selenium content of serum in dairy cows.
However, P values were noted to be decreasing as 0.476, 0.385, 0.178 and 0.08 at
three weeks before calving, at calving, one week after calving and 12 weeks after
calving respectively.
Figure 7 Serum selenium concentrations of dams in different groups during various physiological stages.
SeY and SeI groups differ (P < 0.05) from Control cows at all time points except at calving when only SeY group is different
4.5 Serum Selenium Level in Calves
Serum selenium content in calves from various treatment groups and at different time
points has been shown in the following Figure 8. Some significant differences in
groups and regarding time points have been observed. The control group was
significantly different (P < 0.05) from SeY group at both the time point (within 12 hrs
after calving and one week after calving). SeY group was also significantly different

38
(P < 0.05) from SeI groups at both time points, however, SeI group calves were only
different from control groups calves at calving in their serum selenium contents.
Serum selenium content at calving for the control, SeI and SeY groups’ calves has
been noted to be (Mean ± SEM) 23.5 ± 2.01, 29.1 ± 3.5, and 38.1 ± 0.96 μg/l
respectively. Whereas one week after calving respective contents increased for
different groups as 28.4 ± 2.03, 37.7 ± 1.23 and 47.7 ± 1.05 μg/l.
Figure 8 Serum selenium concentrations of calves borne to dams in different treatment groups.
Different superscripts within groups and time points denote significant differences (P < 0.05)
4.6 Body Mass of Calves
Body mass of dams and calves measured at various time points have been
presented in Table 7. None of the values was different (P > 0.05). However, calves
live body weight after one week of age was little higher (52 kg as compared to 50 kg)
in SeY group. This can be attributed to the fact that 4 out of 5 calves in SeY group
were male. Dams live body mass decreased at the end of the experimental period
due to calves’ birth.

39
Table 7 Body mass (kg) of cows and calves in various treatment groups
Groups Cows (kg) Calves (kg)
In the start At the end birth After 1 week
Control 654 ± 11 552 ± 47 43 ± 2 50 ± 2 P > 0.05
SeI 703 ± 19 633 ± 23 43 ± 1 50 ± 21 P > 0.05
SeY 672 ± 42 644 ± 5 46 ± 1 52 ± 2 P > 0.05
1 n = 4 ; 2 n = 6 ; *All values are mean ± standard error rounded to nearest kg (n = 5). No difference among groups at a single time point (P > 0.05)
Figure 9 Differences in body mass of calves at various time points
No statistical difference among various groups could be noted.
4.7 Serum TEAC in Cows
Serum TEAC was measured in cows’ samples obtained within 12 hours of calving,
and one and twelve weeks after calving. The results of serum TEAC in dams have
been presented in Figure 10. Although TEAC values were found within a narrow
range (566 – 577 μMol/l), statistical analysis revealed (P < 0.001) differences among
the treatment groups. SeY group exhibited the highest values compared to other
groups in the study. Slightly increased TEAC values at calving time suggest some
sort of homeostatic mechanism to counteract the oxidative stress in this period. It has
also been noted that SeY group is less different (P = 0.056) from other groups in

40
decrease in its TEAC values at 12 weeks of sampling time. No difference (P > 0.05)
has been observed in TEAC at calving and one week after calving in all groups. The
mean serum TEAC values (± SEM) for all time points in control, SeI and SeY groups
have been found to be 566 ±1.39, 570 ± 0.61 and 577 ± 0.50 μMol/l respectively.
Figure 10 Serum TEAC values in cows of various treatment groups.
Groups differ with each other (** = P < 0.01)
4.8 Serum TEAC in Calves
Serum TEAC values were measured in calves within 12 hrs after birth and one
week after calving. The results have been shown graphically in Figure 11. It is
notable that TEAC values in calves’ serum followed a decreasing trend as in
dams regarding time after calving. However, in calves, TEAC values one week
after calving were lower (P < 0.01) as compared to the values in prior samples
obtained within 12 hrs after calving. This is also in contrast to their dams
serum TEAC values, which were not found different (P > 0.05) one week after
calving. The average TEAC values ( Mean ± SEM) for the control, SeI and
SeY groups within 12 hrs after calving have been found to be 567 ± 0.25, 571
± 0.12 and 578 ± 0.5 μMol/l respectively. Whereas, one week after calving
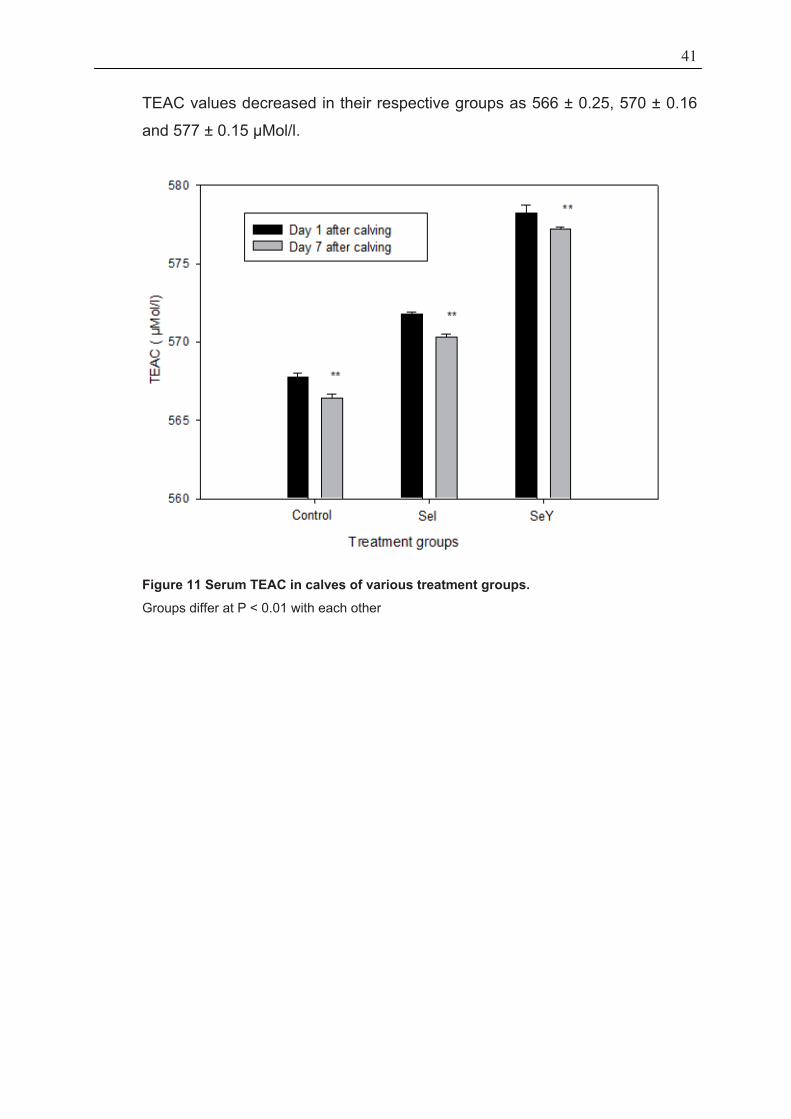
41
TEAC values decreased in their respective groups as 566 ± 0.25, 570 ± 0.16
and 577 ± 0.15 μMol/l.
Figure 11 Serum TEAC in calves of various treatment groups.
Groups differ at P < 0.01 with each other

42
5. DISCUSSION
5.1 Colostrum and Milk Selenium Status
The mean colostrum selenium level in the SeY group has been found below the level
(151μg/l) reported by Weiss and Hogan (2006) who supplemented the experimental
cows rations at the level of 0.3 mg selenium/kg with selenium yeast and sodium
selenite for a period of 60 days before the expected calving. This difference might be
attributed to the daily intake and basal diet selenium concentrations as the relative
increase in the colostrum selenium level of the selenium yeast group as compared to
SeI group has been found exactly the same (1.73 times) in both the studies. It is
important to note that no difference (P = 0.754) has been observed between the SeI
and control groups regarding colostrum selenium levels. These findings are also in
accordance with that of Awadeh et al. (1998a) who described no difference in
colostrums selenium content among the cows consuming approximately 0.98, 3.3
and 7.3 mg selenium/day as SeI supplement. However, their reported values in
colostrum (60-80 μg/l) are much higher than those observed in this study are. This is
probably because of the long duration of supplementation of one year before actually
taking the colostrums samples for selenium analysis. Numerous researchers agreed
that colostrum selenium content is much greater than normal milk (Abdelrahman and
Kincaid 1995; Awadeh et al. 1998a; Ortman et al. 1999; Ortman and Pehrson 1999).
It was found that selenium content in colostrum was 3.04, 2.4 and 2.54 times greater
(P < 0.05) than the average milk selenium concentrations for the control, SeY and
SeI groups respectively. These findings are in contrast with that of Weiss and Hogan
(2005) who reported 3.8 times increase (P < 0.01) in colostrum selenium
concentrations both in selenium yeast and inorganic selenium groups in their study.
In milk, a decrease of 60, 42 and 35 percent has been observed in selenium content
after one week of calving for the control, SeI and SeY groups respectively. It can be
assumed from the results of the present research that milk selenium content does not
take a steady state after about one week of milking. A sharp decreasing trend until
first week after calving is evident. However, prediction of the start of the plateau
effect in milk selenium level from this study is difficult as the next sampling was done
after ninth weeks of lactation. Up until ninth weeks after calving, the control and SeY
groups seemed to attain a plateau level whereas SeI group was not harmonious with

43
other groups in this regard. The average milk selenium content for the control, SeI
and SeY groups for all time points has been noticed as 11.6, 15.4 and 28.3 μg/l,
respectively. Milk from SeY group cows differs significantly (P < 0.05) from that of
control and SeI group cows at all time points considered in the study. On the relative
percentile scale, selenium content of the milk obtained from cows supplemented with
selenium yeast is 83 % higher than the milk from sodium selenite supplemented
cows. This finding is overall in conformance with the results of studies reviewed by
Weiss (2005), who cited a relative increase of 90%. Although milk selenium content
of the SeI group has not been found significantly different (P > 0.05) from that of
control cows, a relative increase of 32% has been noted in our study. These findings
can be explained keeping in view the previous reports that supplementation with SeI
increased milk selenium content when cows were fed rations low in naturally
occurring selenium but there was less impact when cows were fed rations greater in
naturally occurring selenium (Conrad and Moxon 1979). In addition, it was noted that
an increase in selenium intake would not produce important increases in milk
selenium content when cows were fed selenium adequate rations (Aspila 1991). A
recent systematic review (Ceballos et al. 2009) of 42 studies regarding the effect of
oral selenium supplementation on milk selenium concentrations in cattle has reported
that in Americas, selenium supplementation of 6 mg/head per day in the form of
selenium- yeast has resulted in cow’s milk selenium content of 0.37 μmol/l (30 μg/l).
Our study confirms this notion.
Higher levels of selenium in the milk of cows supplemented with selenium yeast can
be explained with the proposition that selenomethionine in selenium yeast source
replaces non-specifically methionine in the milk proteins following the genetic
sequence for the incorporation of methionine in general proteins (Ortman et al. 1999;
Weiss 2005). However, it has also been reported that only one third of total selenium
is in the form of SeMet in the milk of cows fed selenium yeast as the supplement
(Juniper et al. 2006) and therefore the possibility of presence of other selenoproteins
with antioxidant properties cannot be ruled out. It can be concluded that more work is
needed to delineate the incorporation of SeMet in different milk proteins and its effect
on their functional properties. The knowledge regarding the dairy products quality
made from the high selenium milk obtained after selenium yeast supplementation is
still limited.

44
5.2 Total Antioxidant Capacity in Milk
Milk is a rapidly perishable food commodity and development of off-flavours due to
the oxidation of various milk constituents is a major problem for the dairy industry.
Therefore, it is important to study the complex interplay of the prooxidants and
antioxidants in milk (Buettner 1993). Both fat soluble antioxidants and selenium
compounds have been implied in the protection against development of milk off-
flavour (Charmley et al. 1993; Jensen and Nielsen 1996). There is a scientific
controversy whether glutathione peroxidase activity, which is the most important
selenium-related antioxidant, is exhibited or not in milk (Chen et al. 2000; Stagsted
2006). In addition, there is lack of consensus among researchers regarding a
standardized method for the milk total antioxidant capacity estimates. Trolox
equivalent antioxidant capacity (TEAC) and oxygen radical absorbance capacity
(ORAC) are two commonly used assays for the assessment of the antioxidant
capacity of food components (Chen et al. 2003; Huang et al. 2005). We used the
former method owing to its relative simplicity and for tailoring the large number of
samples in the present study.
There is scarcity of the literature available on the topic of total antioxidant capacity as
estimated by TEAC in bovine milk. Bovine milk TEAC values of 1246 and 4560 μMol/l
measured after 10 minutes incubation time at different pH (Chen et al. 2003) 2649
μMol/l and ~5000 μMol/l measured after 3 and 20 minutes incubation time
respectively (Zulueta et al. 2009) and ~ 4600 μMol/l measured after 60 minutes
period of time (Clausen et al. 2009) have been reported. The same is the case with
milk ORAC values, which have been reported between ~5000-30000 μMol/l. There
might be many reasons for this non-conformity. It is evident that time factor is the
most important consideration in these assays. Besides the variations in the
measuring conditions, no information is available regarding feeding regime of cows
from which milk was obtained. Milk samples analysed in this study are assumed to
be low in their vitamin E content because the animals were fed below the normal
dietary requirement for vitamin E in dairy cattle (National Research Council. 2001).
One other reason for the comparatively low TEAC values might be the use of 620 nm
wavelength in the present work. The absorption maxima for the ABTS radical have
been reported as 414, 645, 734 and 815 nm (Re et al. 1999). In the present study,

45
we focussed on the issue of selenium source regarding their TEAC values in milk. It
can be indicated that the differences obtained in milk TEAC values of various
treatment groups might be attributed to their selenium content, which is significantly
higher after supplementing the cows diet with selenium yeast. Although, the same
trend has been observed in serum, more work is emphasized in this regard. This is
implicated for maintaining the milk and dairy product quality. In addition, there is need
to standardize the methods for total antioxidants capacity in milk.
5.3 Milk Selenium and TEAC Relationship
Highly significant Pearson correlation (R2 = .79; P < 0.001) has been observed
between milk TEAC values and selenium levels when data from all the groups was
subjected to statistical analysis. Regression coefficients were calculated for the
overall data and separately for the control and treatment groups (Figure 12 and Table
8). Although the overall model was found to be highly significant (P < 0.001), among
the groups only SeI model was found statistically significant in explaining the positive
correlations between TEAC and selenium level. These results further strengthen the
idea that selenium may have an effect on the milk TEAC levels. Positivity of slopes in
all models indicates that TEAC values are slightly increasing with the increase in
selenium content. These observations are contrary to that found for the serum TEAC
values, which decreased with the increase in serum selenium levels with the passage
of time. A relatively blunt slope in SeY group might be attributed to the fact that
selenium content approximately plateaus around 30 μg/l in milk. Moreover, the mean
selenium content in SeY group at 15th week of lactation was slightly less as
compared to that of 12th week. Although this novel data indicates some sort of
association between milk selenium and TEAC, further work will help delineate the
mechanisms involved.

46
Milk Se (μg/)0 10 20 30 40 50
Milk
TEA
C (μ
Mol
/l)
520
540
560
580
600
620
y = 1.55x + 533R2 = .62
Figure 12 Overall milk selenium and TEAC regression model.
Each data point corresponds to individual cows data collected at 1, 9, 12 and 15 weeks after calving.
Table 8 Regression equations describing the relationship between milk TEAC and selenium levels in various treatment groups
5.4 Milk Production
Milk production and nutrients yield data reveal that cows in experiment were normal
producers and during the experimental period selenium supplementation had no
profound effect on these parameters. No effect of selenium supplementation on the
milk yields has also been previously reported (Weiss and Hogan 2005; Bourne et al.
2008). However, in a survey conducted in Prince Edward Island (Wichtel et al. 2004),
it was noted that selenium-adequate herds had 7.6 % greater milk yield as compared
to selenium-marginal herds.

47
5.5 Serum Selenium Content in Cows
Statistical analysis of the serum selenium data in dams has revealed that there is no
significant difference between SeI and SeY groups. However, both treatment groups
differ from the control cows. These findings seem to be in conformance with that of
Juniper et al. (2006) who reported no difference (P > 0.05) in whole blood selenium
levels of cows with total dietary selenium intake from selenium yeast and sodium
selenite of 6.34 and 5.85 mg/day. The lack of significant differences between sodium
selenite and selenium yeast in raising the blood or serum selenium levels can be
associated with the dietary selenium intake. Significant difference was observed
when cows were consuming 0.24-0.31 mg selenium/kg DM (Knowles et al. 1999;
Ortman and Pehrson 1999). The relative increase in serum selenium levels of SeY
group cows found in this study (8-34%) is in agreement with whole blood selenium
levels in other studies reviewed (Weiss 2005). It is interesting to point out that serum
selenium levels in the control cows are far below the reference values (70 μg/l)
reported as indication of the adequate selenium status in dairy herds (Stowe and
Herdt 1992) notwithstanding that dietary selenium intake from the basal diet (Table 3)
was in accordance with the German recommendations (GfE 2001). These findings
strengthen the results obtained previously in Germany (Gierus et al. 2002) reporting
plasma selenium levels of 37.7μg/l with dietary selenium intakes up to 0.165 mg/kg
DM. It can be speculated that cows might be at the risk of deficiency or at least
vulnerability to disease threat. This provides a base for reconsideration of selenium
dietary recommendation for dairy cows.
Decrease in the serum selenium levels at calving can be attributed to selenium
transfer to calves. A relative increase of 30% has been noted in the calves born to
dams of the SeY group as compared to ones in SeI group. This difference (30%) has
not been found significant (P = 0.33) and is less (37%) than that observed by Weiss
and Hogan (2005). However, one week after being fed on colostrums of their dams, a
significant increase (P < 0.05) of 26 % has been noted in calves of SeY group when
compared with those in SeI group. Again, this difference is comparatively less than
reported previously regarding whole blood of calves (Awadeh et al. 1998a; Gunter et
al. 2003). Possible reasons for this might be long supplementation duration in
previous studies and high supplementation doses in the present investigation.

48
5.6 Selenium Transfer from Cows to Calves
Relationships between serum selenium levels of dams and their calves on the day of
calving and one week after calving have been determined by regression analysis
(Table 9). Overall regression model for all the groups has been presented in the
Figure 13. It is evident that comparatively stronger relationship (R2 = .57, P < 0.01)
exists in the control group. This supports the idea that response to supplementation
is weaker beyond the undefined threshold levels (Juniper et al. 2006). SeY group is
also stronger (R2 = .41, P < 0.05) than SeI group in transferring the dams selenium to
calves.
Cows serum Se level (μg/l)
0 20 40 60 80 100 120 140
Cal
ves
seru
m S
e le
vel (
μg/l)
0
10
20
30
40
50
60
y = 0.3394x + 15.23R2 = .576
Figure 13 Regression model describing the relationship between dams and calves serum selenium levels.
Each data point corresponds to individual cows and calves data collected at calving and 1 week after calving.

49
Table 9 Regression equations describing the relationship between calves and dams serum selenium levels in various treatment groups
5.7 Serum Trolox Equivalent Antioxidant Capacity (TEAC) in Cows
The results of Trolox equivalent antioxidant capacity in serum have been found to
act in accordance with those observed in the milk regarding the treatment effect. On
the other hand, TEAC values in milk and serum differ with respect to the time point
effect. Decreasing trend in TEAC values in serum, contrary to milk, has been noted.
Regression analysis (Table 10 )shows that slight negative correlations exist between
the serum selenium and TEAC values within treatment groups, however, these
models have been found non-significant with very low R2 values in explaining the
negativity of the slopes contrary to the overall model with stronger values (R2 = .406;
P < 0.001). Within the groups, SeY model seems to be comparatively stronger
because selenium content in serum increased more sharply than other groups.
This data is novel as no previous report describes TEAC in serum of cows and
calves. Although a strong indication of the effect of selenium on the total antioxidant
capacity can be noted, further work in this regard can delineate the actual
mechanism involved. It can be speculated from the contrasting findings in milk and
serum regarding the effect of time on TEAC values, that different selenoproteins or
selenium-containing proteins might be present in milk and serum.

50
Table 10 Regression equations describing the relationship between serum selenium and TEAC in dams
Equation Group n R2 Slope SE Intercept SE P <
1 Overall 48 .406 0.120 0.021 564.29 1.45 0.001
2 Control 15 .088 -0.044 0.039 567.23 1.51 0.282 3 SeI 15 .008 -0.004 0.013 571.02 0.93 0.749 4 SeY 15 .091 -0.011 0.007 578.64 0.54 0.117
Dependent variable = TEAC (μMol/l); Independent variable = selenium (μg/l)
Serum Se (μg/l)0 20 40 60 80 100 120 140
Ser
um T
EAC
(μM
ol/l)
555
560
565
570
575
580
585
y = 0.1203x + 564R2 = .406
Figure 14 Regression model describing the relationship between serum selenium and TEAC in dams.
Each data point corresponds to individual cows’ data collected at calving, 1 and 12 weeks after calving

51
5.8 Serum TEAC in Calves
Serum TEAC values in calves have been noted to follow a similar pattern regarding
the treatment effect as noted in dams. Regression analysis (Figure 15) with selenium
and TEAC values data has also generated a model quite similar to that for dams.
Serum Se (μg/l)0 10 20 30 40 50 60
Ser
um T
EA
C (μ
Mol
/l)
562
564
566
568
570
572
574
576
578
580
y = 0.201x + 562R2 = .396
Figure 15 Regression model describing the relationship between calves’ serum selenium and TEAC values.
Each data point corresponds to individual calves data collected within 12 hrs after calving and 1 week after calving

52
6. Trace Element Status in Large Dairy Herds
This work was supported by a grant from Sächsisches Landesamt für Umwelt,
Landwirtschaft und Geologie. The author acknowledges the cooperation and support
rendered by Dr. Steinhöfel and Mrs. Fröhlich.
6.1 Introduction
Scientific research over a long period has proved that many minerals are essential
for the normal growth, physiological functioning and productivity of ruminants. Among
these are included macro and micro minerals. Provision of adequate levels of trace
metals in cattle diet is essential to promote growth and maintain animals in good
health (Blanco-Penedo et al. 2009). Trace elements such as copper, zinc,
manganese, iron and selenium are most important micro minerals for dairy cattle
which are not only essential for the well being of the animals themselves but also
have an importance for the public health owing to their transfer to them through the
milk. As milk is an important component of the daily diets of human beings of all
ages, deficiencies of these essential nutrients in dairy cows rations and consequently
in the milk are likely to be reflected in the human populations. Moreover, trace metals
that are included as mineral supplements may have toxic effects at supra-optimal
concentrations (Underwood and Suttle 2002).
A number of ways can be applied to diagnose the possible deficiencies.
Development of clinical symptoms and identification of post mortem tissue lesions
can give some clue in this regard. However, differential diagnosis of any particular
trace elements deficiency will be difficult because most of them do not show unique
clinical signs or lesions for deficiency. In other instances, indirect proof of the
deficiency can be provided by the positive response to supplementation of the
suspected deficient mineral. This may not be incorrigible as time responsive effects
of clinical signs might occur. It has been noted that trace elements are embedded in
trace enzymes (Köhrle 2000). Although a difficult approach especially when large
herds are concerned, the best way to establish the deficiency of a trace element is by
testing for the unique functional deficit or the deficiency of the specific mineral
containing protein or enzyme.

53
Estimation of the trace elements in various animal tissues of the representative
samples can give an indication of the herds’ mineral status. Usually the liver biopsy
samples, whole blood or serum, milk, urine and hair samples can be used for the
purpose. Liver biopsy is technically demanding in large populations of animals on the
fields (Guyot et al. 2009). Plasma has been described as the most commonly used to
assess copper and zinc status (Kincaid 2001). However, care must be taken about
the feeding regimen, supplementation routine, disease condition and proper number
of samples and standard procedures (Maas 2007) while making tissue analysis a
criterion for the herd mineral status. Different antagonistic and positive correlations
must also be kept in mind.
A survey of 11 selected farms concerning copper, zinc, manganese, iron and
selenium was conducted to assess the trace element nutritional status of dairy cows
and subsequent levels in liver and plasma samples. The objective was to study the
intake, bioavailability and interactions among essential trace elements in large dairy
herds under prevalent feeding practices. The impact on herd health was also a
consideration.
6.2 Farms, Animals and Sampling
A survey of selected trace elements (copper, zinc, manganese, iron and selenium)
was conducted for 11 large commercial dairy herds maintained in the state of
Saxonia, Germany. The project was carried out with the support of Sächsisches
Landesamt für Umwelt, Landwirtschaft und Geologie (Köllitsch). Liver biopsies and
plasma samples were taken from 10 selected animals of each dairy farm. Twenty
(20) samples of TMR were taken and analysed by the Landesamt for the whole
nutrient composition and the data obtained were used for further statistical analysis.
Liver biopsies and plasma samples were analysed for five selected trace elements
composition at the Institute of Animal Nutrition laboratory, Freie Universität Berlin,
using atomic absorption spectrometry (Vario 6 equipped with H52 hydride system
and auto sampler, Analytik Jena AG, Germany). Analytical methods were
standardised using reference standards (Atomic Spectroscopy Quality Control
Standard 21, Perkin Elmer) and the results were within the permissible range (Figure
16). Plasma biochemistry was analysed by the Landeslabor Berlin-Brandenburg,
Berlin.

54
Trace elements
Fe Cu Zn Mn
mg/
l
0
20
40
60
80
100
120
Figure 16 Trace elements results measured compared to a standard
value of 100 mg/l (n=3)
6.3 Statistical Analysis
Data were statistically analysed using SPSS 15 for descriptive statistics and various
correlations. Multiple linear regression models were found out regarding the
interaction of trace elements in feeds and liver tissue. Stepwise regression method
was followed for multiple regression analyses in which feed trace elements, feed
minerals and the remaining nutrient composition was added at consecutive stages.
Level of significance was set as P < 0.05. Kolmogorov-Smirnov (KS) test was run to
determine the normality of data.
6.4 Results and Discussion
Descriptive statistics for the data obtained on feed composition from 11 commercial
dairy farms included in the survey has been summarized in the following Table 11.
Proximate constituent data reveal measured nutrients mean values fall within the
normal range according to the recommended dietary allowances. However, great
farm-to-farm variation can be noted. This is attributable to different farm practices.
The data seem to meet the assumption of normality when subjected to KS test.
Macro minerals mean values have also been found to be little deviating from the
recommended dietary allowances for dairy cattle. It can be noted that large variation
in the sodium and chloride content has rendered the data non-normal. This might

55
have an effect on the dietary cation anion balance and subsequent productive
performance in the concerned herds. Dietary cation anion balance calculated from
the mean values for TMR is +17 milliequivalents that is quite less than the normal
range (+ 20 to + 40 mEq/100 g dietary DM) described for rations for the lactating
dairy cows (Beede 2005).
It is interesting to point out that all trace elements measured in TMR were found to be
more than the recommended dietary allowances. Iron content of the ration has been
noted to be exceptionally high. Overall variation in the trace element composition of
the diet was also high (coefficient of variation, 22% - 43%). This indicates the high
dosage use of mineral supplementation by the farmers or problems with mixing and
homogeneity during the ration preparation could occur.
Table 11 Descriptive summary of feed composition (DM basis) data collected from 11 different farms in Saxonia (Germany)
Number Nutrient Mean* Range SEM KS statistics **
Proximate Constituents 1 Dry matter g/kg 414.1 320.7 - 487.5 2.9 .720 2 Crude ash g/kg 69.3 56.3 - 85.9 0.46 .294 3 Crude protein g/kg 170.4 137.4 - 213.9 1.04 .765 4 Crude fibre g/kg 165.6 141.2 - 204.0 0.91 .763 5 Crude fat g/kg 43.4 30.4 - 55.5 0.42 .941 6 Starch g/kg 228.3 159.3 - 276.2 1.82 .974 7 Sucrose g/kg 44.0 11.9 - 93.4 1.36 .0558 Soluble organic
matter g/kg 754.6 664.7 - 792.4 1.71 .43
Mineral Constituents 9 Calcium g/kg 7.2 3.9 -10.2 0.09 .238 10 Phosphorus g/kg 4.2 3.1 - 5.1 0.03 .833 11 Sodium g/kg 1.8 0.3 - 9.3 0.09 <.00112 Magnesium g/kg 2.4 1.7 -3.1 0.02 .008 13 Potassium g/kg 14.3 9.8 - 20.1 0.15 .743 14 Sulphur g/kg 2.1 1.7 - 2.7 0.01 .356 15 Chloride g/kg 4.6 1.9 -18.9 0.18 .00116 Copper mg/kg 23.9 9.4 - 44.5 0.56 .331 17 Zinc mg/kg 97.1 42.0 -163.0 2.31 .227 18 Manganese mg/kg 71.9 32.4 - 119.1 1.63 .285 19 Iron mg/kg 374.6 208.1 - 655.4 6.17 .419 20 Selenium mg/kg 0.5 0.06 - 1.2 0.02 .696
*Mean values obtained after the analysis of 200 samples **Kolmogorov-Smirnov (KS test) statistical values > 0.05 meet the assumption of the normality of the data

56
The whole feed data from 11 farms were subjected to Principal Component Analysis
(PCA). The purpose of PCA is to express the main information contained in the initial
variables in a lower number of variables, the so-called principal components (latent
variables), which describe the main variations in the data. Practically PCA transforms
a number of possibly correlated variables in a smaller number of uncorrelated
variables or principal components. This statistics helps to perform the multiple
regression analysis in situations where a large number of independent variables
might have a cumulative effect on the dependent variable. By applying PCA on the
feed composition data from the Saxonian dairy herds, it is observed that trace
elements manganese, zinc, copper and selenium fall within the same principal
component one. This means this component might have an effect as a group on the
trace element concentrations in the liver or plasma or any other parameter of interest.
Moreover, this also shows a trend of supplementation of these minerals. These latent
variables generated could further be used in simple or multiple regression analysis.
This is a novel result and application of this statistical tool to large sets of feed data
should be further studied to find out interactions and relationships among various
nutrients. Following table 12 and the related scree plot diagram shows a distinct
group of trace elements with very high loadings in the component 1.
Table 12 Component matrix resulted from the principal component analysis of feed data of 11 dairy herds
Feed Factors Extracted 1 2 3 4
Zinc 0.919 Sodium 0.815
Manganese 0.815 Selenium 0.782 Copper 0.777 Sulphur 0.920
Crude Protein 0.910 Phosphorus 0.441 0.757 Magnesium 0.527 0.613 Potassium 0.901
Starch -0.804 Crude Ash 0.787 Dry Matter 0.889 Sucrose 0.726
Extractions method: Principal component analysis Rotations method: Varimax with Kaiser-Normalisation Kaiser Meyer Olkin = 0.70 Bartlett test of sphericity P < 0.001, (df = 91)

57
Figure 17 Screeplot diagram of the feed components
Milk production, plasma biochemistry and the liver trace elements data have been
summarised in the following Table 13. It is evident that milk production data for two
consecutive months did not much differ. Plasma biochemistry parameters reveal the
cows to be healthy.
Liver tissue concentrations of trace elements are subjected to changes, depending
on the age, production stage and disease condition of the animal and might exhibit
large variations. Zinc liver content in this study has been found lower than recently
reported (Nriagu et al. 2009) as 29.5 mg/kg (fresh weight) in grazing dairy cows.
However, copper concentration in our study (134.5 mg/kg fresh weight) has been
found quite high as compared to 20.4 mg/kg in the study of Nriagu et al. (2009). A
previous report described a range of 1.4 – 134.5 mg/kg fresh weight in grazing cattle
in Queensland, Australia (Kramer et al. 1983). Whereas, mean selenium
concentration are relatively close to each other (0.43 mg/kg ~ 0.72 mg/kg). These
findings indicate an expected lower content of trace element in the grazing cows,
which can be due to the lower soil content. Contrary result regarding zinc might be
associated with some particular antagonistic relationships.

58
Table 13 Descriptive summaries of various parameters measured in samples collected from 11 different farms in Saxonia (Germany)
Nutrient Mean* Range SEM KS statistics
** Milk November 2008
Milk yield (kg) 38.02 20.60 – 59.30 0.69 .905 Fat (%) 3.76 2.0 – 5.75 0.07 .868 Protein (%) 3.37 2.65 – 4.14 0.03 .908 Milk urea (mg/l) 245.54 130 - 380 4.60 .230 Somatic cell count * 1000 229 9 - 3624 54.55 .000Lactose (%) 4.80 4.22 – 5.17 0.02 .183 Days in milk 122 56 - 297 3.34 .383 Protein corrected milk (kg) 36.79 20.90 – 64.20 0.64 .765
Milk December 2008 Milk yield (kg) 36.11 20.20 – 54.90 0.65 .924 Fat (%) 3.94 2.63 – 5.89 0.06 .998 Protein (%) 3.45 2.81 – 4.18 0.03 .946 Milk urea (mg/l) 257.72 140 - 430 4.86 .820 Somatic cell count * 1000 159 4.92 – 24.17 35.02 .000 Lactose (%) 4.77 4.22 – 5.28 0.02 .169 Days in milk 154 91 - 321 3.31 .326 Protein corrected milk (kg) 35.84 19.20 – 50.30 0.59 .940
Plasma Biochemistry ALAT (μkat/l) 0.84 0.55 – 1.18 0.01 .423 ASAT (μkat/l) 1.89 0.89 – 3.26 0.05 .059 Bilirubin (μmol/l) 4.16 1.40 – 8.10 0.09 .065 Bilirubin indirect (μmol/l) 4.02 0 – 7.80 0.01 .015 Bilirubin direct (μmol/l) 0.13 0 – 0.50 0.10 .000 Ferritin (ng/l) 30.97 3.80 – 161.40 2.00 .047
Plasma Trace Elements Zinc (mg/l) 1.51 (n=94) 0.39 - 2.77 0.06 .195 Copper (mg/l) 1.78 (n=106) 0.18 - 8.09 0.15 .002Manganese (mg/l) 0.80 (n=54) 0.02 - 4.20 0.13 .642 Selenium (mg/l) 0.101 (n=106) 0.05 – 0.17 1.85 .275 Iron (mg/l) 1.71 (n=66) 0.09 - 6.07 0.13 .355
Liver Trace Elements (Fresh matter basis)Zinc (mg/kg) 18.26 (n=106) 1.5 – 46.7 0.90 .185 Copper (mg/kg) 134.58 (n=105) 1.4 – 372 6.81 .85 Manganese (mg/kg) 7.22 (n=106) 0.29 – 52.5 0.71 .001 Iron (mg/kg) 89.17 (n=108) 3 – 278 6.35 .033 Selenium (mg/kg) 0.721 (n=104) 0.122 – 1.55 0.04 .272
*Mean values obtained after the analysis of 110 samples, for trace elements n is specified in brackets **Kolmogorov-Smirnov statistical values > 0.05 meet the assumption of the normality of the data

59
Multiple correlations and regression models among trace elements in feeds and liver
tissue have been sorted out. The results are presented in the Table 14 and Table 16.
Pearson correlation matrix among the liver trace elements (Table 14) clearly
indicates strong positive and negative correlations among various trace minerals.
zinc and copper have been shown to exhibit significant positive correlations with
manganese and selenium liver contents and with each other. Strong positive
correlation (R = .35, P < .001) between zinc and copper are comparatively higher
than previously reported (R = .19, P = .004) by Nriagu et al. (2009).
It can be noted that high iron concentrations in the liver are having strong negative
correlations with all other trace elements in the liver. iron, sulphur, molybdenum and
stress have been described as the antagonists to copper, zinc and manganese
bioavailability in dairy cows (Nockels et al. 1993).
Table 14 Pearson correlation matrix for various trace elements in liver tissues
Zinc Copper Manganese Selenium Liver Zinc R = .353 R = .358 R = .229
P <0.001 P <0.001 P = 0.018 N = 104 N = 104 N = 106
Copper R = .353 R = .227 R = .613
P < 0.001 P =0 .021 P <0.001N = 104 N = 102 N = 105
Manganese R = .358 R = .227 R = .008
P = 0.001 P =0.021 P =0.937 N = 104 N = 102 N = 104
Selenium R = .229 R = .613 R = .008
P = 0.018 P <0.001 P = 0.937 N = 106 N = 105 N = 104
Iron R = -.433 R = -.503 R = -.257 R = -.266 P < 0.001 P <0.001 P = 0.008 P = 0.006 N = 105 N = 104 N = 105 N = 106
When all data on the feed composition and trace mineral in liver tissues were
subjected to multiple linear regression analysis in a stepwise method, models were
generated (Table 16). It is evident that trace elements included in the analysis have
been found to be interacting with one and other in positive and negative relationships.

60
Selenium, copper and manganese in the feed have been found to increase their
respective liver concentration whereas zinc and iron have negative relationship.
Overall, it can be concluded that trace elements in feeds show antagonism towards
one another of various magnitude. Possible reasons could be the chemical affinity of
transition metals towards various biomolecules in the physiological system of
ruminants. More work is ascertained in this regard.
Feed (μg/kg DM)
200 400 600 800
Live
r (μg
/kg
fresh
mat
ter)
400
600
800
1000
1200
1400
1600
Se
P = 0.095
Figure 18 Feed and liver selenium relationship in Saxonian dairy farms

61
Feed (mg/kg DM)
40 60 80 100 120 140 160
Live
r (m
g/kg
fres
h m
atte
r)
0
5
10
15
20
25
30
35
Zn
P = 0.029
Figure 19 Feed and liver zinc relationship in Saxonian dairy farms
Feed (mg/kg DM)
10 15 20 25 30 35 40
Live
r (m
g/kg
fres
h m
atte
r)
60
80
100
120
140
160
180
200
220
Cu
P = 0.28
Figure 20 Feed and liver copper relationship in Saxonian dairy farms

62
Feed (mg/kg DM)
200 300 400 500
Live
r (m
g/kg
fres
h m
atte
r)
20
40
60
80
100
120
140
Fe
P = 0.685
Figure 21 Feed and liver iron relationship in Saxonian dairy farms
Feed (mg/kg DM)
40 60 80 100 120
Live
r (m
g/kg
fres
h m
atte
r)
0
2
4
6
8
10
12
14
16
18
Mn
P = 0.406
Figure 22 Feed and liver manganese relationship in Saxonian dairy farms

63
Table 15 Regression equations describing relationship between feed and liver tissues concentrations of various trace elements
Trace Element R R2 F Ratio Constant Coefficient t p
Selenium .524 .274 3.40 360.11 888.66 1.84 0.095Zinc .653 .427 6.70 33.36 -.15 -2.58 0.029Copper .358 .128 1.32 83.59 2.13 1.15 0.280Manganese .279 .078 0.76 11.69 -.06 -.87 0.406Iron .138 .019 .175 109.81 -.06 -.41 0.685
Table 16 Multiple linear regression models describing the relationship among liver trace elements (dependent) and feed composition (independent)
Dependent variable
Independent variables
R2 F Ratio p Standardised Coefficient t p
Selenium .960 12.03 0.033 -9.658 2.99 0.040Se 1.702 5.49 0.012Cu 0.118 0.47 0.688 Zn -0.773 -2.10 0.127 Mn -0.818 -2.46 0.091 Fe -0.280 -1.73 0.182 ELOS 0.799 3.35 0.044
Zinc .883 6.06 0.053 53.310 3.94 0.017Zn -0.913 -1.78 0.149 Cu -0.309 -1.32 0.255 Mn -0.214 -0.70 0.523 Fe 0.076 0.32 0.766 Se 0.494 1.10 0.333
Copper .960 11.86 0.034 -100.340 -1.67 0.193 Cu 0.018 0.11 0.919 Zn -.673 -1.93 0.149 Mn -1.026 -4.15 0.025Fe 0.064 .39 0.723 Se 0.731 2.23 0.111 Crude Ash 0.959 6.22 0.008
Manganese .984 30.49 0.009 -3.340 -0.46 0.676 Mn 0.155 0.87 0.450 Fe 0.189 1.42 0.251 Se -0.173 -0.89 0.435 Zn -0.312 -1.25 0.297 Cu -0.471 -4.45 0.021K 0.818 6.86 0.006
Iron .998 176.91 0.006 258 14.23 0.005Fe -0.535 -6.34 0.024Se 0.476 5.13 0.036Zn -0.576 -4.59 0.044Cu 0.543 13.11 0.006Mn 0.789 11.21 0.008K -0.378 -4.16 0.053 Crude Ash -0.373 -5.03 0.037

64
Data on various parameters of milk production and trace element concentrations in
liver were subjected to multiple linear regression analysis to find out the relationships
among these variables. The results have been presented in Table 17. It can be noted
that liver copper concentrations are having strong positive impact on the daily milk
yield whereas zinc concentration are negatively correlated to milk yield. Somatic cell
count has also been found to be negatively related with milk yield. This is according to
Rainard and Riollet, (2006) who described that SCC decreased with the progress in
lactation. Age of the cows has an effect on the SCC. With the increase in age, SCC in
milk is also increased. This is logically attributable to the wear and tear in mammary
gland tissues occurred with the increase in age. It is also evident from the strong
positive correlation (R = .365; P < 0.001) noted between SCC and the age of the
animal.
Table 17 Multiple linear regression models describing the relationship among liver trace elements and various parameters of herd performance
*Beta in (variables, which can be included in the original model with these values)

65
7. CONCLUSION The research carried out thus far regarding the possible role of selenium in dairy cow
nutrition has been primarily focused on the broad areas of effects of organic and
inorganic selenium sources on selenium status, bioavailability and transfer to
offspring and GSHPx activities and subsequent impact on the immune function. Still
there are gaps in our present set of knowledge, which should be filled. The lower limit
of 0.2 ppm of selenium in diets is generally regarded as a level below which the
immune system might be vulnerable. Although, in our study no adverse health effects
in the control group could be noted, the significantly lower selenium levels in serum,
milk and selenium transfer to offspring compared to the other groups may pretend
some sort of risk. Previous findings about significant increases in the milk and serum
selenium levels as a result of the selenized yeast supplementation in the diets have
been strengthened with the results of the present study. Although distribution of
selenium in different milk and protein fractions has been worked out, our knowledge
regarding the presence and characterization of selenoproteins in milk and their
effects on dairy consumers and possible influence on technical properties of dairy
products is still poor. Mechanisms behind the positive impact of selenium yeast on
the total antioxidant capacity as observed in this study and the expected
improvement in the milk quality are not fully elucidated. It can be argued that
selenium might be interacting with the fatty acids present in the milk.
Survey findings have revealed a general trend of over supplementation for trace
minerals in dairy rations. Minerals antagonistic relationships must be considered
while formulating rations.
Important areas for further research and recommendations on the topic are following:
Dietary recommendations for selenium in dairy cows rations should take into
consideration different bioavailability of selenium sources, however, more data
are needed considering the biological function
Interactions with other micronutrients (copper, zinc, manganese and iron) and
mammary gland trace element homeostasis should be studied further
Milk selenoproteins and selenium-containing proteins should be more extensively
characterised
Standardised methods for total antioxidant capacity are needed to be established

66
8. REFERENCES
Abdelrahman, M.M., & Kincaid, R.L. (1995). Effect of Selenium Supplementation of
Cows on Maternal Transfer of Selenium to Fetal and Newborn Calves. Journal of
Dairy Science, 78, 625-630.
Ali-Vehmas, T., Vikerpuur, M., Fang, W., & Sandholm, M. (1997). Giving selenium
supplements to dairy cows strengthens the inflammatory response to intramammary
infection and induces a growth-suppressing effect on mastitis pathogens in whey.
Zentralblatt Veterinarmedizin A, 44, 559-571.
Alluwaimi, A.M. (2004). The cytokines of bovine mammary gland: prospects for
diagnosis and therapy. Research in Veterinary Science, 77, 211-222.
Aspila, P. (1991). Metabolism of Selenite, Selenomethionine and Feed-Incorporated
Selenium in Lactating Goats and Dairy-Cows. Journal of Agricultural Science in
Finland, 63, 9-73.
Awadeh, F.T., Abdelrahman, M.M., Kincaid, R.L., & Finley, J.W. (1998a). Effect of
selenium supplements on the distribution of selenium among serum proteins in cattle.
Journal of Dairy Science, 81, 1089-1094.
Awadeh, F.T., Kincaid, R.L., & Johnson, K.A. (1998b). Effect of level and source of
dietary selenium on concentrations of thyroid hormones and immunoglobulins in beef
cows and calves. Journal of Animal Science, 76, 1204-1215.
Bannerman, D.D., Paape, M.J., Goff, J.P., Kimura, K., Lippolis, J.D., & Hope, J.C.
(2004). Innate immune response to intramammary infection with Serratia marcescens
and Streptococcus uberis. Veterinary Research, 35, 681-700.
Beede, D.K. (2005). Formulation of rations with optimal cations and anions (DCAD)
for lactation. Proceedings of Tri-State Dairy Nutrition Conference, USA (pp. 93 -112).
Behne, D., & Wolters, W. (1983). Distribution of Selenium and Glutathione-
Peroxidase in the Rat. Journal of Nutrition, 113, 456-461.
67
Beilstein, M.A., & Whanger, P.D. (1986a). Chemical forms of selenium in rat tissues
after administration of selenite or selenomethionine. Journal of Nutrition, 116, 1711-
1719.
Beilstein, M.A., & Whanger, P.D. (1986b). Deposition of dietary organic and inorganic
selenium in rat erythrocyte proteins. Journal of Nutrition, 116, 1701-1710.
Blanco-Penedo, I., Shore, R.F., Miranda, M., Benedito, J.L., & López-Alonso, M.
(2009). Factors affecting trace element status in calves in NW Spain. Livestock
Science, 123, 198-208.
Bourne, N., Wathes, D.C., Lawrence, K.E., McGowan, M., & Laven, R.A. (2008). The
effect of parenteral supplementation of vitamin E with selenium on the health and
productivity of dairy cattle in the UK. Veterinary Journal, 177, 381-387.
Boyne, R., & Arthur, J.R. (1979). Alterations of Neutrophil Function in Selenium-
Deficient Cattle. Journal of Comparative Pathology, 89, 151-158.
Buettner, G.R. (1993). The Pecking Order of Free-Radicals and Antioxidants - Lipid-
Peroxidation, Alpha-Tocopherol, and Ascorbate. Archives of Biochemistry and
Biophysics, 300, 535-543.
Burton, J.L., & Erskine, R.J. (2003). Immunity and mastitis - Some new ideas for an
old disease. Veterinary Clinics of North America-Food Animal Practice, 19, 1-45.
Burvenich, C., Van Merris, V., Mehrzad, J., Diez-Fraile, A., & Duchateau, L. (2003).
Severity of E-coli mastitis is mainly determined by cow factors. Veterinary Research,
34, 521-564.
Cao, Y.Z., Maddox, J.F., Mastro, A.M., Scholz, R.W., Hildenbrandt, G., & Reddy,
C.C. (1992). Selenium Deficiency Alters the Lipoxygenase Pathway and Mitogenic
Response in Bovine Lymphocytes. Journal of Nutrition, 122, 2121-2127.
Capuco, A.V., Mein, G.A., Nickerson, S.C., Jack, L.J.W., Wood, D.L., Bright, S.A.,
Aschenbrenner, R.A., Miller, R.H., & Bitman, J. (1994). Influence of Pulsationless
Milking on Teat Canal Keratin and Mastitis. Journal of Dairy Science, 77, 64-74.

68
Ceballos, A., Sanchez, J., Stryhn, H., Montgomery, J.B., Barkema, H.W., & Wichtel,
J.J. (2009). Meta-analysis of the effect of oral selenium supplementation on milk
selenium concentration in cattle. Journal of Dairy Science, 92, 324-342.
Cebra, C.K., Heidel, J.R., Crisman, R.O., & Stang, B.V. (2003). The relationship
between endogenous cortisol, blood micronutrients, and neutrophil function in
postparturient Holstein cows. Journal of Veterinary Internal Medecine, 17, 902-907.
Charmley, E., Nicholson, J.W.G., & Zee, J.A. (1993). Effect of Supplemental Vitamin-
E and Selenium in the Diet on Vitamin-E and Selenium Levels and Control of
Oxidized Flavor in Milk from Holstein Cows. Canadian Journal of Animal Science, 73,
453-457.
Chen, J., Lindmark-Mansson, H., & Akesson, B. (2000). Optimisation of a coupled
enzymatic assay of glutathione peroxidase activity in bovine milk and whey.
International Dairy Journal, 10, 347-351.
Chen, J., Lindmark-Mansson, H., Gorton, L., & Akesson, B. (2003). Antioxidant
capacity of bovine milk as assayed by spectrophotometric and amperometric
methods. International Dairy Journal, 13, 927-935.
Clausen, M.R., Skibsted, L.H., & Stagsted, J. (2009). Characterization of Major
Radical Scavenger Species in Bovine Milk through Size Exclusion Chromatography
and Functional Assays. Journal of Agricultural and Food Chemistry, 57, 2912-2919.
Conrad, H.R., & Moxon, A.L. (1979). Transfer of Dietary Selenium to Milk. Journal of
Dairy Science, 62, 404-411.
Craven, N., & Williams, M.R. (1985). Defenses of the Bovine Mammary-Gland
against Infection and Prospects for Their Enhancement. Veterinary Immunology and
Immunopathology, 10, 71-127.
Detoledo, L.R.A., & Perry, T.W. (1985). Distribution of Supplemental Selenium in the
Serum, Hair, Colostrum, and Fetus of Parturient Dairy-Cows. Journal of Dairy
Science, 68, 3249-3254.

69
Diplock, A.T., Caygill, C.P.J., Jeffery, E.H., & Thomas, C. (1973). Nature of Acid-
Volatile Selenium in Liver of Male Rat. Biochemical Journal, 134, 283-293.
Drackley, J.K. (1999). Biology of dairy cows during the transition period: The final
frontier? Journal of Dairy Science, 82, 2259-2273.
Field, A. (2005). Discovering statistics using SPSS. SAGE publications limited.
Finlay, B.B., & Hancock, R.E. (2004). Can innate immunity be enhanced to treat
microbial infections? Nature Reviews Microbiology, 2, 497-504.
Ganther, H.E., & Kraus, R.J. (1984). Identification of Hydrogen Selenide and Other
Volatile Selenols by Derivatization with 1-Fluoro-2,4-Dinitrobenzene. Analytical
Biochemistry, 138, 396-403.
Gassmann, T. (1916). Der Nachweis des Selens im Knochen und Zahngewebe.
Hoppe-Seyler's Zeitschrift Physiologische Chemie, 97, 307-310.
Gerloff, B.J. (1992). Effect of Selenium Supplementation on Dairy-Cattle. Journal of
Animal Science, 70, 3934-3940.
Gershwin, L.J., S. Krakowka, & Olsen., R.G. (1995). Immunoglobulins. In Miller, A.
(Ed.) Immunology and Immunopathology of Domestic Animals (p. 34). St. Louis, MO,
USA: Mosby Press.
GfE (2001). Ausschuss für Bedarfsnormen Der Gesellschaft.für
Ernahrungsphysiologie. In, Empfehlungen zur Energie und Nahrstoffversorgung der
Milchkühe und Aufzuchtrinder. DLG Verlag. Frankfurt am Main, Germany
Gierus, M., Schwarz, F.J., & Kirchgessner, M. (2002). Selenium supplementation and
selenium status of dairy cows fed diets based on grass, grass silage or maize silage.
Journal of Animal Physiology and Animal Nutrition, 86, 74-82.
Glass, R.S., Singh, W.P., Jung, W., Veres, Z., Scholz, T.D., & Stadtman, T.C. (1993).
Monoselenophosphate - Synthesis, Characterization, and Identity with the

70
Prokaryotic Biological Selenium Donor, Compound Sepx. Biochemistry, 32, 12555-
12559.
Goldammer, T., Zerbe, H., Molenaar, A., Schuberth, H.J., Brunner, R.M., Kata, S.R.,
& Seyfert, H.M. (2004). Mastitis increases mammary mRNA abundance of beta-
defensin 5, toll-like-receptor 2 (TLR2), and TLR4 but not TLR9 in cattle. Clinical and
Diagnostic Laboratory Immunology, 11, 174-185.
Grace, N.D., Lee, J., Mills, R.A., & Death, A.F. (1997). Influence of Se status on milk
Se concentrations in dairy cows. New Zealand Journal of Agricultural Research, 40,
75-78.
Grasso, P.J., Scholz, R.W., Erskine, R.J., & Eberhart, R.J. (1990). Phagocytosis,
bactericidal activity, and oxidative metabolism of milk neutrophils from dairy cows fed
selenium-supplemented and selenium-deficient diets. American Journal of Veterinary
Research, 51, 269-274.
Gunter, S.A., Beck, P.A., & Phillips, J.M. (2003). Effects of supplementary selenium
source on the performance and blood measurements in beef cows and their calves.
Journal of Animal Science, 81, 856-864.
Guyot, H., Saegerman, C., Lebreton, P., Sandersen, C., & Rollin, F. (2009).
Epidemiology of trace elements deficiencies in Belgian beef and dairy cattle herds.
Journal of Trace Elements in Medicine and Biology, 23, 116-123.
Gyang, E.O., Stevens, J.B., Olson, W.G., Tsitsamis, S.D., & Usenik, E.A. (1984).
Effects of Selenium-Vitamin-E Injection on Bovine Polymorphonucleated Leukocytes
Phagocytosis and Killing of Staphylococcus-Aureus. American Journal of Veterinary
Research, 45, 175-177.
Hassoun, B.S., Palmer, I.S., & Dwivedi, C. (1995). Selenium Detoxification by
Methylation. Research Communications in Molecular Pathology and Pharmacology,
90, 133-142.

71
Hemingway, R.G. (1999). The influences of dietary selenium and vitamin E intakes
on milk somatic cell counts and mastitis in cows. Veterinary Research
Communication, 23, 481-499.
Hibbitt, K.G., Cole, C.B., & Reiter, B. (1969). Antimicrobial Proteins Isolated from
Teat Canal of Cow. Journal of General Microbiology, 56, 365-370.
Hill, A.W., Heneghan, D.J.S., & Williams, M.R. (1983). The Opsonic Activity of
Bovine-Milk Whey for the Phagocytosis and Killing by Neutrophils of Encapsulated
and Non-Encapsulated Escherichia-Coli. Veterinary Microbiology, 8, 293-300.
Hogan, J.S., Smith, K.L., Weiss, W.P., Todhunter, D.A., & Schockey, W.L. (1990).
Relationships among Vitamin-E, Selenium, and Bovine Blood Neutrophils. Journal of
Dairy Science, 73, 2372-2378.
Huang, D.J., Ou, B.X., & Prior, R.L. (2005). The chemistry behind antioxidant
capacity assays. Journal of Agricultural and Food Chemistry, 53, 1841-1856.
Imlay, J.A. (2008). Cellular defenses against superoxide and hydrogen peroxide.
Annual Review of Biochemistry, 77, 755-776.
Jensen, D.L., & Eberhart, R.J. (1981). Total and Differential Cell Counts in Secretions
of the Nonlactating Bovine Mammary-Gland. American Journal of Veterinary
Research, 42, 743-747.
Jensen, S.K., & Nielsen, K.N. (1996). Tocopherols, retinol, beta-carotene and fatty
acids in fat globule membrane and fat globule core in cows' milk. Journal of Dairy
Research, 63, 565-574.
Jukola, E., Hakkarainen, J., Saloniemi, H., & Sankari, S. (1996). Blood selenium,
vitamin E, vitamin A, and beta-carotene concentrations and udder health, fertility
treatments, and fertility. Journal of Dairy Science, 79, 838-845.
Juniper, D.T., Phipps, R.H., Jones, A.K., & Bertin, G. (2006). Selenium
supplementation of lactating dairy cows: Effect on selenium concentration in blood,
milk, urine, and Feces. Journal of Dairy Science, 89, 3544-3551.

72
Kincaid, R.L. (2001). Assessment of trace mineral status of ruminants: a review.
Journal of Animal Science, 1-10.
Knowles, S.O., Grace, N.D., Wurms, K., & Lee, J. (1999). Significance of amount and
form of dietary selenium on blood, milk, and casein selenium concentrations in
grazing cows. Journal of Dairy Science, 82, 429-437.
Kobayashi, Y., Ogra, Y., & Suzuki, K.T. (2001). Speciation and metabolism of
selenium injected with (82) Se-enriched selenite and selenate in rats. Journal of
Chromatography B, 760, 73-81.
Köhrle, J. (2000). The selenoenzyme family of deiodinase isozymes controls local
thyroid hormone availability. Reviews in Endocrine and Metabolic Disorders, 1, 49-
58.
Kommisrud, E., Osteras, O., & Vatn, T. (2005). Blood selenium associated with
health and fertility in Norwegian dairy herds. Acta Veterinaria Scandinavica, 46, 229-
240.
Kramer, H.L., Steiner, J.W., & Vallely, J. (1983). Trace Element Concentrations in the
Liver, Kidney, and Muscle of Queensland Cattle. Bulletin of Environmental
Contamination and Toxicology 30, 588-594.
Lacetera, N., Bernabucci, U., Ronchi, B., & Nardone, A. (1996). Effects of selenium
and vitamin E administration during a late stage of pregnancy on colostrum and milk
production in dairy cows, and on passive immunity and growth of their offspring.
American Journal of Veterinary Research, 57, 1776-1780.
Larsen, H.J., Moksnes, K., & Overnes, G. (1988). Influence of selenium on antibody
production in sheep. Reserach in Veterinary Science, 45, 4-10.
Leijh, P.C.J., Vandenbarselaar, M.T., Vanzwet, T.L., Dubbeldemanrempt, I., &
Vanfurth, R. (1979). Kinetics of Phagocytosis of Staphylococcus-Aureus and
Escherichia-Coli by Human-Granulocytes. Immunology, 37, 453-465.

73
Leitner, G., Eligulashvily, R., Krifucks, O., Perl, S., & Saran, A. (2003). Immune cell
differentiation in mammary gland tissues and milk of cows chronically infected with
Staphylococcus aureus. Journal of Veterinary Medicine Series B-Infectious Diseases
and Veterinary Public Health, 50, 45-52.
Leyan, V., Wittwer, F., Contreras, P.A., & Kruze, J. (2004). Serum and colostrum
immunoglobulin concentrations from selenium deficient cows and in the blood of their
calves. Archivos De Medicina Veterinaria, 36, 155-162.
Maas, J. (2007). Diagnostic considerations for evaluating nutritional problems in
cattle. Veterinary Clinics of North America: Food Animal Practice, 23, 527-539.
Maddox, J.F., Reddy, C.C., Eberhart, R.J., & Scholz, R.W. (1991). Dietary Selenium
Effects on Milk Eicosanoid Concentration in Dairy-Cows During Coliform Mastitis.
Prostaglandins, 42, 369-378.
MAFF (1983). Mineral Trace Element and Vitamin Allowances for Ruminants.
(London, HMSO): Ministry of Agriculture, Fisheries and Food, Department of
Agriculture for Scotland, Department of Agriculture for Northern Ireland, United
Kingdom Agricultural Supply Trade Association, British Veterinary Association.
Mainville, A.M., Odongo, N.E., Bettger, W.J., McBride, B.W., & Osborne, V.R. (2009).
Selenium uptake by ruminal microorganisms from organic and inorganic sources in
dairy cows. Canadian Journal of Animal Science, 89, 105-110.
Maiorino, M., Mauri, P., Roveri, A., Benazzi, L., Toppo, S., Bosello, V., & Ursini, F.
(2005a). Primary structure of the nuclear forms of phospholipid hydroperoxide
glutathione peroxidase (PHGPx) in rat spermatozoa. Federation of European
Biochemical Societies (FEBS) Letters, 579, 667-670.
Maiorino, M., Roveri, A., Benazzi, L., Bosello, V., Mauri, P., Toppo, S., Tosatto,
S.C.E., & Ursini, F. (2005b). Functional interaction of phospholipid hydroperoxide
glutathione peroxidase with sperm mitochondrion-associated cysteine-rich protein
discloses the adjacent cysteine motif as a new substrate of the selenoperoxidase.
Journal of Biological Chemistry, 280, 38395-38402.

74
Malbe, M., Attila, M., & Atroshi, F. (2006). Possible involvement of selenium in
Staphylococcus aureus inhibition in cow's whey. Journal of Animal Physiology and
Animal Nutrition (Berlin), 90, 159-164.
Malbe, M., Klaassen, E., Kaartinen, L., Attila, M., & Atroshi, F. (2003). Effects of oral
selenium supplementation on mastitis markers and pathogens in Estonian cows.
Veterinary Therapeutics, 4, 145-154.
Malbe, M., Klaassen, M., Fang, W., Myllys, V., Vikerpuur, M., Nyholm, K., Sankari,
S., Suoranta, K., & Sandholm, M. (1995b). Comparisons of selenite and selenium
yeast feed supplements on Se-incorporation, mastitis and leucocyte function in Se-
deficient dairy cows. Zentralblatt Veterinärmedizin A, 42, 111-121.
Maus, R.W., Martz, F.A., Belyea, R.L., & Weiss, M.F. (1980). Relationship of Dietary
Selenium to Selenium in Plasma and Milk from Dairy-Cows. Journal of Dairy
Science, 63, 532-537.
Mcdonald, J.S., & Anderson, A.J. (1981). Total and Differential Somatic-Cell Counts
in Secretions from Noninfected Bovine Mammary-Glands - the Early Nonlactating
Period. American Journal of Veterinary Research, 42, 1360-1365.
McKenzie, R.C., Rafferty, T.S., & Beckett, G.J. (1998). Selenium: An essential
element for immune function. Immunology Today, 19, 342-345.
Mehrzad, J., Duchateau, L., Pyorala, S., & Burvenich, C. (2002). Blood and milk
neutrophil chemiluminescence and viability in primiparous and pluriparous dairy cows
during late pregnancy, around parturition and early lactation. Journal of Dairy
Science, 85, 3268-3276.
Mehta, A., Rebsch, C.M., Kinzy, S.A., Fletcher, J.E., & Copeland, P.R. (2004).
Efficiency of mammalian selenocysteine incorporation. Journal of Biological
Chemistry, 279, 37852-37859.
Miller, N.J., Sampson, J., Candeias, L.P., Bramley, P.M., & RiceEvans, C.A. (1996).
Antioxidant activities of carotenes and xanthophylls. Federation of European
Biochemical Societies (FEBS)Letters, 384, 240-242.
75
Miller, R.H., Bitman, J., Bright, S.A., Wood, D.L., & Capuco, A.V. (1992). Effect of
Clinical and Subclinical Mastitis on Lipid-Composition of Teat Canal Keratin. Journal
of Dairy Science, 75, 1436-1442.
Mukherjee, R. (2008). Selenium and vitamin E increases polymorphonuclear cell
phagocytosis and antioxidant levels during acute mastitis in riverine buffaloes.
Veterinary Research Communication, 32, 305-313.
Mullan, N.A., Carter, E.A., & Nguyen, K.A.T. (1985). Phagocytic and Bactericidal
Properties of Bovine Macrophages from Non-Lactating Mammary-Glands. Research
in Veterinary Science, 38, 160-166.
Muniz-Naveiro, O., Dominguez-Gonzalez, R., Bermejo-Barrera, A., De Juan, J.A.C.,
Bermudez, J.M.F., Pereiras, A.G., Santamaria, A.L., Lede, I.M., Puente, J.V.,
Gomez, L.F.C., & Bermejo-Barrera, P. (2005). Selenium content and distribution in
cow's milk supplemented with two dietary selenium sources. Journal of Agricultural
and Food Chemistry, 53, 9817-9822.
Murphy, J.M., & Stuart, O.M. (1953). The Effect of Introducing Small Numbers of
Streptococcus-Agalactiae (Cornell-48 Strain) Directly into the Bovine Teat Cavity.
Cornell Veterinarian, 43, 290-310.
Myllys, V., Honkanenbuzalski, T., Virtanen, H., Pyorala, S., & Muller, H.P. (1994).
Effect of Abrasion of Teat Orifice Epithelium on Development of Bovine
Staphylococcal Mastitis. Journal of Dairy Science, 77, 446-452.
National Research Council. (2001). Nutrient Requirements of Dairy Cattle, 7th Rev.
Ed. Washington D.C., USA: National Academy of Sciences.
Ndiweni, N., & Finch, J.M. (1995). Effects of in-Vitro Supplementation of Bovine
Mammary-Gland Macrophages and Peripheral-Blood Lymphocytes with Alpha-
Tocopherol and Sodium Selenite - Implications for Udder Defenses. Veterinary
Immunology and Immunopathology, 47, 111-121.

76
Ndiweni, N., & Finch, J.M. (1996). Effects of in vitro supplementation with alpha-
tocopherol and selenium on bovine neutrophil functions: Implications for resistance to
mastitis. Veterinary Immunology and Immunopathology, 51, 67-78.
Nockels, C.F., Debonis, J., & Torrent, J. (1993). Stress Induction Affects Copper and
Zinc Balance in Calves Fed Organic and Inorganic Copper and Zinc Sources. Journal
of Animal Science, 71, 2539-2545.
Nriagu, J., Boughanen, M., Linder, A., Howe, A., Grant, C., Rattray, R., Vutchkov, M.,
& Lalor, G. (2009). Levels of As, Cd, Pb, Cu, Se and Zn in bovine kidneys and livers
in Jamaica. Ecotoxicology and Environmental Safety, 72, 564-571.
Ortman, K., Andersson, R., & Holst, H. (1999). The influence of supplements of
selenite, selenate and selenium yeast on the selenium status of dairy heifers. Acta
Veterinaria Scandinavica, 40, 23-34.
Ortman, K., & Pehrson, B. (1999). Effect of selenate as a feed supplement to dairy
cows in comparison to selenite and selenium yeast. Journal of Animal Science, 77,
3365-3370.
Oviedo-Boyso, J., Valdez-Alarcon, J.J., Cajero-Juarez, M., Ochoa-Zarzosa, A.,
Lopez-Meza, J.E., Bravo-Patino, A., & Baizabal-Aguirre, V.M. (2007). Innate immune
response of bovine mammary gland to pathogenic bacteria responsible for mastitis.
Journal of Infection, 54, 399-409.
Paape, M., Mehrzad, J., Zhao, X., Detilleux, J., & Burvenich, C. (2002). Defense of
the bovine mammary gland by polymorphonuclear neutrophil leukocytes. Journal of
Mammary Gland Biology and Neoplasia, 7, 109-121.
Paape, M.J., Bannerman, D.D., Zhao, X., & Lee, J.W. (2003). The bovine neutrophil:
Structure and function in blood and milk. Veterinary Research, 34, 597-627.
Panousis, N., Roubies, N., Karatzias, H., Frydas, S., & Papasteriadis, A. (2001).
Effect of selenium and vitamin E on antibody production by dairy cows vaccinated
against Escherichia coli. Veterinary Record, 149, 643-646.

77
Park, B.G., Yoo, C.I., Kim, H.T., Kwon, C.H., & Kim, Y.K. (2005). Role of mitogen-
activated protein kinases in hydrogen peroxide-induced cell death in osteoblastic
cells. Toxicology, 215, 115-125.
Park, Y.H., Joo, Y.S., Park, J.Y., Moon, J.S., Kim, S.H., Kwon, N.H., Ahn, J.S., Davis,
W.C., & Davies, C.J. (2004). Characterization of lymphocyte subpopulations and
major histocompatibility complex haplotypes of mastitis-resistant and susceptible
cows. Journal of Veterinary Science, 5, 29-39.
Parnham, M.J., Bittner, C., & Winkelmann, J. (1983). Chemi-Luminescence from
Mouse Resident Macrophages - Characterization and Modulation by Arachidonate
Metabolites. Immunopharmacology, 5, 277-291.
Paulrud, C.O. (2005). Basic concepts of the bovine teat canal. Veterinary Reserach
Communications, 29, 215-245.
Pavlata, L., Prasek, J., Filipek, J., & Pechova, A. (2004). Influence of parenteral
administration of selenium and vitamin E during pregnancy on selected metabolic
parameters and colostrum quality in dairy cows at parturition. Veterinarni Medicina,
49, 149-155.
Pehrson, B., Ortman, K., Madjid, N., & Trafikowska, U. (1999). The influence of
dietary selenium as selenium yeast or sodium selenite on the concentration of
selenium in the milk of suckler cows and on the selenium status of their calves.
Journal of Animal Science, 77, 3371-3376.
Persson, K.W., Colditz, I.G., Lun, S., & Ostensson, K. (2003). Cytokines in mammary
lymph and milk during endotoxininduced bovine mastitis. Research in Veterinary
Science, 74, 31-36.
Politis, I., Zhao, X., Mcbride, B.W., & Burton, J.H. (1992). Function of Bovine
Mammary Macrophages as Antigen-Presenting Cells. Veterinary Immunology and
Immunopathology, 30, 399-410.
Rainard, P. (2003). The complement in milk and defense of the bovine mammary
gland against infections. Veterinary Research, 34, 647-670.

78
Rainard, P., & Poutrel, B. (2000). Generation of complement fragment C5a in milk is
variable among cows. Journal of Dairy Science, 83, 945-951.
Rainard, P., & Riollet, C. (2006). Innate immunity of the bovine mammary gland.
Veterinary Research, 37, 369-400.
Re, R., Pellegrini, N., Proteggente, A., Pannala, A., Yang, M., & Rice-Evans, C.
(1999). Antioxidant activity applying an improved ABTS radical cation decolorization
assay. Free Radical Biology and Medicine, 26, 1231-1237.
Riollet, C., Rainard, P., & Poutrel, B. (2000). Differential induction of complement
fragment C5a and inflammatory cytokines during intramammary infections with
Escherichia coli and Staphylococcus aureus. Clinical and Diagnostic Laboratory
Immunology, 7, 161-167.
Rotruck, J.T., Pope, A.L., Ganther, H.E., Swanson, A.B., Hafeman, D.G., & Hoekstra,
W.G. (1973). Selenium - Biochemical Role as a Component of Glutathione
Peroxidase. Science, 179, 588-590.
Roy, M., Kiremidjianschumacher, L., Wishe, H.I., Cohen, M.W., & Stotzky, G. (1994).
Supplementation with Selenium and Human Immune Cell Functions .1. Effect on
Lymphocyte-Proliferation and Interleukin-2 Receptor Expression. Biological Trace
Element Research, 41, 103-114.
Saini, S.S., Allore, B., Jacobs, R.M., & Kaushik, A. (1999). Exceptionally long CDR3H
region with multiple cysteine residues in functional bovine IgM antibodies. Eur. J.
Immunol., 29, 2420-2426.
Salman, S., Khol-Parisini, A., Schafft, H., Lahrssen-Wiederholt, M., Hulan, H.W.,
Dinse, D., & Zentek, J. (2009). The role of dietary selenium in bovine mammary
gland health and immune function. Animal Health Research Reviews, 10, 21-34.
Schalm, O.W., Carroll, E., & Jain, N.C. (1971). Number and types of somatic cells in
normal and mastitic milk. Philadelphia: Lea and Febiger.

79
Schwarz, K., & Foltz, C.M. (1957). Selenium as an Integral Part of Factor-3 against
Dietary Necrotic Liver Degeneration. Journal of the American Chemical Society, 79,
3292-3293.
Shiobara, Y., & Suzuki, K.T. (1998). Binding of selenium (administered as selenite) to
albumin after efflux from red blood cells. Journal of Chromatography B-Analytical
Technologies in the Biomedical and Life Sciences, 710, 49-56.
Shtrichman, R., & Samuel, C.E. (2001). The role of gamma interferon in antimicrobial
immunity. Current Opinion Microbiology, 4, 251-259.
Smith, K.L., Harrison, J.H., Hancock, D.D., Todhunter, D.A., & Conrad, H.R. (1984).
Effect of Vitamin-E and Selenium Supplementation on Incidence of Clinical Mastitis
and Duration of Clinical Symptoms. Journal of Dairy Science, 67, 1293-1300.
Sordillo, L.M., Campos, M., & Babiuk, L.A. (1991). Antibacterial Activity of Bovine
Mammary-Gland Lymphocytes Following Treatment with Interleukin-2. Journal of
Dairy Science, 74, 3370-3375.
Sordillo, L.M., Kendall, J.T., Corl, C.M., & Cross, T.H. (2005). Molecular
characterization of a saposin-like protein family member isolated from bovine
lymphocytes. Journal of Dairy Science, 88, 1378-1390.
Sordillo, L.M., & Nickerson, S.C. (1988). Morphologic Changes in the Bovine
Mammary-Gland During Involution and Lactogenesis. American Journal of Veterinary
Research, 49, 1112-1120.
Sordillo, L.M., ShaferWeaver, K., & DeRosa, D. (1997). Immunobiology of the
mammary gland. Journal of Dairy Science, 80, 1851-1865.
Sordillo, L.M., & Streicher, K.L. (2002). Mammary gland immunity and mastitis
susceptibility. Journal of Mammary Gland Biology and Neoplasia, 7, 135-146.
Spallholz, J.E. (1990). Selenium and Glutathione-Peroxidase - Essential Nutrient and
Antioxidant Component of the Immune-System. Antioxidant Nutrients and Immune
Functions, 262, 145-158.

80
Spears, J.W. (2003). Trace mineral bioavailability in ruminants. Journal of Nutrition,
133, 1506s-1509s.
Stabel, J.R., Reinhardt, T.A., & Nonnecke, B.J. (1991). Effect of selenium and
reducing agents on in vitro immunoglobulin M synthesis by bovine lymphocytes.
Journal of Dairy Science, 74, 2501-2506.
Stagsted, J. (2006). Absence of both glutathione peroxidase activity and glutathione
in bovine milk. International Dairy Journal, 16, 662-668.
Stowe, H.D., & Herdt, T.H. (1992). Clinical-Assessment of Selenium Status of
Livestock. Journal of Animal Science, 70, 3928-3933.
Surai, P.F. (2006). Selenium in nutrition and health. Nottingham NG11 0AX, United
Kingdom: Nottingham University Press.
Suzuki, K.T. (2005). Metabolomics of selenium : Se metabolites based on speciation
studies. Journal of Health Science, 51, 107-114.
Suzuki, K.T., Shiobara, Y., Itoh, M., & Ohmichi, M. (1998). Selective uptake of
selenite by red blood cells. Analyst, 123, 63-67.
Swecker, W.S., Jr., Eversole, D.E., Thatcher, C.D., Blodgett, D.J., Schurig, G.G., &
Meldrum, J.B. (1989). Influence of supplemental selenium on humoral immune
responses in weaned beef calves. American Journal of Veterinary Research, 50,
1760-1763.
Underwood, E.J., & Suttle, N.F. (2002). Los minerales en la nutrición del Ganado.
Zaragoza, Acribia.
Waller, K.P. (2000). Mammary gland immunology around parturition - Influence of
stress, nutrition and genetics. Biology of the Mammary Gland, 480, 231-245.
Wang, C.C., Chu, C.Y., Chu, K.O., Choy, K.W., Khaw, K.S., Rogers, M.S., & Pang,
C.P. (2004). Trolox-equivalent antioxidant capacity assay versus oxygen radical
absorbance capacity assay in plasma. Clinical Chemistry, 50, 952-954.

81
Weiss, W.P. (2005). Selenium sources for dairy cattle. Tri-State Dairy Nutrition
Conference, May 2-3, USA.
Weiss, W.P., & Hogan, J.S. (2005). Effect of selenium source on selenium status,
neutrophil function, and response to intramammary endotoxin challenge of dairy
cows. Journal of Dairy Science, 88, 4366-4374.
Weiss, W.P., Hogan, J.S., Smith, K.L., & Hoblet, K.H. (1990). Relationships among
selenium, vitamin E, and mammary gland health in commercial dairy herds. Journal
of Dairy Science, 73, 381-390.
Wichtel, J.J., Craigie, A.L., Varelaalvarez, H., & Williamson, N.B. (1994). The Effect
of Intraruminal Selenium Pellets on Growth-Rate, Lactation and Reproductive
Efficiency in Dairy-Cattle. New Zealand Veterinary Journal, 42, 205-210.
Wichtel, J.J., Keefe, G.P., Van Leeuwen, J.A., Spangler, E., McNiven, M.A., &
Ogilvie, T.H. (2004). The selenium status of dairy herds in Prince Edward Island.
Canadian Veterinary Journal, 45, 124-132.
Williams, M.R., & Hill, A.W. (1982). A Role for Igm in the Invitro Opsonization of
Staphylococcus-Aureus and Escherichia-Coli by Bovine Polymorphonuclear
Leukocytes. Research in Veterinary Science, 33, 47-53.
Wood, S.M., Beckham, C., Yosioka, A., Darban, H., & Watson, R.R. (2000). beta-
Carotene and selenium supplementation enhances immune response in aged
humans. Integrated Medicine, 2, 85-92.
Yaeger, M.J., Neiger, R.D., Holler, L., Fraser, T.L., Hurley, D.J., & Palmer, I.S.
(1998). The effect of subclinical selenium toxicosis on pregnant beef cattle. Journal of
Veterinary Diagnostic Investigation, 10, 268-273.
Yamaguchi, T., Hiratsuka, M., Asai, K., Kai, K., & Kumagai, K. (1999). Differential
distribution of T lymphocyte subpopulations in the bovine mammary gland during
lactation. Journal of Dairy Science, 82, 1459-1464.

82
Yamanaka, H., Hisaeda, K., Hagiwara, K., Kirisawa, R., & Iwai, H. (2000). ELISA for
bovine interleukin-1 receptor antagonist and its application to mastitic sera and whey.
Journal of Veterinary Medical Science, 62, 661-664.
Zulueta, A., Maurizi, A., Frigola, A., Esteve, M.J., Coli, R., & Burini, G. (2009).
Antioxidant capacity of cow milk, whey and deproteinized milk. International Dairy
Journal, 19, 380-385.

83
APPENDIX 1 Data on Feeding Trial with Dairy Cows Conducted at BfR
Serum Se content (µg/l) in cows
Cows Weeks relative to calving SeI Feeding - 6 W - 3 W Birth 1 W 12 W 321 6.12.08 75.23 84.39 68.52 88.27 83.65 338 18.9.08 46.39 56.91 60.66 69.55 97.45 340 26.10.08 31.00 47.83 48.83 67.58 49.56 357 30.5.08 51.68 62.31 39.52 60.35 74.04 361 16.7.08 42.12 60.87 42.98 74.91 58.48 SeY 322 26.1.2009 66.39 75.24 68.07 86.19 126.10 349 27.5.08 31.31 47.96 35.78 67.00 55.35 353 18.9.08 56.12 59.08 67.85 85.35 122.30 355 30.12.08 62.59 74.76 62.85 76.67 85.18 359 16.7.08 43.97 70.76 47.98 76.22 96.72 412 24.11.08 66.41 78.95 89.06 118.30 99.06
Control 311 27.5.08 43.92 38.40 12.32 36.69 20.04 351 2.6.08 50.95 30.14 9.10 34.92 25.98 352 27.5.08 28.40 26.50 23.44 33.00 29.03 360 2.8.08 51.31 51.32 56.35 14.94 58.39 431 26.1.09 64.90 46.16 51.65 56.26 54.55
Serum TEAC values (µMol/l) in cows
Cows Weeks relative to calving SeI Feeding Birth 1 W 12 W 321 6.12.08 571.48 571.68 570.36 338 18.9.08 572.66 570.96 569.91 340 26.10.08 570.46 570.18 569.46 357 30.5.08 571.13 570.63 569.81 361 16.7.08 571.26 570.86 570.06 SeY 322 26.1.2009 578.03 578.06 582.38 349 27.5.08 577.53 577.51 576.58 353 18.9.08 577.11 577.16 576.66 355 30.12.08 577.43 577.76 576.73 359 16.7.08 577.73 578.41 576.63 412 24.11.08 577.71 577.61 576.08
Control 311 27.5.08 566.48 566.73 565.61 351 2.6.08 566.48 567.11 565.53 352 27.5.08 567.46 566.86 565.16 360 2.8.08 566.41 566.06 565.78 431 26.1.09 566.96 566.33 556.63

84
Calves born to the experimental cows Calves Sex Serum Se (µg/l) Serum TEAC (µMol/l)
SeI Birth 1 W Birth 1 W 321 F 44.06 43.10 571.76 570.13 338 M 32.92 37.17 571.73 570.36 340 F 29.08 31.32 571.96 570.46 357 F 10.20 39.37 561.21 561.21 361 dead SeY 322 F 44.42 48.85 578.56 577.28 349 M 36.85 41.20 577.33 576.96 353 M 31.30 43.32 578.38 577.16 355 M 40.36 53.15 578.53 577.18 359 dead 412 M 37.33 51.96 567.81 567.81
Control 311 M 20.83 41.54 568.13 566.13 351 F 8.09 26.69 567.66 566.48 352 F 23.72 30.61 567.93 566.53 360 F 32.75 13.14 567.76 566.81 431 M 32.19 29.82 567.51 566.31
Milk TEAC values (µMol/l) in cows
Cows Weeks relative to calving SeI 1 W 9 W 12 W 15 W 321 557.99 558.69 557.44 557.89 338 555.89 557.64 557.64 558.64 340 556.69 557.49 557.69 557.44 357 557.34 557.54 557.49 557.54 361 556.49 557.94 557.64 557.94 SeY322 585.82 586.97 587.25 586.72 349 586.07 586.42 586.62 586.00 353 586.25 587.05 587.37 587.42 355 584.17 586.82 587.05 588.15 359 585.62 585.87 586.42 587.57 412 586.32 587.57 587.50 587.85
Control311 540.20 541.55 541.47 542.00 351 540.80 540.90 542.22 543.62 352 539.65 540.47 540.75 540.97 360 540.57 541.27 541.57 541.50 431 540.02 541.22 541.62 541.20

85
APPENDIX 2 Saxonian Dairy Herds Data – Feed Composition Fa
rm 1
Nutrients N Minimum Maximum Mean SEM Dry matter g/kg 19 388.10 465.35 427.87 5.97Crude ash
g/kg
DM
19 56.90 63.52 60.08 0.55Crude protein 19 163.22 191.47 177.58 1.91ELOS 19 595.12 775.76 733.67 12.24Crude fibre 19 140.99 186.85 163.80 3.12Crude fat 19 34.18 62.32 45.33 1.81Starch 19 218.12 249.24 235.30 2.11Sucrose 19 27.19 48.03 36.37 1.57Calcium 19 4.52 8.61 6.34 0.27Phosphorus 19 4.03 5.16 4.55 0.06Sodium 19 0.64 1.61 1.10 0.07Magnesium 19 2.10 3.17 2.62 0.08Potassium 19 12.01 14.21 13.05 0.17Sulphur 19 2.00 2.69 2.33 0.04Chloride 19 1.79 3.49 2.49 0.11Copper
mg/
kg D
M 19 9.66 39.70 20.99 2.01
Zinc 19 40.75 173.46 91.58 9.46Manganese 19 32.03 71.37 49.09 2.85Iron 19 249.03 374.65 290.27 6.75Selenium 19 0.15 0.76 0.46 0.05
Farm
2
Dry matter g/kg 21 367.71 483.75 412.97 5.27Crude ash
g/kg
DM
21 58.56 77.37 68.45 0.91Crude protein 21 128.29 214.73 184.46 4.08ELOS 21 706.22 764.05 740.00 3.29Crude fibre 21 161.52 193.65 176.72 2.06Crude fat 21 31.13 43.74 38.95 0.64Starch 21 173.73 241.98 208.02 4.48Sucrose 21 43.85 61.64 51.26 1.23Calcium 21 5.37 10.55 8.01 0.30Phosphorus 21 3.25 4.95 4.29 0.08Sodium 21 0.29 1.17 0.75 0.06Magnesium 21 1.99 2.62 2.31 0.03Potassium 21 13.16 18.36 15.35 0.29Sulphur 21 1.99 2.73 2.37 0.04Chloride 21 1.79 4.26 3.07 0.14Copper
mg/
kg D
M 21 8.53 47.21 28.32 2.51
Zinc 21 38.34 135.09 84.52 6.21Manganese 21 33.81 92.61 65.60 3.71Iron 21 285.90 472.28 387.97 9.46Selenium 21 0.07 0.81 0.44 0.05

86
Fa
rm 3
Nutrients N Minimum Maximum Mean SEM
Dry matter g/kg 20 433.27 485.59 468.90 3.66Crude ash
g/kg
DM
20 72.68 83.37 77.32 0.75Crude protein 20 163.32 194.58 183.40 1.69ELOS 20 731.27 779.19 756.52 2.68Crude fibre 20 142.98 169.57 154.52 1.54Crude fat 20 36.61 42.58 40.47 0.36Starch 20 200.63 227.16 212.43 1.72Sucrose 20 75.49 95.74 86.94 1.30Calcium 20 6.62 8.62 7.86 0.11Phosphorus 20 4.16 4.97 4.62 0.05Sodium 20 1.00 1.43 1.25 0.03Magnesium 20 2.46 3.06 2.84 0.03Potassium 20 16.16 18.06 17.02 0.09Sulphur 20 2.13 2.58 2.40 0.03Chloride 20 3.60 5.02 4.10 0.08Copper
mg/
kg D
M 20 18.15 23.88 21.14 0.37
Zinc 20 70.24 99.64 84.11 1.93Manganese 20 46.40 63.81 53.34 0.92Iron 20 269.32 559.43 348.17 14.03Selenium 20 0.21 0.50 0.35 0.02
Farm
4
Dry matter g/kg 21 414.55 460.49 432.72 2.92Crude ash
g/kg
DM
21 62.13 74.76 66.13 0.73Crude protein 21 144.36 177.73 159.17 1.92ELOS 21 760.37 796.01 781.68 2.41Crude fibre 21 133.19 169.67 150.09 1.99Crude fat 21 30.39 43.51 34.82 0.78Starch 21 206.68 283.57 248.65 4.06Sucrose 21 36.25 78.26 55.51 2.86Calcium 21 5.20 9.20 6.82 0.24Phosphorus 21 3.18 4.45 3.70 0.06Sodium 21 1.00 1.93 1.30 0.05Magnesium 21 1.70 2.55 2.03 0.04Potassium 21 11.68 17.76 14.63 0.33Sulphur 21 1.99 2.55 2.19 0.03Chloride 21 2.43 5.20 3.21 0.13Copper
mg/
kg D
M 21 11.19 23.97 14.40 0.81
Zinc 21 40.28 87.59 52.97 2.52Manganese 21 39.33 76.88 50.87 1.80Iron 21 324.49 511.22 400.79 11.57Selenium 21 0.08 0.53 0.20 0.02

87
Farm
5
Nutrients N Minimum Maximum Mean SEM Dry matter g/kg 20 314.91 452.45 380.41 7.78Crude ash
g/kg
DM
20 61.49 79.55 75.02 1.04Crude protein 20 133.19 222.28 160.00 4.18ELOS 20 706.78 811.92 751.72 5.26Crude fibre 20 124.79 212.70 177.94 4.45Crude fat 20 36.49 60.22 42.20 1.07Starch 20 131.30 263.96 203.42 6.47Sucrose 20 24.18 50.34 34.76 1.75Calcium 20 5.41 7.43 6.58 0.11Phosphorus 20 3.50 5.42 4.11 0.09Sodium 20 0.88 1.88 1.47 0.05Magnesium 20 1.85 2.55 2.21 0.04Potassium 20 11.68 24.06 16.33 0.52Sulphur 20 1.59 2.76 2.01 0.05Chloride 20 2.72 4.24 3.73 0.10Copper
mg/
kg D
M 20 16.54 29.55 23.62 0.78
Zinc 20 60.98 109.06 83.30 2.85Manganese 20 59.17 98.24 77.46 2.17Iron 20 283.40 444.14 358.61 10.94Selenium 20 0.22 0.62 0.40 0.03
Farm
6
Dry matter g/kg 20 369.78 400.68 383.49 1.93Crude ash
g/kg
DM
20 69.13 83.32 72.68 0.73Crude protein 20 157.03 195.36 177.86 2.04ELOS 20 706.53 751.72 733.42 2.26Crude fibre 20 158.60 198.02 176.13 1.71Crude fat 20 40.11 48.93 45.71 0.49Starch 20 147.16 213.13 192.01 3.13Sucrose 0 Calcium 20 6.69 7.85 7.30 0.07Phosphorus 20 4.57 5.35 5.01 0.05Sodium 20 2.34 3.04 2.72 0.04Magnesium 20 2.76 3.29 3.01 0.03Potassium 20 12.86 18.09 14.75 0.26Sulphur 20 2.02 2.46 2.24 0.02Chloride 20 5.31 7.13 6.22 0.10Copper
mg/
kg D
M 20 34.41 42.62 38.56 0.49
Zinc 20 133.71 165.36 153.14 1.91Manganese 20 91.65 118.76 107.37 1.49Iron 20 314.43 420.41 343.90 5.89Selenium 20 0.33 0.55 0.46 0.02

88
Farm
7
Nutrients N Minimum Maximum Mean SEM Dry matter g/kg 22 338.14 383.33 364.73 2.88Crude ash
g/kg
DM
22 59.71 83.29 74.33 1.07Crude protein 22 150.96 178.63 166.70 1.54ELOS 22 760.25 786.45 772.20 1.39Crude fibre 22 152.00 172.62 163.44 1.34Crude fat 22 42.35 50.63 45.46 0.52Starch 22 190.65 249.79 219.59 3.49Sucrose 22 18.76 37.02 31.04 0.89Calcium 22 6.11 9.19 7.71 0.13Phosphorus 22 3.43 4.33 3.91 0.04Sodium 22 1.13 1.95 1.64 0.04Magnesium 22 2.14 2.75 2.41 0.03Potassium 22 15.33 18.44 16.74 0.17Sulphur 22 1.82 2.25 2.05 0.02Chloride 22 4.72 6.75 5.88 0.09Copper
mg/
kg D
M 22 20.48 30.89 26.14 0.55
Zinc 22 91.77 156.56 126.67 3.12Manganese 22 87.05 123.93 110.58 2.06Iron 22 294.80 403.26 355.99 6.72Selenium 22 0.55 0.88 0.70 0.02
Farm
8
Dry matter g/kg 18 384.37 455.96 425.43 5.43Crude ash
g/kg
DM
18 59.40 77.39 66.54 1.28Crude protein 18 164.83 215.36 180.37 2.97ELOS 18 747.41 790.46 765.91 2.78Crude fibre 18 139.60 169.19 156.89 1.79Crude fat 18 35.42 43.62 39.98 0.68Starch 18 233.01 282.87 256.73 3.37Sucrose 18 41.32 65.13 55.30 1.49Calcium 18 4.62 7.03 5.79 0.17Phosphorus 18 3.69 4.96 4.24 0.06Sodium 18 1.38 4.02 2.46 0.17Magnesium 18 2.11 2.73 2.30 0.04Potassium 18 11.55 15.12 13.17 0.26Sulphur 18 1.99 2.95 2.27 0.05Chloride 18 3.48 8.67 5.66 0.34Copper
mg/
kg D
M 18 12.98 36.35 23.26 1.81
Zinc 18 48.74 171.39 107.47 9.30Manganese 18 56.66 113.58 79.71 4.90Iron 18 317.19 921.56 417.01 31.57Selenium 18 0.33 1.32 0.78 0.07

89
Farm
9
Nutrients N Minimum Maximum Mean SEM Dry matter g/kg 20 307.22 375.96 356.26 4.54Crude ash
g/kg
DM
20 55.64 73.71 66.02 1.32Crude protein 20 138.39 181.30 161.28 2.44ELOS 20 722.05 774.15 749.16 3.19Crude fibre 20 151.85 192.40 164.69 2.44Crude fat 20 43.97 59.26 51.57 0.89Starch 20 217.25 284.21 252.81 3.70Sucrose 20 9.08 24.71 18.05 0.83Calcium 20 3.81 11.30 8.44 0.50Phosphorus 20 2.96 3.89 3.48 0.05Sodium 20 0.32 1.24 0.84 0.07Magnesium 20 1.58 2.31 2.00 0.05Potassium 20 9.66 11.40 10.32 0.10Sulphur 20 1.89 2.22 2.05 0.02Chloride 20 2.22 4.18 3.30 0.14Copper
mg/
kg D
M 20 9.08 29.96 20.43 1.58
Zinc 20 40.13 123.56 85.21 6.49Manganese 20 32.37 86.54 63.39 4.47Iron 20 429.62 657.99 517.34 14.81Selenium 20 0.05 0.73 0.43 0.05
Farm
10
Dry matter g/kg 20 390.95 475.12 428.85 4.71Crude ash
g/kg
DM
20 56.07 86.16 70.99 1.99Crude protein 20 155.83 197.23 174.23 1.99ELOS 20 742.12 791.87 772.42 2.53Crude fibre 20 156.77 189.82 168.27 1.87Crude fat 20 38.16 61.20 47.79 1.54Starch 20 200.04 247.60 234.08 2.36Sucrose 20 31.53 47.19 39.54 0.82Calcium 20 5.55 8.03 6.88 0.16Phosphorus 20 4.05 5.45 4.48 0.09Sodium 20 1.63 9.57 4.71 0.58Magnesium 20 2.03 2.46 2.22 0.03Potassium 20 11.34 13.56 12.41 0.15Sulphur 20 1.92 2.34 2.08 0.02Chloride 20 4.38 19.45 10.26 1.11Copper
mg/
kg D
M 20 13.76 28.57 21.82 0.97
Zinc 20 69.72 124.47 99.77 4.07Manganese 20 62.63 93.67 78.32 2.23Iron 20 377.82 520.61 459.29 9.07Selenium 20 0.29 0.85 0.58 0.03

90
Farm
11
Nutrients N Minimum Maximum Mean SEM
Dry matter g/kg 20 455.20 489.96 477.78 2.03
Crude ash
g/kg
DM
20 57.58 72.20 64.33 0.90
Crude protein 20 137.96 159.39 151.91 1.26
ELOS 20 711.37 769.80 746.57 3.39
Crude fibre 20 153.37 180.19 165.47 1.99
Crude fat 20 35.14 52.58 44.98 1.25
Starch 20 220.99 271.67 253.04 3.35
Sucrose 20 24.96 36.01 31.96 0.56
Calcium 20 5.65 9.23 7.18 0.20
Phosphorus 20 3.52 4.39 3.92 0.06
Sodium 20 0.86 3.35 1.70 0.18
Magnesium 20 2.03 2.65 2.34 0.04
Potassium 20 11.97 15.25 13.55 0.16
Sulphur 20 1.81 2.03 1.95 0.01
Chloride 20 2.30 4.30 3.18 0.10
Copper
mg/
kg D
M
20 9.94 39.05 22.39 1.50
Zinc 20 45.61 145.38 92.04 5.59
Manganese 20 31.80 82.40 54.12 2.80
Iron 20 191.87 290.12 238.66 6.44
Selenium 20 0.12 0.62 0.33 0.03

91
APPENDIX 3 Saxonian Dairy Herds Data – Trace Elements,
Health and Production Parameters
Farm
1
Parameters N Minimum Maximum Mean SEM Liver Trace Elements (Fresh matter basis)
Zinc (m/kg ) 10 6.97 41.70 23.37 3.36Copper (m/kg) 10 16.30 199.00 97.47 19.19Manganese (m/kg) 10 0.29 13.80 4.10 1.21Iron (m/kg) 10 30.30 278.00 101.53 24.72Selenium (μg/kg) 10 248.30 887.50 609.86 65.04
Plasma Trace Elements Zinc (mg/l) 8 1.32 2.01 1.63 0.07Copper (mg/l) 10 0.18 1.13 0.65 0.08Manganese (mg/l) 0 Iron (m/l) 8 0.93 2.53 1.86 0.19Selenium (μg/l) 10 89.24 108.60 95.80 1.94
Plasma Biochemistry ALAT (μkat/l) 10 0.58 0.92 0.74 0.04ASAT (μkat/l) 10 1.20 3.20 1.75 0.19Bilirubin (μmol/l) 10 2.20 4.90 4.09 0.25Bilirubin-direct 10 0.00 0.20 0.13 0.02Bilirubin indirect 10 2.20 4.80 3.98 0.24Ferritin (ng/ml) 10 7.10 76.50 36.13 6.49
Production Parameters December 2008 Milk yield (kg/day) 10 25.70 43.10 34.98 2.02Fat (%) 10 3.56 4.73 4.27 0.11Protein (%) 10 3.28 4.03 3.56 0.07Milk urea (mg/l) 10 270.00 430.00 331.00 17.41Somatic cell count (* 1000) 10 43.00 2162.00 318.70 205.94Lactose (%) 10 4.52 5.17 4.86 0.06Lactation number 10 1.00 6.00 3.10 0.53Days in milk 10 113.00 258.00 176.70 11.66Protein corrected milk (kg/day)
10 26.94 45.74 36.37 1.94
Production Parameters November 2008 Milk yield (kg/day) 10 27.60 43.60 35.08 1.45Fat (%) 10 3.32 4.39 3.89 0.12Protein (%) 10 2.65 3.86 3.39 0.10Milk urea (mg/l) 10 160.00 380.00 266.00 21.66Somatic cell count (* 1000) 10 26.00 3426.00 610.80 354.24Lactose (%) 10 4.43 5.17 4.83 0.06Lactation number 10 1.00 6.00 3.10 0.53Days in milk 10 78.00 223.00 141.70 11.66Protein corrected milk (kg/day)
10 26.60 39.85 34.57 1.33

92
Farm
2
Parameters N Minimum Maximum Mean SEM Liver Trace Elements (Fresh matter basis)
Zinc (m/kg ) 9 11.60 25.70 16.44 1.64Copper (m/kg) 9 34.40 265.00 137.40 24.09Manganese (m/kg) 10 2.81 8.28 5.48 0.54Iron (m/kg) 10 2.85 250.00 110.21 22.85Selenium (μg/kg) 9 255.70 793.80 547.74 58.79
Plasma Trace Elements Zinc (mg/l) 10 1.63 2.77 2.00 0.10Copper (mg/l) 10 0.53 4.14 1.77 0.38Manganese (mg/l) 1 0.02 0.02 0.02 .
Iron (m/l) 7 0.64 2.35 1.62 0.20Selenium (μg/l) 10 81.58 110.60 93.63 2.99
Plasma Biochemistry ALAT (μkat/l) 10 0.68 1.03 0.91 0.03ASAT (μkat/l) 10 1.36 2.16 1.79 0.08Bilirubin (μmol/l) 10 3.30 4.90 4.24 0.14Bilirubin-direct 10 0.00 0.20 0.10 0.02Bilirubin-indirect 10 3.30 4.80 4.14 0.14Ferritin (ng/ml) 10 13.80 64.40 36.65 6.26
Production Parameters December 2008 Milk yield (kg/day) 10 32.40 44.50 37.81 1.17Fat (%) 10 3.86 4.68 4.21 0.09Protein (%) 10 3.16 3.78 3.43 0.06Milk urea (mg/l) 10 200.00 310.00 243.00 11.93Somatic cell count (* 1000) 10 26.00 127.00 62.20 8.76Lactose (%) 10 4.45 4.85 4.69 0.05Lactation number 10 2.00 3.00 2.40 0.16Days in milk 10 121.00 195.00 167.80 7.82Protein corrected milk (kg/day)
10 34.10 47.74 38.86 1.30
Production Parameters November 2008 Milk yield (kg/day) 10 32.20 59.30 42.91 2.50Fat (%) 10 3.69 5.01 4.17 0.15Protein (%) 10 2.90 3.79 3.26 0.07Milk urea (mg/l) 10 200.00 330.00 277.00 13.34Somatic cell count (* 1000) 10 36.00 2943.00 340.60 289.19Lactose (%) 10 4.22 4.93 4.76 0.07Lactation number 10 2.00 3.00 2.40 0.16Days in milk 10 72.00 146.00 118.80 7.82Protein corrected milk (kg/day)
10 35.29 64.20 43.36 2.68

93
Farm
3
Parameters N Minimum Maximum Mean SEM Liver Trace Elements (Fresh matter basis)
Zinc (m/kg ) 10 11.60 23.20 20.94 1.08Copper (m/kg) 10 139.00 234.00 188.50 9.08Manganese (m/kg) 10 6.58 52.50 13.89 4.43Iron (m/kg) 9 4.34 56.10 30.97 5.37Selenium (μg/kg) 10 483.00 850.40 705.66 40.95
Plasma Trace Elements Zinc (mg/l) 9 0.69 2.43 1.71 0.21Copper (mg/l) 10 0.61 3.63 1.52 0.29Manganese (mg/l) 2 0.22 3.64 1.93 1.71Iron (m/l) 3 0.74 3.01 1.93 0.66Selenium (μg/l) 10 92.40 152.20 109.28 6.25
Plasma Biochemistry ALAT (μkat/l) 10 0.55 0.91 0.80 0.03ASAT (μkat/l) 10 1.00 3.03 2.00 0.19Bilirubin (μmol/l) 10 3.20 5.00 4.23 0.17Bilirubin-direct 10 0.00 0.30 0.11 0.03Bilirubin indirect 10 3.00 4.90 4.10 0.17Ferritin (ng/ml) 10 3.80 31.00 17.23 3.03
Production Parameters December 2008 Milk yield (kg/day) 10 29.20 44.00 36.23 1.61Fat (%) 10 3.55 5.89 4.28 0.22Protein (%) 10 3.28 3.96 3.55 0.06Milk urea (mg/l) 10 250.00 320.00 281.00 6.57Somatic cell count (* 1000) 10 24.00 227.00 80.80 21.17Lactose (%) 10 4.22 5.06 4.64 0.08Lactation number 10 1.00 6.00 2.90 0.46Days in milk 10 160.00 192.00 167.50 2.85Protein corrected milk (kg/day)
10 31.37 43.40 37.51 1.18
Production Parameters November 2008 Milk yield (kg/day) 10 27.00 45.00 38.08 1.66Fat (%) 10 3.65 5.23 4.30 0.17Protein (%) 10 3.21 3.95 3.49 0.07Milk urea (mg/l) 10 210.00 330.00 257.00 12.21Somatic cell count (* 1000) 10 19.00 349.00 84.00 30.68Lactose (%) 10 4.35 4.94 4.69 0.07Lactation number 10 1.00 6.00 2.90 0.46Days in milk 10 132.00 164.00 139.50 2.85Protein corrected milk (kg/day)
10 29.02 44.62 39.42 1.32

94
Farm
4
Parameters N Minimum Maximum Mean SEM Liver Trace Elements (Fresh matter basis)
Zinc (m/kg ) 10 16.00 46.70 30.24 3.07Copper (m/kg) 10 87.10 279.00 150.97 16.98Manganese (m/kg) 10 4.45 28.30 16.54 2.60Iron (m/kg) 10 3.13 84.60 39.34 9.09Selenium (μg/kg) 10 461.50 1380.00 920.31 108.12
Plasma Trace Elements Zinc (mg/l) 8 0.65 2.01 1.29 0.17Copper (mg/l) 10 0.47 4.45 1.85 0.37Manganese (mg/l) 9 0.02 2.32 1.20 0.27Iron (m/l) 7 0.50 2.98 1.61 0.35Selenium (μg/l) 10 101.80 136.90 114.75 3.88
Plasma Biochemistry ALAT (μkat/l) 10 0.60 1.14 0.85 0.06ASAT (μkat/l) 10 0.89 2.74 1.59 0.19Bilirubin (μmol/l) 10 3.60 5.60 4.12 0.21Bilirubin-direct 10 0.00 0.50 0.16 0.05Bilirubin indirect 10 3.30 5.10 3.98 0.19Ferritin (ng/ml) 10 12.40 41.40 28.73 3.27
Production Parameters December 2008 Milk yield (kg/day) 10 25.50 47.40 33.43 2.28Fat (%) 10 3.33 5.10 3.79 0.17Protein (%) 10 3.30 3.99 3.63 0.07Milk urea (mg/l) 10 180.00 380.00 266.00 18.39Somatic cell count (* 1000) 10 9.00 234.00 59.20 20.78Lactose (%) 10 4.69 5.02 4.85 0.03Lactation number 10 1.00 2.00 1.40 0.16Days in milk 10 110.00 161.00 138.10 5.45Protein corrected milk (kg/day)
10 25.48 44.57 32.95 2.02
Production Parameters November 2008 Milk yield (kg/day) 10 26.10 44.70 33.75 2.09Fat (%) 10 2.64 4.55 3.63 0.18Protein (%) 10 2.97 3.72 3.41 0.07Milk urea (mg/l) 10 200.00 380.00 267.00 20.00Somatic cell count (* 1000) 10 9.00 919.00 120.20 89.01Lactose (%) 10 4.66 5.04 4.80 0.04Lactation number 10 1.00 2.00 1.40 0.16Days in milk 10 82.00 132.00 112.00 4.47Protein corrected milk (kg/day)
10 25.61 38.60 32.03 1.39

95
Farm
5
Parameters N Minimum Maximum Mean SEM Liver Trace Elements (Fresh matter basis)
Zinc (m/kg ) 10 7.96 42.70 19.83 3.69Copper (m/kg) 9 1.39 211.00 134.28 20.87Manganese (m/kg) 10 6.52 23.50 13.09 1.83Iron (m/kg) 10 20.10 220.00 89.72 24.27Selenium (μg/kg) 10 202.70 857.50 520.04 63.06
Plasma Trace Elements Zinc (mg/l) 9 1.06 2.43 1.93 0.13Copper (mg/l) 10 0.61 3.35 1.61 0.26Manganese (mg/l) 4 0.05 0.43 0.19 0.09Iron (m/l) 7 0.72 2.22 1.51 0.19Selenium (μg/l) 10 59.40 98.17 82.45 4.14
Plasma Biochemistry ALAT (μkat/l) 10 0.62 1.04 0.88 0.04ASAT (μkat/l) 10 1.45 3.23 2.24 0.22Bilirubin (μmol/l) 10 2.20 5.80 4.26 0.33Bilirubin-direct 10 0.10 0.40 0.21 0.03Bilirubin indirect 10 2.00 5.60 4.03 0.32Ferritin (ng/ml) 10 14.20 161.40 43.00 13.79
Production Parameters December 2008 Milk yield (kg/day) 10 23.00 43.90 34.63 2.35Fat (%) 10 2.96 5.37 3.98 0.25Protein (%) 10 3.14 4.18 3.54 0.10Milk urea (mg/l) 10 210.00 290.00 253.00 10.33Somatic cell count (* 1000)
10 19.00 437.00 105.00 40.50
Lactose (%) 10 4.66 5.28 4.89 0.06Lactation number 10 1.00 3.00 1.90 0.31Days in milk 10 133.00 157.00 145.60 2.56Protein corrected milk (kg/day)
10 24.86 44.41 34.59 2.24
Production Parameters November 2008 Milk yield (kg/day) 10 23.90 46.30 35.10 2.13Fat (%) 10 2.71 4.79 3.82 0.23Protein (%) 10 3.02 3.99 3.36 0.10Milk urea (mg/l) 10 200.00 290.00 241.00 10.48Somatic cell count (* 1000)
10 16.00 641.00 146.70 62.84
Lactose (%) 10 4.49 5.13 4.85 0.06Lactation number 10 1.00 3.00 1.90 0.31Days in milk 10 98.00 122.00 110.60 2.56Protein corrected milk (kg/day)
10 26.17 41.75 33.92 1.69

96
Farm
6
Parameters N Minimum Maximum Mean SEM Liver Trace Elements (Fresh matter basis)
Zinc (m/kg ) 9 9.28 23.00 16.63 1.80Copper (m/kg) 10 102.00 372.00 202.00 28.20Manganese (m/kg) 9 1.11 10.00 4.59 0.83Iron (m/kg) 10 10.60 255.00 81.54 28.93Selenium (μg/kg) 10 622.80 1566.00 970.57 113.82
Plasma Trace Elements Zinc (mg/l) 9 0.41 1.91 0.91 0.14Copper (mg/l) 9 0.89 7.68 2.39 0.68Manganese (mg/l) 6 0.02 4.20 1.30 0.66Iron (m/l) 6 0.24 1.88 1.22 0.24Selenium (μg/l) 9 66.95 118.70 93.98 5.45
Plasma Biochemistry ALAT (μkat/l) 10 0.69 0.89 0.78 0.02ASAT (μkat/l) 10 1.49 2.71 1.91 0.11Bilirubin (μmol/l) 10 1.60 5.70 3.77 0.37Bilirubin-direct 10 0.00 0.20 0.12 0.02Bilirubin indirect 10 0.00 5.40 3.48 0.47Ferritin (ng/ml) 10 8.40 45.70 23.45 4.43
Production Parameters December 2008 Milk yield (kg/day) 10 34.30 43.00 38.59 1.08Fat (%) 10 3.16 5.02 4.26 0.20Protein (%) 10 3.15 3.95 3.49 0.08Milk urea (mg/l) 10 250.00 300.00 277.00 5.78Somatic cell count (* 1000) 10 29.00 898.00 153.60 83.76Lactose (%) 10 4.67 4.93 4.82 0.03Lactation number 10 1.00 4.00 2.00 0.26Days in milk 10 91.00 197.00 133.80 11.55Protein corrected milk (kg/day)
10 32.83 46.04 39.89 1.11
Production Parameters November 2008 Milk yield (kg/day) 10 38.00 43.70 41.20 0.54Fat (%) 10 3.16 5.75 4.06 0.25Protein (%) 10 3.09 3.67 3.36 0.06Milk urea (mg/l) 10 200.00 310.00 246.00 9.09Somatic cell count (* 1000) 10 15.00 452.00 135.00 50.08Lactose (%) 10 4.74 5.03 4.89 0.03Lactation number 10 1.00 4.00 2.00 0.26Days in milk 10 56.00 162.00 98.80 11.55Protein corrected milk (kg/day)
10 34.78 52.87 41.46 1.59

97
Farm
7
Parameters N Minimum Maximum Mean SEM Liver Trace Elements (Fresh matter basis)
Zinc (m/kg ) 10 2.40 9.72 6.11 0.76Copper (m/kg) 10 48.30 141.00 79.77 10.27Manganese (m/kg) 9 2.28 15.60 6.39 1.38Iron (m/kg) 10 52.70 187.00 129.98 14.71Selenium (μg/kg) 10 444.70 1049.00 720.80 58.44
Plasma Trace Elements Zinc (mg/l) 10 0.57 2.05 1.36 0.19Copper (mg/l) 10 0.34 8.09 2.41 0.81Manganese (mg/l) 5 0.08 1.04 0.34 0.18Iron (m/l) 7 0.09 6.07 2.61 0.74Selenium (μg/l) 10 94.03 137.80 113.20 4.85
Plasma Biochemistry ALAT (μkat/l) 10 0.84 1.18 0.93 0.03ASAT (μkat/l) 10 1.14 3.26 1.90 0.20Bilirubin (μmol/l) 10 2.70 6.70 4.36 0.34Bilirubin-direct 10 0.00 0.30 0.16 0.03Bilirubin indirect 10 2.60 6.40 4.21 0.31Ferritin (ng/ml) 10 12.10 88.40 38.02 8.44
Production Parameters December 2008 Milk yield (kg/day) 10 33.80 54.90 43.66 2.68Fat (%) 10 3.03 4.46 3.62 0.15Protein (%) 10 2.92 3.95 3.25 0.10Milk urea (mg/l) 10 200.00 320.00 263.00 12.12Somatic cell count (* 1000) 10 16.00 204.00 64.60 18.32Lactose (%) 10 4.40 5.08 4.83 0.06Lactation number 10 1.00 5.00 3.00 0.47Days in milk 10 102.00 173.00 134.80 7.87Protein corrected milk (kg/day)
10 31.01 50.26 41.07 2.09
Production Parameters November 2008 Milk yield (kg/day) 10 34.40 58.40 45.86 2.66Fat (%) 10 2.89 4.26 3.49 0.15Protein (%) 10 2.67 3.61 3.10 0.09Milk urea (mg/l) 10 180.00 290.00 245.00 10.25Somatic cell count (* 1000) 10 15.00 206.00 56.30 17.88Lactose (%) 10 4.34 5.09 4.83 0.06Lactation number 10 1.00 5.00 3.00 0.47Days in milk 10 76.00 157.00 117.20 8.60Protein corrected milk (kg/day)
10 31.66 50.71 42.12 2.29

98
Farm
8
Parameters N Minimum Maximum Mean SEM Liver Trace Elements (Fresh matter basis)
Zinc (m/kg ) 10 6.19 31.30 15.30 2.54Copper (m/kg) 10 35.20 348.00 122.84 32.09Manganese (m/kg) 10 0.38 8.75 2.63 0.82Iron (m/kg) 10 12.30 273.00 125.24 24.03Selenium (μg/kg) 10 472.10 3322.00 1470.47 295.86
Plasma Trace Elements Zinc (mg/l) 10 0.39 1.54 0.87 0.10Copper (mg/l) 10 0.80 4.26 2.13 0.37Manganese (mg/l) 8 0.03 1.21 0.59 0.15Iron (m/l) 6 0.46 2.40 0.97 0.32Selenium (μg/l) 10 99.67 167.60 118.76 6.22
Plasma Biochemistry ALAT (μkat/l) 10 0.62 1.01 0.82 0.04ASAT (μkat/l) 10 1.17 3.08 2.21 0.19Bilirubin (μmol/l) 10 1.40 6.00 4.34 0.41Bilirubin-direct 10 0.00 0.40 0.19 0.04Bilirubin indirect 10 1.30 5.80 4.11 0.40Ferritin (ng/ml) 10 16.20 38.50 26.52 2.62
Production Parameters December 2008 Milk yield (kg/day) 10 20.20 48.90 35.66 2.99Fat (%) 10 2.63 4.76 3.53 0.22Protein (%) 10 3.01 3.90 3.48 0.08Milk urea (mg/l) 10 190.00 340.00 276.00 16.75Somatic cell count (* 1000)
10 29.00 277.00 118.10 27.51
Lactose (%) 10 4.29 4.94 4.71 0.07Lactation number 10 1.00 4.00 1.90 0.38Days in milk 10 120.00 205.00 144.50 7.20Protein corrected milk (kg/day)
10 19.15 45.28 33.55 2.48
Production Parameters November 2008 Milk yield (kg/day) 10 20.60 49.70 37.38 2.80Fat (%) 10 2.67 4.92 3.57 0.21Protein (%) 10 3.15 3.76 3.45 0.07Milk urea (mg/l) 10 180.00 310.00 238.00 14.44Somatic cell count (* 1000)
10 16.00 3010.00 355.90 295.38
Lactose (%) 10 4.35 5.08 4.84 0.07Lactation number 10 1.00 4.00 1.90 0.38Days in milk 10 85.00 170.00 109.50 7.20Protein corrected milk (kg/day)
10 20.93 49.19 35.44 2.64

99
Farm
9
Parameters N Minimum Maximum Mean SEM Liver Trace Elements (Fresh matter basis)
Zinc (m/kg ) 9 13.00 32.00 20.57 2.16Copper (m/kg) 9 69.70 152.00 121.19 7.96Manganese (m/kg) 9 0.52 11.70 3.18 1.18Iron (m/kg) 9 21.50 150.89 76.10 15.49Selenium (μg/kg) 9 424.90 828.40 554.01 42.13
Plasma Trace Elements Zinc (mg/l) 9 0.60 2.01 1.47 0.17Copper (mg/l) 9 0.24 5.21 1.63 0.57Manganese (mg/l) 6 0.02 0.14 0.07 0.02Iron (m/l) 7 0.99 4.67 1.94 0.46Selenium (μg/l) 9 54.73 123.70 82.12 7.45
Plasma Biochemistry ALAT (μkat/l) 10 0.68 1.15 0.89 0.04ASAT (μkat/l) 10 1.15 2.37 1.82 0.14Bilirubin (μmol/l) 10 1.70 5.10 3.95 0.38Bilirubin-direct 10 0.00 0.20 0.08 0.02Bilirubin indirect 10 1.70 5.10 4.09 0.30Ferritin (ng/ml) 10 10.50 69.20 31.19 6.10
Production Parameters December 2008 Milk yield (kg/day) 10 22.90 39.90 33.31 1.46Fat (%) 10 2.77 4.80 3.86 0.19Protein (%) 10 3.07 3.69 3.42 0.07Milk urea (mg/l) 10 140.00 230.00 191.00 9.36Somatic cell count (* 1000)
10 21.00 235.00 84.60 24.54
Lactose (%) 10 4.52 4.96 4.78 0.05Lactation number 10 1.00 5.00 2.50 0.43Days in milk 10 133.00 321.00 187.10 17.24Protein corrected milk (kg/day)
10 22.45 38.35 32.76 1.47
Production Parameters November 2008 Milk yield (kg/day) 10 24.90 42.10 32.51 1.49Fat (%) 10 2.93 4.73 3.97 0.18Protein (%) 10 3.22 3.70 3.44 0.05Milk urea (mg/l) 10 130.00 220.00 183.00 10.65Somatic cell count (* 1000)
10 21.00 221.00 100.90 21.67
Lactose (%) 10 4.59 4.98 4.84 0.04Lactation number 10 1.00 5.00 2.50 0.43Days in milk 10 109.00 297.00 163.10 17.24Protein corrected milk (kg/day)
10 24.91 39.09 32.38 1.24

100
Farm
10
Parameters N Minimum Maximum Mean SEM Liver Trace Elements (Fresh matter basis)
Zinc (m/kg ) 9 14.10 25.70 19.62 1.34Copper (m/kg) 9 66.60 227.00 130.36 18.68Manganese (m/kg) 10 2.55 12.50 4.41 0.93Iron (m/kg) 10 29.20 156.00 87.18 13.64Selenium (μg/kg) 9 576.90 1508.00 904.90 111.30
Plasma Trace Elements Zinc (mg/l) 5 1.17 2.54 1.79 0.23Copper (mg/l) 10 1.03 5.27 2.09 0.44Manganese (mg/l) 9 0.05 2.30 1.24 0.28Iron (m/l) 4 0.99 4.67 1.94 0.46Selenium (μg/l) 10 94.96 138.20 113.40 4.40
Plasma Biochemistry ALAT (μkat/l) 10 0.63 1.10 0.89 0.04ASAT (μkat/l) 10 1.12 2.01 1.51 0.07Bilirubin (μmol/l) 10 3.20 4.70 4.10 0.16Bilirubin-direct 10 0.00 0.20 0.11 0.02Bilirubin indirect 10 3.10 4.70 4.02 0.15Ferritin (ng/ml) 10 15.20 66.70 31.53 5.03
Production Parameters December 2008 Milk yield (kg/day) 10 22.00 41.90 33.63 1.94Fat (%) 10 3.24 5.05 3.98 0.17Protein (%) 10 3.09 3.53 3.30 0.05Milk urea (mg/l) 10 180.00 270.00 236.00 7.77Somatic cell count (* 1000) 10 4.92 2417.00 388.69 236.80Lactose (%) 10 4.36 4.96 4.70 0.05Lactation number 10 1.00 6.00 2.90 0.62Days in milk 0 Protein corrected milk (kg/day)
10 24.65 42.70 33.23 1.83
Production Parameters November 2008 Milk yield (kg/day) 10 26.10 46.30 36.12 2.19Fat (%) 10 2.83 3.91 3.49 0.12Protein (%) 10 3.17 3.82 3.47 0.06Milk urea (mg/l) 10 190.00 300.00 258.00 11.23Somatic cell count (* 1000) 10 36.00 1689.00 399.10 195.76Lactose (%) 10 4.44 5.06 4.78 0.06Lactation number 10 1.00 6.00 2.90 0.62Days in milk 0 Protein corrected milk (kg/day)
10 25.41 43.93 34.02 1.91

101
Farm
11
Parameters N Minimum Maximum Mean SEM Liver Trace Elements (Fresh matter basis)
Zinc (m/kg ) 10 1.49 21.40 11.83 1.95Copper (m/kg) 9 21.90 205.00 111.87 21.89Manganese (m/kg) 9 1.46 9.19 4.09 0.75Iron (m/kg) 10 40.89 204.00 101.92 16.78Selenium (μg/kg) 10 122.60 1127.00 595.72 98.66
Plasma Trace Elements Zinc (mg/l) 7 1.53 2.33 1.91 0.11Copper (mg/l) 8 0.26 6.37 1.64 0.69Manganese (mg/l) 4 0.06 1.39 0.56 0.30Iron (m/l) 4 2.25 3.34 2.74 0.23Selenium (μg/l) 8 85.79 104.00 96.57 2.11
Plasma Biochemistry ALAT (μkat/l) 10 0.67 0.96 0.80 0.03ASAT (μkat/l) 10 1.34 2.54 2.08 0.13Bilirubin (μmol/l) 10 1.50 8.10 4.25 0.53Bilirubin-direct 10 0.00 0.20 0.08 0.02Bilirubin indirect 10 0.00 7.80 4.06 0.61Ferritin (ng/ml) 10 11.70 48.40 28.27 4.70
Production Parameters December 2008 Milk yield (kg/day) 10 25.80 42.40 35.28 2.01Fat (%) 10 2.80 5.19 3.66 0.25Protein (%) 10 2.81 4.17 3.34 0.12Milk urea (mg/l) 10 160.00 270.00 218.00 10.52Somatic cell count (* 1000) 10 22.00 1980.00 313.70 193.12Lactose (%) 10 4.39 5.03 4.78 0.06Lactation number 10 1.00 4.00 2.20 0.33Days in milk 10 112.00 177.00 144.20 7.26Protein corrected milk (kg/day)
10 24.14 41.56 33.48 1.70
Production Parameters November 2008 Milk yield (kg/day) 10 32.00 48.20 41.03 1.61Fat (%) 10 2.00 4.99 3.02 0.30Protein (%) 10 3.04 4.14 3.40 0.11Milk urea (mg/l) 10 150.00 270.00 223.00 11.65Somatic cell count (* 1000) 10 13.00 1141.00 171.40 110.26Lactose (%) 10 4.48 5.04 4.81 0.06Lactation number 10 1.00 4.00 2.20 0.33Days in milk 10 84.00 149.00 112.70 7.67Protein corrected milk (kg/day)
10 31.46 41.40 36.03 1.17
Recommended


![EffEct of diEtary supplEmEntation of spirulina ArthrospirA ...real.mtak.hu/47590/1/[] Effect of Dietary Supplementation of Spirulina (Arthrospira...Meineri, 2011), oxidative stress](https://img.dokumen.tips/doc/110x75/5fc2e7b765b8ea663c169cbd/effect-of-dietary-supplementation-of-spirulina-arthrospira-realmtakhu475901.jpg)