

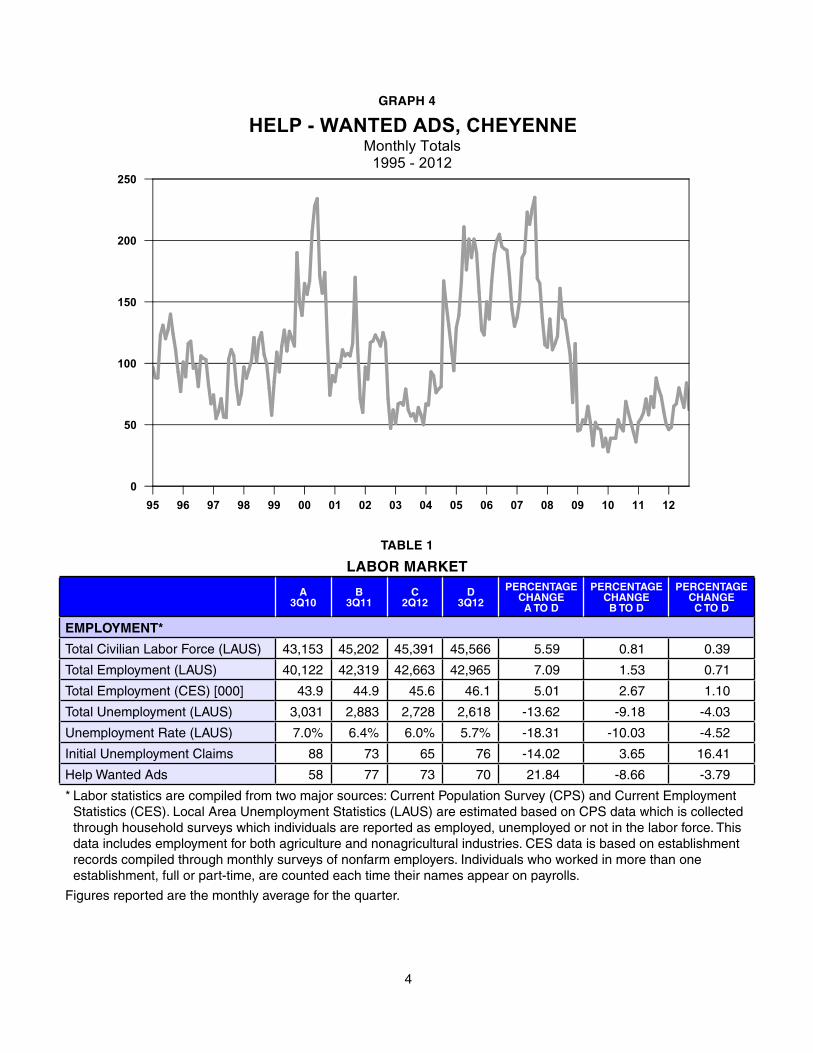


GRAPH 12
TOTAL LOANS AND DEPOSITSCheyenne Area Banks
2000 - 2012
00 01 02 03 04 05 06 07 08 09 10 11 120
100
200
300
400
500
600
Millions
Total Loans Total Deposits
12

CONSTRUCTION
Residential ConstructionTable 5 provides various measures for new residential construction within Laramie County. The number of new residential construction permits skyrocketed within city borders over the third quarter of 2012. This indicator increased 45.7 percent from third quarter 2011 and rose 13.6 percent from second quarter 2012. Even with this large increase, the monthly average through September of 2012 still lagged 2011’s annual average by 2.0 percent. The dollar value of residential construction also did well over the current quarter, up 46.4 percent from the comparable period one year ago. In Table 5A, the total number of new single-family residential permits issued throughout all of Laramie County through the end of September, stood at 270 as compared to 222 over the same period in 2011, an increase of 21.7 percent. Most importantly, one multi-family housing complex was permitted in September and it will contain 54 units. This was the first new apartment complex to be permitted since September 2009.
The average value of a city issued residential home permit was $153,993 over the first three quarters of 2012 as compared to $169,555 for all of 2011 which left the average 2012 value down 9.2 percent from last year. Rural permits for 2012 are also down 2.0 percent over the comparable period.
TABLE 5
CONSTRUCTIONPERCENTAGE PERCENTAGE PERCENTAGEA B C D CHANGE CHANGE CHANGE3Q10 3Q11 2Q12 3Q12 A TO D B TO D C TO D
CONSTRUCTION
Single Fam Bldg Permits – Chey 64 46 59 67 4.69 45.65 13.56
Single Fam Bldg Permits – LarCo 13 19 36 18 38.46 -5.26 -50.00
Total Bldg Permits – (Chey) (a) 148 164 188 170 15.35 3.65 -9.24
Septic Permits – (Rural) 14 14 14 15 7.14 7.14 7.14
Value of Authorized Construction ($000) 6,049 4,540 8,173 16,283 169.17 258.63 99.23
Residential ($000) 3,303 2,416 3,253 3,538 7.12 46.43 8.78
UTILITIES
Commercial Electric Power 52 52 51 48 -6.63 -6.77 -5.15
(‘000,000) Kwh
Residential Gas Usage 56 56 125 53 -6.31 -5.19 -57.56
(‘000) Mcf
Metered Taps – Water (CBPU) 22,251 22,455 22,530 22,620 1.66 0.74 0.40
Metered Taps – Water (SCW & SD) 3,304 3,307 3,310 3,310 0.18 0.08 0.00
(a) Data includes building and non-building.Single Family Building Permits are a total of the figures for three months.All other construction figures are the monthly average for the quarter.CPBU – Cheyenne Board of Public UtilitiesSCW&SD – South Cheyenne Water & Sewer District
13
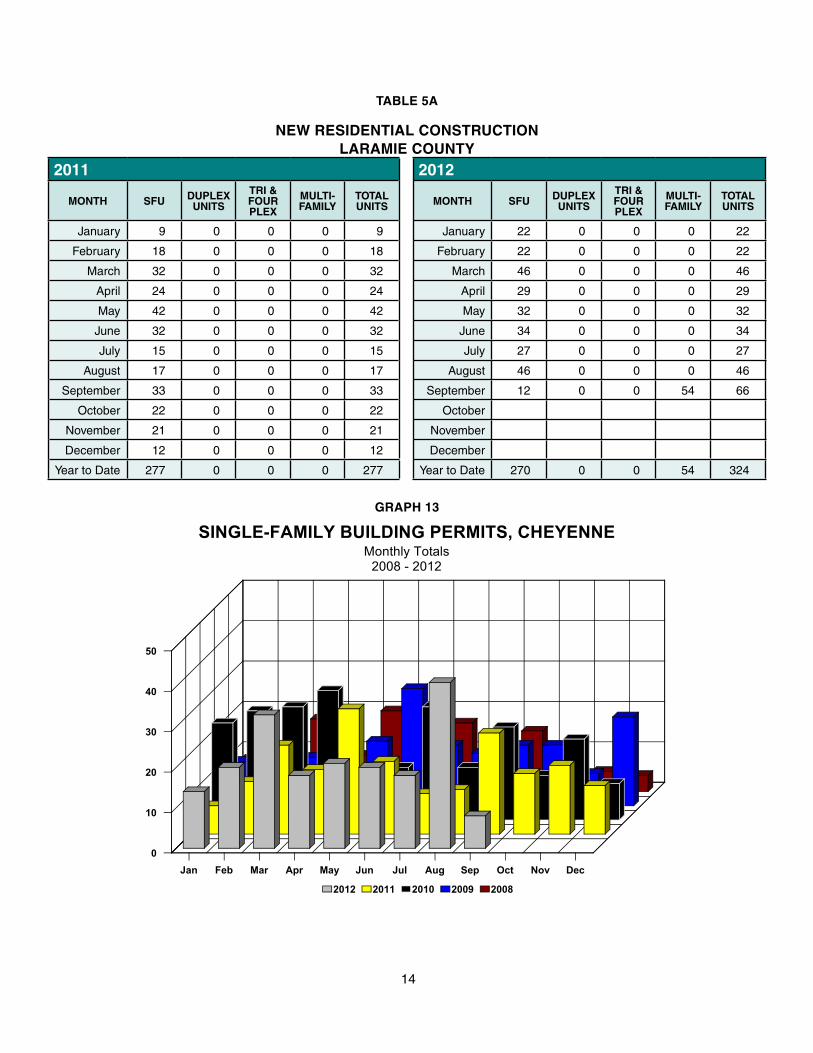
TABLE 5A
NEW RESIDENTIAL CONSTRUCTION LARAMIE COUNTY
2011 2012
MONTH SFU DUPLEXUNITS
TRI & FOURPLEX
MULTI-FAMILY
TOTALUNITS MONTH SFU DUPLEX
UNITS
TRI & FOURPLEX
MULTI-FAMILY
TOTALUNITS
January 9 0 0 0 9 January 22 0 0 0 22
February 18 0 0 0 18 February 22 0 0 0 22
March 32 0 0 0 32 March 46 0 0 0 46
April 24 0 0 0 24 April 29 0 0 0 29
May 42 0 0 0 42 May 32 0 0 0 32
June 32 0 0 0 32 June 34 0 0 0 34
July 15 0 0 0 15 July 27 0 0 0 27
August 17 0 0 0 17 August 46 0 0 0 46
September 33 0 0 0 33 September 12 0 0 54 66
October 22 0 0 0 22 October
November 21 0 0 0 21 November
December 12 0 0 0 12 December
Year to Date 277 0 0 0 277 Year to Date 270 0 0 54 324
GRAPH 13
SINGLE-FAMILY BUILDING PERMITS, CHEYENNEMonthly Totals
2008 - 2012
Jan Feb Mar Apr May Jun Jul Aug Sep Oct Nov Dec0
10
20
30
40
50
2012 2011 2010 2009 2008
14

GRAPH 14
COMMERCIAL ELECTRIC POWER SALES, CHEYENNEMonthly Totals
1995 - 2012
0
10
20
30
40
50
60Millions
GRAPH 15
CHEYENNE METERED WATER TAPSMonthly Average
1995 - 2012
Metered Water Taps (CBPU)
18,1
54
18,4
44
18,6
91
18,8
90
19,1
00
19,1
93
19,3
55
19,5
32
19,8
32
20,2
46
20,7
21
21,2
25
21,6
00
21,6
78
21,9
29
22,0
48
22,3
38
22,5
16
95 96 97 98 99 00 01 02 03 04 05 06 07 08 09 10 11 1217,000
17,500
18,000
18,500
19,000
19,500
20,000
20,500
21,000
21,500
22,000
22,500
15
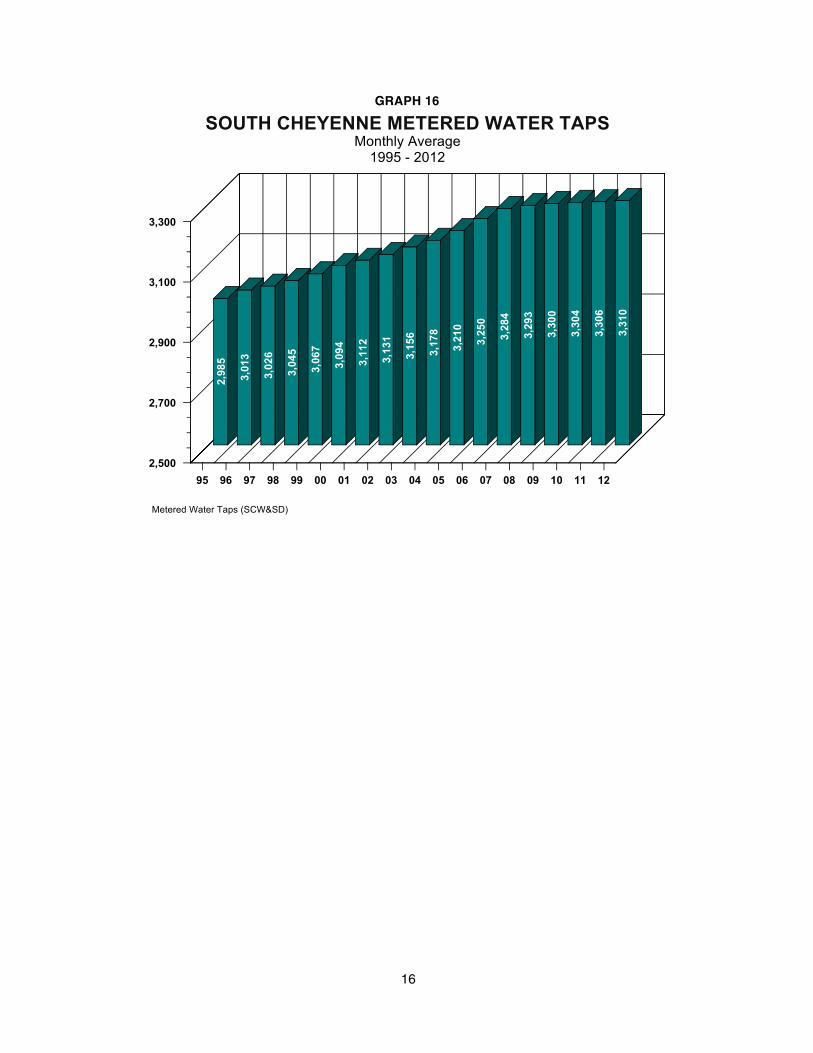
GRAPH 16
SOUTH CHEYENNE METERED WATER TAPSMonthly Average
1995 - 2012
Metered Water Taps (SCW&SD)
2,98
5
3,01
3
3,02
6
3,04
5
3,06
7
3,09
4
3,11
2
3,13
1
3,15
6
3,17
8
3,21
0
3,25
0
3,28
4
3,29
3
3,30
0
3,30
4
3,30
6
3,31
0
95 96 97 98 99 00 01 02 03 04 05 06 07 08 09 10 11 122,500
2,700
2,900
3,100
3,300
16

Commercial/Industrial ConstructionTable 5 also presents total building permits issued within city limits. Such permits again increased this quarter but at a smaller rate of increase than second quarter 2012, 3.7 percent currently versus 18 percent in second quarter. On an even more positive note, the average monthly dollar valuation of city permits rose by 55.6 percent through the third quarter of this year when compared to all of 2011’s monthly average. This year’s monthly average stood at $10,066,640 through September with 2011’s comparable average at $6,471,434. This increase in commercial construction was driven by the hospital’s new construction projects (parking garage and cancer treatment center) and a permit for the new Menard’s building.
While new commercial construction did very well this quarter within city limits, it paled compared to the 100 million dollar plus value of industrial permits issued in the county over the third quarter of 2012. The latter driven by the permit for construction of Microsoft’s new datacenter. When city and county commercial and industrial construction activities were combined, there were 12 new commercial structures permitted during the third quarter of this year with a total dollar valuation of 130,959,307 dollars. After a long and painful wait, it appears the commercial construction sector has finally shaken off the effects of the Great Recession.
GRAPH 17
TOTAL BUILDING PERMITS, CHEYENNEMonthly Totals
2008 - 2012
Jan Feb Mar Apr May Jun Jul Aug Sep Oct Nov Dec0
50
100
150
200
250
2012 2011 2010 2009 2008
17

Commercial Property VacanciesTable 6 presents a summary of the number of commercial properties for sale and/or lease in the greater Cheyenne market from first quarter 2010 through the end of third quarter 2012 along with total square footage and vacancy rates. Available properties are categorized by warehousing, retail and office space. Average rental rates are also provided. Retail and warehousing vacancy rates inched up over the third quarter with retail at 8.4% as compared to its second quarter rate of 8.0%.
The warehouse vacancy rate climbed to 9.3% versus its second quarter rate of 8.4% even though the number of available units declined from 46 to 35 over the third quarter.
NOTE: For a complete listing of available commercial properties in the greater Cheyenne area and discussion of changes in the commercial building market over the second quarter of 2012, please go to the Data Center’s homepage (www.wyomingeconomicdata.com) and click on Commercial Property Opportunities.
18

Updated: 09/30/2012
TABLE 6
COMMERCIAL PROPERTY(For Sale & Lease)
PROPERTYTYPE
#PROPERTIES
SQUAREFOOTAGE
AVG.LEASE RATE
MIN./MAX.RATE
VACANCYRATE
FIRST QUARTER 2010Warehouse 45 521,350 $5.23 3.34-10.00 10.9%(FR)
Retail 53 343,180 $10.64 4.61-16.00 8.1%(FR)
Office Space 86 490,256 $14.34 4.80-17.00 21.2%(FR)
SECOND QUARTER 2010Warehouse 54 755,892 $5.57 3.34-13.06 15.1%(FR)
Retail 66 376,641 $11.25 4.61-17.00 9.9%(FR)
Office Space 88 520,529 $12.18 4.80-18.00 26.5%(FR)
THIRD QUARTER 2010Warehouse 51 605,041 $5.99 3.34-13.06 10.3%(FR)
Retail 74 321,469 $10.84 4.61-17.00 7.1%(FR)
Office Space 77 473,770 $11.53 4.00-17.64 20.5%(FR)
FOURTH QUARTER 2010Warehouse 36 476,507 $5.89 3.34-13.06 8.9%(FR)
Retail 68 358,737 $11.66 7.00-16.00 8.0%(FR)
Office Space 72 413,248 $11.99 5.14-17.00 18.7%(FR)
FIRST QUARTER 2011Warehouse 40 500,960 $5.43 3.34-15.60 9.2%(FR)
Retail 71 438,941 $14.91 7.00-27.00 7.9%(FR)
Office Space 78 453,668 $12.39 5.14-19.00 17.7%(FR)
SECOND QUARTER 2011Warehouse 39 485,557 $7.33 3.34-19.00 10.3%(FR)
Retail 69 471,264 $14.83 6.00-27.00 7.9%(FR)
Office Space 78 444,962 $12.34 5.14-17.00 19.1%(FR)
THIRD QUARTER 2011Warehouse 40 395,449 $7.51 3.95-19.00 6.4%(FR)
Retail 65 556,105 $14.38 7.00-23.50 6.7%(FR)
Office Space 73 454,493 $13.02 5.14-22.00 21.3%(FR)
FOURTH QUARTER 2011Warehouse 41 331,361 $7.51 4.50-19.00 5.7%(FR)
Retail 72 598,138 $13.88 7.00-23.50 7.5%(FR)
Office Space 66 391,942 $12.38 5.14-22.00 18.3%(FR)
FIRST QUARTER 2012Warehouse 44 378,210 $7.76 4.29-19.00 7.1%Retail 80 670,323 $14.25 6.00-23.50 9.4%Office Space 68 428,336 $13.31 5.14-22.00 20.5%SECOND QUARTER 2012Warehouse 46 444,917 $7.27 4.25-19.00 8.4%Retail 72 641,817 $13.35 5.00-20.00 8.0%Office Space 63 384,705 $13.48 5.14-22.00 18.5%THIRD QUARTER 2012Warehouse 35 468,066 $7.01 3.20-19.00 9.3%Retail 73 634,151 $13.80 5.00-23.50 8.4%Office Space 62 386,327 $13.26 5.00-22.00 17.6%FR – Final Revision
19

Residential Housing MarketTable 7 below presents statistics for the local residential housing market, both city and rural areas. The first part of the table presents 13 different series measuring residential housing activity throughout Laramie County. These new statistics are from Core Logic (CL) and provide a more comprehensive and in-depth look at the residential housing market than previously available. Below the Core Logic data, the reader will find statistics from the Cheyenne Board of Realtors (CBR) and can compare the two data sets. Core Logic data are derived from a considerably larger sample than CBR statistics and provide a higher degree of reliability and accuracy.
The reader will quickly see the differences between the two sets of data. CL statistics showed the residential housing market expanding at slower rates than CBR rates, but also showed that the absolute number of sales was far larger than those reported by the CBR group. The number of home sales dropped from second quarter 2012 by 9.2 percent and still lagged third quarter 2010 by 4.1 percent. Average sales prices preformed similarly. CL’s new construction series showed strong improvements in this area and supported the data presented earlier in this report concerning new residential construction activity.
CL data reported sharp decreases in the number of foreclosures since 2010 and from one year ago. A solid sign of the improving conditions in the local housing market. The one downside to this improvement was the increase in short sales and drop in sale prices for short sales so far in 2012. Even so, further underlying strength in the housing market could be seen in the 38 percent drop in negative equity loans reported in third quarter 2012 as compared to third quarter 2011 along with a similar decline from third quarter 2010. The number of 90+ Day delinquencies also fell this quarter (-.5.2%) from one year ago and were down 17.1 percent from two years ago.
Due to their small absolute size, the number of REO units was not included in Table 7. There have been only 2 such sales through the first 9 mines of 2012 and the REO rate average only 0.31 percent over this period.
Graph 19 presents the long-term spread between city and rural residential home proces.
GRAPH 18
RESIDENTIAL UNITS SOLDMonthly Totals
2006- 2012
2006 2007 2008 2009 2010 2011 20120
50
100
150
200
250
Condo Units Sold Rural Units Sold City Units Sold Total Units Sold
20
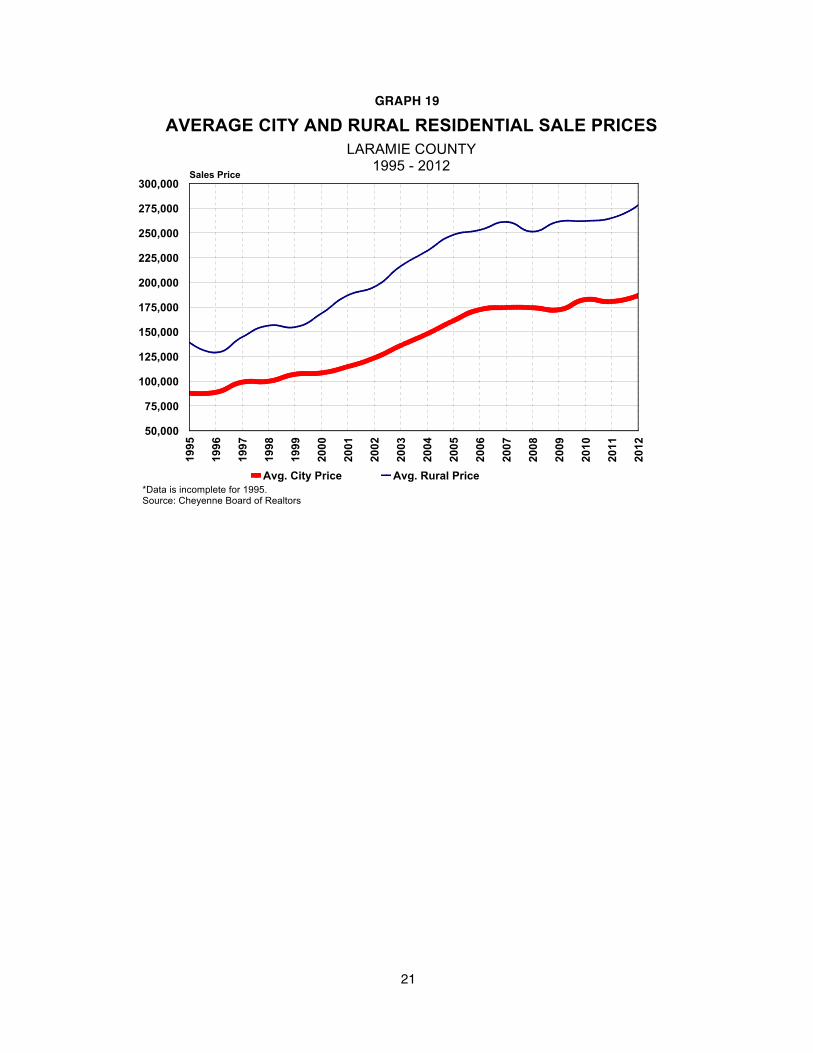
GRAPH 19
AVERAGE CITY AND RURAL RESIDENTIAL SALE PRICESLARAMIE COUNTY
1995 - 2012
*Data is incomplete for 1995.Source: Cheyenne Board of Realtors
199 5
199 6
199 7
199 8
199 9
200 0
200 1
200 2
200 3
200 4
200 5
200 6
200 7
200 8
200 9
201 0
201 1
201 2
50,000
75,000
100,000
125,000
150,000
175,000
200,000
225,000
250,000
275,000
300,000Sales Price
Avg. City Price Avg. Rural Price
21

Apartment VacanciesThe supply of rental units in the local market tightened considerably during third quarter 2012 with the number of unfurnished apartments down 17 percent. Homes and duplexes also fell by 24 percent. The vacancy rate at large apartment complexes averaged 2.9 percent this quarter which was essentially unchanged from one year ago. The new 54-unit apartment complex recently permitted should help ease the apparent tight apartment rental market.
Graphs 20 and 21 below present the above data.
GRAPH 20
UNFURNISHED APARTMENT VACANCIES, CHEYENNEMonthly Totals
1995 - 2012
95 96 97 98 99 00 01 02 03 04 05 06 07 08 09 10 11 120
20
40
60
80
100
120
GRAPH 21
SAMPLED APARTMENTS - PERCENT VACANT, CHEYENNEMonthly Totals
1995 - 2012
95 96 97 98 99 00 01 02 03 04 05 06 07 08 09 10 11 12
0
5
10
15
20
25
22
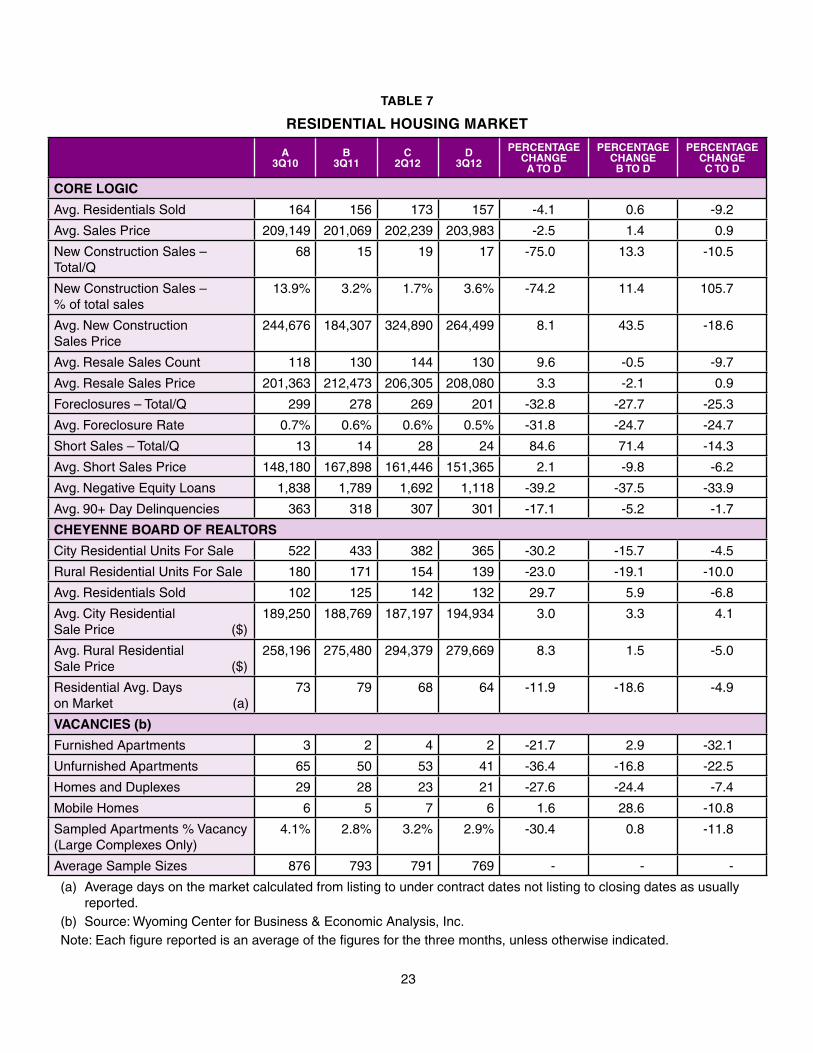
TABLE 7
RESIDENTIAL HOUSING MARKET
A 3Q10
B 3Q11
C 2Q12
D 3Q12
PERCENTAGE CHANGE A TO D
PERCENTAGE CHANGE B TO D
PERCENTAGE CHANGE C TO D
CORE LOGIC
Avg. Residentials Sold 164 156 173 157 -4.1 0.6 -9.2
Avg. Sales Price 209,149 201,069 202,239 203,983 -2.5 1.4 0.9
New Construction Sales – Total/Q
68 15 19 17 -75.0 13.3 -10.5
New Construction Sales – % of total sales
13.9% 3.2% 1.7% 3.6% -74.2 11.4 105.7
Avg. New Construction Sales Price
244,676 184,307 324,890 264,499 8.1 43.5 -18.6
Avg. Resale Sales Count 118 130 144 130 9.6 -0.5 -9.7
Avg. Resale Sales Price 201,363 212,473 206,305 208,080 3.3 -2.1 0.9
Foreclosures – Total/Q 299 278 269 201 -32.8 -27.7 -25.3
Avg. Foreclosure Rate 0.7% 0.6% 0.6% 0.5% -31.8 -24.7 -24.7
Short Sales – Total/Q 13 14 28 24 84.6 71.4 -14.3
Avg. Short Sales Price 148,180 167,898 161,446 151,365 2.1 -9.8 -6.2
Avg. Negative Equity Loans 1,838 1,789 1,692 1,118 -39.2 -37.5 -33.9
Avg. 90+ Day Delinquencies 363 318 307 301 -17.1 -5.2 -1.7
CHEYENNE BOARD OF REALTORS
City Residential Units For Sale 522 433 382 365 -30.2 -15.7 -4.5
Rural Residential Units For Sale 180 171 154 139 -23.0 -19.1 -10.0
Avg. Residentials Sold 102 125 142 132 29.7 5.9 -6.8
Avg. City Residential Sale Price ($)
189,250 188,769 187,197 194,934 3.0 3.3 4.1
Avg. Rural Residential Sale Price ($)
258,196 275,480 294,379 279,669 8.3 1.5 -5.0
Residential Avg. Days on Market (a)
73 79 68 64 -11.9 -18.6 -4.9
VACANCIES (b)
Furnished Apartments 3 2 4 2 -21.7 2.9 -32.1
Unfurnished Apartments 65 50 53 41 -36.4 -16.8 -22.5
Homes and Duplexes 29 28 23 21 -27.6 -24.4 -7.4
Mobile Homes 6 5 7 6 1.6 28.6 -10.8
Sampled Apartments % Vacancy (Large Complexes Only)
4.1% 2.8% 3.2% 2.9% -30.4 0.8 -11.8
Average Sample Sizes 876 793 791 769 - - -
(a) Average days on the market calculated from listing to under contract dates not listing to closing dates as usually reported.
(b) Source: Wyoming Center for Business & Economic Analysis, Inc.Note: Each figure reported is an average of the figures for the three months, unless otherwise indicated.
23
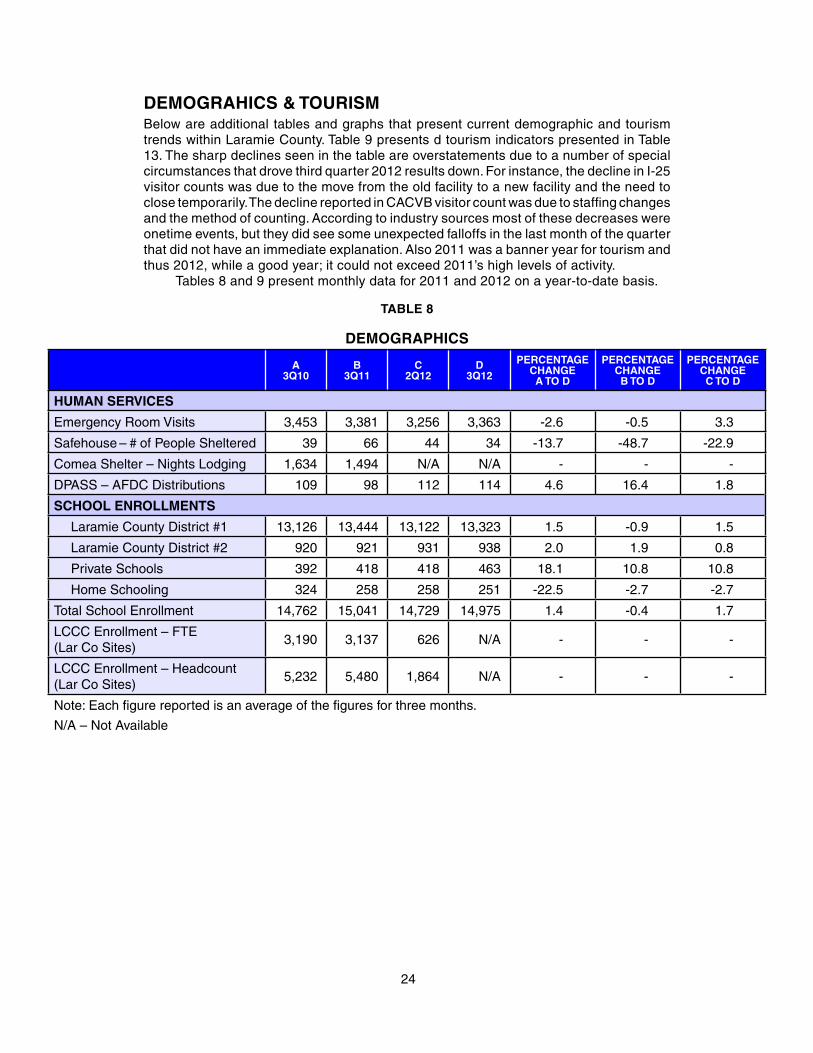
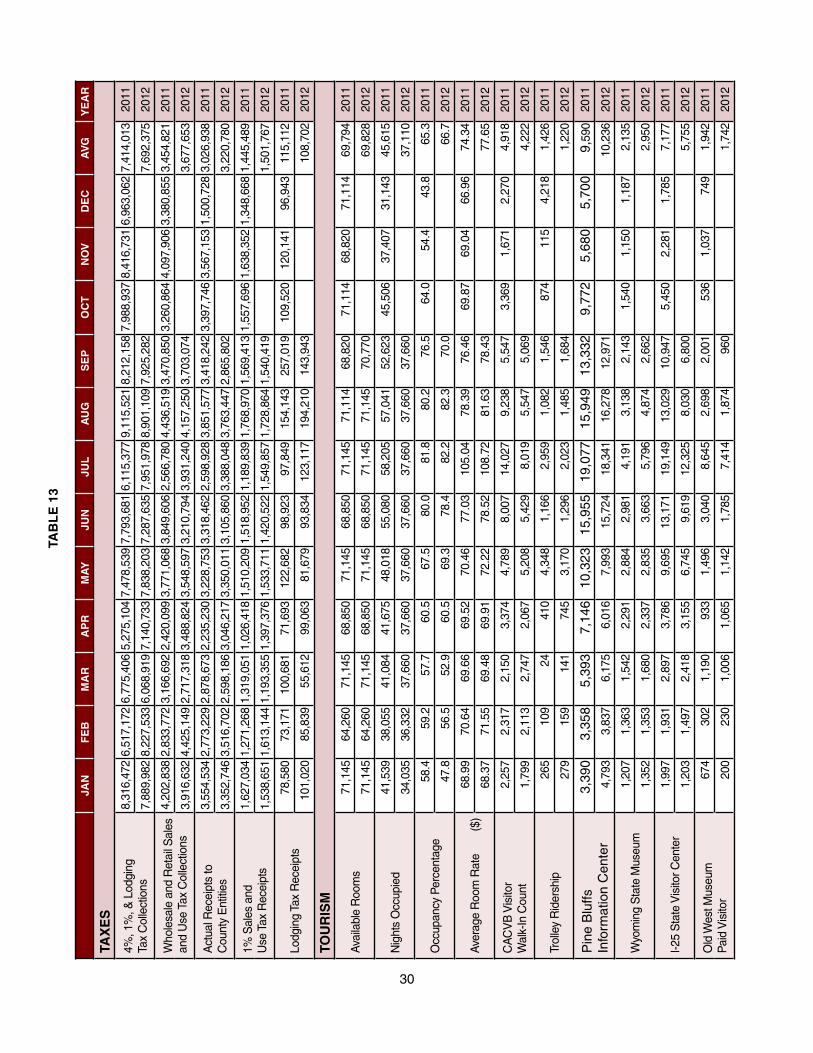
DEMOGRAHICS & TOURISMBelow are additional tables and graphs that present current demographic and tourism trends within Laramie County. Table 9 presents d tourism indicators presented in Table 13. The sharp declines seen in the table are overstatements due to a number of special circumstances that drove third quarter 2012 results down. For instance, the decline in I-25 visitor counts was due to the move from the old facility to a new facility and the need to close temporarily. The decline reported in CACVB visitor count was due to staffing changes and the method of counting. According to industry sources most of these decreases were onetime events, but they did see some unexpected falloffs in the last month of the quarter that did not have an immediate explanation. Also 2011 was a banner year for tourism and thus 2012, while a good year; it could not exceed 2011’s high levels of activity.
Tables 8 and 9 present monthly data for 2011 and 2012 on a year-to-date basis.
TABLE 8
DEMOGRAPHICS
A 3Q10
B 3Q11
C 2Q12
D 3Q12
PERCENTAGECHANGEA TO D
PERCENTAGECHANGEB TO D
PERCENTAGECHANGEC TO D
HUMAN SERVICES
Emergency Room Visits 3,453 3,381 3,256 3,363 -2.6 -0.5 3.3
Safehouse – # of People Sheltered 39 66 44 34 -13.7 -48.7 -22.9
Comea Shelter – Nights Lodging 1,634 1,494 N/A N/A - - -
DPASS – AFDC Distributions 109 98 112 114 4.6 16.4 1.8
SCHOOL ENROLLMENTS
Laramie County District #1 13,126 13,444 13,122 13,323 1.5 -0.9 1.5
Laramie County District #2 920 921 931 938 2.0 1.9 0.8
Private Schools 392 418 418 463 18.1 10.8 10.8
Home Schooling 324 258 258 251 -22.5 -2.7 -2.7
Total School Enrollment 14,762 15,041 14,729 14,975 1.4 -0.4 1.7
LCCC Enrollment – FTE (Lar Co Sites)
3,190 3,137 626 N/A - - -
LCCC Enrollment – Headcount (Lar Co Sites)
5,232 5,480 1,864 N/A - - -
Note: Each figure reported is an average of the figures for three months.
N/A – Not Available
24
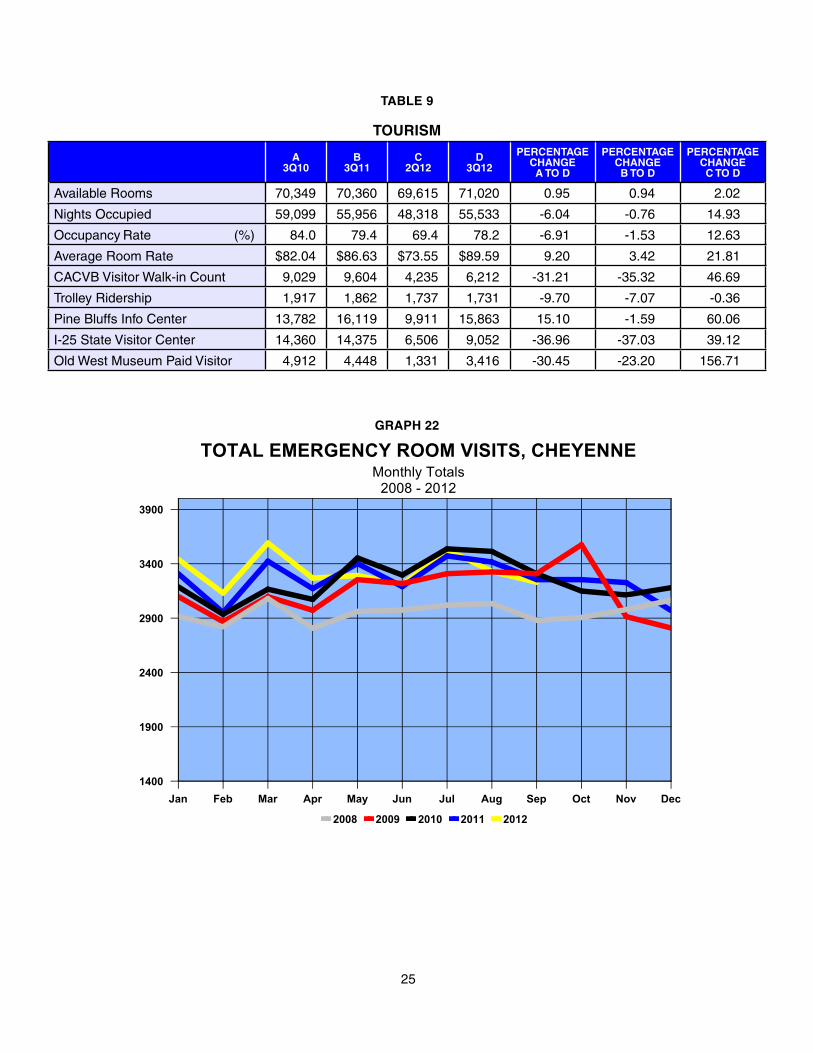
TABLE 9
TOURISM
A 3Q10
B 3Q11
C 2Q12
D 3Q12
PERCENTAGECHANGEA TO D
PERCENTAGECHANGEB TO D
PERCENTAGECHANGEC TO D
Available Rooms 70,349 70,360 69,615 71,020 0.95 0.94 2.02
Nights Occupied 59,099 55,956 48,318 55,533 -6.04 -0.76 14.93
Occupancy Rate (%) 84.0 79.4 69.4 78.2 -6.91 -1.53 12.63
Average Room Rate $82.04 $86.63 $73.55 $89.59 9.20 3.42 21.81
CACVB Visitor Walk-in Count 9,029 9,604 4,235 6,212 -31.21 -35.32 46.69
Trolley Ridership 1,917 1,862 1,737 1,731 -9.70 -7.07 -0.36
Pine Bluffs Info Center 13,782 16,119 9,911 15,863 15.10 -1.59 60.06
I-25 State Visitor Center 14,360 14,375 6,506 9,052 -36.96 -37.03 39.12
Old West Museum Paid Visitor 4,912 4,448 1,331 3,416 -30.45 -23.20 156.71
GRAPH 22
TOTAL EMERGENCY ROOM VISITS, CHEYENNEMonthly Totals
2008 - 2012
Jan Feb Mar Apr May Jun Jul Aug Sep Oct Nov Dec1400
1900
2400
2900
3400
3900
2008 2009 2010 2011 2012
25
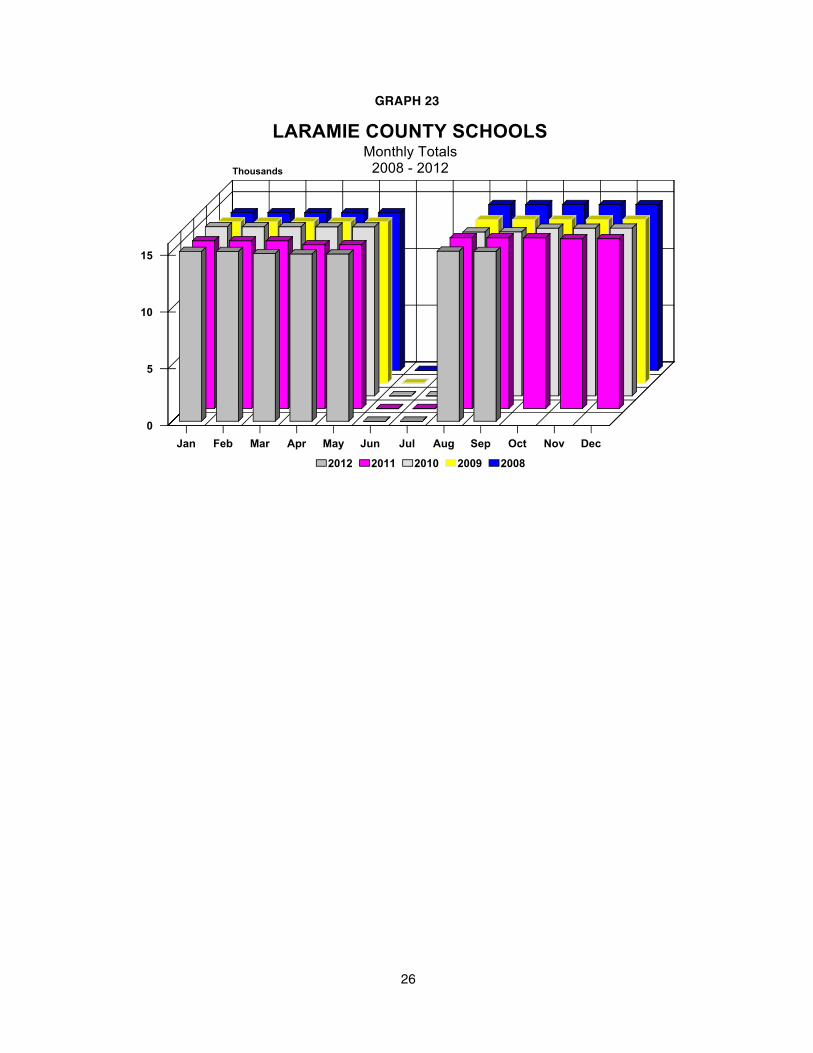
GRAPH 23
LARAMIE COUNTY SCHOOLSMonthly Totals
Thousands 2008 - 2012
15
10
5
0Jan Feb Mar Apr May Jun Jul Aug Sep Oct Nov Dec
2012 2011 2010 2009 2008
26

TAB
LE
10
JAN
FE
BM
AR
AP
RM
AY
JUN
JUL
AU
GS
EP
OC
TN
OV
DE
CA
VG
YE
AR
EM
PL
OY
ME
NT
*
Tota
l Civ
ilian
Lab
or
For
ce (
LAU
S)
44,5
9744
,699
45,3
5845
,205
44,6
9544
,899
45,6
4145
,546
44,4
1944
,994
45,4
3145
,287
45,0
6420
11
45,4
9046
,110
45,7
0745
,041
45,1
5745
,974
46,2
7445
,843
44,5
8245
,575
2012
Tota
l Em
ploy
men
t (L
AU
S)
40,9
2941
,281
42,0
5742
,326
41,8
8141
,948
42,7
2942
,585
41,6
4442
,223
42,6
5042
,338
42,0
4920
11
42,1
5843
,017
42,6
6242
,313
42,6
0443
,071
43,4
5343
,186
42,2
5742
,747
2012
Tota
l Em
ploy
men
t (C
ES
)42
,600
42,7
0043
,300
44,1
0044
,300
44,9
0044
,900
45,0
0044
,800
45,1
0045
,100
44,9
0044
,308
2011
44,2
0044
,600
44,9
0044
,700
45,7
0046
,400
46,3
0046
,300
45,7
0045
,422
2012
Tota
l Une
mpl
oym
ent
(LA
US
)3,
668
3,41
83,
301
2,87
92,
814
2,95
12,
912
2,96
12,
775
2,77
12,
781
2,94
93,
015
2011
3,33
23,
093
3,04
52,
728
2,55
32,
903
2,82
12,
708
2,32
52,
834
2012
Une
mpl
oym
ent R
ate
(LA
US
)8.
2%7.
6%7.
3%6.
4%6.
3%6.
6%6.
4%6.
5%6.
2%6.
2%6.
1%6.
5%6.
7%20
11
7.3%
6.7%
6.7%
6.1%
5.7%
6.3%
6.1%
5.9%
5.2%
6.2%
2012
Initi
al U
nem
ploy
men
t C
laim
s18
897
9681
6662
8373
6381
8514
093
2011
147
8479
5863
7478
8069
8120
12
Hel
p W
ante
d A
ds52
5560
7158
7364
8879
7361
5065
2011
4648
6567
8072
6484
6265
2012
GE
NE
RA
L B
US
INE
SS
AC
TIV
ITY
Aut
o R
egis
trat
ions
2,45
62,
399
3,39
13,
051
3,14
03,
584
2,83
64,
081
3,97
43,
752
2,86
32,
650
3,18
120
11
2,41
72,
737
3,37
13,
244
3,43
63,
451
3,29
73,
787
2,87
93,
180
2012
Enp
lane
men
ts –
C
hey.
Air
port
1,78
91,
397
1,78
31,
787
2,00
32,
139
2,28
12,
373
1,98
21,
801
1,75
61,
685
1,89
820
11
1,55
71,
467
1,68
996
61,
079
1,01
71,
208
1,10
21,
148
1,24
820
12
Ret
ail S
ales
($)
99,2
54,1
0068
,616
,400
78,5
95,6
0063
,720
,600
86,3
74,3
0094
,370
,000
71,5
52,8
0010
3,63
3,30
010
1,88
6,20
092
,750
,000
102,
580,
600
90,8
67,6
0087
,850
,125
2011
91,3
09,2
0098
,401
,800
76,6
18,5
0084
,056
,000
96,1
24,6
0088
,808
,200
97,3
03,6
0010
9,45
3,30
095
,927
,100
93,1
11,3
6720
12
Ban
krup
tcie
s17
1532
3133
1920
1927
2212
1021
2011
515
2329
2112
2723
2019
2012
* La
bor
stat
istic
s ar
e co
mpi
led
from
two
maj
or s
ourc
es:
Cur
rent
Pop
ulat
ion
Sur
vey
(CP
S)
and
Cur
rent
Em
ploy
men
t Sta
tistic
s (C
ES
). L
ocal
Are
a U
nem
ploy
men
t Sta
tistic
s (L
AU
S)
are
estim
ated
bas
ed o
n C
PS
dat
a w
hich
is c
olle
cted
thro
ugh
hous
ehol
d su
rvey
s w
hich
indi
vidu
als
are
repo
rted
as
em
ploy
ed, u
nem
ploy
ed o
r no
t in
the
labo
r fo
rce.
Thi
s da
ta in
clud
es e
mpl
oym
ent f
or b
oth
agric
ultu
re a
nd n
onag
ricul
tura
l ind
ustr
ies.
CE
S d
ata
is
base
d on
est
ablis
hmen
t rec
ords
com
pile
d th
roug
h m
onth
ly s
urve
ys o
f non
farm
em
ploy
ers.
Indi
vidu
als
who
wor
ked
in m
ore
than
one
est
ablis
hmen
t, fu
ll or
par
t-tim
e, a
re c
ount
ed e
ach
time
thei
r na
mes
app
ear
on p
ayro
lls.
27

TAB
LE
11
JAN
FE
BM
AR
AP
RM
AY
JUN
JUL
AU
GS
EP
OC
TN
OV
DE
CA
VG
YE
AR
HO
US
ING
Tota
l Res
iden
tial
Uni
ts fo
r S
ale
646
624
639
744
688
715
726
665
634
608
582
492
647
2011
547
537
551
596
618
611
583
586
552
576
2012
Tota
l Res
iden
tial U
nits
Sol
d74
7312
813
012
511
913
811
612
213
994
9011
220
11
7591
120
147
136
143
133
138
126
123
2012
Ave
rage
Res
iden
tial S
old
Pric
e (c
ity)
167,
186
178,
630
181,
633
164,
487
171,
879
191,
802
179,
702
200,
592
186,
013
185,
008
184,
113
177,
071
180,
676
2011
157,
916
191,
122
185,
535
181,
817
184,
478
195,
295
184,
490
197,
053
203,
258
186,
774
2012
Fur
nish
ed A
part
men
ts2
41
22
33
23
35
53
2011
34
26
33
22
33
2012
Unf
urni
shed
Apa
rtm
ents
7365
4445
5154
5347
5048
5857
5420
11
5852
5457
4955
4537
4350
2012
Hom
es &
Dup
lexe
s36
2320
2014
1922
2733
3532
3026
2011
3122
2221
2423
1923
2023
2012
Mob
ile H
omes
57
77
55
74
45
46
520
11
57
67
59
75
66
2012
Sam
pled
Apa
rtm
ents
%
Vac
ant
4.6%
5 .1%
4.2%
3.3%
2.9%
2.8%
2.9%
2.9%
2.4%
3.9%
3.5%
3.8%
3.5%
2011
3.8%
3.5%
2.9%
3.9%
3.3%
2.5%
2.6%
3.5%
2.5%
3.2%
2012
CO
NS
TR
UC
TIO
N
Sin
gle
Fam
ily B
ldg.
Per
mits
(C
heye
nne)
713
2216
3118
1011
2515
1712
1620
11
1420
3318
2120
1841
821
2012
Sin
gle
Fam
ily B
ldg.
Per
mits
(L
aram
ie C
ount
y)2
510
811
145
68
74
07
2011
82
1311
1114
95
49
2012
Sep
tic P
erm
its –
Rur
al8
714
811
277
2016
619
1213
2011
78
812
1217
1516
1312
2012
Tota
l Bui
ldin
g P
erm
its
(Che
yenn
e)90
115
161
145
149
146
126
158
209
197
166
225
157
2011
128
113
192
187
189
187
166
210
135
167
2012
Val
ue o
f Aut
horiz
ed C
onst
($
000)
(C
heye
nne)
2,15
73,
760
15,3
514,
713
7,06
215
,032
5,20
137
98,
041
8,50
73,
612
3,84
16,
471
2011
3,47
05,
419
8,34
56,
009
11,5
676,
942
6,02
110
,471
32,3
5610
,067
2012
Res
iden
tial (
$000
) (C
heye
nne)
1,31
82,
330
4,02
02,
876
4,69
03,
611
1,41
71,
766
4,06
52,
498
2,24
02,
275
2,75
920
11
1,99
62,
903
4,61
12,
470
3,26
54,
024
2,96
16,
525
1,12
83,
320
2012
Not
e: D
ata
is n
ot s
easo
nally
adj
uste
d.
Sin
gle
fam
ily b
uild
ing
perm
its fo
r C
heye
nne
incl
udes
new
res
iden
ces
and
new
tow
nhou
ses.
28

TAB
LE
12
JAN
FE
BM
AR
AP
RM
AY
JUN
JUL
AU
GS
EP
OC
TN
OV
DE
CA
VG
YE
AR
UT
ILIT
IES
Com
mer
cial
Ele
ctric
Pow
er
(Kw
h) (
‘0,0
00)
5,10
34,
889
4,94
24,
867
4,43
84,
939
5,12
85,
255
5,22
25,
020
5,11
45,
178
5,00
820
11
5,10
04,
992
5,12
85,
155
5,13
05,
053
5,45
74,
504
4,58
65,
012
2012
Res
iden
tial G
as U
sage
(M
cf)
(‘000
)4,
155
3,98
13,
283
2,49
22,
008
1,21
359
750
657
093
32,
496
3,48
72,
143
2011
3,68
33,
652
3,45
91,
748
1,22
576
452
550
955
31,
791
2012
Met
ered
Wat
er T
aps
(CB
PU
)22
,219
22,1
8321
,987
22,2
4722
,336
22,3
8722
,392
22,4
8522
,488
22,4
9122
,419
22,4
2022
,338
2011
22,3
8522
,400
22,4
0522
,468
22,5
5122
,571
22,5
8722
,680
22,5
9422
,516
2012
Met
ered
Wat
er T
aps
(S
CW
& S
D)
3,30
53,
305
3,30
53,
305
3,30
53,
305
3,30
73,
307
3,30
83,
308
3,30
83,
308
3,30
620
11
3,30
83,
309
3,31
03,
310
3,31
03,
310
3,31
03,
310
3,31
03,
310
2012
HU
MA
N S
ER
VIC
ES
Tota
l Em
erge
ncy
R
oom
Vis
its3,
309
2,95
23,
424
3,17
13,
402
3,19
03,
472
3,41
73,
254
3,25
43,
227
2,97
03,
254
2011
3,44
13,
130
3,59
13,
268
3,29
23,
207
3,53
13,
329
3,23
03,
335
2012
Saf
ehou
se –
Num
ber
of
Peo
ple
She
ltere
d36
2521
2735
4052
7768
5339
2842
2011
3127
2844
4839
2244
3535
2012
Com
ea S
helte
r –
To
tal N
ight
s Lo
dgin
g1,
205
1,11
01,
382
1,27
11,
527
1,50
5N
/AN
/A1,
494
1,31
5N
/AN
/A1,
351
2011
2,00
11,
540
1,67
2N
/AN
/AN
/AN
/AN
/AN
/A1,
738
2012
SC
HO
OL
EN
RO
LL
ME
NT
S
Lara
mie
Cou
nty
Dis
tric
t #1
13,1
2613
,126
13,1
2612
,785
12,7
85-
-13
,444
13,4
4413
,444
13,3
6013
,360
13,2
0020
11
13,3
6013
,360
13,1
6513
,122
13,1
22-
-13
,336
13,3
0913
,253
2012
Lara
mie
Cou
nty
Dis
tric
t #2
937
928
929
928
928
--
926
915
921
921
930
926
2011
930
925
930
931
931
--
938
938
932
2012
Tota
l Sch
ool E
nrol
lmen
t14
,779
14,7
7014
,771
14,4
2914
,429
--
15,0
4615
,035
15,0
4114
,957
14,9
6614
,822
2011
14,9
6614
,961
14,7
7114
,729
14,7
29-
-14
,988
14,9
6114
,872
2012
LCC
C E
nrol
lmen
t –
FT
E (
Lar
Co
Site
s)34
15.5
934
15.5
934
15.5
934
15.5
934
15.5
971
6.75
716.
7531
36.6
831
36.6
831
36.6
831
36.6
831
36.6
82,
849.
5720
11
3240
.50
3240
.50
3240
.50
3240
.50
3240
.50
626.
1662
6.16
N/A
N/A
2,49
3.55
2012
LCC
C E
nrol
lmen
t –
Hea
dcou
nt (
Lar
Co
Site
s)
5,96
25,
962
5,96
25,
962
5,96
21,
964
1,96
45,
480
5,48
05,
480
5,48
05,
480
5,09
520
11
5,69
45,
694
5,69
45,
694
5,69
41,
864
1,86
4N
/AN
/A4,
600
2012
N/A
– N
ot A
vaila
ble
Not
e: D
ata
is n
ot s
easo
nally
adj
uste
d.
29
TAB
LE
13
JAN
FE
BM
AR
AP
RM
AY
JUN
JUL
AU
GS
EP
OC
TN
OV
DE
CA
VG
YE
AR
TAX
ES
4%, 1
%, &
Lod
ging
Ta
x C
olle
ctio
ns8,
316,
472
6,51
7,17
2 6,
775,
406
5,27
5,10
4 7,
478,
539
7,79
3,68
1 6,
115,
377
9,11
5,52
1 8,
212,
158
7,98
8,93
7 8,
416,
731
6,96
3,06
2 7,
414,
013
2011
7,88
9,98
2 8,
227,
533
6,06
8,91
9 7,
140,
733
7,83
8,20
3 7,
287,
635
7,95
1,97
8 8,
901,
109
7,92
5,28
2 7,
692,
375
2012
Who
lesa
le a
nd R
etai
l Sal
es
and
Use
Tax
Col
lect
ions
4,20
2,83
8 2,
833,
772
3,16
6,69
2 2,
420,
099
3,77
1,06
8 3,
849,
606
2,56
6,78
0 4,
436,
519
3,47
0,85
0 3,
260,
864
4,09
7,90
6 3,
380,
855
3,45
4,82
1 20
11
3,91
6,63
2 4,
425,
149
2,71
7,31
8 3,
488,
824
3,54
8,59
7 3,
210,
794
3,93
1,24
0 4,
157,
250
3,70
3,07
4 3,
677,
653
2012
Act
ual R
ecei
pts
to
Cou
nty
Ent
ities
3,55
4,53
4 2,
773,
229
2,87
8,67
3 2,
235,
230
3,22
8,75
3 3,
318,
462
2,59
8,92
8 3,
851,
577
3,41
8,24
2 3,
397,
746
3,56
7,15
3 1,
500,
728
3,02
6,93
8 20
11
3,35
2,74
6 3,
516,
702
2,59
8,18
6 3,
046,
217
3,35
0,01
1 3,
105,
860
3,38
8,04
8 3,
763,
447
2,86
5,80
2 3,
220,
780
2012
1% S
ales
and
U
se T
ax R
ecei
pts
1,62
7,03
4 1,
271,
268
1,31
9,05
1 1,
026,
418
1,51
0,20
9 1,
518,
952
1,18
9,83
9 1,
768,
970
1,56
9,41
3 1,
557,
696
1,63
8,35
2 1,
348,
668
1,44
5,48
9 20
11
1,53
8,65
1 1,
613,
144
1,19
3,35
5 1,
397,
376
1,53
3,71
1 1,
420,
522
1,54
9,85
7 1,
728,
864
1,54
0,41
9 1,
501,
767
2012
Lodg
ing
Tax
Rec
eipt
s78
,580
73
,171
10
0,68
1 71
,693
12
2,68
2 98
,923
97
,849
15
4,14
3 25
7,01
9 10
9,52
0 12
0,14
1 96
,943
11
5,11
2 20
11
101,
020
85,8
39
55,6
12
99,0
63
81,6
79
93,8
34
123,
117
194,
210
143,
943
108,
702
2012
TOU
RIS
M
Ava
ilabl
e R
oom
s71
,145
64,2
6071
,145
68,8
5071
,145
68,8
5071
,145
71,1
1468
,820
71,1
1468
,820
71,1
1469
,794
20
11
71,1
4564
,260
71,1
4568
,850
71,1
4568
,850
71,1
4571
,145
70,7
7069
,828
20
12
Nig
hts
Occ
upie
d41
,539
38,0
5541
,084
41,6
7548
,018
55,0
8058
,205
57,0
4152
,623
45,5
0637
,407
31,1
4345
,615
20
11
34,0
3536
,332
37,6
6037
,660
37,6
6037
,660
37,6
6037
,660
37,6
6037
,110
20
12
Occ
upan
cy P
erce
ntag
e58
.459
.257
.760
.567
.580
.081
.880
.276
.564
.054
.443
.865
.3
2011
47.8
56.5
52.9
60.5
69.3
78.4
82.2
82.3
70.0
66.7
20
12
Ave
rage
Roo
m R
ate
($
)68
.99
70.6
469
.66
69.5
270
.46
77.0
310
5.04
78.3
976
.46
69.8
769
.04
66.9
674
.34
2011
68.3
771
.55
69.4
869
.91
72.2
278
.52
108.
7281
.63
78.4
377
.65
2012
CA
CV
B V
isito
r W
alk-
In C
ount
2,25
72,
317
2,15
03,
374
4,78
98,
007
14,0
279,
238
5,54
73,
369
1,67
12,
270
4,91
8 20
11
1,79
92,
113
2,74
72,
067
5,20
85,
429
8,01
95,
547
5,06
94,
222
2012
Trol
ley
Rid
ersh
ip26
510
924
410
4,34
81,
166
2,95
91,
082
1,54
687
411
54,
218
1,42
6 20
11
279
159
141
745
3,17
01,
296
2,02
31,
485
1,68
41,
220
2012
Pin
e B
luffs
In
form
atio
n C
ente
r3,
390
3,35
85,
393
7,14
610
,323
15,9
5519
,077
15,9
4913
,332
9,77
25,
680
5,70
09,
590
2011
4,79
33,
837
6,17
56,
016
7,99
315
,724
18,3
4116
,278
12,9
7110
,236
20
12
Wyo
min
g S
tate
Mus
eum
1,20
71,
363
1,54
22,
291
2,88
42,
981
4,19
13,
138
2,14
31,
540
1,15
01,
187
2,13
5 20
11
1,35
21,
353
1,68
02,
337
2,83
53,
663
5,79
64,
874
2,66
22,
950
2012
I-25
Sta
te V
isito
r Cen
ter
1,99
71,
931
2,89
73,
786
9,69
513
,171
19,1
4913
,029
10,9
475,
450
2,28
11,
785
7,17
7 20
11
1,20
31,
497
2,41
83,
155
6,74
59,
619
12,3
258,
030
6,80
05,
755
2012
Old
Wes
t Mus
eum
P
aid
Vis
itor
674
302
1,19
093
31,
496
3,04
08,
645
2,69
82,
001
536
1,03
774
91,
942
2011
200
230
1,00
61,
065
1,14
21,
785
7,41
41,
874
960
1,74
2 20
12
30

CHEYENNE/LARAMIE COUNTY PROFILEITEMS MOST RECENT PERIOD PREVIOUS PERIOD % CHANGE
IN VALUEYEAR VALUE YEAR VALUEDemographyTotal Population – Cheyenne¹ 2011 58,640 2010 59,466 -1.39%
Total Population – Laramie County 2011 90,394 2010 91,738 -1.47%
Total Male Population 2011 45,020 2010 45,875 -1.86%
Total Female Population 2011 45,374 2010 45,863 -1.07%
% of Population – Under 20 Years Old 2011 27.2% 2010 27.4% -0.73%
% of Population – 65 Years & Older 2011 12.3% 2010 12.5% -1.60%
Median Age 2011 37.1 2010 37.0 0.27%
% of Population – White Alone (Non-Hispanic) 2011 87.2% 2010 88.5% -1.47%
% of Population – Native American Alone 2011 1.1% 2010 1.0% 10.00%
% of Population – Hispanic or Latino 2011 12.9% 2010 13.1% -1.53%
Households – County 2011 36,566 2010 37,576 -2.69%
Average Household Size – County 2011 2.4 2010 2.4 0.00%
Households – City 2011 24,693 2010 25,557 -3.38%
% of Households (HH) Headed by Married Couples 2011 50.9% 2010 43.1% 18.10%
% of HH Headed by Single Female (w/own children <18 yrs.) 2011 10.4% 2010 7.7% 35.06%
Weather & GeographyTotal Area (sq. miles)¹ 2000 2,688 - -
Total Area (sq. miles)¹¹ – Cheyenne 2011 25.48 2010 25.15 1.31%
Water Area (sq. miles) 2000 1.6 - -
Mean Elevation (ft.) 2000 6,100 - -
Normal Mean Temperature (F) – Cheyenne2 1949-06 45.9 1971-00 44.9 2.23%
Average Annual Precipitation (inches) – Cheyenne2 1949-06 14.6 1971-00 15.5 -5.50%
Average Wind Speed (mph) 1996-06 12.4 1992-02 12.6 -1.59%
Crime & Law EnforcementCrimes3 2011 2,784 2010 2,972 -6.33%
Crimes per 10,000 Persons 2011 308.0 2010 324.0 -4.93%
Homicides per 10,000 Persons 2011 0.2 2010 0.0
Rapes per 10,000 Persons 2011 4.3 2010 4.9 -11.44%
Robberies per 10,000 Persons 2011 3.3 2010 2.7 21.44%
Aggravated Assaults per 10,000 Persons 2011 16.9 2010 14.1 19.70%
Burglaries per 10,000 Persons 2011 43.6 2010 40.0 8.85%
Larcenies & Thefts per 10,000 Persons 2011 228.8 2010 277.2 -17.47%
Motor Vehicle Thefts per 10,000 Persons 2011 10.8 2010 14.1 -23.33%
Education% of Pop. (25 yrs. & older) with High School Diploma¹ 2011 92.2% 2010 93.8% -1.71%
% of Pop. (25 yrs. & older) with Bachelor’s Degree 2011 24.4% 2010 22.6% 7.96%
Pupil -Teacher Ratio in LCSD #14 2006-07 10.38 2005-06 10.36 0.19%
Pupil -Teacher Ratio in LCSD #2 2006-07 7.47 2005-06 6.53 14.40%
Expenditures Per Pupil in LCSD #1 2010-11 $15,170 2009-10 $14,585 4.01%
Expenditures Per Pupil in LCSD #2 2010-11 $20,462 2009-10 $18,930 8.09%
LCSD #1 Enrollment 2010-11 13,370 2009-10 13,171 1.51%
LCSD #2 Enrollment 2010-11 916 2009-10 925 -0.97%
Total School Enrollments Laramie County 2010-11 14,966 2009-10 14,776 1.29%
% of Students in Private Schools 2010-11 2.79% 2009-10 2.65% 5.28%
% of Students Home-Schooled 2010-11 1.72% 2009-10 2.19% -21.38%
ACT Average Composite Score (range 1-36) LCSD #1 2010-11 20.2 2009-10 19.1 5.76%
ACT Average Composite Score (range 1-36) LCSD #2 2010-11 20.5 2009-10 19.6 4.59%
31
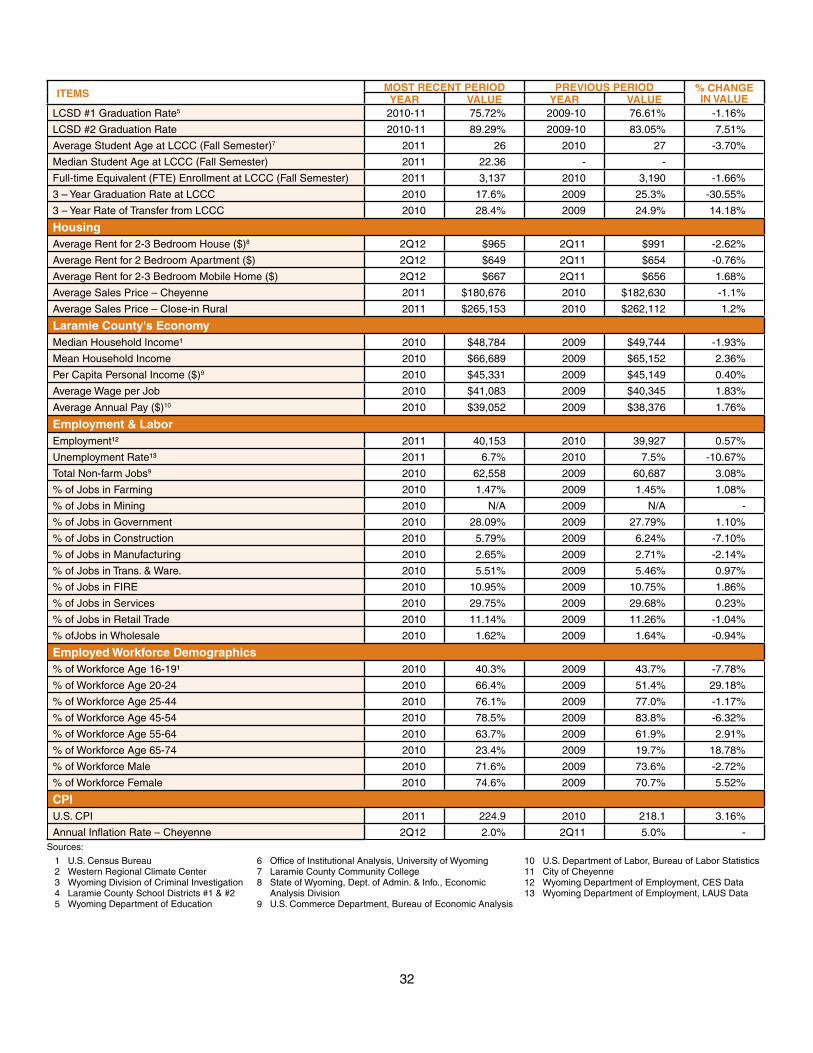
ITEMS MOST RECENT PERIOD PREVIOUS PERIOD % CHANGEIN VALUEYEAR VALUE YEAR VALUE
LCSD #1 Graduation Rate5 2010-11 75.72% 2009-10 76.61% -1.16%
LCSD #2 Graduation Rate 2010-11 89.29% 2009-10 83.05% 7.51%
Average Student Age at LCCC (Fall Semester)7 2011 26 2010 27 -3.70%
Median Student Age at LCCC (Fall Semester) 2011 22.36 - -
Full-time Equivalent (FTE) Enrollment at LCCC (Fall Semester) 2011 3,137 2010 3,190 -1.66%
3 – Year Graduation Rate at LCCC 2010 17.6% 2009 25.3% -30.55%
3 – Year Rate of Transfer from LCCC 2010 28.4% 2009 24.9% 14.18%
HousingAverage Rent for 2-3 Bedroom House ($)8 2Q12 $965 2Q11 $991 -2.62%
Average Rent for 2 Bedroom Apartment ($) 2Q12 $649 2Q11 $654 -0.76%
Average Rent for 2-3 Bedroom Mobile Home ($) 2Q12 $667 2Q11 $656 1.68%
Average Sales Price – Cheyenne 2011 $180,676 2010 $182,630 -1.1%
Average Sales Price – Close-in Rural 2011 $265,153 2010 $262,112 1.2%
Laramie County's EconomyMedian Household Income¹ 2010 $48,784 2009 $49,744 -1.93%
Mean Household Income 2010 $66,689 2009 $65,152 2.36%
Per Capita Personal Income ($)9 2010 $45,331 2009 $45,149 0.40%
Average Wage per Job 2010 $41,083 2009 $40,345 1.83%
Average Annual Pay ($)10 2010 $39,052 2009 $38,376 1.76%
Employment & LaborEmployment¹² 2011 40,153 2010 39,927 0.57%
Unemployment Rate¹³ 2011 6.7% 2010 7.5% -10.67%
Total Non-farm Jobs9 2010 62,558 2009 60,687 3.08%
% of Jobs in Farming 2010 1.47% 2009 1.45% 1.08%
% of Jobs in Mining 2010 N/A 2009 N/A -
% of Jobs in Government 2010 28.09% 2009 27.79% 1.10%
% of Jobs in Construction 2010 5.79% 2009 6.24% -7.10%
% of Jobs in Manufacturing 2010 2.65% 2009 2.71% -2.14%
% of Jobs in Trans. & Ware. 2010 5.51% 2009 5.46% 0.97%
% of Jobs in FIRE 2010 10.95% 2009 10.75% 1.86%
% of Jobs in Services 2010 29.75% 2009 29.68% 0.23%
% of Jobs in Retail Trade 2010 11.14% 2009 11.26% -1.04%
% ofJobs in Wholesale 2010 1.62% 2009 1.64% -0.94%
Employed Workforce Demographics% of Workforce Age 16-19¹ 2010 40.3% 2009 43.7% -7.78%
% of Workforce Age 20-24 2010 66.4% 2009 51.4% 29.18%
% of Workforce Age 25-44 2010 76.1% 2009 77.0% -1.17%
% of Workforce Age 45-54 2010 78.5% 2009 83.8% -6.32%
% of Workforce Age 55-64 2010 63.7% 2009 61.9% 2.91%
% of Workforce Age 65-74 2010 23.4% 2009 19.7% 18.78%
% of Workforce Male 2010 71.6% 2009 73.6% -2.72%
% of Workforce Female 2010 74.6% 2009 70.7% 5.52%
CPIU.S. CPI 2011 224.9 2010 218.1 3.16%
Annual Inflation Rate – Cheyenne 2Q12 2.0% 2Q11 5.0% -Sources:
1 U.S. Census Bureau 2 Western Regional Climate Center 3 Wyoming Division of Criminal Investigation 4 Laramie County School Districts #1 & #2 5 Wyoming Department of Education
6 7 8
9
Office of Institutional Analysis, University of WyomingLaramie County Community CollegeState of Wyoming, Dept. of Admin. & Info., Economic Analysis DivisionU.S. Commerce Department, Bureau of Economic Analysis
10 11 12 13
U.S. Department of Labor, Bureau of Labor Statistics City of CheyenneWyoming Department of Employment, CES DataWyoming Department of Employment, LAUS Data
32
DATA SOURCES
1. Automobile Registrations: Laramie County Auto Titles Bureau
2. Construction, Permits, Valuation, Residential: City of Cheyenne Building Permits Agency Laramie County Planning & Development Office
3. Employment: Wyoming Department of Workforce Services
4. Help-Wanted Advertisements: Center for Economic and Business Data
5. Sales and Use Tax Collections: Wyoming Department of Revenue and Taxation Department of Administration & Information – DA
6. Utilities, Electrical, and Natural Gas: Cheyenne Light, Fuel & Power
7. Water Usage – Metered Taps: Board of Public Utilities South Cheyenne Sewer & Water District
8. Banking Data: Cheyenne Area Credit Unions (9) Cheyenne Area Banks (5)
9. Enplanements: Cheyenne Airport Board
10. Housing: Center for Economic and Business Data Cheyenne Board of Realtors
11. Human Services: Cheyenne Police Department United Medical Center Safehouse Comea Shelter Department of Family Services School Districts No. 1 and No. 2 Private Schools (5)
12. Tourism: Visit Cheyenne
13. Bankruptcies: U.S. Clerk of Bankruptcy Court
Wyoming Center for Business & Economic Analysis, Inc.1720 Carey Ave., Suite 520 • Cheyenne, Wyoming 82001
(307) 632-1347
33
Recommended