Glasgow Theses Service http://theses.gla.ac.uk/
Ebireri, John Efe (2014) Bank market structure and industrialization: evidence from developing countries. PhD thesis. http://theses.gla.ac.uk/5297/ Copyright and moral rights for this thesis are retained by the author A copy can be downloaded for personal non-commercial research or study, without prior permission or charge This thesis cannot be reproduced or quoted extensively from without first obtaining permission in writing from the Author The content must not be changed in any way or sold commercially in any format or medium without the formal permission of the Author When referring to this work, full bibliographic details including the author, title, awarding institution and date of the thesis must be given.

BANK MARKET STRUCTURE AND
INDUSTRIALIZATION: EVIDENCE FROM
DEVELOPING COUNTRIES
By
John Efe Ebireri (Jnr)
Submitted in fulfilment of the requirements for the Degree of Doctor of Philosophy in
Economics
Adam Smith Business School
College of Social Sciences
University of Glasgow

2
ABSTRACT
This thesis examines how bank market structure affects industry performance in developing
countries. A high degree of bank concentration would be associated with tight constraints and
high borrowing costs, while it has also been argued that, it would be easier for firms to access
credit if the banking system is concentrated. Foreign banks are seen to promote financial
development and spur economic growth; while critics suggest that a larger foreign bank
presence in developing countries is associated with less credit to the private sector. Also,
government ownership of banks is responsible for lower economic growth and slow financial
development, while others argue that government banks promote long-run growth. The
implications of bank market structure on the real economy are examined using cross-country,
cross-industry panel data from developing countries, along with a variety of econometric
techniques, and standard measures of industry performance. The research aims to ascertain
whether bank market structure in developing countries influences financing for firms
differently as a result of industry-specific characteristics. It also examines if institutional
characteristics help in explaining industrial performance in the short-run. As a follow-up to
one of the findings, the research examines if banks would prefer to fund innovative firms in a
liberalized environment by exploring the impact of financial development on the export
structure. The main empirical findings are as follows: first, it may not be possible to identify
robust or consistent findings concerning the effects of good institutions; secondly, it might
not necessarily be the case that financial development specifically benefits firms based on
specific industry characteristics; and finally, the research finds that banking sector
development reduces export sophistication and increases export concentration. This may
suggest that banking sector development enforces specialization according to existing
comparative advantage.
Keywords: Bank concentration, foreign bank entry, government ownership of banks,
financial development, industrialization, institutional quality, export sophistication, export
diversification, developing countries.

3
TABLE OF CONTENTS
Abstract……………………………………………………………………………..................2
Table of Contents…………………………………………………………………...................3
List of Tables…………………………………………………………………………………..7
List of Figures………………………………………………………………………................9
Acknowledgement …………………………………………………………………...............10
Declaration…………………………………………………………………………...............12
CHAPTER 1: BACKGROUND AND JUSTIFICATION FOR THE STUDY
1.1. Introduction……………………………………………………………………………...13
1.2. Motivation for the Study………………………………………………………..............16
1.3. Significance of the Study and Problem Statement……………………………………....17
1.4. Data Sources……………………………………………………………………………..18
1.5. Research Methodology ………………………………………………………………….19
1.6. Structure of the Study……………………………………………………………………20
1.7. Conclusion……………………………………………………………………………….20
CHAPTER 2: BANK MARKET STRUCTURE AND INDUSTRY DEVELOPMENT
IN DEVELOPING COUNTRIES: THE ROLE OF INSTITUTIONS
2.1. Introduction ……………………………………………………………………………..20
2.2. Conceptual Framework …………………………………………………………………23
2.2.1. Background to the Relationship between Institutions and Economic Growth………...23
2.2.2. Bank Market Structure and the role of Institutions……………………………………24
2.2.2.1. Bank Concentration and the Role of Institutions……………………………………24
2.2.2.2. Foreign Bank Ownership and the Role of Institutions………………………………29
2.2.2.3. Government Bank Ownership and the Role of Institutions…………………………34
2.2.3. Methodological Approach……………………………………………………………..37
2.3. Empirical Framework…………………………………………………………………....38

4
2.3.1. Model Specification……………………………………………………………….......38
2.3.1.1. PMG Estimation……………………………………………………………………..38
2.3.1.2. Fixed Effects (FE) Estimation……………………………………….........................42
2.3.2. Variable Descriptions………………………………………………………………….44
2.3.3. Data Specification……………………………………………………………………..54
2.4. Empirical Results…………………………………………………………………..........57
2.4.1. Result Diagnostics………………………………………………………………..........57
2.4.2. Bank Market Structure on Industrialization Results……………………………..........57
2.4.2.1. PMG Baseline Model………………………………………………………………..57
2.4.2.2. FE Baseline Model…………………………………………………………………..58
2.4.2.3. Discussion of Baseline Results………………….......................................................58
2.4.2.4. Discussion of Correlations and FE Interactions……………………………………..63
2.5. Conclusion……………………………………………………………………………….79
Appendix 2.1: List of Countries and Bank Market Structure………………………………...84
Appendix 2.2: Summary Table for Institutional Variables…………………………………..85
Appendix 2.3: Panel Unit Roots for all Variables in Regression, 1995-2007………………..85
Appendix 2.4: Panel Cointegration Test Results, 1995-2007………………………………..86
Appendix 2.5: Hausmann Test between MG and PMG Estimates…………………………..88
Appendix 2.6: Scatter Plots showing the relationship between Manufacturing value Added
Growth and Bank Market Structure over different time periods……………89
CHAPTER 3: BANK MARKET STRUCTURE AND INDUSTRALIZATION IN
DEVELOPING COUNTRIES: EVIDENCE FROM INDUSTRY-SPECIFIC DATA
3.1 Introduction………………………………………………………………………………92
3.2. Theoretical and Conceptual Framework…………………………………………...........93
3.2.1. Banking Market Structure and Economic Development………………………............93
3.2.1.1. Bank Concentration and Industry Characteristics…………………….......................94
3.2.1.2. Foreign Bank Entry and Industry Characteristics …………………………………..97

5
3.2.1.3. State Ownership of Banks and Industry Characteristics ……………………………99
3.2.2. Methodological Approach……………………………………………………………101
3.3. Empirical Framework…..................................................................................................103
3.3.1. Model Specifications………………………………………………………………....103
3.3.2. The Econometric Model……………………………………………………………...105
3.3.3. Variable Description …………………………………………………………............108
3.3.4. Data Specification ……………………………………………………………...........114
3.4. Empirical Results………………………………………………………………………115
3.4.1. Result Diagnostics……………………………………………………………………115
3.4.2. Baseline Models: Cross-Country Effect……………………………………………...117
3.4.3. Interaction Models: Industry-Specific Effects……………………………………….119
3.4.3.1. External Financial Dependence…………………………………………………….119
3.4.3.2. Small Firm Share…………………………………………………………………...121
3.4.3.3. Average Firm Size………………………………………………………………….122
3.4.3.4. Labour Intensity……………………………………………………………………124
3.4.3.5. High Technology Intensive Industry Dummy……………………………………...126
3.4.3.6. Lagged Industry Value Added Ratio……………………………………………….127
3.4.3.7. Initial Industry Value Added Ratio………………………………………………...129
3.4.3.8. Industry Employment Share………………………………………………………..130
3.5. Conclusion……………………………………………………………………………...130
Appendix 3.1: Manufacturing Industry Specific Characteristics…………………………...135
Appendix 3.2: Scatter Plots showing the relationship between Manufacturing Value Added
Growth/Net Firm Entry and Bank Market Structure over different time
Periods………………………………………………………………………135
CHAPTER 4: THE EFFECT OF FINANCIAL DEVELOPMENT ON
EXPORT SOPHISTICATION AND EXPORT DIVERSIFICATION IN
DEVELOPING COUNTRIES
4.1. Introduction……………………………………………………………………….........140
4.2. Conceptual Framework………………………………………………………………...142

6
4.2.1. Background to the Effects of Financial Development on International Trade……….142
4.2.2. Export Structure: A Theoretical Framework…………………………………………149
4.2.2.1. Export Sophistication…………………………………..…………………………..149
4.2.2.2. Export Diversification……………………………………………………………...155
4.2.3. Methodological Approach……………………………………………………………162
4.3. Empirical Framework……………………………………………………...…………...163
4.3.1. Model Specifications…………………………………………………………………163
4.3.2. Variable Descriptions………………………………………………………………...164
4.3.3. Data Specification……………………………………………………………………167
4.4. Empirical Results………………………………………………………………………169
4.4.1. Result Diagnostics……………………………………………………………………169
4.4.2. Export Sophistication………………………………………………………………...169
4.4.3. Export Diversification ……………………………...………………………………..173
4.4.4. Robustness..............................................................................................................175
4.5. Conclusion……………………………………………………………………………...176
Appendix 4.1: Export Sophistication and Concentration at Country Levels……………….179
Appendix 4.2: Trend in Export Sophistication for each Country…………………………...180
Appendix 4.3: Relationship between Export Sophistication and GDP per capita………….181
Appendix 4.4: Trend in Export Concentration for each Country…………………………...181
Appendix 4.5: Relationship between Export Concentration and GDP per capita…………..182
Appendix 4.6: Scatter Plots showing the relationship between Export Sophistication/
Concentration over different time periods…………………………………..182
CHAPTER 5: CONCLUSION AND POLICY RECOMMENDATION
5.1. Summary of Findings ………………………………………………………………….185
5.2. Contribution to the Literature…………………………………………………………..188
5.3. Policy Recommendations………………………………………………………………189
5.4. Future Research and Conclusion ………………………………………………............191
Bibliography…………………………………………………………………………...........192

7
List of Tables
Table 2.1 Summary Statistics for Key Variables, 1995-2007………………………………..55
Table 2.2 Pairwise Corr. for Bank Market Structure and Institutional Variables……………56
Table 2.3 Long- and Short-Run Effect of Bank Market Structure on Industrialization……60
Table 2.4 The Effect of Bank Market Structure on Industrialization………………………...61
Table 2.5 Corr. between SR PMG Results and Institutional Variables (BCON)…………….64
Table 2.6 BCON & its interaction with measures of Institutional Quality………………….64
Table 2.7 Corr. between SR PMG Results and Institutional Variables (FBANK)………....70
Table 2.8 FBANK & its interaction with measures of Institutional Quality...………………70
Table 2.9 Corr. between SR PMG Results and Institutional Variables (GBANK)…………...74
Table 2.10 GBANK & its interaction with measures of Institutional Quality…………..…....75
Table 3.1 Summary Statistics of Key Variables, 1995-2007……………………………….115
Table 3.2 Pairwise Corr. Matrix for Bank Market Structure and other Variables………….116
Table 3.3 Baseline Models for Industry Growth and Net Firm Entry………………………118
Table 3.4 External Financial Dependence…………………………………………………..120
Table 3.5 Small Firm Share…………………………………………………………………121
Table 3.6 Average Firm Size………………………………………………………………..123
Table 3.7 Labour Intensity………………………………………………………………….125
Table 3.8 High Technological Intensity…………………………………………………….127
Table 3.9 Lagged Industry Value Added Ratio……………………………………………..128
Table 3.10 Initial Industry value Added Ratio……………………………………………...129
Table 3.11 Industry Employment Share…………………………………………………….131
Table 4.1 Summary Statistics of Key Variables, 1985-2000……………………………….168
Table 4.2 Summary Statistics of Key Variables, 1995-2010……………………………….168
Table 4.3 Pairwise Corr. Matrix of Key Variables, 1985-2000…………………………….171
Table 4.4 Pairwise Corr. Matrix of Key Variables, 1995-2010…………………………….171

8
Table 4.5: The Effect of Financial Development on Export Sophistication……………......172
Table 4.6: The Effect of Financial Development on Export Diversification…………….....174
Table 4.7: The Effect of Financial Development on High-Skill Manufacture Exports…….175
Table 4.8: The Effect of Financial Development on Export Div. (Similarity Index)………176

9
List of Figures
Figure 4.1 Average Trade and Financial Development (World, 1970-2010)………………145
Figure 4.2 Trend of Export Sophistication in Developing Countries……………………….153
Figure 4.3 Export Sophistication and GDP per capita……………………...………………154
Figure 4.2 Trend of Export Concentration in Developing Countries……………………….158
Figure 4.3 Export Concentration vs. GDP per capita……………………………………….159

10
ACKNOWLEDGEMENTS
My supervisors, Dr Alberto Paloni and Professor Ronald MacDonald were excellent in the
manner in which they administered how I went about the research; their patience and
understanding were outstanding and I express my sincere gratitude to them. I also want to
thank my external examiner, Professor Hassan Molana and internal examiner, Dr Luis
Angeles for their helpful comments in review of my thesis.
I could never forget my excellent colleagues, Bernardo Fernandez, John Olukuru and
Andreas Tsopanakis for sharing a great office environment with me, for fruitful academic
discussions and especially for their friendship, which I value the most. A big Thank you to
John. M. Aibinu for going through my thesis and making relevant observations. I am also
grateful to all the administrative and academic staff of Economics and the Adam Smith
Business School of the University of Glasgow.
Big thanks to the Redeemed Christian Church of God Open Heavens, thanks for your love
and prayers. My wonderful friends, Damilola Agbato, Olubunmi Adedire, Princia Kawale,
and Mercy Jonathan, I appreciate you friendship. To Sonia N Uchidiuno, I cannot thank you
enough for you love and support, you have been exceptional and indeed special.
My parents, Dr and Mrs J O Ebireri, my sisters, Jennifer and Ejiro, my cousin Roberta
Williams and my nephews Tochi, David and Jayden provided boundless support. Their
sacrifices, devotion, emotional and practical support carried saw me thorough many difficult
times. Nothing can be said that truly expresses my gratitude, appreciation and love. I also
owe a lot to my deceased sister – Cynthia, her absence is part of my inspiration.
Most importantly, I thank God for being the entire world to me.

11
DECLARATION
I declare that, except where explicit reference is made to the contribution of others, that this
dissertation is the result of my own work and has not been submitted for any other degrees at
the University of Glasgow or any other institutions.
Signature
Name

12
CHAPTER 1: BANKGROUND AND JUSTIFICATION FOR THE STUDY
1.1 INTRODUCTION
The literature on finance and growth in modern economic history has been ambiguous. The
role financial development plays on economic growth has been extensively researched by
economists, and it is startling that the views expressed are quite different. The diverse
opinions on the finance- growth relationship brings about the question of the importance of
financial development on economic growth. McKinnon- Shaw (1973) tries to underpin this
question by formulating the financial liberalization hypothesis which helps to explain the
effective role of financial institutions when interest rates are fully liberalized and the market
is free from any sort of financial repression. Levine (1997) supports McKinnon-Shaw’s
hypothesis by developing the “functional approach” to further explain the importance of
improving the functions of financial institutions for economic growth.
The study of the relationship between financial development and economic growth started
with Bagehot (1873) where he stated that the financial system was hugely responsible for
industrialization in England. Schumpeter (1912) also argued that a sound banking system is
necessary for economic growth through the allocation of resources and technological
improvement. Robinson (1952) criticized the supply-leading view of Bagehot (1873) and
Schumpeter (1912) by arguing that economic growth induces financial development
(demand-following) and not the other way round. Lewis (1955) suggested a bi-directional
relationship between finance and growth. In 1966, Patrick buttresses Lewis’ argument by
explaining that both views occur during different stages of economic development. Levine
(1997) supports a first-order relationship between financial development and growth through
the efficient functioning of the financial system. Lucas (1988) criticized the use of finance in
explaining economic growth.
Also, another discrete aspect of the literature tries to identify which financial structure is the
most appropriate for economic development. One of the main goals of Goldsmith (1969) was
to investigate the impact of financial structure on economic growth and development. He was
able to give a fairly good comparison of financial structures in Germany, The United
Kingdom, The United States of America and Japan. His study on these four countries gave
logical penetrations into different financial structures and how they affected economic
development. In the last decade or so, economists have argued that a market-based financial
system is more efficient in performing the functions of finance in an economy and they see

13
the stock markets to be the active amongst these markets. Proponents of market-based
financial systems were mainly from the US and the United Kingdom as the stock markets in
these countries were active and were instrumental in efficiently allocating resources.1
As will be seen in recommended references2, the difference between a bank-based and a
market based financial systems propose that they stand as substitutes that carry out relatively
similar functions executed in fairly dissimilar ways but with variable success rates. Research
has it that limitation of information from outsiders by banks makes it less desirable when
compared to markets where agents have more information and can take decisions based on
the information even if there is diversity in views.
The literature on finance and growth has also produced several areas of research which have
been controversial in its sense. The importance of concentration in the banking industry; as
well as the ownership structure of banks: foreign, domestic and state; have emerged as
important but debatable areas of research. In the first instance, concerning bank market
concentration, there might be the question of why any relevant controversies exist in this area
of research. In the real sense, one would expect that a highly concentrated banking industry is
bad for economic growth.
Banks with market power would determine the rates they charge as well as the rates they pay
on deposits. They are able to charge higher rents on loans to businesses and individuals; and
pay depositors below the market rates. High rates on loans is capable of negatively affecting
businesses, thereby forcing them to undertake highly risky projects which reduces the
possibility of paying back loans and deteriorating the strength of the credit market; as well as
leading to prospective market failures.3
1 Allen and Gale (2000) for a criticism of this highly supported view.
2 See for more on the market-based vs bank-based financial system: Gerschenkron (1962); Stiglitz (1985); Boyd
and Prescott (1986); Atje and Jovanovic (1993); Bhide (1993); Demirguc-Kunt and Levine (1996); Boyd and
Smith (1998); Harris (1997); Levine and Zervos (1998); Weinstein and Yafeh (1998); Demirguc-Kunt and
Levine (1999); Mork and Nakkamura (1999); Levine (1999); Allen and Gale (2000); World Bank (2001);
Arestis et al. (2001); Beck (2002);Beck and Levine (2002); Demirguc-Kunt and Maksimovic (2002); and Beck
and Levine (2004).
3 Another detrimental effect of very high interest rate is a fall in the pace of technological advancement.
Businesses would be more concerned with making profits from already difficult situations rather than improving

14
Similarly, neo-liberal views suggest that state ownership of banks is bad for economic
development. Until the late 1980s/early 1990s, a lot of developing countries applied financial
repression policies unintentionally. This was not done to the benefits of the governments but
rather to effectively control the financial system in a way where development of the economy
was paramount (Fry, 1973; Nichols, 1974; and Giovanni and De Melo, 1993). Financial
repression was mainly used to divert huge funds from the financial system to the public
sector. In 1973, financial repression was heavily confronted by McKinnon (1973) and Shaw
(1973).
In their financial economic models4, financial liberalization as well as its development was
responsible for facilitating economic growth. They also showed the detrimental effects of
financial repression (interest rate ceilings, outrageously high reserve requirements, selective
credit policies and biased taxes on the capital markets) slowed down the pace of economic
growth (Fry, 1995). Government ownership of banks, which is seen as the most popular form
of financial repression began to face hostility and was seen as bad for economic growth.
Foreign bank ownership on the other hand can initially be seen to mitigate the inefficiencies
of the domestic banking sector by supplying the shortfall of credit to firms. In the past few
decades, financial globalization as well as international trade has facilitated the extension of
foreign branches by parent banks in many countries (Aliber, 1984). The extension of foreign
branches and subsidiaries by large international banks has been as a result of increased
financial liberalization which can be traced to the mid-1980s. The entry of foreign banks or
the foreign ownership of banks as a result of financial liberalization is expected to improve
the efficiency of the domestic banking sector as well as improve the allocation of financial
resources5. However, it was later observed that the entry or ownership of foreign banks has
detrimental effects on the domestic banking sector as well as the economy6. In some cases,
technology; which is detrimental for productivity growth and the real per capita income. This is the widely
accepted outcome of concentrated banking industries.
4 See Fry (1995) and Thirwall (2006) for a detailed description of these models
5 See Levine, 1996; Goldberg and Saunders, 1981; and Walter and Gray, 1983, for the benefits of foreign banks
to the domestic banking system. 6 See Stiglitz (1993) for a summary of how competition from foreign banks can have detrimental effects on
domestic banks, SMEs and the government

15
foreign banks are seen to have no benefits to developing countries with underdeveloped
financial systems7.
1.1 MOTIVATION FOR THE STUDY
The study is motivated by the need to provide an additional insight concerning the debate on
bank market structure and growth. This is facilitated by investigating the effect of bank
concentration, foreign bank ownership and state ownership of banks industrial performance
in developing countries using different methodologies. First of all, this study uses a cross-
country panel data set to explore the long-and short run effects of bank market structure on
industrialization and explores the importance of institutional, regulatory and supervisory
qualities in the process. Secondly, the study uses a cross-country, cross-industry panel data
test to explore the effects. It does not do this only by examining the broad relationship
between bank market structure and economic growth; it explores this relationship between
bank market structures while considering different industrial characteristics that might be
expected to benefit from financial development. Specifically, it takes advantage of industry-
specific characteristics which are related to firms’ dependence on external finance, firm size,
factor intensity, technological intensity and economic importance. Industrialization (or
industrial performance) is decomposed into industry growth and net firm entry. Finally, the
study examines the importance of financial development on the export structures (where
export structures are measured as export sophistication and export concentration). The next
few sections provide some conceptual issues that led to the formulation of the associated
research objectives.
The literature yields conflicting predictions about the effect of bank concentration on
industrialization. On the one hand, there is the idea-typical of the so-called Structure-
Conduct-Performance hypothesis-that concentration reflects the banks’ oligopolistic position
and, hence a high degree of concentration would be associated with tight credit access
constraints and high borrowing costs. On the other hand, it has been argued that it would be
easier for firms to access credit if the banking system is concentrated (Da Rin and Hellman,
2002; Petersen and Rajan, 1995; Cetorelli and Gambera, 2001) and that the occurrence of
financial crises is less likely in more concentrated banking systems (Beck et al. 2006).
7 See Stein (2010) for a detailed discussion on this.

16
Standard mainstream theory envisages that that the entry of foreign bank would promote
financial development and spur economic growth (Beck et al. 2004). On the other hand,
foreign bank entry is associated with less credit to the private sector (Detragiache et al.
2008).
Finally, state owned banks are seen to be responsible for lower economic growth and
financial development (La Porta et al. 2002). On the other hand, state owned banks are seen
to promote long-run economic growth (Andrianova et al. 2012).
The effect of either of this market structures on industrialization may be determined by the
institutional characteristics of a country and the conditions of the financial system,
particularly the regulatory environment and industry-specific characteristics in the
manufacturing sector. Also, the results on technological intensities in the second empirical
chapter persuaded us to examine the effects of financial development on export sophistication
and concentration on a larger country sample.
The framework therefore provides an opportunity to evaluate how widely adopted financial
reforms (i.e. reducing bank concentration levels, promoting foreign bank entry, and
increasing the privatization of state owned banks) affect industrial performance in developing
countries.
1.3. SIGNIFICANCE OF THE STUDY AND PROBLEM STATEMENT
Apart from contributing to the literature on bank market structure and industrialization, this
study has relevant policy implications. First of all, if the effect of bank market structure on
industrialization is explained by institutional characteristics, then developing countries are
likely to benefit significantly from good institutions during the development process. In this
first instance, this may be actualized through the formulation and proper implementation of
policies that improve the operations of the financial system, resulting in industrialization.
And also, by adopting policies that create an environment, where the financial system works
efficiently-i.e. policies that improve the institutional environment.
Secondly, if bank market structure benefits industrialization based on different industrial
characterizations that might be expected to benefit from financial development, it then means

17
that it is difficult suggest that industries with specific characterization (e.g. external finance
dependence) will benefit the most from financial development.
Finally, if the effect of financial development on export sophistication and diversification is
positive-i.e. increases the degree of export sophistication and diversification-in developing
countries, then they are able to compete internationally because of improved exports
structures which are normally characterized by low value-added and a concentrated group of
products. These should be achieved by implementing policies that improve the efficiency of
the financial system, thereby increasing not only export quantity, but export quality. Many
developing countries have improved their export quantities significantly in recent times.
Funding from the private sector and the state is partly responsible for this. However, these
exports have been mostly concentrated in primary products, low technological products and
oil. Even with increased export volumes, many developing countries remain relatively poor
because they are unable to compete effectively at the international scene; and because their
exports are concentrated in a few products, which may result in widespread detrimental
effects in the presence of negative price shock.
1.3. DATA SOURCES
The study uses a cross-country panel on 31 developing countries over a 13-year period (1995-
2007) in the first empirical chapter. Cross-country data on manufacturing value added growth
is obtained from the World Bank WDI (World Development Indicators). In the second
empirical chapter, cross-industry data for growth in industry value added and net firm entry
in manufacturing industries for 26 countries are obtained from the UNIDO electronic
database (Industry Statistics Data base 2013 at the 2-digit level of ISIC Code (Revision 3)
(1995-2007). Data on bank concentration is obtained from the ‘Financial Development and
Structure Dataset’ of the World Bank by Beck et al. (2013). Data on foreign ownership of
banks was obtained from a selection of sources – Cull and Martinez Peria (2011), Claessens
et al. (2008) and Cleessens and van Horne (2012). Government ownership of banks was
obtained from a variety of sources: first of all we have used data from Barth et al. (2008) to
cover for government ownership of banks for 1999, 2001 and 2005. Secondly, we have tried
to compile data from different sources, particularly the BankScope database which provides
information on bank ownership structure and financial statements.

18
Data on institutional quality, regulatory restrictions, supervision and monitoring, the quality
of the legal environment are gotten from a selection of sources: ‘Bank Regulation and
Supervision’ and ‘Worldwide Governance Indicators’, both of the World Bank and compiled
by Barth et al., and Kaufmann et al. respectively; the Heritage Foundation, and the ICRG.
Industry specific data on ‘external financial dependence’ was obtained from Rajan and
Zingales (1998), ‘small firm share was obtained from Beck et al. (2008), while data to
calculate average firms size, labour intensity, technological intensity and measures of
economic importance were also gotten from the same dataset as industry performance.
The third empirical chapter uses cross-country data from at least 63 developing countries
between 1995 and 2010 (for export concentration) and 1985-2000 (for export sophistication).
Data on export sophistication is obtained from Dani Rodrik’s webisite, while data on export
diversification (concentration) is obtained from the UNCTADSTAT electronic database. All
other country-specific data were obtained from the World Bank World Bank WDI.
1.5. RESEARCH METHODOLOGY
The methodological and systematic foundation for this study is taken from the empirical
literature that studies the relationship between bank markets and industrial performance. A
broad assessment of the theoretical and empirical literature supports the evaluation of
industrial performance in developing countries. The study mainly uses econometric
techniques to derive results in this study. Econometric models were also specified to evaluate
the specified objectives. The empirical methodology and techniques utilized in each empirical
chapter is stated and the respective drawbacks highlighted. Policy implications of the results
and areas that require further research are highlighted at the end of each empirical chapter as
well as the concluding chapter.
1.6. STRUCTURE OF THE STUDY
The study is structured into 5 chapters. Chapter 1 introduces the foundation of the study.
Empirical models are specified and presented in Chapters 2, 3 and 4. In Chapter 2, the study
uses cross-country data to examine the role of institutions and the conditions of the financial
system on the effect of bank market structure on industry performance (where industry
performance is measured as industry growth in value added); Chapter 3 uses cross-country,
cross-industry data to examine the impact of bank market structure on industrialization

19
(where industry performance is measured as the growth in industry value added and net firm
entry) while considering industry-specific characteristics; and Chapter 4 examines the impact
of financial development on export structure (where export structure is measured as export
sophistication and export diversification). Chapter 2, 3 and 4 are discussed in detail and
sometimes references are made between chapters. Each of these chapters discusses a robust
literature survey, empirical methodology, techniques and results. Also, discussions of the
empirical results are largely in line with the theoretical and empirical literature. Finally,
Chapter 5 presents a summary of findings, concludes based on the empirical results, identify
the study’s contribution to literature, make policy recommendations based on the results and
suggest areas for future research.
1.7. CONCLUSION
The impact of bank concentration, foreign bank ownership and state ownership of banks on
industrialization in developing countries remains relatively inconclusive in the literature. In
developing countries, international financial institutions (i.e. the World Bank and the IMF)
continue to influence financial policies. Particularly, they persuade developing countries to
implement policies that promote competition, reduce restrictions on foreign bank entry, and
increase the pace of privatizing state banks. They suggest that these policies are likely to
improve economic development and industrialization. When many of these policies resulted
in financial and macroeconomic instability in developing countries, they argued that it was
related to poor institutions and weak legal environments in developing countries. However,
the industrial performance in many developing countries remains poor, even after adopting
many of these policies. Firms in receipt of funding are largely categorized as those that more
on external finance and are expected to perform better when the level of financial
development is high. However, it is possible that other characterizations of firms may benefit
from financial development. Also, it is assumed that exporting firms in developing countries
are unable to compete effectively in the international markets because they are unable to
receive funding to improve their production process. It is therefore important to examine the
role of bank market structure on industrialization. This study examines the role of institutions
and the importance of industry specific-specific characteristics on the impact of bank market
structure on industrialization. Also, it examines the impact of financial development on the
export structure of developing countries.

20
CHAPTER 2: BANK MARKET STRUCTURE AND INDUSRALIZATION IN
DEVELOPING COUNTRIES – THE ROLE OF INSTITUTIONS
2.1. INTRODUCTION
Differences in the level of institutions have been seen to be one of the significant reasons why
the levels of economic performance in countries vary. The inability of neoclassical growth
theories to completely explain the determinants of economic growth have increased the
volume of research that studies the role of institutions in economic development. North
(1990, p. 3) defined institutions as ‘the rules of the game in a society or, more formally, are
the humanly devised constraints that shape human interactions. In consequence they structure
incentives in human exchange, whether political, social, or economic. Institutional change
shapes the way societies evolve through time and hence is the key to understanding historical
change’. Accordingly, institutions are responsible for political, social and economic structure
of any country. Formal institutions are notably Constitutions and laws which govern a
country and informal institutions might include code of conduct (also known as social norms
or values). Both forms of institutions are seen as important factors that affects how we relate
with each other.
According to North, the definition of institutions could also be seen as idiosyncratic factors
that affect political, economic and social structure of society after fundamental factors have
been accounted for. It is difficult to discount the importance of institutions on economic
performance based on North’s definition. Institutions were also defined closely by Greif
(2006, p. 30): ‘An institution is a system of rules, beliefs, norms and organizations that
together generate a regularity of social behaviour’. Right from the 18th
century, particular
interest has been on a set of institutions which include the rule of law, the protection of
property rights and the ability to restrict the mitigating actions of influential capitalists
(groups or the government). These institutions have the ability to create an environment
where their agents are induced to invest and the thriving in investment subsequently leads to
economic growth. However, these institutions could also create an economic environment
where agents are discouraged to invest leading to slow growth. A number of recent empirical
studies have established some evidence that the difference experienced in economic
performance in different countries can be largely traced to differences in institutions (For
example, Knack and Keefer, 1995; Hall and Jones, 1999; Acemoglu et al., 2001, 2002;
Rodrik et al., 2004, Eicher and Leukert, 2009).

21
The importance of finance and financial markets to economic growth has led to increased
research on the link between economic institutions and how they help financial institutions to
work properly. This is important because of the conditions that financial contracts are based
upon. The inability of institutions to impose financial contracts (e.g. loan contracts) increases
the possibility that debtors will default on their loans. A strong legal framework sometimes is
not adequate for a large financial system. The ability to enforce the rights and restraints of
parties involved in a financial contract is also required. Without this, it is possible that
financial contracts may be entangled in problems of moral hazards and adverse selections as a
result of asymmetric information. Asymmetric information is a situation where the creditor
has little or no information on the borrower’s incentive and behaviour. Although, it is
impossible for the creditor to have perfect knowledge on the borrower’s incentive and
behaviour, contracts that have been well-written in the presence of relevant institutional
conditions are necessary for financial contracts to be properly enforced.
Asymmetric information and the manner in which information is shared between economic
agents are relevant for how resources are allocated, particularly in financial markets. In
economies where asymmetric information is present, the manner in which financial contracts
have been designed as well as the institutional conditions is vital in determining investment
and capital accumulation (Capasso, 2004). For example, a situation where institutional
conditions are insufficient i.e. they may be poor and inadequately developed, may facilitate
the likelihood of default. Also, adequate institutional conditions are necessary for financial
institutions to efficiently perform their function of channelling financial resources to the most
productive projects. The association between the quality of institutions and financial
development is therefore seen as an important relationship.
The introduction of financial liberalization policies in developing countries produced mixed
results. In the first instance, the empirical growth literature finds that private domestic credit
and liquid liabilities exert a positive effect on per capita GDP growth. This indicates the
growth enhancing effect of financial development (King and Levine, 1993; and Levine et al.
2000). In the second instance, the banking and currency crises literature finds that monetary
aggregates, such as domestic credit, are among the best predictors for crisis. Since banking
crises usually leads to recessions, an expansion of domestic credit would then be associated
with growth slowdowns (Demirguc-Kunt and Degatriache, 1998, 2000, Kaminsky and
Reinhart, 1999 and Gourinchas et al. 2001). A similar contradiction exists in the theoretical
literature. According to the endogenous growth literature, financial deepening leads to a more
efficient allocation of savings to productive investments (Greenwood and Jovanovic, 1990

22
and Bencivenga and Smith, 1991). On the other hand, the financial crisis literature points to
the destabilizing effect of financial liberalization as it may lead to an excessively large
expansion of credit. Excessive lending could occur as a result of the mixture of different
channels, comprising inadequate monitoring capacity of regulatory agencies, failure of banks
to identify good projects during boom periods, and the presence of an explicit or implicit
insurance scheme against bank failures (Schneider and Tornell, 2004 and Aghion et al. 2004).
The negative effect of financial liberalization in many developing countries has been traced
to weak institutional and regulatory capacities, particularly after the 1997/1998 global
financial crises (Rodrik, 2001) and the recent 2008 global financial crisis. It was suggested
that financial liberalization should be approached carefully, particularly in countries where
the institutions necessary to enforce law and contract enforcement and effective prudential
regulation and supervision are weak (Demirguc-Kunt and Degatriache, 1998, Kaminsky and
Schmukler, 2008). In other words, countries with stronger institutional capacities and a strong
legal environment are in a better position to benefit from financial liberalization policies.
Hence, it can be argued that one way through which institutions affect economic growth and
development is by creating larger and healthy financial markets. The motivation for this
chapter is to find some robustness for this finding. In other words, the study explores whether
good institutions improve how the financial structure affects industrialization in developing
countries. Particularly, we explore if good institutions promote the effect of bank market
concentration, foreign bank entry and state ownership of banks on industrialization in
developing countries.8
Bank market structure is measured by bank concentration, foreign bank ownership and
government banks ownership. The most relevant institutional variables for the financial
variables we have used have also been employed. The study uses two empirical approaches.
The first empirical approach is in two stages. First of all, an estimator is used to identify the
long-run and short-run relationship between bank market structure and industrial
development. Secondly, the relationships between the short-run coefficients and institutions
are examined to explain the impact of institutions on the effect of bank market structure on
industrial development. The second empirical approach employs the impact of bank market
structure on industrial development in the presence of institutions (an interaction term
8Note: Financial liberalization policies are likely to promote bank market competitiveness, foreign bank entry
and the privatization of state owned banks as opposed to bank market concentration, restriction of foreign bank
entry and the presence of state owned banks.

23
between bank market structure and institutions is created). The study covers a sample of 31
developing countries over the period, 1995-2007.
2.2. CONCEPTUAL FRAMEWORK
2.2.1. Background to the Relationship between Institutions and Economic Growth
Institutions are seen to be important for economic growth, and differences in institutional
quality across countries are used to explain why an economic gap exists between developed
and developing countries.9 One study which tried to link institutions with economic growth
differences across countries was Hall and Jones (1999). According to Hall and Jones (1999),
the output per worker in the United States was 35 times higher than the output per worker in
Nigeria in 1988. In other words, in 1988, it took an average American 10 days to produce
what it took an average Nigerian 1 year to produce. They find that the ability of some
countries to be more productive than others in terms of output per worker in the long-run is
linked to high rates of investment in physical and human capital and because inputs are used
efficiently and at a high level of productivity. Their empirical analysis suggests that this
achievement is linked to social infrastructure.
Their key findings include the following: growth theory predictions can be examined in a
cross-country context by examining country level incomes. Large differences in output per
worker in different countries are only partly explained by physical and human capital
accumulation. Growth accounting finds large differences across countries that remain
unexplained. Differences in the level of institutions and effectiveness of government policies
across countries is responsible for the large differences in physical and human capital
accumulation, productivity, and consequently large differences in income across countries;
and the degree to which many countries have implemented different social structures is partly
linked to their relationship with Western Europe. Here, Hall and Jones (1999) were able to
show that institutions and government policies were responsible for the large differences in
output per worker across countries.
9 See North (1989) for a detailed discussion of this.

24
2.2.2. Bank Market Structure and the role of Institutions
2.2.2.1. Bank Concentration and Institutions
In recent years there has been an increase in research of the economic role of market
competition on industrialization and the literature on this research has yielded conflicting
predictions. In the first instance, the need for such a debate seems uncalled for. Logical
reasoning would suggest that policies that do not support competition in markets would have
social welfare losses. It is assumed that banks with market power would take advantage of
their ability to extract rents by charging higher loan rates to businesses and pay low deposit
rates to depositors. It is assumed that higher lending rates could cause entrepreneurs to
undertake extremely risky projects, thereby having detrimental effects on the stability of
credit markets and escalating the probability of systemic failures. It is also possible that
higher lending rates would reduce investment in research and development, thereby reducing
the pace of technological development and productivity growth. This would also lead to low
capital accumulation and slow economic development. This is also referred to as the
‘Structure-Conduct-Performance-Hypothesis’ (Pagano, 1993; and Guzman, 2000). A few
other examples provide empirical evidence for the negative effect of bank market power
(Jayaratne and Strahan, 1996; Shaffer, 1998; Black and Strahan, 2002).
On the other hand, it has been argued that a concentrated banking sector improves the access
of firms to finance. Petersen and Rajan (1995) use a stylized theoretical model to show that
young firms with no historical records are likely to receive credit at better rates if they are in
a credit market where banks have market power. The intuition as explained above is that a
premium should be included to the rates of a pool of risky borrowers (young firms) as a result
of possible default leading to higher lending rates than the ones use for established borrowers.
It is also assumed that these rates will be significantly high and that credit will be partially
rationed. However, according to Petersen and Rajan, banks with market power are likely to
charge ‘introductory’ lower lending rates to attract the best young firms and establish a
lending relationship with them, with the hope of extracting rents through charging higher
rates in the future when they become established. This is only possible if the bank has market
power.10 Other examples that provide empirical evidence for the positive effect of bank
10
However, in a study by Cetorelli and Gambera (2001), they empirically show that bank concentration has an
economic dead weight loss on economic growth but promotes the growth of industries that rely more on external
finance.

25
market power include: Shaffer (1998); Collender and Shaffer, 2000; Bonaccorci and Dell’
Ariccia (2004).
However, Rajan (1992) previously pointed out that the positive association between bank
concentration and credit availability through relationship lending may largely depend on the
intensity of the so-called ‘hold-up problem’, i.e., a situation where firm may be unwilling to
enter close relationships with banks if banks can use their discretion to hold up the firms and
request a share of the profits in return for credit to finance future projects. Also, in contrast
with Petersen and Rajan, Boot and Thakor (2000) argue that banks in a competitive
environment are more likely to try to establish a lending relationship with borrowers, because
it allows them to differentiate themselves from other lenders and give them the competitive
edge. Relationship lending is seen as a means of acquiring soft information about firms in an
environment characterized by asymmetric information.
Da Rin and Hellman (2002) examine the role of banks as catalysts for industrialization. They
introduce financial intermediaries into the ‘big push’ model for this examination. In the
model, they examine under what conditions profit-motivated banks would significantly invest
in industrialization. The model predicts that the role of banks as catalysts for industrialization
is associated with a situation where these banks have market power and are considerably
large.11
The effect of bank concentration on economic development and industrialization is mixed as
we have seen in the literature. It is possible that this relationship may be better explained
while taking note of the institutional context and the conditions of the financial system. The
ambiguity in the literature might be better explained by looking at the quality of institutions,
bank supervision and particularly bank regulation.
Institutions
After examining the literature on the importance of strong legal system, good institutions and
effective enforcement of laws and contracts for economic growth and industrialization, we
find that markets are likely to function better in the presence of good institutions. This section
examines the literature on the effects of bank concentration on economic growth and
industrialization in the presence of institutions. Beck et al. (2004) uses a unique dataset of 74
countries for firms of small, medium and large size to examine how bank market structure
affects the access of firms to bank finance. Primarily, they find that bank concentration
11
According to Beck et al. (2006), it is also less likely that financial crises would occur in more concentrated
banking sectors.

26
increases the financial constraints of firms (particularly small and medium sized firms) and
this effect is stronger in low income countries. However, they also find that the institutional
and regulatory characteristics as well as the ownership structure of a country influences how
bank concentration associates with the access of firms to bank finance. They argue that
countries with high institutional quality, an efficient credit registry and a strong presence of
foreign banks reduce the negative effect of bank concentration on the financial constraints of
firms and in some cases render the effect of bank concentration on the access of firms to bank
finance insignificant. They also argue that the negative effect of bank concentration on the
access of firms to bank finance is worsened in countries where there is a high restriction on
bank activities, high government interference in the banking system, and a high presence of
government-owned banks.
However, Ergungor (2004), in his comment on Beck et al. (2004) paper re-construes their
results by suggesting that bank concentration has positive effects on growth and
industrialization. He suggests that banks with more market power can initially develop
expensive relationships with borrowers (charging lower lending rates) with the prospect
extracting rents in the future (share in future surpluses), and further argues that banking
regulations that restrict the ability of banks to engage in other commercial activities outside
lending and receiving deposits would limit the opportunity of banks to engage in future
business with their borrowers and, therefore, the profits that they could make through
borrowers. He stresses that this is evident in the results of Beck et al. (2004). Furthermore, he
argues that other results in Beck et al. (2004) support the fact that bank concentration
alleviates firms’ financial constraint. However, he suggest that this is more likely to occur
when countries have good quality institutions, minimal government interference in the
banking sector, a good credit registry, high presence of foreign banks and a low presence of
government banks. In other words, while we see that Beck et al. (2004) and Ergungor (2004)
agree that institutions are important for how bank concentration affects firms’ access to
finance, they disagree on the effect of bank concentration of firms’ access to bank finance.
Fernandez et al. (2010) also examines the effect of bank concentration on economic growth
in the presence of institutional quality but their results are quite opposite from what has been
discussed so far. They use results from 84 countries over the 1980 – 2004 period to argue that
high levels of bank concentration could have positive effects on economic growth in
countries with weak institutions through resolving adverse selection and moral hazard
problems. They believe that the problems associated with weak institutions might make long-
term relationship between banks and borrowers a plausible solution in developing markets.

27
These long-term relationships will be encouraged in concentrated banking markets leading to
a positive effect on economic growth. They also suggest that bank concentration would play
the role of laws governing the strong protection of creditors and property as well as the role
of good institutions by reducing informational asymmetries and agency costs between banks
and firms. Finally, they suggest that good quality of institutions and effective laws governing
the protection of creditors and property in developed countries make bank concentration less
relevant.12 From the examined studies in this section, the effect of bank concentration on
firms’ access of bank finance in the presence of institutions is ambiguous.
On the one hand, the negative effect of bank concentration on firms’ access to bank finance is
reduced in the presence of good institutions. On the other hand, bank concentration improves
firms’ access to bank finance in the presence of good institutions. Finally, a third strand
argues that bank concentration improves firms’ access to bank finance when institutions are
weak, particularly in developing countries.
Bank Regulation
It has been argued that the type and nature of bank regulation may determine the impact of
bank concentration. For example, Barth et al. (2004) and Demirguc-Kunt et al. (2004)
examine the relationship between specific regulatory and supervisory practices and banking
sector development. Both studies find that excessive bank restrictions and regulations on
bank activities – such as bank entry, undertaking of non-traditional bank activities (e.g.
securities, insurance and real estate) and the control of non-financial firms – are negatively
associated with bank development and stability, as compared to when banks can diversify
into other financial activities. In other words, excessive regulation and restriction of bank
entry, bank activities and bank ownership of non – financial firms makes the banking system
less competitive and less efficient.
Fernandez et al. (2010) also discusses the role of regulation with regards the relationship
between bank concentration and economic growth. On one hand, they believe that strong
restrictions on bank activities persuade banks to focus on lending and receiving deposits as
this may form lending relationships between banks and firms. In other words, they believe
that bank concentration facilitates lending relationships; to be exact; bank concentration
promotes the exploitation of scale and scope, and may be more beneficial than harmful to
economic growth. On the other hand, they suggest a drawback when bank restrictions are
12
See Beck et al. (2011) and La Porta et al. (1998) for further discussion on the positive effect of bank
concentration on financial constraints in developing countries.

28
strong by taking note of the ‘hold-up’ problem13 that may arise as a result of reduced
competition. Empirical results suggest that tighter restrictions on bank non-traditional
activities and the control of non-financial firms dampen the negative effect of bank
concentration on economic growth. On the impact of bank regulation and restriction on
growth and development after bank concentration has been controlled for, they find, on the
one hand, that excessive regulation and restriction on bank activities has a negative effect of
bank development. On the other hand, they find that excessive regulation and restriction on
bank activities reduces the negative effect of bank concentration on growth.
Bank Supervision
The literature on bank supervision emphasizes the importance of official supervision and
private monitoring of banks on bank development and growth. While the new Basel Accord
presumes that strict official supervision and private monitoring brings about more bank
stability, the empirical aspect of the literature has found a somewhat different conclusion. For
example, Barth et al. (2004) examine the relationship between official supervision (and
private monitoring) on bank development and the cost of financial intermediation using a
sample of 107 countries, and they find no convincing evidence that official supervision has a
significant effect on bank development, the cost of financial intermediation and non-
performing loans. However, on the other hand, their results show that private monitoring is
strongly and positively linked with bank development and negatively associated with the cost
of financial intermediation and non-performing loans.
Similarly, Barth et al. (2006) examine data on bank regulation and supervision in over 150
countries. Based on the data, they suggest that countries with political, legal and regulatory
systems that encourage market-based or private monitoring of banks are likely to be more
efficient with regards to social and developmental results than countries with systems that
emphasize on official supervision. Beck et al. (2006) expatiate on this prediction by
examining the effect of different bank supervisory policies on firms financing constraints in
37 countries. In line with Barth et al. (2004) and Barth et al. (2006), they find that the
conventional mechanism through which banks are supervised – authorizing official
supervisory agencies to monitor, restraint and influence banking decisions unswervingly –
does not make banks more efficient in lending. Rather, they find that supervision policies that
promote the private sector to monitor banks through enforcing accounting and information
13
See Boot and Thakor (2000) for a discussion of this model.

29
disclosure is more likely to make banks more efficient in their lending processes, and that this
is more likely to happen in countries with good quality institutions.14
According to Fernandez et al. (2010), the positive benefits of private monitoring on bank
development might be detrimental for bank concentration in terms of its ability to resolve
agency and adverse selection problems between banks and firms through developing lending
relationships. On the other hand, they believe that if strict official supervision was the case
rather than private monitoring, then bank concentration would be more beneficial in terms of
its ability to resolve agency and adverse selection problems through developing lending
relationships. In other words, bank concentration may be more beneficial to growth in the
presence of official supervision. However, their results suggest that official supervision has
no significant effect on how bank concentration affects economic growth but private
monitoring seems to increase the negative effect of bank concentration on economic growth.
So far, we see that official supervision of banks has no significant effect bank development
and growth, while private monitoring seems to be more effective. However, two strands exist
in the literature on the effect of private monitoring of banks. On the one hand, private
monitoring may promote financial development and growth. On the other hand, private
monitoring may negatively affect financial development and growth.
The research question identified as a result of the following survey is as follows: how do the
quality of institutions, regulatory restrictions and supervision in the banking sector influence
the way bank concentration affects industrialization.
2.2.2.2. Foreign Bank Ownership and Institutions.
The idea in mainstream economics is that foreign bank entry has the capacity to promote
financial development and spur economic growth in developing countries. A summary of
how foreign bank entry may improve financial development and quicken the pace of
economic growth includes its ability to easily gain access to international capital markets;
improve bank regulation and supervision; introduce new instruments and techniques; increase
competition and improve the efficiency of the domestic banking system, be relatively less
involved in connected lending, improve financial stability, particularly in turbulent times, by
being perceived as safer than private domestic banks.
14
Similarly, Caprio et al. (2007) finds that official supervision has no significant effect on bank valuation.

30
Beck et al. (2004) empirically support this view by using a unique dataset of 74 developed
and developing countries to examine the impact of bank competition on firms’ access to
credit. While they find that bank concentration increases financing constraints (particularly in
small and medium firms), they also find that this relationship is influenced by the regulatory
and institutional characteristics of a country, as well as the ownership structure of the banking
system. By contrast, Detragiache et al. (2008), explore how the entry of foreign banks affects
financial sector development in 60 low-income countries using a theoretical model and
testing its predictions empirically. They find that while lending, financial intermediation and
welfare may improve with the entry of foreign banks, this does not justify their presence.
They suggest that under some circumstances, foreign banks might be involved in ‘cream-
skimming’, which increases the cost of financial intermediations and reduces welfare. Also,
the model strongly suggests that foreign banks are only likely to lend to more transparent
firms, while other firms remain the same or are worse off. They suggest that the ‘cream-
skimming’ model predicts that a stronger presence of foreign banks would only worsen the
banking sector and that foreign banks would only lend to firms they consider ‘safe’.
According to the model, four propositions are possible in the credit market: pooling
equilibrium- all projects are funded and no monitoring costs are paid; separating equilibrium-
banks monitor both hard and soft information and lend to borrowers with hard or soft
information. They do not lend to hard borrowers; semi-pooling equilibrium-banks monitor
hard information only. Borrowers with hard information borrow at a lower cost that
borrowers with soft information and bad borrowers; and credit-constrained equilibrium-banks
monitor hard information and only lend to borrowers with hard information. Soft information
and bad borrowers do not receive any credit. In this model, it also assumed that foreign banks
have a lower cost of monitoring hard information but a higher cost of monitoring soft
information than domestic banks. The allocation of lending based on the following
propositions is as follows: under pooling equilibrium, all projects are funded and no
monitoring costs are paid. Therefore, the better lending technologies of foreign banks are
irrelevant; on the other hand, the other equilibrium outcomes suggest that foreign banks lend
only to borrowers with hard information while domestic banks lend to soft and bad
borrowers.
The model was simulated under different scenarios to provide a better understanding of the
effects of foreign banks. Simulations were done under six scenarios and predictions were
made on the effect of foreign banks in relation to domestic banks: in the first scenario, all

31
borrowers are funded but hard borrowers are funded by foreign banks and this does not affect
the volume of credit when compared to an equilibrium without foreign banks although there
is a slight drop in total and net output; in the second scenario, it is assumed that the cost of
monitoring soft information is lower. Therefore, in the presence of foreign banks, both hard
and soft information borrowers are funded, while bad borrowers do not receive any credit and
reduces the volume of credit as well as total and net output; in the third scenario, it is
assumed that the returns form project are lower. Therefore, the presence of foreign banks
only result in hard information borrowers being funded because projects returns are not
adequate to cover the cost of monitoring soft information borrowers. In this case, there are
significant falls in the volume of credit, total and net output; in the fourth and fifth scenarios,
it is assumed that foreign bank entry brings about limited efficiency in monitoring and fewer
bad and more soft information borrowers resulting in no change to change when only
domestic banks are present and increase in slight increase in total and net output but no
change in the volume of credit; finally, in the last scenario, it is assumed that projects by bad
borrowers has an even greater risk of failure. In this scenario, bad borrowers are unlikely to
receive funding resulting in a slight fall in the volume of credit, total and net output. In
general, the model simulations show the likelihood that foreign bank entry could reduce total
credit, total and net output.
This brings our attention briefly to the debate in the literature which suggests that foreign
banks are unlikely to lend to small and medium firms. One view in this debate is that foreign
banks would ‘cream-skim’ or ‘cherry-pick’ customers; these would most probably be well-
known, large firms. Certainly, a number of studies find that foreign banks in low-income
countries lend predominantly to multinational corporations, large domestic firms, or the
government rather than small and medium firms (Brownbridge and Harvey, 1998; Satta,
2004; Clarke et al. 2005; Stein, 2010).
It has also been argued, however, that even in the above case, the entry of foreign banks
would bring about indirect advantages: domestic banks in order to survive competition would
be forced to find and specialise in other niches, such as lending to small and medium firms.
Their access to credit would thus increase, rather than decrease as a result of foreign bank
entry (World Bank, 2002). This argument, however, stands only to the extent that domestic
banks are not driven out of the market, in this case, informationally-opaque firms may
become more credit constrained. Another view suggests that foreign banks might lend more
to small and medium enterprises than large domestic banks (Clarke et al., 2005). In other
words, bank ownership is not so relevant while the difference between large and small banks

32
is much more important. For example, in Levine (2003), he examines the impact of
regulatory restrictions to foreign bank entry on bank interest rate margins across 47 countries.
His results suggest that, after controlling for restrictions on domestic bank entry and foreign
bank ownership of the domestic banking industry, restriction of foreign bank entry tends to
boost bank interest margins. In other words, the cost of financial intermediation is determined
by regulatory restrictions to entry, rather than by the national identity of bank owners.
In general, foreign banks have a considerable number of advantages, the most significant of
which is likely to be their ability to access international liquidity through their parent banks.
This reduces the cost of financial intermediation, increases bank efficiency and improves
bank stability in developing countries. On the other hand, foreign banks might not be as
‘development-enhancing’ as they are assumed to be. They have a disadvantage with regards
to lending because they have less knowledge of the host economy, and of local firms and
customs. This puts them at a disadvantage relative to domestic banks. Also, the long
geographic and communication distance makes it difficult for the managers in the parent
bank to give much operation discretion to the local foreign banks. One way out of this is for
foreign banks to rely on ‘hard information’ because they have no access to ‘soft information’.
This, however, makes them less useful to the economy since one of their key functions is to
exploit ‘soft information’ (Mian, 2003). In other words, even when foreign banks enter by
acquiring domestic banks, the knowledge of local markets and conditions may be lost as
distant manager may need to impose formal and standardized procedures to monitor local
loan officers. This is likely to disrupt existing relationships between the domestic bank and
local firms.
Claessens et al. (2001) maintains the positive effect of foreign bank entry to the domestic
banking market while using bank level data for 80 countries between 1988 and 1995. Two
key findings are that, for most countries, a stronger presence of foreign banks is associated
with increased competition through a reduction in the profitability and interest margins of
domestically owned banks; and they also stress the downside of increased foreign bank
presence by claiming that the lessening of restrictions on foreign bank entry can be risky for
domestic banks. By this, they mean that increased competition and consequently lower profits
of domestic banks as a result of foreign bank entry may reduce the valuation of domestic
banks making them more susceptible. This may have a devastating effect on the financial
system if the regulatory and supervisory framework is weak. In other words, the positive
effect of foreign banks on the domestic financial system is reduced in the presents of poor
regulatory and supervisory policies.

33
Foreign banks are seen to increase bank competition in host countries (Claessens et al. 2001)
but this view remains a controversial one. The method of entry is what matters. Some banks
enter through new, Greenfield investment, while others acquire ownership of domestic banks
by entering through mergers and acquisitions. In particular, when foreign bank entry is
through mergers and acquisition, foreign banks contribute to the degree of bank
concentration.15 Also, foreign bank entry could also increase bank concentration through the
merging of domestic banks as a response to foreign competition. Martinez-Peria and Mody
(2004) note that the potential benefit from foreign bank entry in terms of lower cost of
operation throughout the banking system – which then translate into low financial
intermediation costs – is offset where concentration levels increase according to data from
four Latin American countries in the 1990s. In other words, while foreign bank entry is likely
to increase bank competition in the domestic banking market, it is also possible that it could
increase bank concentration.
As noted in Detragiache et al. (2008), a high presence of foreign banks in poor countries
relatively result in shallower banking sectors and foreign banks have a tendency to ‘cherry-
pick’ and provide services to mainly large firms and have correspondingly less risky
portfolios than domestic banks.16 Foreign bank entry has also been linked with a sharp
increase in lending to households for consumption and mortgages across a range of middle-
class income economies (IMF, 2006). This IMF report shows that financial institutions in
many regions have been enjoying profitable business environments where most of their
profits are as a result of the sharp increase in credit growth, particularly consumer credit. In
some cases, consumer credit has exceeded corporate credit. However, the continuous increase
in consumer credit has raised concerns with regards to a possible deterioration in loan quality
in the future. Particularly, in some countries, rising consumer lending had led to high
household indebtedness. High level of household debt is associated with high interest rate by
banks, as well as a high interest rate risk exposure of banks that hold government bonds.17 In
other words, while foreign bank entry may increase lending in the domestic banking market,
15
It has been argued that the entry of foreign banks through the acquisition of domestic banks is more likely to
occur when foreign bank entry is encouraged by domestic authorities as a means of reducing the cost
recapitalization of the domestic banking system in the wake of a financial crisis (Beck et al. 2006)
16
However, it a comment to Detragiache, Tressel and Gupta (2008), Claessens (2006) argues that foreign banks
may make domestic banks more prudent, leading to less lending in the short-run; and more transparent lending
leading to higher loan-loss provisioning and reserves, but not because domestic banks do riskier lending.
17
Some recent papers which study the growth of consumer credit compared to industrial and commercial credit
and its possible detrimental effect to growth include Mohanty et al. (2004); Lapavitsas and Dos Santos (2008);
and Dos Santos (2012).

34
it also has the capacity to increase the cost of financial intermediation and reduce the quality
of loans, which are detrimental for economic growth.
In a study on Mexico, Haber and Musacchio (2005) also find that foreign bank entry has been
associated with a decline in lending to house and business enterprises after they offer a
detailed study on the impact of foreign banks in Mexico. One of the major findings in their
study is that enforcing contracts in developing countries is more expensive when compared to
developed countries. They find that in a country where it is difficult to assess risk before
lending and enforce contracts after lending, foreign banks become more risk-averse. In
Mexico, for example, foreign banks prefer to lend to government and hold their securities
rather than lend to firms and households. They also find that it is easier to legally enforce
consumer loans than commercial loans. Their data shows that commercial and housing loans
fell drastically while consumer loans more than doubled during this period. This led to
intensive screening exercises to identify ‘safe borrowers’ and offering lower interest rates. In
other words, productive private sector lending fell as a result of foreign bank presence but
this adverse effect was as a result of weak institutions.
As a result of the studies examined above, we try to answer the following research question:
how do the quality of institutions, the regulatory restrictions and supervision in the banking
sector influence how foreign bank entry affects industrialisation?
2.2.2.3. Government Bank Ownership and Institutions.
La Porta et al. (2002) investigate what they refer to as a neglected aspect of the financial
systems around the world. In particular, they use data on government ownership of banks
from over 90 countries to examine its effect on the promotion of consequent financial
development and economic growth – through factor accumulation, savings and the growth of
productivity. They find that government ownership of banks is associated with slower
subsequent financial development and lower subsequent economic growth – mainly through
lower productivity growth. They link this detrimental effect to the inability of state owned
banks to efficiently allocate capital to its best use, resulting in lower productivity, without
increasing capital accumulation. Also, since they found that government ownership of banks
is larger in low income countries faced with underdeveloped financial systems,
interventionists and inefficient governments, and poor protection of property rights, it is

35
assumed that the negative effect of state owned banks on productivity, growth and financial
development is exacerbated by these conditions.18
The adverse consequences of the presence of state banks in the banking system are attributed
to the fact that governments may use state banks to bolster their political support and,
therefore, the allocation of credit would respond to opportunistic criteria rather than
efficiency. There would tend to be less demand for quality information and accounting
transparency and, moreover, official supervision and monitoring would be weak (as a result
of inevitable conflict of interest which arises when one part of government is charged with
monitoring another). In line with La Porta et al. (2002), World Bank (2001) argues the failure
of government banks in many developing countries is attributed to incentives imposed on it
by the political process, and suggests that the success of government banks in a few cases
may be associated with a stronger institutional environment and dispersed political power. In
other words, where government banks are subject to adequate check and balances and
institutional development is more advanced, state ownership of banks may give rise to more
positive results, since both official supervision and market monitoring of state banks would
be better.
Studies on the relative performance of state and private banks provide evidence consistent
with this view. For example, Micco et al. (2007) show that state banks underperform private
banks in developing countries but not in developed ones. They find that state-owned banks in
developing countries are less profitable than their private counterparts, and that these results
are not statistically significant in developed countries. Also, Shen and Lin (2012) observe that
the performance gap of state banks worsens in high corruption countries. They use a political
interference hypothesis – which they define as the situation in which the executives of
government banks are replaced within 12 months after major elections – to explain why
government banks perform worse compared to private banks. First of all, they suggest that
once government gets involved in political interference, government banks become
operationally less efficient. Second, they find that the negative effect of political interference
on government banks is more pronounced in developing countries than in developed
countries. Finally, they show that the negative effect of government deteriorates when there is
minimal or no political interference.
However, Rodrik (2012) warns against simplistic interpretations of negatively signed
coefficients of state banks in growth regressions. He uses La Porta et al. (2002) as an
18
Similarly, Barth et al. 2001 and Cetorelli and Gambera, 2001 establish the negative effect on state owned
banks on financial development and credit availability respectively.

36
example to illustrate his point. La Porta et al. (2002) differentiate between two perspectives
on the role of government banks. They identify the ‘developmental’ view which associates
state ownership of banks with reducing market imperfection in the financial system, resource
mobilization and economic development. They also identify the ‘political’ view which
associates state owned banks with financing interest groups for political support by
politicians. They test both perspectives by regressing GDP per capita and productivity growth
on a measure of state owned banks as well as other standard regressors. The results suggest a
robust negative relationship between state-owned banks and economic development and
productivity growth.
Rodrik (2012) does not agree with the interpretation of these results. He argues that the
country differences in government ownership of banks are not likely to be random as the
theories that are being tested suggest. He shows that even if the existence of state banks were
explained by a ‘developmental’ view – e.g., the need to correct market failures – rather than
by the ‘political’ view, the estimated relationship between economic growth and state
ownership of banks could turn out to be negative and, therefore, the estimated coefficient
could not be used to justify the privatization of state banks. Many different types of market
failures could be mitigated through state ownership of banks. For example, in a weak
institutional environment characterised by deficiency in information and weak contract
enforcement, private banks may be unable to allocate capital to highly productive investment.
As another example, state banks could release firms’ credit constraint in highly concentrated
banking systems with private ownership.
Finally, Andrianova et al. (2008) find that the presence of state banks can certainly be seen as
a response to institutional deficiency. At extremely low levels of institutional quality,
government could use state banks to revive financial and economic development. An
improvement in institutional quality is likely to increase depositors’ confidence in private
banks. They predict that the privatization of state banks is unnecessary and could be
detrimental. Based on their model, state banks will disappear when they are no longer
required: If they no longer enjoy government support, they will unable to compete with
private banks in the presence of good institutions because they are less inefficient.
Andrianova et al. (2012) stresses state-owned banks to be more beneficial in countries with
weak regulation. Even if regulation is strict, they suggest that state banks are still beneficial
for economic growth. However, as regulations reach one standard deviation above the mean,
the impact of state-owned banks become insignificant. In other words, there are

37
circumstances where state banks might be beneficial for economic growth – when depositors
prefer state banks to private banks, particularly at low institutional levels.
As a result of the studies reviewed, we explore how good institutions and supervision in the
banking sector influences the effect of state owned banks on industrialization
2.2.3. Methodological Approach
The objective of this chapter is borne out of the several strands of literature discussed above.
The objective is to test the assumptions that better institutional quality, fewer restrictions on
non-traditional bank activities, less powerful official supervision and more private monitoring
would improve the outcome of financial liberalization policies in developing countries. The
results might be able to provide policy implications with regards to financial reforms in
developing countries.
The methodology employed in this chapter uses two techniques to examine these
assumptions. First of all, a methodology employed by Loayza and Ranciere (2006) is used.
They use an econometric technique, Pooled Mean Group (PMG) estimator (Pesaran et al.,
1999). They use the ability of this estimator to provide short and long-run results in
explaining the contradictory effects of financial intermediation on economic activity. They
estimate cross-country short-run effects of financial intermediation on economic growth and
examine the association of the estimated short-run coefficients with country-specific
measures of financial fragility (banking crises and volatility). The empirical methodology
will be explained in details in the next section.
The second technique I employ, the fixed effects estimator (FE), which is particularly suited
to panel data, allows for heterogeneity across panels and time but confines the heterogeneity
to the intercept terms of the relationship. The intuition behind both techniques is as follows:
first of all, it is evident in the literature that bank concentration, foreign bank entry and state
ownership of bank may have contrasting effects on industrialization. The PMG estimator
highlights these contrasting effects and we attempt to provide an empirical explanation for
these effects. Also, we examine the possibility that the short-run effect of bank market
structure on industrialization can be linked to the institutional environment and the regulatory
and supervisory conditions in the banking sector. The short-run relationship is measured by
the short-run effect of bank market structure on industrialization. We measure the quality of
institutional environment by using various institutional variables; the regulatory conditions by
regulatory restrictions to entry and participation in non-commercial activities; and the

38
supervisory conditions by official bank supervision and private motoring. The baseline
regressions of both techniques are regressed without including the institutional and bank
regulatory variables; secondly, the FE estimator takes advantage of the characteristics of
panel data. We create interaction terms between bank market structure variables and
institutional variables that have time variation, and introduce them into the specification one
at a time. Using interaction terms is important to reduce the omitted bias is present in cross-
country regressions.19
2.3. EMPIRICAL FRAMEWORK
2.3.1. Model Specification
2.3.1.1. PMG Estimation
The empirical model infers that industrialization (growth in manufacturing value added) is a
function of bank market structure and other variables. The second stage examines the
relationship between the short-run effects and cross-sectional institutional variables. To
examine the long-run effect of bank market structure on industrialization, it is common to we
estimate the following specification.20
(2.1)
Where is the growth of manufacturing value added in period t for country i,
is the level of bank concentration, is the level of foreign bank entry,
is the level of state ownership of banks, is a set of conditioning variables, and
is the error term. The three bank market structure variables are treated within the same
framework, resulting in fewer problems with omitted variable bias. Normally, financial
characteristics are treated in isolation with little or no analysis of them within the same
framework. For example, the impact of a highly concentrated banking sector on the real
economy may be influenced by the level of foreign bank entry and state ownership of banks.
19
Rajan and Zingales (1998) argue that that their paper has an advantage over others because the introduction of
interaction terms improves how country and industry characteristics are corrected as well as reduce omitted
variable bias or model specification. Since the publication of Rajan and Zingles (1998), the estimation of models
with interaction terms has become more popular in applied economics. 20
It is uncommon to find papers where bank concentration, foreign bank entry and state ownership of banks
have been entered into a specification simultaneously.
1 2 3 4,
it it it it it itMVAGR BCON FBANK GBANK CV
,i tMGAGR
,i tBCON
,i tFBANK
,i tGBANK
,i tCV
,i t

39
This chapter models the bank market structure-industrialization relationship as fundamentally
dynamic; clearly differentiating between the short and long-run effects. Differentiating in this
manner may be important for the sustainability of reforms (i.e. if the short-run effects are
negative, reforms may not be sustainable even if they would be beneficial in the long-run).
Another possible reason is to identify whether institutional reforms should be preconditions
for other reforms (for example, if the short-run effect is negative when institutions are weak,
there may be an argument in favour of prior institutional reforms).
It is possible to test this relationship using an econometric technique that ought to reveal
appropriate long-run parameters in addition to the relationship between bank market structure
and industrialization in the short-run. This can be achieved with the specification of an
autoregressive distributed lag (ARDL) model for each country, pooling them together in a
panel, and then testing the cross-equation restriction of a common long-run relationship and
between bank market structure and industrialization using the Pooled Mean Group estimator
developed by Pesaran et al. (1999). So, rather than averaging the data for each country to
separate trend effects, both long and short-run effects are estimated using a panel of merging
time-series and cross-sectional effects.21 Averaging data removes information that may be
important to estimate model that allows for country heterogeneity, as well as concealing the
dynamic relationship that might exist between bank market structure and industrialization,
mainly, if bank market structure has contrasting effects on industrialization at different period
occurrences.
The most important advantage panel data analysis has when used on growth equations is that
country-specific effects can be controlled for, for example, when using General Methods of
Moments (GMM) estimators (Caselli et al. 1996). However, the advantage of the PMG
estimator over the GMM or DFE (Dynamic Fixed Effect) estimators is that the GMM and
DFE estimators generally restricts the slope coefficients to be homogeneous, while only the
intercepts are heterogeneous across countries. On the other hand, PMG estimators allow
short- run adjustments and convergence speeds to differ across countries, and restrict long-
run coefficients to be homogeneous (Pesaran et al. 1999).
21
Recent studies that have applied the PMG estimator include Bassanini and Scarpetta (2002); Byrne and Davis
(2005); Catao and Solomou (2005); Catao and Torrones (2005); Loayza and Ranciere (2006), Frank (2009); Lin
(2009); and Kim et al. (2010).
40
Consequently, the long-run growth equation on the effect of bank market structure on
industrialization is inserted into an ARDL (p, q)22 model to allow for rich dynamics in the
way that industrialization adjusts to bank market structure and conditioning variables. The
ARDL model is written as:
(2.2)
where, MVAGR is growth in manufacturing value added, CV signifies the determinants of
manufacturing value added (bank market structure variables as well as the conditioning
variables), γ and δ are short run coefficients related to manufacturing value added growth and
its conditioning variables, β are the long run coefficients, φ is the speed of adjustment to the
long-run relationship, j is the number of time lags, and ε is the error term. Also,
and are the short-run relationships between manufacturing
value added and its past values as well as the conditioning variables. The term in the square
bracket defines the long-run or equilibrium relationship between and . It can be
re-written as:
where (2.3)
The consistency and efficiency of coefficients obtained from the PMG estimators depends on
some specification conditions. First of all, residuals from the regressions are not to be serially
correlated, as well as treating the conditioning variables exogenously. We attend to this by
including lags to the variables in the ARDL model (Pesaran and Shin, 1999). In this study,
we include one lag to the dependent variable. Secondly, country-specific effects as well as
cross-country common factors have to be accounted for. In line with Loayza and Ranciere
(2006), we allow for country-specific intercepts and demean the data in trying to remove
cross-country common factors. Thirdly, for a long-run relationship to exist, we would require
the error-correction term to be negative but not less than -2.23 In this study, the error-
correction term for the PMG estimator falls within the dynamically stable range. Finally, the
long-run parameters have to be same across countries and the suitability of the PMG
22
Where p represents zero lags of the conditioning variables and q represents one lag of the growth in
manufacturing value added. 23
For a long-run relationship to exist (dynamic stability), the coefficient of the error-correction term should be
negative but not less than -2 (i.e. within the unit circle).
1 1( ) ( ) ( ) [( ) { ( ) }] ,1 0 1 11 0
p qi i i i i
MVAGR MVAGR CV MVAGR CVti j i t j j i t j i i itt tj j
1
1
( )p
i
j i t jj
MVAGR
1
0
( )q
i
j i t jj
CV
itMVAGR
itCV
( )0 1
( ) ,i i
i t i t itMVAGR CV (0)
itI

41
estimator can be tested by a standard Huasman-type test (i.e. we test the null hypothesis of
homogeneity based on the comparison between the PMG and the MG estimators).24
It is imperative that before proceeding with cointegration techniques, we confirm that the
variables are integrated with the same order. We first apply both first generation and second
generation unit root tests (by Im et al. 2003 and Pesaran, 2003 respectively). These tests are
less restrictive, more powerful than tests developed by Levin and Lin (1993), Levin et al.
(2002) and Breitung (2000), and allows for heterogeneity in the autoregressive coefficient.
Both tests are explained in the appendix. Once we have confirmed that the variables are
stationary, we apply Westland’s cointegration test methodology (Westerlund, 2007).
Westerlund (2007) developed four new panel cointegration tests that rely on structural
dynamics rather than residuals, and so do not have common-factor restrictions. The tests are
normally distributed and generally encompass unit-specific short-run dynamics, unit-specific
trend and slope parameters, as well as cross-sectional dependence. Of the four tests, two are
formulated to test the alternative hypothesis for cointegration in the whole panel, while the
other two tests are formulated to test the alternative that at least one unit is cointegrated.25
Appendix 2.4 reports the results of both the first generation and second generation unit root
tests. For the series of all variables in the model, the null hypothesis of a unit root is
rejected.26 With this outcome, it is therefore possible to apply a test for panel cointegration
between the variables in the model. Appendix 2.5 reports the outcome of the Westerlund test
for cointegration in the panel. The results reject the hypothesis that the series are not
cointegrated, suggesting cointegration between the series of the dependent variable and the
independent variables. The model can therefore be estimated using a panel cointegrating
estimator (PMG in this study) because of a cointegrating link between industrialization and
bank market structure (as well as other conditioning variables).
For the second stage of this estimation technique, we examine the association between the
quality of institutions, regulatory restrictions and supervision in the banking sector and the
short-run effect of bank market structure on industrialization. We examine this association
using the simple and rank correlation coefficients. While both correlation coefficients are
24
See appendix 2.3 for Hausman test. 25
See Westerlund (2007) and Persyn and Westerlund (2008) for a description of these tests.
26
We believe that the null hypotheses of a unit root are rejected for all variables because the variables have
previously been demeaned. Before demeaning the data, the growth of manufacturing value added and GDP
growth were I(0) while the other conditioning variables were I(1).

42
used to assess the strength and direction of linear relationship between two pairs of variables,
the simple correlation coefficient is more suitable when both variables are normally
distributed and the rank correlation coefficient, when outliers are present in the data. We have
applied both correlation coefficients to utilize their advantages. Since the PMG estimator
allows us to obtain the short-run effects of bank market structure on industrialization for each
country, we can try to link these effects to the institutional and regulatory environment of the
countries in our sample.
2.3.1.2. FE Estimation
In this study, applying the FE model allows the unobserved country specific factors to affect
industrialization. One advantage of FE models over pure time series or cross-sectional
models is that these models do not provide consistent and unbiased parameter estimates when
unobserved country specific factors are correlated with the dependent and independent
variables. By contrast, FE models are able to deal with unobserved factors affecting the
dependent variable when they are time invariant but vary across cross-sectional units, as well
as when, they change both over time and across cross-sectional units. FE models are able to
eliminate time invariant unobserved effects through first-differencing or demeaning of the
data. Ordinary Least Square (OLS) estimation is then applied to the transformed data in order
to reduce the effect of time-varying omitted variables (Wooldridge, 2006).
Consider the following model:
(2.4)
The correlation between the fixed effects and the explanatory variables would cause the
estimated coefficients to be biased. Therefore, it is necessary to eliminate from the
estimation. In this case, we apply the de-meaning method. First of all, it is necessary to
compute the time series sample average for each individual, which results, in the following:
(2.5)
Since is constant overtime, in (2.5) does not have the over-bar. Additionally, (2.5) is
subtracted from (2.4) to get the following:
1 1 2 2 2( ) ( ) ( ) ... ( ) ( )it i i it i it i k itk ik it iy y x x x x x x (2.6)
0 1 1 2 2 ...it it it k itk i ity x x x a
ia
ia
0 1 1 2 2i i i k ik i iy x x x a
ia
ia

43
Note that the transformation eliminates the fixed effects . This transformation is known as
the ‘within transformation’. Note also that the transformation eliminates the constant as well.
Equation (2.6) can be simplified by using a different notation:
(2.7)
where , denotes the time-demeaned data on y. The same notation is used for the x
variables and ε. Finally, estimating the demeaned equation using OLS is known as the Fixed
Effects estimator. Note that the model does not have an intercept. Stata reports the average
value of .27 In this study, the ‘robust’ option has been used when running the FE models to
control heteroskedasticity. 28Also, in this study, Hausman test results indicate the FE
estimator is preferable to the Random Effect (RE) estimator
The Fixed effects model to be estimated in this study is therefore as follows:
(2.8)
To estimate how the effect of bank market structure on industrialization is influenced by
different institutional, regulatory environment, we incorporate an interaction term between
each of the bank market structure variables and a relevant institutional variable (e.g.
, where is an institutional variable). Note that the bank market
variable, the institutional variable and their interaction term are incorporated simultaneously
into the model. The interaction term is what interest us the most as we will be comparing it to
the relationship between the short-run coefficients of bank market structure variables and
institutional, regulatory and supervisory variables. The interaction terms captures the effect of
bank market structure on industrialization in the presence of intuitions. We are mostly
interested in the interaction term because it helps us to analyze how the influence of bank
market structure on industrialization varies across countries depending on institutions. We
compare the interaction terms with the correlation coefficients between the short-run
coefficients and institutions by considering their signs and significance. The large number of
country variables, and the necessity to use an interaction term with the bank market structure
variables all support the incorporation of the interaction terms separately or one at a time
rather than at the same time. Barth et al. (2004) and Fernandez et al. (2010) have applied a
27
where 1 1
ˆ ˆˆ ...i i i k ik
a y x x 28
This applies when using Stata.
ia
it ity y y
ˆi
a
it itBCON INST
itINST
1 1 2 2 ...it it it k itk ity x x x
1 2 3 4it it it it it itMVAGR BCON FBANK GBANK CV

44
similar sequential technique. For example, when considering bank concentration, the model
will take the following form:
(2.9)
where is the interaction term and is amongst the conditioning variables
.
As has been stated above, one of the key advantages of fixed effects estimation is its ability to
control for all stable characteristics of individuals in the study, thus, to a large extent,
removing possible sources of bias. On the other hand, a popular limitation with FE models is
the fact that they are unable to estimate time-invariant variables (Baltagi, 2001; Wooldridge,
2002; and Hsiao, 2003) because they use only the within variance for the estimation and
neglect the between variance. Another drawback to the FE models is the fact that they may
provide inefficient estimates when estimating the effect of variables with very little within
variance.
2.3.2. Variable Descriptions
The sample has been restricted to 31 countries over a period of 1995-2007 due to the
availability of bank data. First of all, data on foreign bank ownership is mainly available from
1995 and restricts the period sample to 1995-2007. Secondly, while data on foreign bank
ownership is available for more than 31 developing countries, data on government ownership
of banks for many countries is available for only 2001, 2003 and 2008. This restricted us to
rely on previous studies and Bankscope to collect data on government ownership of banks.
Due to time constraints and access to the Bankscope database, data collection for state owned
banks from Bankscope and other relevant sources was restricted to 31 countries for the time
period under consideration. In this section, we describe how the variables are measured.
However, in the Appendix 2.6, we give some useful information on why we chose some of
the variables.
1. Manufacturing Value Added Growth
The annual growth in manufacturing value added MVAGR is a basic indicator to measure a
country’s country level of industrialization (Source: World Bank WDI). The growth in
manufacturing value added is measured as the change in log of real value added of the
manufacturing sector on a yearly basis between 1995 and 2007.
it itBCON INST
itINST
itCV
1 2 3 4 5( )
it it it it it it it itMVAGR BCON BCON INST FBANK GBANK CV

45
2. Bank Concentration
Bank Concentration is formally known as the ‘k-firm’ Concentration Ratio and is defined as
the sum of the market shares of the K largest firms in the market (Scherer, 1980; Clarke,
1985; Carlton and Pearloff, 1994). In other words, a one-industry firm will have a
concentration ratio of 100% since all the value added in an industry is by a single firm. An
industry with ‘n’ firms has a total value-added of in a descending order. Industry
value added is defined as , and therefore the market share of the ith firm is . The ratio
is hence defined as:
, (2.10)
Where BCON is the bank concentration ratio, K is the weight attached to the bank share of a
particular bank, and = , where is the share of bank i assets to total banking industry
assets. In this ratio, equivalent importance is given to the x largest banks but it overlooks the
remaining banks in the banking industry. In this study, the 3-bank concentration ratio is used
to represent bank concentration ratio (i.e. ‘k’ = 3) (Source: Beck et al. 2013).
3. Foreign Ownership of Banks
Foreign bank ownership FBANK is mainly measured as the share of banking assets owned by
foreigners to the total assets of a banking market (Sources: Claessens et al. 2008); Cull and
Martinez Peria, 2011; and Cleessens and van Horne, 2012-but we checked to ensure that
there was consistency between the different sources).
4. Government Ownership of Banks
Similarly, state ownership of banks GBANK is mainly measured as the share of banking
assets owned or controlled by the state to total banking assets. In this study, we have made
use of data from Barth et al. (2001, 2003, and 2008), Bankscope, and other sources which
include previous studies and relevant websites. Data from Bankscope was calculated in a
manner similar to Cornett et al. (2009).29
29
First of all, we calculate the proportion of government ownership bank in each bank by first multiplying the
share of each shareholder in a bank by the share the government owns in that shareholder, and then add the
resulting products over the shareholders of the bank.
,( 1.... )i
x i n
i
i
xS
x
1 1
K Ki
i
i i
xBCON S
x
ix
xiS ix
x

46
5. Bank Development
Bank development BNKDEV is measured as private credit by deposit money banks to GDP
(Source: Beck et al. 2009).
6. GDP Growth
GDP growth GDPGR is measured as the growth in real GDP (Source: World Bank WDI).
Theoretically, economic growth is identified as one of the determinants of industrialization.
However, the endogeneity of economic growth makes it possible that industrialization affects
economic growth. We try to mitigate the problem of endogeneity by ensuring that GDP
growth is lagged.
7. Trade
International trade or trade openness TRADE is measured by the ratio of the sum of export
and import to GDP. Data is in constant 2000 US$ (Source: World Bank WDI).
8. Exports and Imports
Exports EXPGDP and imports IMPGDP have been measured as a ratio of total exports to
GDP. Data are in constant 2000 US$ (Source: World Bank WDI).
9. Human Capital
Human capital HUMCAP is measured as a ratio of health expenditure (private plus public) to
GDP. Data are in constant 2000 US$ (Source: World Bank WDI).
10. Institutional and Regulatory Variables
Entry into Banking Requirement Index (BNKENTRY): This index measures the
conditions that are required for entry. It identifies weather different types of legal
documents are required to obtain a banking license (Barth et al., 2004). Data is
gotten from the World Bank ‘Bank Regulation and Supervision’ database compiled
by Barth et al. This index requires 8 ‘yes’ or ‘no’ questions to be answered where
‘yes’ is equal to 1 and ‘no, is equal to 0. The answers are summed up and the index
is generated. Higher values indicate greater entry restriction.
For bank concentration, a significant positive correlation with BNKENTRY would
indicate that increasing bank entry restrictions would improve the effect of bank
concentration on industrialization, while a negative significant sign would indicate
that reducing bank entry restrictions would negatively influence the effect of bank
concentration on industrialization (Fernandez et al, 2010). On the other hand, Barth

47
et al. (2004) and Demirguc-Kunt et al. (2004) argue that increasing bank entry
restrictions would only make the banking system less efficient.
With regards to foreign bank entry, strict entry restrictions are associated with bank
fragility (Barth et al. 2004). In other words, strict bank entry restrictions should
worsen the effect of foreign banks on industrialization in developing countries.
However Claessens et al. (2001) suggest that relaxing barriers to foreign bank entry
can have a negative effect on the domestic economy, in particular, by increasing
competition and reducing profitability of domestic banks; foreign bank entry may
reduce the charter values of domestic banks, thereby making them more at risk. This
may be detrimental for the banking system particularly when domestic regulation
and supervision is weak. In other words, competition between domestic and foreign
banks is deleterious for industrialization in developing countries.
Barth et al. (2004) suggests that bank regulations and supervisory practices are
closely associated with the degree of government ownership of banks, suggesting
that state ownership of banks is positively associated with tighter restrictions on
bank entry. However, the expected conclusion of this relationship might depend on
the impact of state ownership of banks on economic growth. For example, in La
Porta et al. (2002), state ownership of banks is responsible for lower economic
growth. In this case, we would expect state ownership of banks to be positively
associated with strict bank entry restrictions. On the other hand, Andrianova et al.
(2012) suggest that government ownership of banks has been associated with faster
long-run growth. In this case, we would expect state ownership of banks to be
negatively related to strict bank entry restrictions.
The first case is likely to be valid when a country is just coming out of a banking
crisis30. After a banking crisis, the country is more open to both domestic and foreign
banks to help recapitalize the domestic banking system after stability has been
restored, thereby suggesting a negative relationship between government ownership
of banks and strict entry restrictions.31 Based on these assumptions, it is possible that
30
This in no way restricts the positive effect on industrialization after banking crises; state banks can have
positive effects regardless of previous banking crises. For example, Korea’s industrialization has unarguably
been supported by state funding. 31
A positive relationship between government ownership of banks and strict bank entry restrictions is also
possible when government ownership of banks has a positive effect on economic growth. This argument has
been explained in Stiglitz et al. (1993) under the sub-topic, ‘Competition from Foreign Banks’.

48
the effect of bank entry restrictions on how state banks affect industrialization may
depend on the aggregate impact of state banks on the domestic economy.
Regulatory Restrictions on Activities and Ownership (RESTRICT): This index
measures the extent to which banks are allowed to participate in fee-based rather
than the more traditional interest-based activities, as well as the ability of banks to
own and control non-financial firms (Barth et al., 2004). The fee-based activities
include securities activities, insurance activities, and real estate activities. Four
questions are asked in relations to the fee-based and ownership activities where the
following options are available: Unrestricted, Permitted, Restricted and Prohibited
and they represent 1, 2, 3 and 4 respectively. The respective answers are summed up
to get the index, with higher value indicating more restriction. Data is gotten from
the World Bank ‘Bank Regulation and Supervision’ database compiled by Barth et
al. (2004). Similar to bank entry restrictions, the intuition is the same for bank
restrictions on activities and ownership if we get significant positive or negative
signs for bank concentration.
Regulatory Restrictions on Ownership (RESTOWN): This index measures
restrictions on the ability of banks to own and control non-financial firms (Barth, et
al., 2004). Four questions are asked in relations to the fee-based and ownership
activities with where the following options are available: Unrestricted, Permitted,
Restricted and Prohibited, where they represent 1, 2, 3 and 4 respectively. The
higher the values, the more the restrictions over banks owning non-financial firms.
Data is gotten from the World Bank ‘Bank Regulation and Supervision’ database
compiled by Barth et al. (2004). Similar to bank entry restrictions and restrictions on
activities and ownership, the intuition is the same for bank restrictions on ownership,
if we get significant positive or negative signs for bank concentration.
Economic Freedom Index (ECONFREE): The index ECONFREE is an index that
comprehensively measure economic freedom and is also available for an extensive
number of countries. The index examines economic freedom from 10 perspectives.
Economic freedom has external features – such as investment and trade
liberalization – as well as internal features – such as the ability of entities to use
labour and finance freely without any government restrictions. This index is an
average of 10 individual freedoms –business freedom, trade freedom, fiscal freedom,
government spending, monetary freedom, investment freedom, financial freedom,
property rights, labour freedom and freedom from corruption - that individually has

49
a scale of 0 to 100, higher values indication higher freedom (Miller and Kim, 2011).
Data has been made available by Heritage Foundation.
Private Monitoring Index: This index MONITOR, measures private sector
monitoring of the banking system. It is measured using four indicators - certified
audit required, percent of 10 biggest banks rated by international credit agencies, no
explicit deposit insurance scheme, and banking accounting -where ‘yes’ represents
1and 0 otherwise (except for the second indicator which represents 1 if it is 100
percent and 0 otherwise). Higher values indicate more private supervision (Barth et
al., 2004). Data is gotten from the World Bank ‘Bank Regulation and Supervision’
database compiled by Barth et al., (2004). The new Basel Accord presupposes that
both stringent official supervision and private monitoring promotes stability in
banks. However, Barth et al. (2004) find that policies that promote effective
monitoring by the private sector seem to be better for bank development and stability
than policies that promote official supervision. Barth et al. (2006) and Beck et al.
(2006b) are two other studies that support the effectiveness of privately monitoring
banks. On the other hand, Fernandez et al. (2010) finds that increasing effective
monitoring by the private sector worsens the effect of bank concentration on
industrialization.
Accounting and Information Disclosure Requirement Index: The Index ACCOUNT,
measures the extent to which banks are required to make accounting and information
disclosure public. It is constructed from 3 ‘yes’ and ‘no’ questions related to bank
income statements, interest rates, non-performing loans, and providing consolidated
financial statements. Higher values indicate more informative bank accounts (Barth
et al. 2004).
With regards to bank concentration, the story is that information disclosure reduced
information asymmetries (in the presence of which bank concentration may have a
positive effect) and, therefore, the positive effect of market power starts to dominate
the negative effect (in terms of amelioration of information asymmetries) of bank
concentration. This position reflects the assumption that the market is best. But if
there are market failures (e.g. Da Rin and Hellmann, 2002), where banks need
adequate profits to fund industrialization, then disclosure could increase the positive
effect of bank concentration since it increases the quality lending decisions.
However, Fernandez et al. (2010) argues that improving disclosure would cause
bank concentration to negatively affect industrialization in developing countries.

50
For foreign banks, it has been suggested that, although they are seen to be more
efficient and profitable, they have less knowledge of the market than domestic banks
(Mian, 2003). Therefore, they are likely to have a more positive impact on
industrialization if disclosure of accounting and information is high. Also, Berger et
al. (2008) suggest that foreign banks in India only develop lending relationships with
transparent firms because they are able to use their advantages into processing hard
information of more transparent firms.
Regarding state ownership of banks, the World Bank (2001) and Micco et al. (2007)
points that because the government may use state banks to bolster their political
support, and therefore, cause the allocation of credit to respond to opportunistic
criteria rather than efficiency. Better quality of information and accounting
disclosure and the demand for it can improve state bank lending behavior and make
their allocation of credit to be more efficient. In other words, improving accounting
and information disclosure is likely to improve the effect of state banks on
industrialization.
Property Rights Index: This Index PROPRITE is a component of the index of
economic freedom by the Heritage Foundation. It emphasizes the ability of entities
to accrue private property, protected by defined laws that are effectively enforced by
the government. It measures the extent to which a country’s laws protect private
property rights and the degree of enforcement by the government. It also explore the
possibility that private property rights will be expropriated and evaluates the
autonomy of the courts, the existence of corruption within the courts, and the
capacity of individual and business entities to enforce contracts (Heritage
Foundation,2013).
Governance: This index GOV is broadly defined as the traditions and institutions by
which authority in a country is implemented. It includes the procedure that chooses
and replaces governments; the ability of government development and application of
sound policies; the respect of citizens; and the governance of the institutions that
administrate economic and social relations amongst them (Kaufmann et al. 2002).
Data on perceptions of governance are based on six point perspectives: voice and
accountability, political stability and absence of violence, government effectiveness,
regulatory quality, rule of law, the control of corruption. Each of these indices has a
scale of -2.5 to 2.5, with higher value indicating better governance. The governance

51
index is an average of these six indicators. Data is made available by the World
Bank on the ‘Worldwide Governance Indicators’ complied by Kaufmann et al.
Law and Order Index: We have also used the law and order index LAWORDER to
measure institutional and legal systems quality. The law and order index is published
by ICRG. They define the index to measure the legal system of a country as well as
the rule of law. It has a scale of 0-6 but was changed to a 0-10 scale by La Porta et
al. (1998), with higher values indicating the existence of high integrity in the legal
system and the acceptance of citizens of legal mechanisms to settle disputes (Burki
and Perry, 1998). Data is made available on Rafael La Porta’s website.
For foreign banks, the literature suggests increased entry into developing countries
when the rule of law is respected and properly enforced. For example, in Andrainova
et al. (2008), a country’s banking sector would not attract significant foreign entry if
the rule of law is weak and corruption is widespread. Also, Focarelli and Pozzolo
(2005), points that the presence of stronger law-and-order tradition in a country
increases the probability that it would host foreign banks. Therefore, it is expected
that foreign banks should improve industrialization in countries with a strong law-
and-order.
Regarding state banks, poor quality of institutions might not be to only impediment
that weakens its effects in developing countries. Andrews (2005) suggest that a weak
law-and-order tradition can cause serious short-comings on how state banks affect
the economy. In other words, in countries where the rule of law is respected and
effectively enforced, state banks are seen to perform better.
Official Supervisory Index: This index OFFICIAL measures the extent to which
official supervisory authorities have the authority to take specific actions to prevent
and correct problems. It is obtained by adding a value of one for each affirmative
answer to 14 questions intended to gauge the power of supervisors to take specific
actions to prevent and correct problem (Barth et al., 2004). Data is gotten from the
World Bank ‘Bank Regulation and Supervision’ database compiled by Barth et al.
Banking Freedom Index: The banking freedom index BNKFREE represents the
financial freedom index-a component of the index of economic freedom from the
Heritage Foundation-and it measures banking efficiency as well as the independence
from government control and intervention in the financial system-and we use it to
measure government interference in the banking system. This index is constructed

52
based on 5 extensive areas: the extent of government regulation and services of
financial services; the degree of state intervention in banks and other financial forms
through direct or indirect ownership; the extent of financial and capital market
development; government influence on the allocation of credit; and openness to
foreign competition (Heritage Foundation, 2013). It has a scale of 0-100, with higher
values indicating less government interference. The standard results in the literature
would suggest that, with high government interference, the effects of bank
concentration are worse (Cetorelli and Gambera, 2001). Also results from Barth et
al. (2004) and Demirguc-Kunt et al. (2004) equally suggest that government
intervention through excessive regulatory restrictions will make the banking system
less efficient and supports the standard results in the literature. However, according
to Fernandez et al. (2010), excessive government intervention in the banking system
has the potential to reduce the negative effects of bank concentration on
industrialization.32
Rule of Law Index: The rule of law index RL is another index we use to measure the
quality of institutional and legal systems. It is a component of the Governance index
by Kaufmann et al. The rule of law index comprises indicators that measure how
well economic entities respect the rules of society. These indicators include
perceptions of the prevalence of crime, the effectiveness and integrity of the courts,
and the effective enforcement of contracts. This index measures how well a society
has been able to create an environment which is based on just and conventional rules
that govern economic and social interactions as well as the protection of property
rights (Kaufmann et al. 2002). It has a scale of -2.5 to 2.5, where higher values
indicate better respect for the law by both the private sector and the government.
Degree of Corruption: We use this index CORRUPT to measure the level of
corruption in countries, and this index is based on the perceptions of foreign
inventors and published by the International Country Risk Guide (ICRG). The ICRG
corruption index signifies that at higher levels of corruption, senior government
officials would probably insist on special payments and unlawful payments are
commonly anticipated at lower levels of government, mainly in the form of bribes
associated with foreign trade licenses, exchange controls, tax assessment, police
protection or loans. It has a scale of 0-6, but has been changed to a scale of 1-10 by
La Porta et al. (1998) with higher values indicating lower corruption levels. Data is
made available on Rafael La Porta’s website. In the literature, where corruption is
32
See “Bank Regulation” in Section 2.2.2.1

53
high, domestic banks may not be trustworthy and make lending decisions marred by
corruption. Foreign banks may be less vulnerable to this. We have previously
mentioned that countries encumbered by widespread corruption will not attract
significant entry of foreign banks, and even if foreign bank entry is significant,
widespread corruption would prevent any meaningful benefits that would have been
accrued to the country. In countries where governance is bad, foreign-ownership
efficiency is negatively related to corruption (Lensink et al. 2008). In other words,
foreign banks don’t perform efficiently. Therefore, we would expect foreign banks
to be more effective in developing countries with low levels of corruption.
Control of Corruption: We also use this index CC to measure the control of
corruption in countries. The index is a component of the Governance index by
Kaufmann et al. Its definition is closely related to that of the ICRG-it measures the
extent to which government and public officials use their official powers for
personal gain, and this includes both trivial and grand of corruptions, in addition to
unofficial control of the economy by elites and private interest-and has a scale of -
2.5 to 2.5, where higher values indicate better control of corruption.
Good Governance Index: The index GOODGOV measures the quality of the
institutional environment and it equals the sum of 3 indexes: risk of expropriation by
the government; degree of corruption; and law and order (La Porta et al. 1999). The
risk of expropriation by government measures the extent to which private property is
confiscated and nationalized by the government. Higher values indicate less risk of
expropriation, less official corruption and greater law and order tradition. According
to Lindgren et al. (1996), the conditions for good governance include a strong and
comprehensive legal and institutional environment, as well as a trustworthy
judiciary, and adequate laws that govern bankruptcy, contracts and private property.
Another necessary condition includes transparency, particularly through appropriate,
reliable, and precise information and disclosure standards. As a result of these, good
governance will improve the dependability, depth, and coverage of information and
disclosure. The entry of foreign banks into the domestic banking system will
improve the general governance of banking and translate it into dividends for the
domestic economy. That is why Garber (1997) warns that in countries where the
level of governance is weak, the entry of foreign banks puts competitive pressure on
the charter values of weak domestic banks, distorting incentives and leading to
excessive risk-taking in an environment of unhealthy competition. Therefore, the

54
results that good governance promotes the performance of foreign banks with
reference to industrialization in developing countries should be expected.
Regulatory Quality: The index RQ measures the quality of supervision and the
regulatory system. It is a component of the Governance index of Kaufman et al. and
it measures perceptions of the capacity of the government to develop and implement
robust policies and regulation that allow and encourage private sector development
(Kaufmann et al., 2002). It has a scale of -2.5 to 2.5 with higher values indicating
batter regulatory capacity.
Political Stability: This index PV measures the stability of the political environment
is also a component of the Governance index by Kaufmann et al. The index
measures perceptions of the probability that the government will be undermined or
removed from power by undemocratic or aggressive means, as well as politically-
motivated violence and terrorism (Kaufmann et al., 2002). The index has a scale of -
2.5 to 2.5, with higher values indicating the implausibility of government disability
and politically motivated violence.
Government Effectiveness: The index GE is a component of the Governance index
by Kaufmann et al. and it measures perception of public service quality, civil service
quality and its extent of independence from political powers, the quality of policy
development and implementation, and the credibility of government to such policies.
Higher values indicate better quality of public service, better quality of the civil
service and a more efficient process in policy formulation and implementation by the
government.
2.3.3. Data Specification
Summary statistics for key variables employed in the study are presented in Table (2.1),
while the correlations between variables are presented as a correlation matrix in Table (2.2).
In Table (2.2), two significant relationships that might interest us are that industrialization has
a negative significant relationship with foreign bank entry, while it has a positive significant
relationship with state owned banks. This relationship is not in line with the literature that
strongly supports the idea that industrialization is strongly and positively associated with
foreign bank entry and negatively related with the government ownership of banks. We also
present some scatter plots on the relationship on the relationship between bank market
structure variables and growth in manufacturing value added over subsamples with the aim of

55
showing stability of coefficients during the period33 and we find some stability of the
coefficients from this plots.
Table 2.1: Summary Statistics for Key Variables (Annually and Cross-Sectional) 1995-2007
VARIABLE OBS. MEAN STD. DEV. MIN. MAX.
MVAGR 403 0.04827807 0.06044787 -0.300925 0.4028098
BCON 403 0.6162002 0.1862631 0.242511 1.0
FBANK 403 0.2533769 0.2624569 0 0.96
GBANK 403 0.3143587 0.2573553 0 1.0
BNKDEV 403 0.4110384 0.3084299 0.0308122 1.65962
GDPGR 403 0.04519056 0.03550849 -0.131267 0.167288
TRADE 403 0.6531303 0.3758918 0.149328 2.20407
EXPGDP 403 0.3159386 0.1962027 0.6566741 1.213114
IMPGDP 403 0.339358 0.186361 0.8366105 1.005971
HUMCAP 403 0.05420096 0.02003512 0.0176545 0.1560317
BNKENTRY 30 7.333333 1.028334 4 8
RESTRICT 30 11.46667 2.344963 5 16
RESTOWN 30 2.9 0.8448628 1 4
ECONFREE 403 0.5992754 0.07782524 0.345 0.780
MONITOR 30 6.766667 1.006302 5 9
ACCOUNT 30 4.466667 1.224276 0 6
PROPRITE 403 0.4945409 0.1787741 0.10 0.90
GOV 403 -0.1930565 0.550681 -1.19442 1.147717
LAWORDER 30 2.795352 0.8500174 1.25 4.214286
OFFICIAL 30 10.36667 2.141275 5 14
BNKFREE 397 0.4942065 0.1559969 0.10 0.70
RL 403 -0.1918568 0.6179955 -1.474449 1.370544
CORRUPT 30 5.087112 1.487118 2.142857 8.910256
CC 403 -0.2201353 0.5976025 -1.158098 1.570757
GOODGOV 30 13.77167 2.723236 8.690477 18.88095
RQ 403 -0.0708987 0.6207322 -1.727435 1.644733
PV 403 -0.4708186 0.7742069 -2.734312 1.042907
GE 403 -0.0276024 0.5463215 -1.282234 1.277851
YLEVEL 403 7.344928 1.109739 4.74352 9.62626
FINDEV 390 -0.0612451 1.871435 -2.415995 6.136674
STMKTACT 333 0.4940002 0.7484898 0.0003134 4.947826
33
In appendix 2.7 We split the time period into 3 subsample (period 1, 1995-1998; period 2, 1999-2002; and
period 3, 2003-2007).

56
Table 2.2: Pairwise Correlation Matrix for Bank Market Structure and Institutional Variables (1995-2007 and Cross-Section )
MVAGR BCON FBANK GBANK BNKENTRY RESTRICT RESTOWN ECONFREE MONITOR ACCOUNT PROPRITE GOV LAWORDER
MVAGR 1.00
BCON 0.07 1.00
FBANK -0.31*
0.02 1.00
GBANK 0.47***
-0.10 -0.38**
1.00
BNKENTRY -0.08 0.01 -0.06 -0.18 1.00
RESTRICT 0.10 -0.04 -0.21 0.24 -0.17 1.00
RESTOWN 0.10 -0.16 -0.35**
0.38**
-0.20 0.79***
1.00
ECONFREE -0.32*
-0.34*
0.15* -0.48***
-0.19 -0.03 0.06 1.00
MONITOR -0.30 0.13 0.27 -0.33*
0.11 0.03 -0.19 0.20 1.00
ACCOUNT 0.09 -0.30 0.01 -0.35*
0.26 -0.13 -0.09 0.44**
0.18 1.00
PROPRITE -0.25 -0.37**
0.03 -0.36**
-0.22 -0.18 -0.06 0.85***
0.15 0.34*
1.00
GOV -0.16 -0.23 0.03 -0.24 -0.26 -0.16 0.02 0.81***
0.17 0.27 0.84***
1.00
LAWORDER 0.15 -0.23 -0.10 0.09 -0.15 0.02 0.03 0.30 0.06 0.13 0.36 **
0.48 ***
1.00
Note: This table reports the correlation matrix of key variables used in the regression, where * indicates significance at the 10% level, ** indicates significance at the 5% level, and *** indicates significance at the 1% level.
Table 2.2 Continued.
MVAGR BCON FBANK GBANK OFFICIAL BNKFREE RL CORRUPT CC GOODGOV RQ PV GE
MVAGR 1.00
BCON 0.07 1.00
FBANK -0.31*
0.02 1.00
GBANK 0.47***
-0.10 -0.38***
1.00
OFFICIAL -0.34*
-0.41**
0.11 -0.31 1.00
BNKFREE -0.42 **
-0.16 0.35 **
-0.53 ***
0.23 1.00
RL 0.05 -0.18 -0.14 -0.09 -0.12 0.28 1.00
CORRUPT 0.05 0.13 -0.08 -0.04 -0.25 0.06 0.42 **
1.00
CC -0.12 -0.15 -0.03 -0.16 -0.11 0.38 **
0.90 ***
0.49 ***
1.00
GOODGOV 0.10 -0.19 -0.11 -0.03 -0.06 0.06 0.59 ***
0.85 ***
0.60 ***
1.00
RQ -0.17 -0.31 *
0.07 -0.36 *
0.01 0.61 ***
0.79 ***
0.39 **
0.84 ***
0.58 ***
1.00
PV -0.14 -0.01 0.18 -0.11 -0.03 0.27 0.76 ***
0.59 ***
0.78 ***
0.67 ***
0.60 ***
1.00
GE 0.05 -0.33 *
-0.16 -0.22 0.01 0.30 0.88 ***
0.46 ***
0.88 ***
0.66 ***
0.87 ***
0.67 ***
1.00
Note: This table reports the correlation matrix of key variables used in the regression, where * indicates significance level at 10%, **

57
2.4. EMPIRICAL RESULTS
2.4.1. Result Diagnostics
After applying both econometric techniques discussed above on the data, the following
regression results are presented and discussed: first of all, the relationship between bank
market structure and industrialization are presented in Tables 2.3 and 2.4 (PMG 34and FE
respectively). Also, the relationship between the short-run coefficients of BCON, FBANK and
GBANK on industrialization, and measures of institutional quality are presented in Tables 2.5,
2.7 and 2.9 respectively, using parametric and non-parametric correlations coefficients. These
tests illustrate how the effect of bank market structure on industrialization varies in the
presence of institutions and regulatory restrictions.
Further results are presented in the form of interacting bank market structure variables with
measures of institutional quality (with time variation) and these results are presented in
Tables 2.6, 2.8 and 2.10.35 In the PMG regression (as well as the MG and DFE), we control
for country and time effects. The Joint Hausman test between PMG and MG estimation is
also presented. For the FE estimation, all models include period dummies that are not
reported. To control for the heteroskedasticity in the FE estimation, the t-ratios are computed
using Heteroskedasticity consistent standard errors. So as not to get carried away exploring
the importance of all institutional variables with bank market structures, we have identified in
the literature, what we regard as the most relevant institutional variables for each bank market
structures.
2.4.2. The Effect of Bank Market Structure on Industrialization
2.4.2.1. PMG Baseline Model
In Table 2.4, we report the results for regressions based on the specification in (2.2). The
lagged dependent variable is expected to have a positive sign because it is possible that past
industry performance may influence future industry decisions. Therefore, the past values of
growth in manufacturing value added would be expected to positively influence the future of
industrialization. We would expect the level of bank development, real GDP growth, and
human capital to have a positive influence on industrialization, at least in the long-run.
34
The MG and DFE estimates are also presented for completeness but are not discussed because we are
interested in the PMG estimates. 35
Tables 2.6, 2.8 and 2.10 present results with interaction terms for bank concentration, foreign bank entry and
state ownership of banks respectively.

58
However, it is not obvious that the ratio of exports plus imports to GDP should be positive.
While it is expected to be positive, it could be negative, particularly when a country exports
little and imports a lot.
However, our main focus is the long-and short-results of bank concentration, foreign bank
entry and state ownership of banks in industrialization. Our long-run results suggest that bank
concentration has a positive and significant effect on industrialization, while foreign bank
entry and state ownership of banks, both have negative and significant effects on
industrialization. In the short-run, our results suggest that bank concentration has a negative
effect on industrialization, while foreign bank entry and state ownership of banks positively
influence industrialization.
2.4.2.2. FE Baseline Model
The baseline of the fixed effects estimates of equation (2.8) are reported in Table 2.436. Both
baselines are relatively similar except for the fact that the ratio of exports plus imports to
GDP has been replaced with the growth rate exports and imports and human capital has been
replaced with the rate of inflation. The results suggest that bank concentration is positive and
significantly related to industrialization while foreign bank entry and state ownership of
banks have a negative sign (although the negative sign is insignificant for state ownership of
banks). The other control variables have the expected signs. The results of our variables of
interest (bank concentration, foreign bank entry and state ownership of banks) are similar to
what we have in the PMG long-run regression, and it is encouraging that it was possible to
replicate them in the FE regression. The results are significant with the exception of
government ownership of bank which is insignificant but at 15% and bank development
which is largely insignificant.
2.4.2.3. Discussion of Baseline Results.
The results in Table 2.3 suggest that bank concentration positively influences
industrialization in the long-run, while this effect is negative in the short-run. On the other
hand, the results also suggest that foreign bank entry and state ownership of banks have a
negative effect on industrialization in the long-run, while this effect is positive in the short-
run. The results in Table 2.4 (FE estimation) suggest that bank concentration positively
36
The RE results are also presented in Table 2.4 for completeness and also for the reason that the Hausman test
will be presented. However, the RE results are only presented in the FE baseline model, they are not presented
when the interactions are used.

59
influences industrialization while foreign bank entry and state ownership of bank have a
negative effect. Our aim in this section is to try to discuss the short and long run results of
bank concentration, foreign bank entry and government ownership of banks in isolation, after
then we will try to reconcile the long-and short-run results.
The positive effect of bank concentration on industrialization in the long-run are largely
associated with the theoretical predictions of Peterson and Rajan (1995). In their study, they
hypothesize that that young/new firms without historical records or firms that find it difficult
to get funds from the capital market are more likely to be financed by banks with market
power. This occurs through the facilitation of funds towards investment projects, resulting in
the fast growth of firms; with the intention of sharing in future profits through the extraction
of monopoly rents when the firms become successful.
Another theoretical study that supports this view is Da Rin and Hellman (2002). They argue
that banks act as a catalyst for industrialization but they also emphasize that these banks have
to be profit-driven, significantly large and with market power in the banking market. Also,
according to Marquez (2002), the positive effect of bank concentration could also be as a
result of the ability of banks with market power to evaluate the credibility of borrowers, thus,
reducing risks and inefficiencies in the credit market. Mitchener and Wheelock (2013)
suggest that increasing bank concentration would result in higher growth in manufacturing
output. However, in line with our short-run result, Cetorelli and Gambera (2001) argue that
bank concentration at the country level imposes a dead weight loss on industry growth. In
other words, they suggest that bank concentration negatively affects the economy through the
credit market by reducing the total amount of loanable funds available to firms.
To reconcile the long-and short-run effect of bank concentration on industrialization, we
consider Panetta and Focarelli (2003). Their study examines the long-run price effects of
mergers. They argue that the effects of market power as a result of mergers and acquisitions
harmed consumers only in the short-run. In other words, many of the studies with this result
restricted their examination to the short-run. After their examination, they find evidence that
the significance of long-and short-run effects of mergers and acquisition are distinct. In line
with previous research, they find that in the short-run, effects of mergers increases
concentration, as well as market power, which results in the change of deposit rates that are
not beneficial to consumers. However, in the long-run, they find that deposit rates of banks

60
Table 2.3: Long- and Short-Run Effect of Bank Market Structure on Industrialization
Pooled Mean Group Mean Group Dynamic Fixed Effects
Variables MVAGR MVAGR MVAGR
Long-Run Coefficients
BCON 0.042***
-0.020 0.089***
(0.0051) (0.1977) (0.0287)
FBANK -0.051 ***
0.216 0.008
(0.0021) (0.2828) (0.0222)
GBANK -0.048 ***
0.530 *
-0.047
(0.0150) (0.3348) (0.0373)
BNKDEV 0.112***
1.295*
-0.037
(0.0193) (0.8012) (0.0419)
GDPGR (-1) 0.124 ***
0.540 1.051***
(0.0108) (1.8107) (0.0974)
TRADE 0.127 ***
1.295***
-0.002
(0.0156) (0.5712) (0.0486)
HUMCAP 0.916 ***
2.977 0.174
(0.0993) (2.8972) (0.4329)
Joint Hausman Test ( ): 0.26 (0.3834)
Error-Correction Coefficients Φi
-1.547***
-1.036***
-1.087***
(0.3984) (0.2299) (0.0579)
Short-Run Coefficients
MVAGR (-1) 0.581**
0.050 0.041
(0.2908) (0.1963) (0.0465)
BCON -0.277 0.135 0.033
(0.0.3138) (0.1304) (0.0439)
FBANK 1.116 0.399 -0.015
(1.0735) (0.2887) (0.0295)
GBANK 0.516 -0.334 -0.042
(0.7696) (0.3056) (0.0599)
BNKDEV 3.301 0.502 0.092
(3.3143) (0.4321) (0.1386)
GDPGR (-1) 0.611 -0.167 0.168***
(0.6219) (0.5683) (0.0705)
TRADE 0.181 -0.504 0.174
(0.5260) (0.5070) (0.1353)
HUMCAP 2.359 -0.164 0.962*
(2.621) (0.4058) (0.5902)
CONS. 3.667 -2.229 -6.834***
(3.1148) (4.1798) (2.705)
No of Obs. 341 341 341
with increased market power starts to increase. Finally, they argue that the net effect of an
increase in bank concentration on consumers is positive: the long-run efficiency gains
through an increase in the deposit rate are greater that than the negative short-run effects of
market power.
The long-run results suggest that foreign bank entry has a negative effect has a negative
effect on industrialization and are similar to the theoretical arguments put forward by
Detragiache et al. (2008), where they argue that while lending, financial intermediation, and
welfare may improve with the entry of foreign banks, this does not justify their presence
2

61
Table 2.4: The Effect of Bank Market Structure on Industrialization
Fixed Effects Random Effects
Variables MVAGR MVAGR
BCON 0.120 ***
0.0531***
(0.0326) (0.0193)
FBANK -0.0657**
-0.0251
(0.0281) (0.0165)
GBANK -0.0712*
0.0138
(0.0438) (0.0158)
BNKDEV 0.0216 0.0006
(0.0494) (0.0142)
GDPGR (-1) 0.420***
0.467***
(0.1369) (0.1253)
EXPGDPGR 0.107***
0.104***
(0.0341) (0.0339)
IMPGDGR -0.0514**
-0.0491**
(0.0242) (0.0239)
INF -0.159***
-0.144***
(0.0441) (0.0389)
CONS. 3.109 2.184
(3.727) (2.296)
No of Obs. 372 372
R2
within 0.228 0.207
R2
between 0.004 0.363
F-Test/Wald Test 5.00 99.21
Notes: Estimators: Fixed effects and Random Effects, all include period dummies which are not presented. The standard errors are reported in parentheses, where * indicates significance at the 10% level, ** indicates significance at the 5% level, and *** indicates significance at the 1% level. The Hausman test statistic and p-value: 13.41 (0.000), suggest using fixed effects.
They suggest that under some circumstances, foreign banks might be involved in ‘cream-
skimming’, which increases the cost of financial intermediations and reduces welfare. The
results are also consistent with Berger et al (2001) who argue that informationally opaque
small firms in Argentina received less credit from large banks and foreign banks; Satta
(2004), who on average finds that that foreign banks in Tanzania between 1991 and 2001 lent
less to small firms than domestic banks; and Clarke et al. (2005), who finds that foreign
banks devoted less of their lending to small businesses in Argentina, Chile, Colombia and
Peru during the mid-1990s than domestic private banks.
However, in line with our short-run results, Beck et al. (2004) and Clarke et al. (2006) argue
that foreign bank entry has a positive effect on the domestic economy. Beck et al. (2004)
initially argues that bank concentration increases financing obstacles, with stronger effects for
small and medium firms but also finds that a high foreign bank presence dampens this effect;
also, Clarke et al. (2006) point that all enterprises, including small and medium ones, report
lower financial obstacles in countries having higher level of foreign bank presence. Another
argument by Havrylchyk (2012) suggests that foreign bank entry has an average positive

62
relationship with lower entry rates of firms and smaller size of entrants in informationally
opaque industries but this effect may be affected by the mode of entry. In other words,
foreign bank presence has a negative effect on firm entry and firms in informationally opaque
industries when they enter through the acquisition of domestic banks, while this effect is
positive when foreign banks enter through Greenfield investments, suggesting the multiple
effects of foreign banks.
We try to reconcile the long-and short-run effects of foreign bank entry on industrialization in
developing countries using Clarke et al. (1999). In their study, they examine how foreign
bank entry affected domestic banks in Argentina in the mid-1990s. Foreign banks
concentrated their lending in manufacturing and mortgages, areas where they had
comparative advantage. Domestic banks that concentrated in these areas were not initially
affected, at least in the short-run, because they enjoyed informational advantages and were
not immediately chased out of this niche. However, in the long-run, they were eventually
chased out of the market as a result of the superiority of foreign banks. Although Clarke et al.
(1999) argues that such banks should have gone into other areas that foreign banks stayed
away from, we argue that in this case, informationally-opaque firms, particularly in
manufacturing, may become more credit constrained, thereby worsening their production
activities. We see here that, while foreign bank entry may have a positive effect in the short-
run, its ability to completely drive out domestic banks from areas where it has interest may
result in a negative effect in the long-run.
The long-run results suggest that state ownership of banks has a negative and significant
effect on the growth of manufacturing value added. In accordance with Stiglitz et al. (1993),
we argue that financial markets are very different from other types of market, resulting in a
more detrimental effect as a result of market failures. Also, we argue that the presence of
market failures in financial markets is a justification for government intervention, not only to
make the market work more efficiently, but to improve the performance of the economy.
Finally, we argue that the justification of government intervention in financial markets is not
only restricted to market failures, but also the presence of complex financial operations which
requires government regulators. To support Stiglitz et al. (1993), Andrianova et al. (2008)
argue that state bank would naturally wither when they are no longer required. Finally,
according to Rodrik (2012), the positive effect of state owned banks on growth might not be
shown in the coefficient of standard growth regressions because of the presence of market

63
failures. In other words, it is possible that true effect of state owned banks on manufacturing
value added has being masked by market failures in our model.
However, the negative long-run results are similar to those of La Porta et al. (2002), Barth et
al. (2001), Beck and Levine (2002), Komer and Schanabel (2002). They all argue that state
owned banks are detrimental for economic growth through slow financial development and
lower economic growth. The short-run results suggest a positive effect of state owned banks
on industrialization. In line with these results, our study is similar to Sapienza (2004); Yeyati
et al. (2007) and Andrianova et al. (2012). Sapienza (2004) argues that state banks positively
influence firm growth by lending to them; Yeyati et al. (2007) argues that it improves
efficiency in the financial system and reduces credit procyclicality; and Andrianova et al.
(2012) argues that state ownership of banks is associated with long-run growth.
To reconcile the long-and short-run effect of state ownership of banks on industrialization,
we use an argument similar to Andrianova et al. (2008), where they argue that state owned
banks would naturally wither when they are no longer required. In line with our study, we
argue that the presence of state owned banks positively influences industrialization in
developing countries when industries are underdeveloped. In other words, firms in
underdeveloped industries are likely to benefit from low-cost funding from state owned banks
in the short-run. However, when industries become developed, firms are in a better position
to secure funding from the private banking market. The continuous presence of state banks in
such markets may be detrimental to the growth of firms in that industry because lending to
firm may become less efficient and politically motivated. In other words, we argue that when
industries become developed, the presence of state banks may have a negative effect on
industrialization.
2.4.2.4. Discussion of Correlation Coefficients and FE Interactions.
Bank Concentration
Correlation coefficients are presented in Table 2.5, while the panel estimations are presented
in in Table 2.6.
Economic Freedom (ECONFREE)
The Spearman correlation coefficient suggests a positive and significant relationship between
the effect of bank concentration on industrialization and economic freedom. Also, in column
1, the result suggests that while bank concentration by itself has a negative significant effect
on industrialization, its interaction with economic freedom is positive and significant.

64
Table 2.5: Correlation between Short-Run PMG Coefficients and Measures of Institutional Quality
(Bank Concentration)
PEARSON SPEARMAN
VARIABLES BCON BCON
BANKENTRY 0.0245 -0.3000
RESTRICT -0.1081 0.1002
RESTOWN 0.0159 0.1814
ECONFREE 0.2645 0.3902**
MONITOR -0.0010 0.1404
PROPRITE 0.1854 0.3130**
ACCOUNT 0.2128 0.1401
GOV 0.2177 0.3382**
LAWORDER 0.0219 0.1809
OFFICIAL 0.2875 0.1388
BNKFREE 0.2493 0.2179
RL 0.2108 0.3213**
Table 2.6: Bank Concentration and it’s interaction with measures of Institutional Quality 1 2 3 4 5
Variables MVAGR MVAGR MVAGR MVAGR MVAGR
BCON -0.258 -0.0180 0.161*** 0.158*** 0.0239
(0.174) (0.0773) (0.0353) (0.0355) (0.0881)
BCON ECONFREE 0.00638**
(0.00294)
BCON PROPRITE 0.00285**
(0.00146)
BCON GOV 0.146***
(0.0491)
BCON RL 0.131***
(0.0439)
BCON BNKFREE 0.00186
(0.00167)
FBANK -0.0603** -0.0551** -0.0684*** -0.0673*** -0.0555**
(0.0282) (0.0287) (0.0279) (0.0279) (0.0289)
GBANK -0.0808* -0.0727* -0.0681* -0.0611 -0.0752*
(0.0441) (0.0437) (0.0434) (0.0436) (0.0446)
BNKDEV 0.0147 -0.0446 0.0253 0.0243 0.0273
(0.0498) (0.0504) (0.0493) (0.0495) (0.0499)
GDPGR (-1) 0.407*** 0.419*** 0.408*** 0.428*** 0.389***
(0.136) (0.137) (0.136) (0.136) (0.138)
EXPGDPGR 0.116*** 0.109*** 0.111*** 0.108*** 0.105***
(0.0343) (0.0341) (0.0340) (0.0338) (0.0345)
IMPGDPGR -0.0514*** -0.0501** -0.0533** -0.0532** -0.0449*
(0.0242) (0.0241) (0.0239) (0.0239) (0.0246)
INF -0.166*** -0.159*** -0.157*** -0.155*** -0.171***
(0.0442) (0.0440) (0.0440) (0.0437) (0.0250)
ECONFREE -0.366*
(0.209)
PROPRITE -0.210**
(0.0961)
GOV -9.738***
(3.828)
RL -7.555**
(3.351)
BNKFREE -0.159
(0.103)
CONS. 24.70** 14.08** 0.750 0.870 11.44
(13.327) (6.232) (3.796) (3.782) (6.467)
No of Obs. 372 372 372 372 369
R2 within 0.240 0.239 0.249 0.249 0.235
R2 between 0.002 0.006 0.000 0.000 0.007
F-Test 4.80 4.80 5.06 5.05 4.64
Note: The standard errors are reported in parenthesis and ,*,**,*** indicate significance at the 10%, 5%, and 1% level
respectively. Period dummies are included but not reported. Columns 1, 2,3,4,5 indicate interactions between bank
concentration and economic freedom, property rights governance, rule of law and banking freedom respectively.
However, economic freedom by itself is negative and significant. In the literature, a number
of economic freedom indicators have a positive and significant effect on growth. However,

65
this does not necessarily mean that improving economic freedom results in more growth. A
single measure of economic freedom might not represent the multifaceted nature of the
economic environment, while an aggregate measure makes it difficult to draw policy
conclusions. Based on a paper by Carlsson and Lundstrom (2002), different categories of
economic freedom have different effects on growth. For example, the effects of monetary
policy and price stability have an insignificant effect on growth; economic structure and the
use of markets have a weak effect of growth; while the size of government and the freedom
to trade with foreigners have a negative effect on growth. In other words, the use on an index
of economic freedom may be misleading.
To estimate the economic relevance of the interaction on industrialization, we calculate the
elasticities in the form of , the percentage change in y from a 1% change in x.
The effect on industrialization based on the coefficient of the interaction between bank
concentration and economic freedom is a positive 4.5337 percentage points. In other words,
the marginal effect of bank concentration on industrialization is positive as the level of
economic freedom is increased i.e. the marginal effect of bank concentration on
industrialization increases by 4.53 percentage points when economic freedom increases by 1
percent.
Economic freedom is a measure of institutional quality and the results suggest that increasing
the quality of institutions when measured as economic freedom would reduce the negative
effect of bank concentration on industrialization. Good institutions are likely to check the
activities of oligopolistic banks, thereby reducing their negative effects. Demirguc-Kunt and
Maksimovic (2004) and Ergungor (2004) support these results because they argue that the
positive effect of bank concentration is only possible in the presence of good institutions.
However, Fernandez et al. (2010) finds the interaction between bank concentration and
economic freedom to be negative and significant suggesting that improving the quality of
institutions would only worsen the effect of bank concentration on industrialization.
Property Rights (PROPRITE)
The Spearman correlation coefficient suggests a positive and significant relationship between
the effect of bank concentration on industrialization and the protection of property rights.
Also, in column 2, bank concentration by itself is negative and insignificant, while the
37
The standard error is (1.92207). The mfx command in Stata used to generate the elasticities of the interaction
term also provides its standard errors.
log / logy x

66
interaction term is positive and significant. The protection of property rights by itself is
negative and significant. While, both results suggest that stronger and effective protection of
property rights would reduce the negative effects of bank concentration on industrialization,
the negative significant coefficient of property rights by itself is not consistent with the other
results, and therefore difficult to explain.
Based on this result, one would think that stronger property rights would impede
industrialization. However, there are explanations that might support this result. For example,
Bose et al., (2012) argues that the relationship between property rights and growth is not
straightforward. They show that while the protection of property may be beneficial to the
growth prospects of countries, this is unlikely to happen in countries with weak banking
systems because the monitoring of borrowers become difficult and the positive impact of
increasing property right protection can become detrimental and reduce growth. They use a
simple rationale to suggest that while strong property rights are beneficial for growth; low-
quality loan applicants pursue other sources funds by presenting themselves as high-quality
applicants. Banks respond to this by increasing their screening technologies because the
average quality of a bank’s pool of borrowers has declined. As a result of this, loan rates
would be higher and the quantity of credit would be smaller in the market. In other words, for
countries to benefit from strong property rights, the level of banking development has to be
higher.
The effect on industrialization based on the coefficient of the interaction between bank
concentration and property rights is a positive 1.37 percentage points.38 In other words, the
marginal effect of bank concentration on industrialization is positive as the level of property
rights protection is increased i.e. the marginal effect of bank concentration on
industrialization increases by 1.37 percentage points when property right protection increases
by 1 percent. It is essential that lenders are able to recover collateral in case of borrower
failure. Beck et al. (2004) suggests that bank concentration can only have positive effects
with good property rights, while Fernandez et al. (2010) argues that bank concentration has
positive effects in the absence of strong property rights.
Governance (GOV)
The Spearman correlation coefficient suggests a positive and significant relationship between
the effects of bank concentration on industrialization. Also, in column, bank concentration by
38
The standard error is (0.79492).

67
itself as well as its interaction with governance is positive and significant, while governance
by itself is negative and significant.39 Khan (2008) argues that the implementation of good
governance reforms is unlikely to promote growth in developing countries because they
suffer from structural and fiscal constraints that impede the capabilities of good governance.
When he compares high-growth and low-growth developing countries, he finds to significant
difference in their level of good governance. In other words, growth in high-growth
developing countries was not triggered by good governance. The observations by Khan
suggest that developing countries that concentrate on good governance reforms to trigger
economic growth are unlikely to experience significant success. Also, he suggest that rather
than concentrating on improving good governance reforms, developing countries should
concentrate on alternative governance capabilities that would enable the tackle market
failures. It is therefore possible to suggest that improving governance in developing countries
could result in less growth because the reforms do not address market failures and poverty
reduction.
The effect on industrialization based on the coefficient of the interaction between bank
concentration and governance is a positive 0.37 percentage points.40 In other words, the
marginal effect of bank concentration on industrialization is positive as the quality of
governance increases i.e. the marginal effect of bank concentration on industrialization
increases by 0.37 percentage points when the quality of governance increases by 1 percent.
Governance is another measure of institutional. Similar to economic freedom, good
institutions softens the negative impact of bank concentration in industrialization. Again,
these results are in line with Beck et al. (2004) and Ergungor (2004). However, as a
robustness test to economic freedom, Fernandez et al. (2010) find that improving the quality
of governance could worsen the negative effect of bank concentration on industrialization.
Official Supervisory Power (OFFICIAL)
The correlation coefficients suggest an insignificant relationship between the effect of bank
concentration on industrialization and official supervisory power. In other words, official
supervisory power has no influence on how bank concentration affects industrialization. In
line with our findings, it has been argued in the literature that strict official supervision is
unimportant, particularly with respect to private monitoring. For example, Caprio et al.
39
In other words, the correlation coefficient suggest that good governance reduces the negative effect of bank
concentration on industrialization, while the interaction term suggest that good governance improves the
positive effect of bank concentration. 40
The standard error is (0. 12109).

68
(2007) suggest that official supervision has no significant effect on bank valuation. Fernandez
et al. (2010) also find that official supervisory powers have no significant effect on the
manner in which bank concentration affects economic growth.
While there seems to be no strong evidence in the literature that strict official supervision
ensures bank stability and development, the definition of what supervisory power includes
suggest that it should promote bank development and stability. One reason why strict official
supervision may not promote bank development and valuation is corrupt bank supervisors,
particularly in developing countries (Barth et al. 2013). It has also been suggested that if
monitoring skills are scarce and there are economies of scope in monitoring, then
concentrated banking markets are likely to promote monitoring (Beck et al. 2007).
Rule of Law
The Spearman correlation coefficient suggests a positive and significant relationship between
the effect of bank concentration on industrialization and the rule of law. Also, in column 4,
the effect of bank concentration by itself as well as its interaction with the rule of law index is
positive and significant, while rule of law by itself is negative and significant. While it is
difficult to explain the negative and significant coefficient of rule of law, the result proves
inconsistency in our results. The relationship between rule of law and economic growth
depends on the institutions that are required to enforce them, i.e. government and the courts.
In other words, weak enforcement of the rule of law by the government may impede
economic growth. Another element of rule of law is corruption. Corruption is mainly seen to
originate from politicians and bureaucrats, but typically, private agents are the beneficiaries
because they are involved in exchanges where corruption is involved. On an empirical note, it
has been found that the correlation of indicators of rule of law for developed countries is
higher than for developing countries suggesting some caution in making policy
recommendations from a large country sample. Also, aggregate indictors of rule of law make
better predictions than distinct components of rule of law (Haggard and Tiede, 2011). In other
words, some implications with reference to the importance of the rule of law, particularly in
developing countries, may be weak.

69
The effect on industrialization based on the coefficient of the interaction between bank
concentration and the rule of law is a positive 0.35 percentage points.41 In other words, the
marginal effect of bank concentration on industrialization is positive as the administration
and respect of the rule of law improves i.e. the marginal effect of bank concentration on
industrialization increases by 0.35 percentage points when the quality of rule of law increases
by 1 percent. These results suggest that the negative effect of bank concentration on
industrialization is reduced in the presence of an environment where the rule of law is
respected and effectively enforced.42 However, the negative and significant effect of rule of
law indicates the results are obviously not robust.
Foreign Bank Entry
Correlation coefficients are presented in Table 2.7, while the panel estimations are presented
in Table 2.8.
Private Monitoring (MONITOR)
The correlation coefficients suggest a positive and significant relationship between the effect
of foreign bank entry on industrialization and private monitoring. The result suggests that
effective private monitoring may improve the positive short-run effect of foreign bank entry
on industrialization, as well as encourage foreign bank entry (Dopico and Wilcox, 2001)
because it guarantees bank development and stability. However, for private monitoring of
banks to be effective, it is required that accounting systems and information disclosure
mechanisms are developed, as this provides investors with adequate information to make
investment decisions
Property Rights (PROPRITE)
The correlation coefficients suggest a positive significant relationship between the impact of
foreign bank entry on industrialization and the protection of property rights. However, in
column 1, the interaction term is insignificant. Based on correlation coefficients, effective
protection of property right may improve the positive impact of foreign bank entry on
industrialization. According to Demiurguc-Kunt et al. (2004), countries that restrict the entry
of foreign banks are normally associated with weak protection of property rights. In other
words, weak protection of property rights could mitigate the positive effects of foreign banks
in developing countries. Also, a study on Mexico by Haber and Musacchio (2005) argue that
41
The standard error is (0. .10507). 42
However, the interaction term suggest that the positive effect of bank concentration on industrialization is
improved in the presence of effectively enforced rule of law.

70
Table 2.7: Correlation between Short-Run PMG Coefficients and Measures of Institutional Quality
(Foreign Bank Entry)
PEARSON SPEARMAN
VARIABLES FBANK FBANK
BANKENTRY -0.1224 -0.1368
MONITOR 0.3257*
0.4308***
PROPRITE 0.4990***
0.4198**
ACCOUNT 0.1846 -0.0966
GOV 0.3926**
0.4266**
LAWORDER 0.2350 0.1075
OFFICIAL 0.1253 -0.1684
RL 0.3085*
0.4000**
CORRUPT 0.1860 0.1630
CC 3124*
0.3424*
GOODGOV 0.2837 0.2631
RQ 0.4730***
0.4325***
Table 2.8: Foreign Bank Ownership and it’s interaction with measures of Institutional Quality
1 2 3 4 5
Variables MVAGR MVAGR MVAGR MVAGR MVAGR
BCON 0.119*** 0.125*** 0.122*** 0.119*** 0.116***
(0.0327) (0.0332) (0.0334) (0.0326) (0.0329)
FBANK -0.0659 -0.0532* -0.0478 -0.0543* -0.0702***
(0.0592) (0.0290) (0.0306) (0.0289) (0.0282)
FBANK×PROPRITE 0.00013
(0.0011)
FBANK×GOV 0.0850*
(0.0460)
FBANK×RL 0.0601
(0.0402)
FBANK×CC 0.0667*
(0.0358)
FBANK×RQ 0.0804*
(0.0459)
GBANK -0.0733* -0.0874** -0.0784* -0.0899** 0.0933**
(0.0439) (0.0448) (0.0442) (0.0447) (0.0454)
BNKDEV -0.0309 -0.0434 -0.0389 -0.0355 -0.0248
(0.0157) (0.0507) (0.0515) (0.0497) (0.0493)
GDPGR (-1) 0.412*** 0.396*** 0.399*** 0.389*** 0.407***
(0.138) (0.137) (0.138) (0.137) (0.138)
EXPGDPGR 0.106*** 0.111*** 0.108*** 0.108*** 0.112***
(0.0343) (0.0343) (0.0341) (0.0341) (0.0343)
IMPGDPGR -0.0503** -0.0554** -0.0539** -0.0576** -0.0542**
(0.0242) (0.0242) (0.0243) (0.0242) (0.0242)
INF -0.157*** -0.161*** -0.157*** -0.150*** -0.155***
(0.0443) (0.0444) (0.0441) (0.0446) (0.0442)
PROPRITE -0.0440**
(0.0513)
GOV -3.938
(2.956)
RL -1.615
(2.445)
CC 0.128
(2.078)
RQ -3.153*
(2.013)
CONS. 5.473 3.773 3.813 4.678 4.104
(4.756) (3.799) (3.767) (3.799) (3.769)
No of Obs. 372 372 372 372 372
R2 within 0.231 0.237 0.233 0.240 0.237
R2 between 0.005 0.000 0.009 0.023 0.000
F-Test 4.56 4.73 4.64 4.80 4.72
Note: The standard errors are reported in parenthesis and *,**,*** indicate significance at the 10%, 5%, and 1% level
respectively. Period dummies are included but not reported. Columns 1, 2,3,4,5 indicate interactions between foreign
bank entry and property rights, governance, rule of law, control of corruption, and regulatory quality respectively.

71
the impact of foreign bank lending to the private sector depends on the enforcement of
property rights, for improved financial intermediation. Therefore, we would expect that the
enforcement of good property rights would improve foreign bank performance with regards
to industrialization in developing countries. However, based on the insignificant interaction
term in the panel estimation, there is no consistency in our results.
Governance (GOV)
The correlation coefficients suggest a positive and significant relationship between the impact
of foreign bank entry on industrialization and governance. Also, in column 2, foreign bank
entry by itself remains negative but insignificant while its interaction with governance is
positive and significant. By itself, governance has a negative and insignificant effect on
industrialization. Based on the correlation coefficient, good governance may improve the
short-run positive impact of foreign bank entry, while the interaction term suggests that it
may soften the negative impact of foreign bank entry on industrialization. The effect on
industrialization based on the coefficient of the interaction between foreign bank entry and
governance is a positive 0.08 percentage points.43 In other words, the marginal effect of
foreign bank entry on industrialization improves as the quality of governance increases i.e.
the marginal effect of foreign bank entry on industrialization increases by 0.08 percentage
points when the quality of governance increases by 1 percent. In other words, these results
suggest that foreign banks would perform better in the presence of good quality of
institutions. Levine (1996), Andrainova et al. (2008), and Lensink et al. (2008) all suggest
that a country would only reap the benefits of foreign banks entry with the institutional
environment is strong. As is also evident in the literature, foreign banks could also press for
further improvements in institutional quality in developing countries. Previously, it has been
argued that the negative or insignificant effect of foreign bank entry in developing countries
may be related to weak institutional capacity. These results seem to be consistent with the
literature.
Official Supervisory Power (OFFICIAL)
The correlation coefficients suggest an insignificant relationship between the effect of foreign
bank entry on industrialization and official bank supervision. In other words, official bank
supervision has no effect on how foreign bank entry impacts industrialization. The neo-liberal
view argues that official supervision should have an insignificant or even negative significant
impact on bank development, valuation and stability. It has also been suggested that, while it
43
The standard error is (0. 03965).

72
might positively affect bank development and stability, this effect is less when compared to
private monitoring by the market. However, Levine (1996) suggests that the possibility of
benefitting from the entry of foreign banks is crucially dependent on the existence of an
adequate supervisory and regulatory system which ensures safety, soundness and
transparency of the financial system. For weak financial systems, official supervision might
prevent foreign banks from taking undue advantage of the loopholes in the financial system.
After all, Clarke et al. (2005) suggest that a scenario is possible when foreign banks can take
full advantage of regulatory and judicial lacunae. Therefore, our results are supported by one
aspect of the literature where official supervision is seen to have little or no effect on how
foreign banks entry affect the economy of developing countries.
Rule of Law (RL)
The correlation coefficients suggest a positive and significant relationship between the effect
of foreign bank entry on industrialization and the rule of law. However, in column 3, the
interaction term is insignificant. It has been argued that foreign banks in developing countries
cannot be effective under an environment where the rule of law is weak, prompting the
importance of an effective rule of law regime. However, the fact that our interaction term is
insignificant suggests an inconsistency with the correlation coefficient. Based on the
correlation coefficient, respected and well-enforced rule of law improves the short-run
positive impact of foreign bank entry on industrialization.
Control of Corruption (CC)
The correlation coefficients suggest a positive and significant relationship between the impact
of foreign bank entry on industrialization and the control of corruption. Also, in column 4, the
interaction term is positive and significant. Based on the results, the correlation coefficient
suggests that an effective control of corruption may improve the short-run positive effect of
foreign banks, while the interaction terms suggests that it may soften the negative impact of
foreign banks on industrialization. The effect on industrialization based on the coefficient of
the interaction between foreign bank entry and the control of corruption is a positive 0.07
percentage points.44 In other words, the marginal effect of foreign bank entry on
industrialization increases as the control of corruption improves i.e. the marginal effect of
foreign bank entry on industrialization increases by 0.07 percentage points when the control
of corruption increases by 1 percent. Foreign banks will perform when the level of corruption
is low. Reducing corruption is one way of promoting financial development. Eliminating
corruption is also vital for strengthening property rights and the legal system. When bribes
44
The standard error is (0. 03933).

73
are demanded by public officials, they reduce the incentive for entrepreneurs to make
investments. The ability to buy off judges weakens enforcement of legal contracts that enable
the financial system to operate smoothly and promote foreign bank entry. Also, the level of
corruption may fall as a result of foreign bank entry (de Haas and van Lelyveld, 2006). This
is one case where our results are consistent.
Regulatory Quality (RQ)
The correlation coefficients suggest a positive and significant relationship between the effect
of foreign bank entry on industrialization and regulatory quality. Also, in column 5 of, the
effect of bank concentration by itself remains negative and significant while its interaction
term is positive and significant. The effect of regulatory quality by itself is negative and
significant. In developing countries, industrialization will benefit from foreign bank entry
when government is adequately able to develop and implement robust policies. The
correlation coefficient suggests that strengthening the quality of regulation improves the
short-run positive impact of foreign bank entry on industrialization, while the interaction term
suggests that it softens the negative effect of foreign bank entry on industrialization.
However, the negative significant coefficient of the regulatory variable questions the
consistency of the results. The effect on industrialization based on the coefficient of the
interaction between foreign bank entry and regulatory quality is a positive 0.02 percentage
points.45 In other words, the marginal effect of foreign bank entry on industrialization
increases as regulatory quality improves i.e. the marginal effect of foreign bank entry on
industrialization increases by 0.02 percentage points when regulatory quality increases by 1
percent. It is therefore expected that with good quality of regulations, foreign banks would
perform better in developing countries. However, the negative and significant effect of
regulatory quality by itself on industrialization is not consistent with our other results.
State Ownership of Banks
Correlation coefficients are presented in Table 2.9, while the panel estimations are presented
in Table 2.10.
Economic Freedom (ECONFREE)
The Spearman correlation coefficient suggests a positive and significant relationship between
the short-run effect of state ownership of banks on industrialization and the degree of
economic freedom. In column 1, the interaction term is insignificant. The correlation
coefficient suggests that when the fundamental right of individuals in developing countries to
45
The standard error is (0. 0105).

74
control their labour and property increases, this may improve the short-run positive effect of
state ownership of banks on industrialization. The World Bank is a proponent of economic
freedom and suggests that state ownership of banks may give positive results under this
condition. It is therefore expected that good institutional quality will improve the effect of
state banks on industrialization. However, the interaction term in our panel estimations
suggest an inconsistency in the results.
Private Monitoring (MONITOR)
The Spearman correlation coefficient suggests a positive relationship between the impact of
state banks on industrialization and private monitoring. This result suggests that effective
private monitoring of banks may improve the positive short-run impact of state banks on
industrialization. It has been suggested in the literature that private monitoring is more
effective in promoting bank development and stability than official supervision. However,
while the World Bank agrees that private monitoring is relevant, it does not undermine the
importance of official supervision and even argues that state banks may produce more
positive results in the presence of official supervision. In other words, weak official
supervision could jeopardize or even make worse the effect of state banks on economic
growth in the presence of effective private monitoring. Barth et al. (2004) suggest that state
ownership of banks is negatively associated with private monitoring. While we do not
criticize this conclusion, we suggest that this is likely to occur when state banks negatively
affect economic growth. When the effect of state banks is positive, improving private
monitoring would only ensure that state banks further improve their operations by requiring
them to disclose reliable and comprehensive information in a timely manner, resulting in
even less corruption in lending. Therefore, our results suggest that, the positive impact of
government banks on industrialization is improved in the presence of increased private
monitoring.
Table 2.9: Corr. between Short-Run PMG Coefficients and Inst. Quality (State Banks)
PEARSON SPEARMAN
VARIABLES GBANK GBANK
BANKENTRY 0.0750 -0.0451
ECONFREE 0.2854 0.4532***
MONITOR 0.1797 0.3743***
PROPRITE 0.2635 0.3560***
ACCOUNT 0.1937 0.2160
GOV 0.3901***
0.4727***
LAWORDER 0.2392 0.0404
OFFICIAL 0.2105 -0.0158
RL 0.4239***
0.5256***
CORRUPT 0.3128*
0.2153
CC 0.3638**
0.4695***
GOODGOV 0.3656**
0.1532
PV 0.3449**
0.3783**
GE 0.5275***
0.4192**

75
Table 2.10: Government Ownership of Bank and it’s interaction with measures of
Institutional Quality 1 2 3 4 5 6 7
Variables MVAGR MVAGR MVAGR MVAGR MVAGR MVAGR MVAGR
BCON 0.123*** 0.119*** 0.124*** 0.120*** 0.117*** 0.132*** 0.118***
(0.0331) (0.0328) (0.0333) (0.0334) (0.0323) (0.0326) (0.0327)
FBANK -0.0667** -0.0589** -0.0738*** -0.0671*** -0.0696*** -0.0847*** -0.626***
(0.0283) (0.0289) (0.0279) (0.0285) (0.0285) (0.0289) (0.0286)
GBANK -0.168 -0.100 -0.0497* -0.0664 -0.0669 -0.0406 -0.0571
(0.242) (0.102) (0.0462) (0.0457) (0.0451) (0.0447) (0.0456)
GBANK×ECONFREE 0.0016
(0.0041)
GBANK×PROPRITE 0.001
(0.002)
GBANK×GOV 0.0907
(0.0641)
GBANK×RL 0.0207
(0.0553)
GBANK×CC 0.0257
(0.0506)
GBANK×PV 0.0692*
(0.0409)
GBANK×GE 0.0601
(0.0579)
BNKDEV -0.0174 -0.0294 -0.0257 -0.0196 -0.0234 -0.0545 -0.0216
(0.0502) (0.0500) (0.0498) (0.0502) (0.0494) (0.0502) (0.0499)
GDPGR (-1) 0.421*** 0.409*** 0.413*** 0.421*** 0.399*** 0.414*** 0.413***
(0.137) (0.138) (0.137) (0.139) (0.139) (0.137) (0.137)
EXPGDPGR 0.109*** 0.106*** 0.110*** 0.108*** 0.105*** 0.113*** 0.109***
(0.0344) (0.0342) (0.0343) (0.0343) (0.0449) (0.0339) (0.0341)
IMPGDPGR -0.0527** -0.0509** -0.0516** -0.0514** -0.0526** -0.0498** -0.0515**
(0.0244) (0.0243) (0.0242) (0.0243) (0.0242) (0.0239) (0.0241)
INF -0.160*** -0.157*** -0.160*** -0.158*** -0.148*** -0.170*** -0.152***
(0.0445) (0.0443) (0.0444) (0.0443) (0.0449) (0.0440) (0.0445)
ECONFREE -0.0229
(0.209)
PROPRITE -0.0549
(0.0243)
GOV -4.128
(3.259)
RL -0.429
(2.788)
CC 1.259
(2.506)
PV -4.289***
(1.521)
GE 0.588
(2.976)
CONS. 4.131 5.911 2.582 2.959 4.011 2.959 2.891
(11.129) (4.907) (3.775) (3.788) (3.806) (3.746) (3.783)
No of Obs. 372 372 372 372 372 372 372
R2 within 0.229 0.231 0.233 0.220 0.232 0.247 0.234
R2 between 0.002 0.003 0.002 0.005 0.001 0.000 0.008
F-Test 4.52 4.57 4.64 4.51 4.61 5.01 4.66
Note: The standard errors are reported in parenthesis and *,**,*** indicate significance at the 10%, 5%, and 1% level
respectively. Period dummies are included but not reported. Columns 1, 2,3,4,5 indicate interactions between government
ownership of banks and economic freedom, property rights governance, rule of law, control of corruption, political stability
and government effectiveness respectively.
Property Rights (PROPERTY RIGHTS)
The Spearman correlation suggests a positive significant relationship between the effect of
state owned banks on industrialization and the protection of property rights. In column 2, the
interaction term is insignificant. La Porta et al. (2002) suggest that the negative effects of
state banks on productivity, growth and financial development are made worse where the
protection of property rights are weak. Although, they do not suggest that government banks

76
in anyway have any positive effect on the economy, their propositions suggest that stronger
protection of property rights can in some way improve the effect of state banks on economic
growth. This provides support for our result by suggesting that better enforced property rights
may improve the short-run positive effect of state banks on industrialization. However, the
insignificant interaction term in the panel estimation suggest that the results are inconsistent.
Governance (GOV)
The correlation coefficients suggest a positive and significant relationship between the effect
of state banks on industrialization and the quality of governance. In column 3, the interaction
term is insignificant. This result suggest that an improvement in the ability of governments to
develop and apply sound policies, as well as improving the administration of relationships
with private citizens is likely to improve the short-run positive effect of state banks on
industrialization. The World Bank (2001) is one reference in the literature that has supported
this view. However, the insignificant interaction term in the panel estimation suggests
inconsistency in the results.
Official Supervisory Power (OFFICIAL)
The correlation coefficients suggest an insignificant relationship between the effect of state
banks on industrialization and official supervisory power. Barth et al. (2004) specifically
suggest that the degree of state ownership of banks is positively associated with supervisory
practices.46 Also, Caprio et al. (2007) and Fernandez et al. (2010) emphasize the insignificant
effect of official supervisory power on bank valuation and bank concentration. However, it
has been argued that, where state banks have a negative effect on economic growth, official
supervision is expected to be weaker. And to make reference to the World Bank again, they
suggest that improving official supervision may facilitate positive results through state banks.
The intuition from this results and the literature is that official supervision may only be
beneficial for industrialization when effect of state banks is negative. However, when the
effect of state banks on industrialization is positive, official supervision might only be
required to maintain market discipline. The correlation coefficient may simply be suggesting
that official supervision has no further influence on the mechanism through which state banks
affect industrialization when the effect is positive. While not evident in our result, official
supervisory powers may have a negative effect on this relationship if supervisors are corrupt.
46
This positive relationship is assumed to further worsen the negative relationship of government ownership of
banks with bank sector development, efficiency and stability.

77
Rule of Law (RL)
The correlation coefficient suggests a positive and significant relationship between the effect
of state banks on industrialization and the rule of law. In column 4, interaction term is
insignificant. According to La Porta et al. (2002), one factor responsible for the negative
effect of government ownership of banks is when the respect rule of society by economic
agents is low. Put differently, when the rule of law is respected and effectively enforced,
government banks become more important for growth. In line with this intuition, the
correlation coefficient suggests that improving the rule of law index may improve the short-
run positive effect of state owned banks on industrialization. However, the insignificant term
in our panel estimation suggest inconsistency in the results.
Degree of Corruption (CORRUPT)
The Pearson correlation coefficient suggests a positive and significant relationship between
the effect of state banks on industrialization and the degree of corruption. In the literature, it
has been argued that in countries with high levels of corruption, the performance of
government owned banks is typically worse than that of private banks (Sapienza, 2004; Dinc,
2005; Micco et al. 2007; and Shen and Lin, 2012). It is therefore possible that the poor
performance of government banks in both developing countries may be as a result to high
levels of corruption. Our results seem to indicate that higher corruption levels may improve
the short-run positive effect of government banks industrialization. This result is dubious.
Normally, we would expect lower levels of corruption to improve the performance of
government banks. However, it could be supported with the argument that corrupt behavior
can positively influence an economy, by replacing bad governance. In other words, attacking
corruption in countries with poor governance, could damage the informal economy (Houston,
2007).
Control of Corruption (CC)
The correlation coefficients suggest a positive and significant relationship between the effect
of state banks on industrialization and the control of corruption. In column 5, the interaction
term is insignificant. These results are not suggesting that government banks are unaffected
by corruption but in countries where politicians are answerable to the voters, corrupt
government bank officials can’t get away with a lot because the cost of corruption is political
costly in these countries. So, the correlation coefficient would suggest that stronger control of
corruption may improve the short-run positive effect of state banks on industrialization. The
insignificance of the interaction term in our panel estimation makes the results inconsistent.

78
Good Governance (GOODGOV)
The Pearson correlation coefficient suggests a positive and significant relationship between
the effect of state banks on industrialization and an index of good governance. Inadequate
governance has contributed to discredit the role of state banks in supporting the development
of the domestic financial system. It has been argued that good corporate governance is
equally important for state owned banks as it is for private banks. Most of the poor
performance by state owned banks is associated with a lack of clear mandate, and a
governance system that allows the presence of weak board of directors and management,
which are subject to political intervention (Rudolph, 2009). Caprio et al. (2004), La Port et al.
(2002) and Dinc (2005) provide evidence that show that state owned banks around the world
that are characterized by poor managerial skills that are subject to government intervention in
lending decisions. Therefore, the result suggests that good governance may improve the
positive effect of state banks on industrialization.
Political Stability (PV)
The correlation coefficients suggest a positive and significant relationship between the effect
of state banks on industrialization and the level of political stability. In column 6, the
interaction term is positive and significant, while political stability by itself is negative and
significant. La Porta et al. (2002) provides some weak evidence that government ownership
of banks is associated with political instability. They suggest that government ownership of
banks may cause instability through political lending, or it may occur as a result of
nationalizations. However, they don’t examine the effect of political instability on
government ownership of banks. If any category of bank is to withstand the negative effects
of political instability, it would be government owned banks. Private Banks may be unwilling
to lend during period of uncertainties, leaving government owned banks to be overburdened
with rising amount of loans. So, while state owned banks may be able to withstand some of
the effects of political instability, it may become less efficient in lending. Therefore, our
result suggests that political stability improves the effect of state banks on industrialization.
However, the significant negative effect of the political stability index makes our results
inconsistent.
Government Effectiveness
The correlation coefficients show a positive and significant relationship between the effect of
state banks on industrialization and an index of government effectiveness. In column 7, the
interaction term is insignificant. Government effectiveness is an indicator that has also been
used to measure good governance. The relationship between state bank lending and good

79
governance might have two positions. According to Bertay et al. (2012), state bank lending is
seen to be less procyclical than private bank lending, particularly in countries where the level
of governance is good. Also, state bank lending is even seen to be countercyclical in high
income countries. However, these results are based on lending data during a financial crisis.
The second position is that government bank lending is improved in the presence of good
governance. In other words, irrespective of what the level of governance is, the effect of state
banks on industrialization is not affected. Our results, therefore, suggest that the government
effectiveness improves the positive effect of government banks on industrialization.
However, the insignificant interaction term in the panel estimation are inconsistent makes our
result inconsistent.
2.5. CONCLUSION
Using a sample of 31 developing countries between 1995 and 2007, this chapter examines the
role of bank market structure on industrialization. It also examines how the effect of bank
market structure on industrialization varies across countries as a result of institutions, bank
regulation and supervision. The long-run results indicate that bank concentration promotes
industrialization, while foreign bank entry and state owned banks slow down the pace of
industrialization in developing countries. However, the process through which bank market
structure affects industrialization can be influenced by the nature of the legal environment
and the quality of institutions.
Our results on the effect of bank market structure on industrialization contradict what is
perceived in the literature. For example, banks with market power can finance
industrialization as opposed to policies that promote competition in the banking market
because their ability to adequate profits enables them to lend to lend to small firms and long-
term capital projects. Our results on foreign ownership of banks are equally not in line with
what the literature suggests. Foreign bank entry reduces overall volume of credit available for
lending in the market as opposed to promoting financial development and economic growth.
Small and informationally opaque firms are the most likely to suffer as a result of foreign
bank entry because foreign banks in developing countries its lending is “cream-skimmed”
benefitting mainly large and transparent firms. The entry of foreign banks may slow down the
rate on industrialization because small and informationally-opaque firms become more credit
constrained.47Our result for state ownership of banks is negative and seems to be consistent
47
Small and informationally-opaque firms make up the bulk of manufacturing firms in developing countries, so
if foreign bank entry makes them credit-constrained, industrialization would be negatively affected.

80
with the literature. However, since state ownership of banks may be an outcome of weak
institutional quality or market failures, the interpretation that state ownership of banks is bad
for economic growth might be misleading. The presence of state banks is to improve or
soften an already bad situation. Even if we assume that state banks have a positive effect on
industrialization, this effect might not be enough to completely offset the negative effect of
market failures or low institutional quality, resulting in a negative coefficient.
The policy implications for our findings so far are as follows: first of all, competitively-
driven large banks with market power and so high concentration promotes industrialization;
second, foreign banks should be a concern for policy makers in developing countries because
of their lending approach, which makes a large number of manufacturing firms credit-
constrained, resulting in a negative effect on industrialization; finally, rather than implement
policies that promote the privatization of state banks, policy makers should be more
concerned with creating an environment where market failures are minimal and developing
capacities to improve institutional quality.
We draw your attention to the fact the each bank market structure has an opposite effect on
industrialization in the long-and short-run. We try to reconcile long-and short-run results for
each bank market structure in section 2.4.2.3. A recap of the short-run results suggests that
bank concentration has a negative impact on industrialization, while foreign bank entry and
state ownership of banks positively influence industrialization. The negative short-run effect
of bank concentration can be linked to its oligopolistic nature where it negatively affects the
economy through the credit market by reducing the total amount of loanable funds available
to firms. On the other hand, the positive short-run effect of foreign banks entry is linked to
the fact that it has the capacity to promote financial development and spur economic growth
in developing countries. The argument in favour of the positive short-run effects of state
ownership of banks on the economy is that state banks can certainly be seen as a response to
institutional deficiency. At extremely low levels of institutional quality, government could
use state banks to revive financial and economic development.
We go further by examining the short-run relationships between bank market structure on
industrialization and institutions, bank regulation and supervision. For robustness, we also
explore this relationship in a panel data setting using interaction terms. For example in Table
2.5, the correlation coefficients suggest that good institutions soften the negative effects of
bank concentration on industrialization. However, these results are weakly robust and not
consistent because only about 30 percent of the relationships are significant. The interaction

81
terms in the panel estimation suggest that good institutions improve the positive effect of
bank concentration on industrialization. However, in four of the estimations in Table 2.6,
effect of good institutions by itself on industrialization is negative and significant. It is
difficult to reconcile the positive interaction terms and the negative institutional effects in the
panel estimation. In other words, the results suffer from weak robustness and inconsistency.
In Table 2.7, the correlation coefficients suggest that good institutions improve the positive
effects of foreign banks on industrialization. The level of consistency and robustness is better
than that of bank concentration but only about 50 percent of the relationships are significant.
The interaction terms in the panel estimations of Table 2.8 equally suggests that good
institutions improve the positive influence of foreign banks on industrialization. However,
only three of these estimations have significant interaction terms and the problem of negative
significant institutional variables exist.48 Similar to results in bank concentration, we are
unable to reconcile these results, and are therefore classify them as weakly robust and
inconsistent.
Finally, in Table 2.9, the correlation coefficients suggest that good institutions improve the
positive effect of state banks on industrialization. Compared to the other two banking market
structures we have considered, the results show stronger consistency, although over 40
percent of the relationships are insignificant. However, in Table 2.10, of the seven
estimations, only one has a significant interaction term49 but it equally suffers from a negative
significant institutional indicator. While the correlation coefficients seem to be fairly
consistent, the panel estimations suffer from lack of robustness. Results are equally difficult
to reconcile.
In general, while these results suggest good institutions improve the positive effect of bank
market structure on industrialization (or reduce the negative effects), it also suggest that good
institutions have a negative effect on industrialization. How is it possible for good institutions
to improve how bank market structure affects industrialization when, considered on their
own, they have either a negative effect or no effect at all? The inconsistencies and lack of
robustness of good institutions is the most important aspect of our study. The chapter finds
that the evidence in support of so-called ‘good institutions’ to economic development is not
robust. While this finding is not novel, similar contributions are still relatively rear.
Moreover, the particular investigation of this chapter – which relates institutional quality to
48
Only one of the estimations seems to be consistent, control of corruption in column 4 because the institutional
indicator is insignificant. 49
Political stability in column 6.

82
bank market structure and industrialization, is novel. In other words, the combination of the
approach and the ensuing econometric results constitute a useful addition to the literature.
There is some evidence in the literature to suggest that institutions matter for growth and
development, but according to Aron (2000), the process of integrating institutions and
institutional change into economic theory is still relatively new. Therefore, channels through
which institutions affect development is still not well or fully understood (Jutting, 2003). In
other words, according to Helpman (2004), more research on the channels through which
institutions affect development and the relationship between institutions is required.
However, large cross-country studies that are evident in the literature might not be the most
appropriate way to examine mechanisms and processes that lead to development (Bardhan,
2005).
In the recent literature, some cracks have begun to appear on the importance of good
institutions for development. For example, Khan (2008) does not find any significant
difference in the scores of good governance when he compares high-and low-growth
developing countries. Also, Angeles (2011) argues that property rights may not be as
important for development as many studies claim it to be. Finally, Bhaumik and Dimova
(2013) criticize the classification of institutions into ‘good or bad’ by suggesting that a ‘bad’
institution like the protection of employee rights which is seen to have a negative impact on
macro variables may well improve production efficiency when firm-level data is used. On the
other hand, they show that a ‘good’ institution like a better business environment which may
be good for macro variables, may actually hurt the production efficiency of firms.
The inconsistencies in our results suggest that the ‘good institutional’ approach to policy
reform is wrong: good institutions are certainly beneficial but they should not be policy
priorities.
This study is not without drawbacks. A key drawback is that time series are not available for
some of the most important institutional variables that have been widely used in the literature,
particularly variables on regulation and supervision in the banking system. Also, a possible
drawback of the analysis is that it is cross-country. The ‘good-institution’ approach to
economic development is largely based on cross-country studies and the associated problems
are that institutional quality is not well-defined and measured and the heterogeneity across
country-samples is not seriously considered when estimating empirically. Also, since there is
an argument that studies on institutions should not be cross country because there are no

83
optimal institutions and the same function can be performed by different institutions. The
literature has argued that the problems associated with financial liberalization policies in
many developing countries can be linked to weak institutions and poor bank regulation and
supervision. Further research on how good institutions affect financial liberalization policies
which shape up the banking market would improve this study by providing deeper insight.
For example, through more times-series studies on institutions and economic development.

84
APPENDIX
Appendix 2.1: List of Countries and Bank Market Structure
country BCON FANK GBANK
Argentina 37.84994 34.46154 33.09231
Bolivia 56.22365 29.61539 21.5
Brazil 44.11658 18.38461 48.34615
Cameroon 74.27174 77.53846 41.16154
Chile 49.58051 26 12.89231
China 74.15365 0.976923 88.01539
Colombia 39.68378 18.15385 17.64692
Costa-Rica 65.82275 21 67.95308
Ecuador 68.07567 7.076923 17.58077
Egypt 57.0677 8.692307 64.83231
Ethiopia 87.66412 0.246154 72.30385
India 34.62122 3.703077 81.58462
Indonesia 51.77898 14.53846 41.59077
Iran 87.4584 0.0000 100.00
Jordan 87.13157 4.086538 14.83077
Kenya 57.36552 38.23077 1.138077
Korea Republic 40.36131 10.90769 30.10923
Malawi 90.70892 23.84615 30.07846
Malaysia 43.22022 16.30769 1.542308
Mauritius 80.23518 42.69231 1.542308
Mexico 62.28733 48.76923 0.813231
Morocco 62.44783 16.69231 29.06615
Pakistan 56.12247 14.53846 43.84615
Peru 67.79322 77.15385 6.818461
Philippines 70.95197 6.846154 12.80385
Senegal 70.88318 71.38461 0.813231
South Africa 85.20609 5 1.138077
Tanzania 58.73573 75.53846 26.77461
Thailand 48.18151 6.076923 25.87231
Tunisia 46.55404 15.07692 52.43462
Uruguay 53.66583 47.84615 44.79923

85
Appendix 2.2: Summary Table for Institutional Variables
INSTITUTIONAL INDICATORS BCON FBANK GBANK
Entry into banking requirements index*
Regulatory restrictions on activities and ownership*
Regulatory restrictions on ownership*
Economic freedom index
Private monitoring index*
Accounting and information disclosure *
Property rights index
Quality of institutions index
Law and order index*
Official supervisory power*
Banking freedom index
Rule of law index
Degree of corruption index*
Control of corruption index
Good governance index*
Regulatory quality index
Political stability index
Effectiveness of government index
* indicates institutional indicators without time variation or are available an average over a selected time period.
Appendix 2.3: Hausmann Test of no difference between Mean Group and Pooled Mean Group Estimates:
Variables (b) Mean Group
(B) Pooled Mean Group
(b-B) Difference
sqrt(diag(V_b-V_B) S.E.
BCON -0.020 0.042 0.062 0.193
FBANK 0.216 -0.051 0.267 0.281
GBANK 0.530 -0.048 0.578 0.320
BNKDEV 1.295 0.112 1.183 0.782
GDPGR 0.540 0.124 0.416 1.800
TRADE 1.295 0.127 1.168 0.556
HUMCAP 2.977 0.916 2.061 2.798
b = consistent under Ho and Ha; obtained from xtpmg B = inconsistent under Ha, efficient under Ho; obtained from xtpmg
Test: Ho: difference in coefficients no systematic chi2(1) = (b-B)’[(V_b-V_B)^(-1)](b-B)
= 0.26 Prob>chi2= 0.3834
(V_b-V_B is not positive definite)

86
Appendix 2.4: Panel unit root for all variables in the regression, 1995-2007.
Im et al. (2003) Pesaran (2003)
Variables Statistics P-values Statistics P-values
MVAGR -2.883 0.000 -1.818 0.009
BCON -3.009 0.000 -1.899 0.018
FBANK -3.448 0.000 -2.327 0.000
GBANK -2.797 0.000 -1.799 0.034
BNKDEV -2.364 0.000 -2.167 0.011
GDPGR -3.341 0.000 -2.034 0.055
TRADE -2.778 0.000 -2.474 0.000
HUMCAP -3.363 0.000 -2.258 0.000
Notes: We used the ‘xtunitroot ips’ command in stata for the first generation unit root test and the ‘pescadf’ command in stata for the second generation unit root test.
Appendix 2.5: Panel cointegration test results, 1995-2007 (Persyn and Westerlund, 2008).
BCON FBANK GBANK
Test Value P-value Test Value P-value Test Value P-value
Gt
-16.279 0.000 Gt
-15.636 0.000 Gt
-8.121 0.000
Ga
-19.318 0.000 Ga
-9.532 0.008 Ga
-11.031 0.000
Pt -23.463 0.000 Pt -28.606 0.000 Pt -17.189 0.000
Pa
-21.913 0.000 Pa
-12.525 0.000 Pa
-9.185 0.000
BNKDEV GDPGR TRADE
Test Value P-value Test Value P-value Test Value P-value
Gt
-47.863 0.000 Gt
-38.926 0.000 Gt
-6.380 0.000
Ga
-11.076 0.000 Ga
-11.539 0.000 Ga
-11.191 0.000
Pt -17.385 0.000 Pt -25.062 0.000 Pt -15.757 0.000
Pa
-8.566 0.000 Pa
-10.553 0.000 Pa
-10.461 0.000
HUMCAP
Test Value P-value
Gt
-6.995 0.000
Ga
-13.202 0.000
Pt -20.734 0.000
Pa
-14.962 0.000
Notes: We use the ‘xtwest’ command from stata to show the outcomes of the cointegration tests between industrialization and the independent variables. The Westerlund (2007) tests are implemented with MVAGR as the dependent variable. The test regression is fitted with a constant, the first to second lag, and 0 to the third lead. The Kernel bandwidth is set according to the rule 4(T/100)
2/9.The P-values are for one-sided test based on the normal distribution. The Gt
and test statistics test the null hypothesis of no cointegration for all cross-sectional units against the alternative that there is cointegration for at least one cross-sectional unit. Rejection of the null should therefore be taken as evidence of cointegration in at least one cross-sectional unit. The Pt and Pa test statistics pool information over all the cross-sectional units to test the null of no cointegration for all cross-sectional units against the alternative of cointegration for all cross-sectional units. Rejection of the null should therefore be taken as evidence of cointegration for the panel as a whole.
Appendix 2.6: Variable Description
GDP GROWTH
The GDP growth GDPGR is measured as the growth in real GDP. GDP growth proxies for economic
performance as well as market demand growth. Early studies on economic development suggest that
economic growth is associated with a structural transformation of the economy from agricultural and
primary production to manufacturing (Clark, 1983; Kuznets, 1966). Syrquin and Chenery (1989) also
associate industrialization with a distinct pace of economic growth. It has been established during
periods of significant economic growth, the size of the domestic market increases, subsequently

87
leading to an increase in the demand for goods and services, firms would earn more profit and create
an influx into the industry and generally have spillover effect on the manufacturing sector. Sustained
economic growth also ensures that the manufacturing sector growth is sustained. Other factors of
economic growth that could benefit industrialization include macroeconomic stability and the
provision of adequate infrastructural facilities.
TRADE
International trade or trade openness TRADE is measured as the ratio of the sum of export and import
to GDP. The theoretical literature suggests that under the right environment, trade openness can have
a positive effect on industrialization through technology spillovers, and R&D (Rivera-Batiz and
Romer, 1991a, b; and Romer, 1990), and Coe et al., (1997) have provided empirical evidence for this.
Further empirical evidence on the positive relationship between trade openness and industrialization
include Dodzin and Vamvakidis (1999); Dollar (1992); Sachs and Warner (1995); Edwards (1998),
and Frankel and Romer (1999). It has also been argued that trade openness reallocates productivity
from agriculture to manufacturing in developing countries (Dodzin and Vamvakidis, 2004). However,
there have been studies which criticize the positive relation between trade openness and
industrialization. For example, Edwards (1993) and Rodriguez and Rodrik (1999) have criticized
empirical studies which find a positive relationship between trade openness and industrialization.
Their criticisms are based on the grounds of estimation techniques, endogeneity and measurement
errors, vague measures of trade openness, and poor proxies for trade restrictions. Another strand of
the literature suggest that trade openness may have a negative effect on industrialization (Greenaway
et al. 1997; and Shafaeddin, 2005). The negative effect of trade openness or trade liberalization on
industrialization has often been associated with political instability, contractionary macroeconomic
policy after reforms and protecting domestic sectors from unnecessary adjustments (Harrison, 1996;
Wacziarg and Welch, 2008). In other words, the effect of trade openness on industrialization is
ambiguous and could have a positive, negative or no effect on industrialization.
EXPORTS and IMPORTS
The impact of exports EXPGDP and imports IMPGDP on economic growth and development is an
aspect of the international trade literature. Previously, we have shown that an increase in international
trade or trade openness spurs economic growth and development. In the first instance, we would
expect both variables to positively affect economic growth in developing countries. The intuition goes
along this line: developing countries would initially export primary products (including fuel) to
generate export revenues which are beneficial for economic growth. The export revenues are therefore
used to import intermediate and advanced technological goods which are used to improve the standard
of domestic manufacturing with the prospect of competitively exporting manufactured products. In
other words, exports and imports might have positive effect on economic growth.

88
However, it is also possible that the exports for developing countries (be it in primary or
manufactured form) might negatively affect economic growth if it faces price competition that would
damage its balance of trade payments. Also, importing goods into sectors that are not efficient to
exploit the benefit of improved technology might also be detrimental for economic growth. Another
aspect of the literature suggests that increased exports are more beneficial to growth and productivity
than increased imports. For example, Harrison (1996) states that a majority of micro studies have
shown that increased exports is positively associated with productivity growth while, this relationship
tends to be negative in the case of imports. Also, Santos-Paulino and Thirtwall (2004) find that trade
openness facilitates the growth of exports, but stimulated the growth of imports by more, resulting in
a worsening of balance of trade payments and leading to a fall in growth of output and living standard.
On the contrary, While Thangavelu and Rajaguru (2004) find that trade has important implications for
productivity and output growth in an economy, they find that it is imports that are more positively
influential in the association between trade and output growth in a selection of rapidly growing Asian
economies. Their results suggest that imports and exports have qualitatively different effects on
labour productivity. First of all, the long-run results indicate that exports do not cause labour
productivity growth in Hong-Kong, Indonesia, Japan, Taiwan, and Thailand; thus indicating that there
is no export-led productivity in these countries. On the other hand, they find that imports significantly
causes labour productivity growth in India, Indonesia, Malaysia, Philippines, Singapore and Taiwan;
indicating import-led productivity growth. In other words, they suggest imports to be more important
for productivity and output growth.
It has also been established that while exports positively affect economic growth, this effect is most
accounted for by manufactured exports, rather than the exports of primary products (i.e. including fuel
and non-factor services) (Fosu, 1996). However, Soderbom and Teal (2003) find no evidence that
manufactured exports are associated with economic growth in Africa, although they find an
association between exports and income levels. They further argue that factors that have limited the
success of African manufacturing firms in exporting are their levels of efficiency and small size. In
other words, the impact of exports and imports on industrialization would depend on country specific
factors.
HUMAN CAPITAL
Human capital HUMCAP has been established as important determinant of growth and productivity.
When measured as educational level, it is seen to improve the productivity of firms both in the
manufacturing sector and the non-manufacturing sectors (Black and Lynch, 1996). However, it has
been found that human capital has an insignificant negative effect on economic growth when using a
Cobb-Douglas production function; but it has a significant positive effect on total factor productivity
growth through the rate of domestically produced technological innovation and the speed of adoption
of technology from abroad (Benhabib and Spiegel, 1994).

89
Human capital has been measured mainly by educational stock and flow variables that have been
made available by Barro and Lee. Also, expenditure on education as well as health has been used as
measures of human capital that indirectly affects economic growth positively. Baldacci et al. (2008)
measure human capital as education and health expenditure. They find that both measures have a
direct positive and significant effect on education and health capital, and an indirect impact of growth.
They also find that that increasing education expenditure by 1 percentage point of GDP is associated
with 3 more years of schooling and on average increases GDP per capita by 1.4 percentage points in
15 years. Likewise, increasing health expenditure by 1 percentage point of GDP is associated with an
increase of 0.6 percent in the under-5 year child survival rate and an increase of 0.5 percent point in
annual per capita GDP growth. Rivera and Currais (1999) also confirm the indirect positive effect of
health expenditure on economic growth. In other words, we would expect the level of human capital
to be positively associated with industrialization.
Appendix 2.7: Scatter Plots showing the relationship between Manufacturing Value Added
Growth and Bank Market Structures over different time periods
Figure 1
Figure 1A Figure 1B
05
10
20 40 60 80 100Bank Concentration
Manufacturing Value Added Growth Fitted values
Full Sample
05
10
20 40 60 80 100Bank Concentration
Manufacturing Value Added Growth Fitted values
Period 1: 1995-1998

90
Figure 1C Figure 1D
Figure 2
Figure 2A Figure 2B
Figure 2C Figure 2D
05
10
20 40 60 80 100Bank Concentration
Manufacturing Value Added Growth Fitted values
Period 2: 1999-2002
05
10
20 40 60 80 100Bank Concentration
Manufacturing Value Added Growth Fitted values
Period 3: 2003-20070
510
0 20 40 60 80Foreign Bank Ownership
Manufacturing Value Added Growth Fitted values
Full Sample
05
10
0 20 40 60 80Foreign Bank Ownership
Manufacturing Value Added Growth Fitted values
Period 1: 1995-1998
05
10
0 20 40 60 80Foreign Bank Ownership
Manufacturing Value Added Growth Fitted values
Period 2: 1999-2002
05
10
0 20 40 60 80Foreign Bank Ownership
Manufacturing Value Added Growth Fitted values
Period 3: 2003-2007

91
Figure 3
Figure 3A Figure 3B
Figure 3C Figure 3D
In Figure 1, Figure 1A shows a positive, albeit weak relationship between bank concentration and
manufacturing value added growth. This relationship doesn’t change when we split the sample into
three subsamples (1995-1998, 1999-2002, 2003-2007) as shown in Figures 1B, IC and ID. We
experience the same pattern in Figures 2 and 3, where under different subsamples; the relationship
between foreign bank ownership/government ownership of banks is negative/positive. It is therefore
fair to suggest that the relationships are stable over different subsamples of the time period.
05
10
0 20 40 60 80Government Ownership of Banks
Manufacturing Value Added Growth Fitted values
Full Sample
05
10
0 20 40 60 80Government Ownership of Banks
Manufacturing Value Added Growth Fitted values
Period 1: 1995-1998
05
10
0 20 40 60 80Government Ownership of Banks
Manufacturing Value Added Growth Fitted values
Period 2: 1999-2002
05
10
0 20 40 60 80Government Ownership of Banks
Manufacturing Value Added Growth Fitted values
Period 3: 2003-2007

92
CHAPTER 3: BANK MARKET STRUCTURE AND INDUSTRALIZATION IN
DEVELOPING COUNTRIES: EVIDENCE FROM INDUSTRY-SPECIFIC DATA
3.1. INTRODUCTION
Important contributions to the literature try to explain which financial structure is more
appropriate for economic development. Rival financial structures in the literature have been
taken to be bank-based and market-based financial systems.50
The relationship between
financial structure and economic development can be traced to Goldsmith (1969). In that
study, he attempted to examine how financial structure changes as the economy grows and to
how it contributed to rapid economy development. While his was work was one of the early
ones to establish a relationship between economic growth and financial development, it has
been criticised on the grounds that the number of countries was too limited51
and that did not
robustly control for other factors that might affected economic growth. In this chapter, rather
than consider the broad bank-based or market-based views, we examine some mechanisms
(bank concentration, foreign bank entry, and state ownership of banks) through which banks
can finance industrialization. We clearly try to examine the role of bank market structures in
industrialization while taking note of industry-country specific characteristics.
The main objective in this chapter is to examine how banking and ownership structures affect
industry growth and the creation of new establishments in the manufacturing sector. A cross
industry-country panel is utilized to examine this. While it is essential to examine
characteristics of the banking sector that influence the growth and structure of the
manufacturing sector, it is equally essential to examine the characteristics of the
manufacturing sector that are directly influenced by finance from the banking sector, that in
the long run, leads to increased economic growth.
50
A number of these studies include: Goldsmith (1962), He tried to examine how financial structure changes as
the economy grows, the overall impact of financial development on growth, and weather financial structure
(bank-and market-based financial systems) influenced the pace of growth; Levine and Zervos (1998), they
examine if well-functioning stock-markets and banks promote long-long growth; Allen and Gale (199), they
compare the effectiveness of financial markets and financial intermediaries in financing new industries and
technologies in the presence of diversity of opinions; Demirguc-Kunt and Levive (2001), they examine how
well financial systems (bank-based and market-based) function for long-run economic growth but they take note
of the quality of institutions; Demirguc-Kunt and Maksimovic (2002), they examine the effect of bank-based
and market-based financial systems on firm growth; Levine (2002), he compares the effectiveness of bank-based
and market based financial systems; and Luintel et al. (2008), they examine the impact of bank-based and
market based financial system on growth but by using time series and dynamic heterogeneous panel models. 51
The United States, the United Kingdom, Germany and Japan.

93
In a pivotal study by Rajan and Zingales (1998), financial-dependent industries are assumed
to growth faster in countries where the level of financial development is higher. In this study,
the dependence of external finance across industries is assumed to be determined by
technological reasons, and that technological differences across industries are similar across
countries. For example, external financial dependence for the medical, precision and optical
instrument industry in the United States is assumed to similar to that in Kenya. What we try
to do in this chapter is to investigate whether there are other characterizations, besides
external finance dependence (if indeed such a characterization is valid) that should be
common to sectors that benefit from financial development.
The rationale for testing for other industry-specific characteristics which might be expected to
benefit from financial development is based on the assumption the the industry
characterization of external finance dependence might not be valid. The index has been
criticized on some grounds: firstly, a more appropriate microeconomic database should have
been used to construct the index; secondly, differences in the index across industries are not
mainly attributed to technological/structural factors; thirdly, technological/structural
differences of the index across industries cannot be the same across countries when country-
specific institutional structures and policy reforms, which may determine external finance
dependence in some industries have not been considered; and lastly, capital expenditure data,
a key component of the index, may undermine the actual level of firms’ external finance
dependence, in particular, developing countries.52
These tests examine the generalizations
about which sectors benefit from financial development or, to put it differently, are the effect
of financial development more country-specific or industry specific?
3.2. THEORETICAL AND CONCEPTUAL FRAMEWORK.
3.2.1. Banking Market Structure and Economic Development
In the last decade or so, the literature on finance and growth has produced several areas of
research which have been controversial. For example, as also highlighted in Chapter 2, the
importance of concentration in the banking industry or the relevance of the ownership
structure of banks-whether foreign, domestic or government ownership- for the relationship
between finance and growth have emerged as important but debatable areas of research.
52
These points have been raised by Von Furstenberg and Von Kalckreuth (2006) and Kabango and Paloni
(2011) and the points will be discussed in section 3.2.2.

94
3.2.1.1. Bank Concentration and Industrial Characteristics
On the empirical relationship between bank concentration and industrialization, Cetorelli and
Gambera (2001) find that bank concentration has a positive effect on industrialization. They
explore the empirical importance of bank market structure on growth using a dataset similar
to that of Rajan and Zingales (1998). First of all, they find that bank concentration has a
‘first-order’ negative effect on growth. However, results at the industry level prove that bank
concentration affects manufacturing industries differently. They find that industries that
depend more on external finance are positively affected by bank concentration. Also, Da Rin
and Hellmann (2002) provide theoretical evidence for this. They introduce banks into the
‘big-push’ model to examine if banks that are profit-motivated would engage in financing
industrial investments. The model develops a link between the role of banks and
industrialization. They find that banks act as a catalyst for industrialization but they also
emphasize that these banks have to be profit-driven, significantly large and with market
power in the banking market.
On the other hand, studies suggest bank concentration to negatively influence
industrialization include Beck et al. (2004) and Black and Strahan (2002). Beck et al. (2004)
find that bank concentration increases financing obstacles, and this effect is worse for small
and medium firms. Also, Black and Strahan (2002) suggest that policies which promote bank
concentration might have a negative effect on new corporations, firm creation or firm entry.
External finance dependence53
has been indicated as one of the key characteristics which
determine the nature of the impact of bank concentration on industry growth. A significant
number of papers provide evidence that industries that depend more on external finance are
likely to growth faster in countries where the level of bank concentration is high. Cetorelli
and Gambera (2001) are probably the first to provide empirical evidence for this.
Specifically, they examine the effect of bank concentration on the growth of industries that
depend more on external finance. With regards to industry- specific results, their study shows
more financial dependent industries to benefit more from a concentrated banking market.
Also, they find that industries under this category are expected to benefit from bank
concentration in the form of increased average size but not growth in firm entry.
53
See Rajan and Zingales (1998) for a detailed discussion on this theoretical industry-specific measure.

95
Other studies find a positive effect of bank concentration on financial dependent industries,
see for example Cetorelli (2001), Cetorelli (2004) and Mitchener and Wheelock (2013).
Cetorelli (2001) asks if bank concentration promotes the formation of industries composed of
a few, large firms or, whether it facilitates the entry of new firms, thus upholding
unconcentrated market structures across industries. His results specifically show that firms in
sectors that depend more on external finance are of disproportionately larger in size if they
are in countries with greater concentrated banking markets. Similarly, Cetorelli (2004)
examines whether changes in bank competition have played a role on the market structure of
non-financial industries in EU-member countries. His results suggest that where more mature
firms require more external finance, they are disproportionately larger in size if they are in
countries whose banking sector is more concentrated.
Mitchener and Wheelock (2013) examine the relationship between bank market structure and
economic growth in a country with segmented markets (i.e. the United States) from 1899
through 1929. They find that bank market concentration generally exerted a positive
influence on the growth of U.S manufacturing industries during this period. Also, they find
that industries that were composed of smaller firms or firms with less access to capital
markets relied more on banks for external finance and thus were more directly affected by
concentration of banking markets. On the other hand, Claessens and Laeven (2005) find that
greater competition in countries’ banking system allows financial dependent industries to
grow faster. In their study, they relate a structural measure of banking system competiveness
(the methodology of Rosse and Panzar) to industrial growth. They find that external
financially dependent sectors grow faster in more competitive banking systems. They also
find no evidence that market structure -i.e. bank market concentration-help predict industrial
sector growth.
In our review of bank concentration and external financial dependence, there is some
evidence that bank concentration promotes the growth of industries that depend more on
external finance (except in Classens and Laeven, 2005). There is also a substantial part of the
literature which examines how bank concentration affects industrialization through firm
entry, firm creation or entrepreneurship.
Studeis that find a positive effect of bank concentration on firm entry or entrepreneurship
includes Bonaccorsi di Patti and Dell’Ariccia (2004) and Bergantino and Capozza (2012).
Bonaccorsi di Patti and Dell’Ariccia (2004) investigate the effects of bank competition on the

96
creation of firms in the non-financial sector in Italy, while allowing for heterogeneous effects
across borrowers characterized by different degrees of asymmetric information. First of all,
they find that the relationship between bank market power and firms creation is bell-shaped.
Secondly, they find that the bell-shaped relationship differs across industries characterized by
different degree of opaqueness. Bank market power (or bank concentration) is more
beneficial to firms in highly opaque industries, where the average effect is positive, and
relatively less detrimental to the where the average effect is negative.
Similarly, Bergantino and Capozza (2012) investigate the impact of bank concentration on
entrepreneurial initiative in the Central and Eastern European transition countries over the
period 2000 to 2007. Their results suggest that bank concentration has a non-monotonic
relationship with entrepreneurial initiative during this period. Bank concentration promoted
entrepreneurship but, at very high levels of concentration, it could be harmful. The positive
effect is actualized through two channels: a microeconomic channel-where banks develop a
lending relation with start-up firms; and a macroeconomic channel - where banks with market
power ensure stability in the banking sector.
On the other hand, a negative impact of bank concentration (or the positive impact of bank
competition) on firm entry or entrepreneurship is detected in Cetorelli (2002); Black and
Strahan (2002); and Cetorelli (2006). Cetorelli (2002) examines the role of bank competition
on the life-cycle dynamics of non-financial industries and finds that more bank competition
tends to promote job creation among industrial establishments at the entry stage and to
permits them to proper shortly after they enter the market. At the same time, they find that
more bank competition accelerates the exit of more mature establishments from the market.
Similarly, Black and Strahan (2002) examine whether policy changes that promoted
competition and consolidation helped or harmed entrepreneurs. Their results suggest that
policies such as branching and interstate banking reform that promoted competition and
consolidation in the banking sector helped entrepreneurship. They find that the rate of new
incorporation in a state increased significantly following deregulation.
Finally, Cetorelli and Strahan (2006), while investigating how competition in the local
banking market affects the market structure of non-financial sectors in the United States, find
that more aggressive competition policies in the local U.S. banking markets that foster
reduced concentration at the MSA (Metropolitan Statistical Area) - level and less restriction
on bank entry at the state-level reduce the size of the typical establishment. They also find

97
greater competition to increase the share of establishments in the smallest size group and
increase the total number of establishments. These studies are in line with theories that
predict that greater bank concentration may represent a financial barrier to entry in the
product markets.
The effect of bank concentration has also been related to firm opacity, factor intensity and
asset type. For example, Ratti et al. (2008) is able to show the positive effect of bank
concentration on non-financial firms. Primarily, they find that increasing concentration
relaxes financial constraints on firm-level investment. Another finding in their study is that,
while large firms are found to be less financially constrained than small firms, the effect of
reducing financial constraints in both groups of firms through increased concentration is
significantly not different. Finally, they find that, while the relaxation of financial constrains
is greater in less opaque industries, this effect also accrues to firms in more opaque industries.
In other words, bank concentration equally benefits small and large firms, as well as firms in
less opaque and more opaque industries.
In terms of factor intensity, Lin et al. (2012) tries to empirically examine the ownership and
the size-structure views on low banking efficiency in China. The ownership-structure view
suggests that the large presence of government in the banking sector is responsible for its
poor performance. On the other hand, the size structure view suggests that it is the unsuitable
size structure that is responsible for low efficiency in the Chinese banking sector. Their
results are consistent with the structure-size view. In particular, they find that more labour-
intensive industries grow faster than more capital-intensive industries in provinces with more
active banks compared to provinces with more dominant Big Four branches. We view this as
greater bank competition fostering the growth of labour-intensive industries. Finally, with
regards to asset type, Bergantino and Capozza (2012) shows that greater bank concentration
is more suitable for financing physical-asset-intensive industries rather than high-technology,
and R&D-based industries.
3.2.1.2. Foreign Bank Entry and Industrial Characteristics.
In Chapter 2, the literature survey suggests that foreign bank entry may have ambiguous
effects for industrialization in developing countries. However, our findings suggest that
foreign bank entry may slow down industrialization in developing countries, at least in the
long-run. Other studies that emphasise the negative effect of foreign bank entry in developing

98
countries include Berger et al. (2001) and Mian (2006). On average, the net externalities as a
result of foreign banks presence in developing countries are largely dependent on how
competitive the local banks are in the long run. The inability of foreign banks to gain access
to soft information on loan applicants induces them to only provide credit to firms with a
credit history. This causes the pool of quality borrowers from domestic banks to be reduced.
Moreover, banks will not be willing to take excessive risk by lending to applicants without a
credit history. This reduces their zeal to lend and thereby reduces credit availability in the
market.
On the other hand, Levine (1997) and Moreno and Villar (2005) argue that the presence of
foreign banks may, together with economic stability, help the development of a healthy and
sound financial system. Foreign bank entry may also have mixed effects on the domestic
economy. For example, according to Havrylchyk (2012), foreign bank entry in Central and
Eastern Europe is associated with lower entry rates of firms and smaller size of entrants in
informationally opaque industries. However, he also shows that the effect of foreign banks on
firm entry depends on the entry mode. The negative result above occurs when foreign banks
enter through the acquisition of domestic banks. On the other hand, when foreign banks enter
through Greenfield investments, they are positively associated with higher rates of start-ups
in more opaque industries.
While foreign bank entry may or may not increase competition and credit availability in the
domestic economy of developing countries, another question is how their entry affects
industries. In other words, do all industries benefit equally from foreign bank entry, or are
some industries more favoured? First of all, according to Beck et al. (2004) and Clarke et al.
(2006), foreign bank entry may reduce financial constraints for all firms, including small and
medium firms. Beck et al. (2004) finds that foreign bank presence dampens the effect of
financing obstacles of firms of all sizes; while Clarke et al. (2006) point that all enterprises,
including small and medium ones, report lower financial obstacles in countries having higher
level of foreign bank presence.
On the other hand, foreign bank entry may only benefit industries that have certain
characteristics. For example, according to Bruno and Hauswald (2013) and Taboda (2011),
foreign bank entry may improve lending to industries with a high dependence on external
finance and industries that are the most productive. According to the findings of Bruno and
Hauswald (2013), industries that depend more on external finance perform significantly

99
better in the presence of foreign banks; while according to the findings of Taboda (2011),
foreign bank ownership improves capital allocation efficiency by increasing lending to more
productive industries. In other words, the most productive industries benefit from foreign
bank entry.
However, it is also possible that foreign bank entry negatively affect industries with certain
characteristics. For example, according to Berger et al. (2001), informationally opaque small
firms in Argentina receive less credit from large banks and foreign banks; also, Satta (2004)
specifically finds that, on average, foreign banks in Tanzania between 1991 and 2001 lent
less to small firms (as a share of total lending) than domestic banks. Clarke et al. (2005) find
that foreign banks devoted less of their lending to small businesses in Argentina, Chile,
Colombia and Peru during the mid-1990s than domestic private banks, while Detragiache et
al. (2008) finds that foreign bank presence is associated with less credit to the private sector.
Finally, according to the findings of Giannetti and Ongena (2009), in Eastern Europe, foreign
bank lending fosters growth in firm sales, assets and the use of financial departments, but
they find this effect to be less for small firms.
On the whole, the literature is ambiguous on whether the impact of foreign bank entry on
industry is uniform or differentiated across sectors. This is something that would be examined
in the chapter.
3.2.1.3. Government Ownership of Banks and Industrial Characteristics.
The literature survey in the Chapter 2 mostly highlighted that state ownership of banks slows
down growth and development, although there is some evidence that this effect might be
positive. According to our findings, the effect of state banks on industrialization is negative in
the long-run. However, because this effect is positive in the short-run, we interpret the results
as ambiguous, since both interpretations are possible.
While state ownership of banks may be beneficial or detrimental for growth and development
in developing countries, how would it affect industrialization through specific industries? In
other words, would it affect industries uniformly or would the effect be industry-specific?
First of all, while Cetorelli and Gambera (2001) find that government ownership of banks
reduces the positive effect that bank concentration has for the promotion of growth of
external finance dependent industries. Similarly, Galindo and Micco (2004) find no evidence

100
that state owned banks play a significant role in the development of industries that rely on
external finance and/or that have less tangible assets to pledge as collateral. Beck and Levine
(2002), on the other hand, find no evidence that state-owned banks promote industry growth
or foster the formation of new establishments, particularly in labour-and capital-intensive
industries.
Clarke et al. (2005) find no evidence that government owned banks surpassed private banks
in lending to small firms in Latin America during the 1990s; Berger and Udell, (2006) show
that a greater presence of foreign owned banks and a lesser presence of state owned banks is
likely to be associated with significantly higher SME credit availability in developing
countries; and Beck et al. (2008) find a weak relationship between development bank and
government bank lending towards small firms.
Finally, Xiao and Zhao (2012) find that, in countries where the presence of state owned banks
is high, bank development has a negative or an insignificant effect on firm innovation. On the
other hand, Sapienza (2004) finds a positive effect of state bank lending to Italian firms; and
Micco and Panizza (2006) find evidence that state owned banks may play a credit smoothing
role. In other words, their lending is less responsive to macroeconomic shocks than lending of
private banks.
In general, the effect of state owned banks industries that require more external finance or
composed of small firms is ambiguous (negative or positive), or they might lend uniformly to
all firms. These are aspects of the study which are empirically examined.
3.2.2. Methodological Approach
Previously, most empirical studies that identified a relationship between bank market
structure and economic growth and development (mainly credit supply to firms) assume that
the effects of bank market structure are heterogeneous across firms. In this chapter, we
systematically analyse a greater variety of industry characteristics because external finance
dependence, an industry characterization that has been largely used in the literature and has
become essential for financial policy reforms, has been questioned on the grounds of
construction and assumptions.

101
The theoretical measure of external financial dependence by Rajan and Zingales (1998) has
been questioned in the literature by Von Furstenberg and Von Kalckreuth (2006) and
Kabango and Paloni (2009). Von Furstenberg and Von Kalckreuth (2006) establish serious
empirical uncertainty of the Rajan and Zingales measure of external financial dependence by
trying to answer two research questions. First of all, they try to examine to what extent the
microeconomic data used by Rajan and Zingales to describe the external financial
dependence values of each sector is suitable to characterize the financing conditions in that
entire sector for the United States. Secondly, they try to examine if the differences in the US
external financial dependence values by sector are attributable to distinguishable factors that
may possibly be considered as structural/technological?
They use aggregate data US industry-level data from the (US Department of Commerce)
Bureau of Economic Analysis (BEA) to construct external financial dependence on a yearly
basis for 21 industries between 1977 and 1997. Compared to their measure, they find that
Rajan and Zingales measure poorly represents the macroeconomic nature of manufacturing
sectors in the US, a country which the measure is based on. Also, they argue that the
elimination of “cyclical” factors by Rajan and Zingales through aggregation is flawed.
Rather, they adjusted their annual measure for each sector which results in better control and
preservation of annual residuals that may comprise of relevant information that relates to
non-cyclical characteristics.
Secondly, they criticize the attribution of structural or technological differences to only
between-sector effects as suggested by Rajan and Zingales, rather than between-sector and
within-sector effects. From their investigation, they find that between-sector effects explain
only 70% of the total sum of squares of their measure, while the within-sector effects explain
the remaining 30%. They also criticize the assumption of Rajan and Zingales that the
difference in external financial dependence as a result of structural or technological reasons
in the US is the same in other countries. They examine if differences in external financial
dependence in manufacturing sectors in the US are as a result of structural or technological
reasons based on the values of variables used in constructing their annual measure. When
their variables are unweighted, they explain 59% of the between-group effect, while when
they are weighted; the variables explain only 32% of the between-group effects, thereby
emphasizing the importance of weighting. In other words, close to 70% of the between-sector
difference remains unexplained. Finally, what explains sectoral differences is the growth rate

102
of the capital stock, which is not necessarily structural or technological. Also, variables like
the share of intermediate inputs in gross output and the depreciation rate of the fixed stock of
capital in a sector that could be regarded are structural or technological did not show any
substantial signs of explaining sectoral differences. It is therefore difficult to assume that
measure differs across industries as a result of technological factors.
In general, after using an alternative dataset, Von Furstenberg and Von Kalckreuth (2006)
find that the measure by Rajan and Zingales does not sufficiently signify financial
requirements in different industries in the manufacturing sector, that is including the United
States, and secondly, they fail to find any evidence that the heterogeneity of external financial
requirements across industries is based on technological or structural characteristics inherent
to different industries according to the Rajan and Zingales measure.
Similarly, Kabango and Paloni (2009) are uncertain of the fact that this measure is assumed
to be applicable for all countries. First of all, they argue that countries may have specific
institutional features or policies which may determine how much the dependence of external
financial dependence of certain industries would be. They give examples to suggest that
structural or technological reasons may be just one factor that determines the sector
differences in the dependence of external finance. First of all, they suggest that some
industries may receive subsidies for strategic reasons, like the food industry, to promote trade
and protect food security, or the fact that large firms who are major players in their industry
may have better opportunities to finance, or even the fact that firms in joint partnership with
foreign firms may have access to international channels of finance. They also argue that
capital expenditure may underrate the actual level of firms’ external financial dependence.
They make reference to a work by Nissanke (2001) which examines financial development in
some sub-Saharan Africa countries. In this study, Nissanke notes that political instability and
an uncertain economic tendency greatly influences the manner, in which people save as well
as how they invest, preferring safe investments which is characterized by self-insurance.
Kabango and Paloni (2001) relate this to the fact that people in these countries borrow mainly
for commerce and trading and not long-term capital investments.
In line with the two studies, we are of the opinion that the external financial dependence
measure by Rajan and Zingales has significant limitations because it does not measure the
true level of external financial dependence in industries; its level is not solely determined by
structural or technological factors, and it cannot be applicable for all countries, particularly

103
developing countries. The insignificant interactions in our results may serve as further
evidence of the limitations of this measure.
Our methodology examines how bank concentration, foreign bank ownership and
government ownership of banks finance the expansion of and entry into industries that are
heavily dependent on external finance, composed of small firms, labour-intensive,
technologically-intensive, and of economic importance. We use a panel dataset of cross-
country and cross-industry observations to examine the relationship between bank market
structure and both industry growth and net firm entry.
In our panel data approach, we extend the Rajan and Zingales methodology to examine
whether industries of different characterizations grow faster in countries where bank
concentration, foreign entry and government ownership of banks are high. Industry
performance is also represented by net firm entry or growth in the number of firms. New
firms depend more on finance than mature firms. Therefore, growth in the number of firms in
industries that are expected to benefit more from financial development would be sensitive to
bank market structure. In our models, we create interaction terms between bank market
structure and industry-specific characteristics. The interaction term interests us the most
because it examines, for example when considering an interaction bank concentration and
external finance dependence, whether industries that are more in need of external finance
grow disproportionately slower or faster in countries where the level of concentration is high.
Rajan and Zingales also point out that using an interaction between country and industry-
specific characteristics in cross-country empirical studies is important because it enables one
to make predictions about within-country difference between industries. Using interaction
terms, therefore makes is possible to correct for industry and country-specific characteristics
as well as control for problems of omitted variable bias and model specification. We employ
the system GMM estimation technique to estimate the relationship bank market structure and
industry performance.
3.3. EMPIRICAL FRAMEWORK
3.3.1. Model Specification
The empirical model estimates that industry growth and growth in the number of
establishments are a function of the bank market structure, which affects them through

104
channels that have been discussed in the previous chapter. The chapter would help in
determining whether cross-country variation in bank market structures can help in explaining
cross-industry-country variation in industry growth and growth in the number of firms.
Period dummies are also included to the model, to control for possible policy changes that
have been employed over the period under consideration. The following regression is
therefore estimated:
, 1 , 1 2 3 ,
,ki t ki t it it ki t ki t
MVAGR MVAGR BNKMKT CV
(3.1)
where,ki t
MVAGR is the annual growth rate of manufacturing industry value added in industry
k and country i, between 1995 and 2007; , 1ki t
MVAGR
is the lagged value of the annual growth
rate of manufacturing industry value added;it
BNKMKT is the annual level bank concentration,
foreign bank entry, and state ownership of banks in country i, between 1995 and 2007; it
CV is
the annual level or growth rate of a set of conditioning variables between 1995 and 2007; ki
and t are industry-country- and time-specific effects, respectively, where
ki may be
correlated with the levels of the explanatory variables and is constant over time, andt may
capture global shocks.(they correct for industry-country- and time-specific effects that might
determine industry growth/growth in the number of firms). This therefore isolates the effect
that the interaction terms have on industry growth rates/growth in the number of firms
relative to industry-country and time means patterns; and ,ki t
is the error term.
To estimate the effect of bank market structure on net firm entry, we specify the following
model:
, 1 , 1 2 3 ,
,ki t ki t it it ki t ki t
NFEGR NFEGR BNKMKT CV
(3.2)
where ,ki t
NFEGR is the annual growth of net firm entry in industry k and country i, between
1995 and 2007, while, 1ki t
NFEGR
is its lag.
In (3.1), the model examines an overall cross-country effect of bank market structure on
industrial performance. To identify variability of this effect across industries based on
industry-specific characteristics, we extend the model to include interaction terms between
bank market structure variables and industry-specific characteristics. In other words, would
certain industries perform better or worse as a result of bank concentration, foreign bank

105
entry and state ownership of banks? In general, does the heterogeneity across industries
explain how bank market structures affect industry performance? We specify the following
relationship using external finance dependence as industry-specific characteristics.
, 1 , 1 2 3 4 ,( ) ,
ki t ki t it it k it ki t ki tMVAGR MVAGR BNKMKT BNKMKT ED CV
(3.3)
where ( )it k
BNKMKT ED is an interaction term between bank market structure i.e. bank
concentration, foreign bank entry and state ownership of banks; and the measure of external
finance dependence for industry k. On the other hand, in (3.2), to identify variability of the
effect of bank market structure on net firm entry across industries, we extend the model to
include interaction terms between bank market structure and industry-specific characteristics.
We therefore specify the following model:
, 1 , 1 2 3 4 ,
( ) ,ki t ki t it it k it ki t ki t
NFEGR NFEGR BNKMKT BNKMKT ED CV
(3.4)
The limited degrees of freedom supports the incorporation of the interaction terms separately
or one at a time rather than at the same time
3.3.2. The Econometric Model
To estimate the equations above, we apply the Generalized Methods of Moments (GMM)
estimator (Holtz-Eakin et al. 1998; Arellano and Bond, 1991; Arellano and Bover, 1995).
First-differencing of the equations is recommended to eliminate the industry-country-specific
effect (Arellano and Bond, 1991). Using the lagged values of the explanatory variables as
instruments is recommended to reduce the problem of endogeneity. Supposing that the error
terms ,ki t
are not serially correlated and that the regressors are not strictly exogenous, the
following moment conditions can be applied:
, , 1 ,0
ki t ki t ki t jE X
j = 2, …, t -1; t = 3, …, T (3.5)
where X = [BNKMKT CV]. When the equations are first-differenced, we refer to the estimator
as the difference estimator.
Nevertheless, a conceptual problem with the difference estimator is that it eliminates the
cross-country relationship between manufacturing value added growth/net firm entry and

106
their determinants (Loayza et al. 2000 and Beck, 2002). Statistical problems associated with
the difference estimator include: lagged levels are weak instruments when the explanatory
and dependent variables are persistent over time; first-differencing tends to emphasize
measurement error over signal; and differences are less correlated over time than levels
which might produce biased estimates if the dynamic structure of estimated model differs
from the true model (Alonso-Borrego and Arellano, 1996; Blundell and Bond, 1997; and
Barro, 1997). To fix this theoretical and econometric shortcoming, a different estimator that
combines the regressions in differences with regressions in levels in a system is
recommended (Arellano and Bover, 1995).
The system estimator reduces the potential biases and imprecision associated with the
difference estimator (Blundell and Bond, 1998). The lagged values of the explanatory
variables remain instruments for the regression in differences while lagged differences are
used as instruments for the regression in levels. The validity of these instruments is based on
a further assumption: while it is possible that explanatory variables in levels may be
correlated with the industry-country-specific effect in the equations, explanatory variables in
differences are not correlated with the industry-country specific effect. The moment
conditions for the regressions in levels are therefore:
, 1 ,0
ki t j t j ki t kiE X X
j = 2, …, t – 1; t = 3, …, T (3.6)
The system therefore consists of the combined regressions in differences and levels, with the
moment conditions in (3.5) applied to the first part of the system, the regression in
differences, and the moment conditions in (3.6) applied to the second part of the system, the
regression in levels. In this study, we have not included any external instruments. We use
those internally generated.
The lagged dependent variable has been included because the process may be dynamic. In
other words, current values of manufacturing value added growth or net firm entry many
have been influenced by past values (Roodman, 2009). The lagged dependent variable may
also capture the influence of variables that have not been considered or are unobservable. The
lagged-dependent variable for manufacturing growth is included to evaluate the impact of
expected growth in manufacturing. Since it is the assumption that growth rates are highly
correlated over time, it is realistic to suggest that manufacturing firms forecast future growth

107
using past growth (Dehejia and Lleras-Muney, 2007). On the other hand, lagged net entry is
included to control for the pace at which firms enter and exit an industry as a result of the
changing economic environment. The influx and outflow of firms in and out of industries
(Geroski, 1995 and Cincera and Galgau, 2005) maybe triggered by a multiplier effect where
future entry is as a result of past entry and future exit, a result of past exit (Johnson and
Parker, 1994 and Hannan and Freeman (1989). For example, the perceptions of new entrants
are positively linked to the experience of incumbents firms that operated in the industry
previously.
The system GMM estimator is preferred to the two stage least squares (2SLS) or the
difference estimators because it reduces the potential biases and imprecision associated with
these estimators. Estimating (3.1) - (3.4) may result in several econometric problems that are
handled better when using the system GMM estimator. First of all, since the bank market
structure variables are assumed to be endogenous, causality may run from the bank market
structure variables to industrialization and the other way round, resulting in a probable
situation where the regressors are correlated with the error term. Using the 2SLS estimator
may result in weak instruments, which are likely to bias the fixed-effect IV estimators in the
way of the OLS estimators. The difference GMM estimator is a better estimator because it
uses the lagged level of the explanatory variables, making the endogenous variables
predetermined and therefore not correlated with the error term. However, in some cases, the
instruments may be weak. The system GMM estimator reduces this bias.
Secondly, the presence of time-invariant country characteristics (fixed effects)54
, such as
geography or demographics, may be correlated with the explanatory variables. The difference
GMM estimator transforms the equation using first-differencing and the country-specific
effects are removed, because it does not vary with time. However, this might also produce
biased estimates, particularly when the dynamic structure of the model differs from the true
one (Barro, 1997). Thirdly, the presence of the lagged dependent variable may give rise to
autocorrelation. The difference GMM estimator caters for this because the first-differenced
lagged dependent variable is also instrumented with past levels. However, the problem of
bias estimates still exists. Finally, because our panel is unbalanced with a short time period,
the system GMM estimator is suitable because it works well with unbalanced panels (no
matter how many gaps), reduces data loss, and when the panel has a short time period.
54
Industry-country specific effects in our case.

108
The consistency of the GMM estimator depends on the validity of the assumption that the
error term does not exhibit serial correlation and on the validity of instruments. We apply two
tests proposed by Arellano and Bond (1991) to test for these assumptions. The first is a
Sargan test of over-identifying restrictions, which tests for the overall validity of the
instruments by analyzing the sample analog of the moment conditions used in the estimation
procedure. However, for robust GMM estimations, the Sargan test statistic is inconsistent.
Therefore, the Hansen J test of over-identifying restrictions is utilized in the study. The
second test examines the assumption of no serial correlation in the error term. It tests whether
the differenced error terms are second-order serially correlated. Failure to reject the null
hypothesis of both tests gives support to the model.
Finally, in the specifications, we have treated the bank market structures variables as
endogenous, while we treat the other conditioning variables as exogenous. Issues might be
raised over why GDP growth has been treated exogenously. Bernanke and Gurkaynak (2001)
and argue that, because long-run growth is significantly correlated with behavioral variables
like the savings rate, it should be treated endogenous variable rather than an exogenously.
They state this argument because in their model, they see saving rates to depend on growth
rates rather than the other way round. However, a study by the Food and Agricultural
Organization of the United Nations (2006) suggest that GDP can be treated either
exogenously or endogenously in regressions. For example, they suggest that GDP can be
treated endogenously when analyzing the impacts of policy shocks (e.g. trade liberalization,
technological changes, resource endowment changes and fiscal or financial policy changes).
On the other hand, GDP can be treated as exogenous when analyzing the impact of overall
economic growth on the performance of individual sectors and trade. In line with this
argument, we treat GDP growth exogenously, because we analyse its impact on the
performance of the manufacturing sector.
3.3.3. Variable Descriptions
The bank market structure and conditioning variables have been described in Chapter 2.
Therefore, in this chapter, only the dependent variables and the industry-specific variables
will be described. Also, the data is in 3 dimensions: cross-industry; cross-country and across
yearly time periods.

109
1. Manufacturing Value Added Growth (at Industry Level)
The variable ki
MVAGR was previously discussed in Chapter 2 but at country level. At industry
level, it is measured as the log difference of value added in industries on a yearly basis
between 1995 and 2007. Data is from the United Nations Industrial Development
Organization (UNIDO).
2. Net Firm Entry (Growth in number of Establishments)
Many studies emphasize the ability of banks to influence industry performance through the
promotion of the establishment of new firms. The establishment of new firms in industries
can therefore be determined by how much banks protect established firms. When banks are
able to obtain inside information about firms, this increases their ability to extract
informational rents, resulting in an extraction of significant shares of firms’ profits (Hellwig,
1991 and Rajan, 1992). Cross-country data on the number firms in an industry is not
available so we make use of cross-country data on the number of establishments in an
industry available from UNIDO. Net firm entryki
NFEGR can simply be described as the
percentage change in the number of establishments in an industry. In line with Beck and
Levine (2002), we have measured net firm entry as the log difference of the number of
establishments on a yearly basis between 1995 and 2007:
,
, 1
k t
ki
k t
nNFEGR Log
n
(3.7)
where ,k t
n is the number of establishments in industry k at time t. Theoretically, it has been
suggested that the entry of firms into an industry is dependent on the conditions on entry. In
other words, greater obstacles to entry will discourage the entry of new establishments while
reduced obstacles to entry will motivate the entry of new firms to an industry. The entry of
firms is largely dependent on industry conditions and the overall economy. As we have
identified from the literature, the effect of bank market structure on entry remains ambiguous.
In the previous section, we provide some discussion on why previous entry and exit may
influence future entry and exit.
3. External Financial Dependence
While we would have preferred actual data on external financing across countries,
particularly for developing countries, it is not available. However, Rajan and Zingales (1998)
suggest that even it were available, it would reflect the equilibrium between the demand for

110
external funds and its supply rather just the demand for external funds. For this reason, they
use data on manufacturing industries in the United Stated to calculate a measure of external
finance dependence across industries. They assume that the difference across industries are
based on technological factors and support this assumption with the fact that the initial
project scale, the gestation period, the cash harvest period, and the continuing investment
vary significantly across industries55
They also assume that the technological differences
across industries are similar across countries, which results in using the United States to
proxy for other countries.
The calculation itself is based on US companies over the 1980s and they use the Standard and
Poor’s (1994) Compusat. Compusat contains data on US firms publicly traded. In defining
external financial dependencek
ED , Rajan and Zingales are interested in measuring the
amount of desired investment that cannot be financed by internal cash flows generated by the
same business. Therefore, they define a firm’s external financial dependence as the “capital
expenditures minus cash flow from operations divided by capital expenditures”. They define
cash flow from operations as “the sum of cash flow from operations plus decreases in
inventory, decreases in receivables, and increases in payables”. They therefore use the
industry median to proxy better for the indicator. Finally, they use dependence of US firms to
proxy for dependence of the world and give reasons to support their argument. The data was
taken from their paper. Since data used to calculate this index for firms in the US if from the
1980s, it may be subject to criticism based on the fact that it may be outdated. This may not
necessarily be a problem because we are more interested in ranking than the values of the
index. For example, based on the index ranking by Rajan and Zingales, the tobacco industry
requires the least external finance, while the pharmaceutical drugs industry required the most
external finance. While the value of the index may be different if more recent data was used,
we are of the opinion that this ranking will relatively stay the same.
4. Small Firm Share/Average Firm Size
Beck et al. (2008) point out that an industry’s technological firm size depends on the
industry’s production process, including capital intensities and economies of scales. They
construct measures of each industry’s “natural” or technological share of small firms and use
a benchmark country to get a proxy of each industry’s natural or technological share of small
55
Ilyina and Samaniego (2011) discuss how some factor intensities and factor attributes of the production
technology (some technological reasons why industries might differ in their need for external finance) that
might related to the need or the ability to raise external funds.

111
firms. They require a country with an economy with minimal market imperfections and
policy distortions, so that they are mainly able to capture the impact of cross-industry
differences in production processes, capital intensities, and scale of economies on industry
firm size. Therefore, they use the United States to calculate the benchmark measure of an
industry technological share of small firms. Small Firm Share k
SFS for industry k is
consequently measured as the share of employment in firms with less than 20 employees in
the United States, and data was acquired from the 1992 Census. Data are from Beck et al.
(2008).
The average firm size ki
AFS has also been used to represent the size of firms in industries.
While Beck et al. (2008) used a theoretical measure to represent industries that are
technologically composed of small firms, we also apply a measure that actually proxies for
firm size. It could be referred as an actual measure for average firm size, resulting in the
process where we are able to actually measure industries that are composed of small firms.
We measure the simple average of firm size k
AFS as the total number of employees in a
sector divided by the total number of establishments in that industry:
,emp
ind
k estab
ind
NAFS
N (3.8)
where emp
indN is the number of employees in an industry and estab
indN is the number of
establishments in that industry
5. Labour Intensity
Another industrial characteristic we employ is labour intensity. Labour intensive industries
refer to industries which require a considerable amount of human labour to manufacture
industrial products. The degree of labour intensity is mostly measured by the labour-capital
ratio, or the ratio between employment and the capital stock. This ratio shows the relative
factor utilization in production, and the level to which it is labour intensive versus capital
intensive. Theoretically, the labour-capital ratio is established by both technological
characteristics of industries and the factor endowments of the economy. The labour-capital
ratio captures the purely technological determinant of labour intensity (Lin et al. 2012).
Another measure of labour-intensity is the ratio between employment and value added; this
shows the labour intensity of production. It has been argued that using value added instead of
total output has an advantage because total output of an industry measures the total output of

112
an industry rather than the actual contribution of that sector in terms of what it directly
produces. This ratio specifies how labour-absorbing, a production activity is for each unit of
value added. However, in the recent literature, where data on wages and salaries of
employees have become available, labour intensity is also measured as ratio of total
employee wages and salaries to value added of an industry:
,k
k
k
COMPLI
VADDED (3.9)
where k
COMP is the compensation to employees in the form of wages and salaries in
industry k and k
VADDED is the valued added from production in industry k. We employ this
measure of labour intensity in our study and it has previously been used by Beck and Levine
(2002)56
and Ilyina and Samaniego (2011). Data are from UNIDO and the index was
constructed by the author.
6. High Technological Intensive Industries
Economic globalization suggests that technology, a key component for promoting growth,
enables firms to be more competitive both domestically and internationally. Technological
intensive firms are more innovative, capture larger proportions of the market share, are more
efficient in allocating resources for production and pay more to employees in terms of wages
and salaries. Developing a complete classification of industries based on their technological
intensity has proved to be difficult. The problems most associated with this include being
able to identify the technological content of an industry, the fundamental concept; and
ambiguity associated with choosing cut-off point between technological classes. Also, the
unavailability of data has made R&D intensity the major factor in determining technological
intensity. However, Hatzichronoglou (1997) was able to classify industries based on R&D
intensities in 22 manufacturing industries for 10 OECD countries by using International
Standard Industrial Classification ISIC Rev. 2. Although he uses a sectorial approach and a
product approach, the sectorial approach covers the manufacturing sector alone, while the
product approach is more appropriate for international trade.
56
They used labour intensity for the United States.

113
We use a dummy variable to represent industries that are classified as high technology
according to Hatzichronoglou (1997) to explore the impact of bank market structure on
industrialization through ‘high-tech industries’k
HTI .
7. Economic Importance.
We include a number of indicators that measure the economic significance of each industry to
examine how bank market structure affects the most economically important industries. First
of all, we create interaction terms between the banks market structure variables and the initial
values of ratio of industry value added to manufacturing value added.57
Comparable to the
function of initial per-capita income in standard cross-country growth regressions, the
interaction term captures an industry-specific convergence effect. A positive sign would
indicate that industries that have grown significantly in the past would continue to grow at a
high rate in the future, while industries that have had slow growth will grow at the same pace
as a result of functions of bank market structure. On the other hand, a negative sign should
indicate that industries that have grown considerably in the past are unlikely to continue to
grow at a high rate in the future, resulting in other industries catching up.
We have also created an interaction term between bank market structure and the values of the
lagged manufacturing value added. A positive sign for the interaction term would mean that
important sectors are favored (where the importance of a sector is measured by the lagged
manufacturing value added growth rate). For example, if banks lend to an industry, it
continues to lend to that industry. While it is likely that incumbents in this industry are
favored, it does not mean that new firms in this industry do not get funding. On the other
hand, a negative sign would indicate that banks have lent in the past to an important sector,
but this lending relation does not exist anymore. One reason could be that banks do not wish
to be overexposed to one sector. The actions that lead to this could be as a result of the bank
refusing to lend to the firm or the firms seek alternative credit options.
57
sec
k
k
MVAIMVAR
MVA , where
kMVA is the initial value of total manufacturing value added in industry k, and
secMVA is the initial value of total manufacturing value added in the manufacturing sector.

114
Finally, we create an interaction term between bank market structure and the industry share
of employment.58
A positive sign would indicate that bank market structure improves the
growth of important industries-where the economic importance of an industry is measured by
the industry share of employment. On the other hand, a negative sign would indicate that
banks worsen the growth of important industries. These ratios have been calculated by the
author.
3.3.4. Data Specification
The sample includes 26 countries, and for each of them, 23 industries are all selected from
the manufacturing sector at the two-digit International Standard Industrial Classification
(ISIC) Rev.3 level from UNIDO. The time period under consideration is 1995 to 2007. The
dependent variables are the industry growth of manufacturing value added and net firm entry
and the panel data set is unbalanced. The justification for country sample and time period
have been provided in the previous chapter. However, because this panel includes cross-
industry data and data is not consistently available at this level for all countries in our sample,
thus, our country sample is reduced from 31 to 26 countries. Our justification for using this
classification is that we have more consistent data at industry-level for our country sample
and time period under consideration.
In Table 3.2, we show the correlation matrix between key variables that have been used in the
study. A few important relationships that might be of interest to us include the significant
positive relationship between manufacturing value added growth rate and net firm entry. In
other words, it is possible that industries that experience growth in manufacturing value
added also experience an increase in net firm entry. We also see that foreign bank entry has
negative significant relationship with manufacturing value added growth, echoing our results
in the previous chapter, but its relationship with net firm entry is significant and positive.
However, bank concentration has a negative significant relationship with net firm entry. This
might mean that while bank concentration might promote the growth of manufacturing
industries, it also has the ability to impede the entry of new firms into the industry.
58
sec
,emp
ind
k emp
NISE
N where
emp
indN is the number of employees in industry k, and
sec
empN is the total number of
employees in the manufacturing sector.
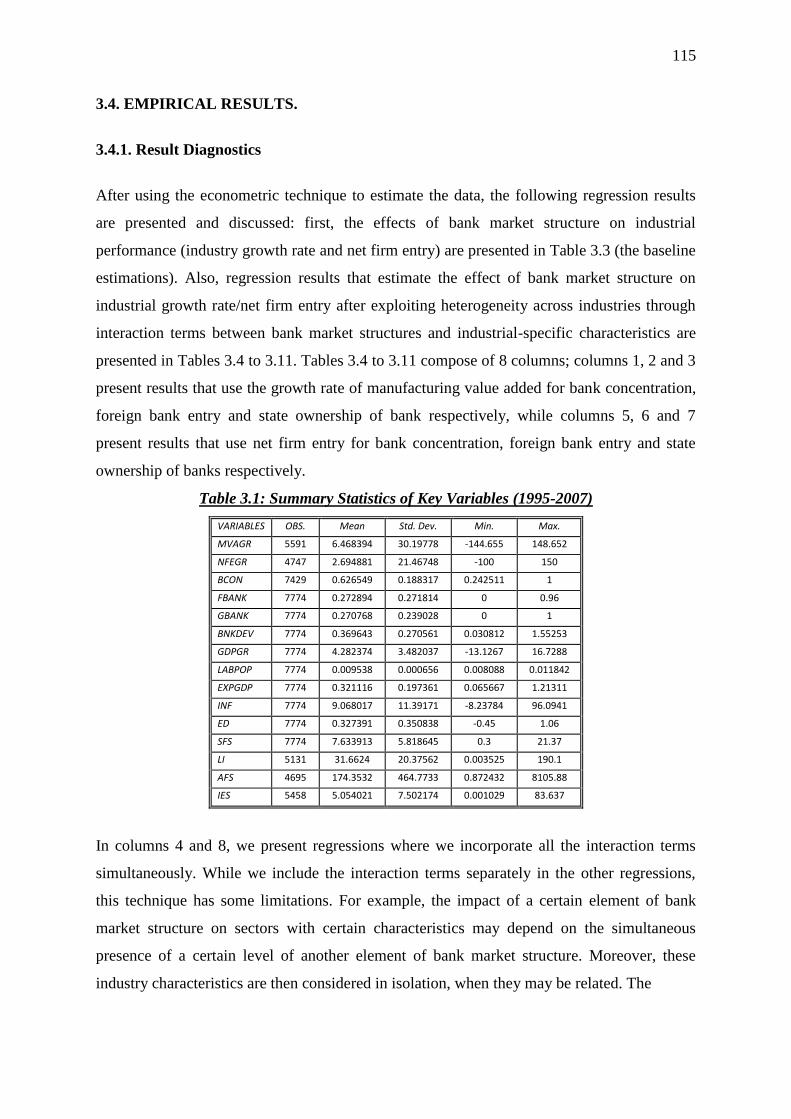
115
3.4. EMPIRICAL RESULTS.
3.4.1. Result Diagnostics
After using the econometric technique to estimate the data, the following regression results
are presented and discussed: first, the effects of bank market structure on industrial
performance (industry growth rate and net firm entry) are presented in Table 3.3 (the baseline
estimations). Also, regression results that estimate the effect of bank market structure on
industrial growth rate/net firm entry after exploiting heterogeneity across industries through
interaction terms between bank market structures and industrial-specific characteristics are
presented in Tables 3.4 to 3.11. Tables 3.4 to 3.11 compose of 8 columns; columns 1, 2 and 3
present results that use the growth rate of manufacturing value added for bank concentration,
foreign bank entry and state ownership of bank respectively, while columns 5, 6 and 7
present results that use net firm entry for bank concentration, foreign bank entry and state
ownership of banks respectively.
Table 3.1: Summary Statistics of Key Variables (1995-2007)
VARIABLES OBS. Mean Std. Dev. Min. Max.
MVAGR 5591 6.468394 30.19778 -144.655 148.652
NFEGR 4747 2.694881 21.46748 -100 150
BCON 7429 0.626549 0.188317 0.242511 1
FBANK 7774 0.272894 0.271814 0 0.96
GBANK 7774 0.270768 0.239028 0 1
BNKDEV 7774 0.369643 0.270561 0.030812 1.55253
GDPGR 7774 4.282374 3.482037 -13.1267 16.7288
LABPOP 7774 0.009538 0.000656 0.008088 0.011842
EXPGDP 7774 0.321116 0.197361 0.065667 1.21311
INF 7774 9.068017 11.39171 -8.23784 96.0941
ED 7774 0.327391 0.350838 -0.45 1.06
SFS 7774 7.633913 5.818645 0.3 21.37
LI 5131 31.6624 20.37562 0.003525 190.1
AFS 4695 174.3532 464.7733 0.872432 8105.88
IES 5458 5.054021 7.502174 0.001029 83.637
In columns 4 and 8, we present regressions where we incorporate all the interaction terms
simultaneously. While we include the interaction terms separately in the other regressions,
this technique has some limitations. For example, the impact of a certain element of bank
market structure on sectors with certain characteristics may depend on the simultaneous
presence of a certain level of another element of bank market structure. Moreover, these
industry characteristics are then considered in isolation, when they may be related. The

116
Table3.2: Pairwise Correlation Matrix for Bank Market Structure and Other Key Variables (1995 – 2007)
MVAGR NFEGR BCON FBANK GBANK BNKDEV GDPGR LABPOP EXPGDP INF LI AFZ IES
MVAGR 1.00
NFEGR 0.073*** 1.00
BCON 0.011 -0.086*** 1.00
FBANK -0.046*** 0.084*** -0.003 1.00
GBANK -0.014 -0.005 -0.045*** -0.259*** 1.00
BNKDEV 0.042*** 0.122*** -0.220*** -0.306*** -0.281*** 1.00
GDPGR 0.076*** 0.048*** 0.085*** -0.071*** 0.052*** -0.016 1.00
LABPOP 0.005 -0.026* 0.031*** 0.013 0.086*** -0.273*** -0.044*** 1.00
EXPGDP 0.027** 0.020 0.196*** 0.110*** -0.294*** 0.233*** 0.032*** -0.008 1.00
INF -0.017 -0.109*** -0.042*** -0.117*** 0.083*** -0.096*** -0.042*** -0.124*** 0.058*** 1.00
LI -0.087*** 0.007 0.042*** 0.110*** -0.065*** 0.071*** -0.093*** 0.117*** 0.022 -0.049*** 1.00
AFZ -0.004 0.001 0.141*** 0.109*** -0.01 -0.106*** 0.027* 0.104*** -0.03** -0.054*** 0.035** 1.00
IES -0.013 -0.019 0.026* 0.025* 0.004 -0.023* 0.016 0.006 0.026* 0.018 -0.002 0.112*** 1.00
Note: This table reports the correlation matrix of key variables used in the regression, where * indicates significance at the 10% level, ** indicates significance at the 5% level, and *** indicates significance at the 1% leve

117
relevant regression tests have been included at the end of the tables. As in Chapter 2, we
present some scatter plots on using the variable averages to show the relationship on the
relationship between bank market structure and growth in manufacturing value added/net
firm entry over subsamples with the aim of showing stability of coefficients during the
period59
and we find some stability of the coefficients from these plots.
3.4.2. Baseline Model: Cross-Country Effect.
In Table 3.3 we report the results for regressions based on the specifications in (3.1) and
(3.2). The main results to focus on are that bank concentration has a positive and insignificant
effect, while foreign bank entry and state ownership of banks have negative and significant
effects on the growth in manufacturing value added of industries. On the other hand, bank
concentration and foreign bank entry have negative and significant effects, while state
ownership of banks has a positive and significant effect on net firm entry. The result based on
manufacturing value added growth are similar to the PMG long-run and FE results in Chapter
2 , so, we try to explain the results based on net firm entry. In column 2 of Table 3.3, the bank
concentration coefficient reveals a negative relationship with net firm entry. This result
supports the view that banks with market power reduce the supply of loans to potential
entrepreneurs looking to start new businesses. The result does not support the view which
suggests that banks with market power help new firms by developing lending relationships.
The foreign bank ownership coefficient also suggests a negative relationship with net firm
entry. We interpret the results as great reluctance by foreign banks to engage in relationship
lending with potential entrants. This is likely to happen because new entrants are unlikely to
have hard information and loan officers of these banks find it difficult to communicate soft
information with bank’s headquarters abroad. Thus, because they have little discretion to
provide loans based on soft information, they will have to rely on hard information.
The result does not appear to support the view that foreign bank presence benefits all firms.
The coefficient of state owned banks reveals a positive relationship with net firm entry. This
result might be linked to the ability of government to influence how banks allocate credit.
The government relies on directed credit through it banks. The rationales for direct credit in
developing countries are underdeveloped tax systems, its success in East Asia, its
59
In appendix 3.2, we split the time period into 3 subsample (period 1, 1995-1998; period 2, 1999-2002; and
period 3, 2003-2007).

118
effectiveness, and possible economies of scope and the targets are mostly firms in the
manufacturing sector (technology) and exporting firms (Stiglitz et al. 1993). Such credits are
likely to go to new entrants as reflected in our results. However, the coefficient on
manufacturing growth shows a negative relationship.
We try to reconcile these results by suggesting that, while state ownership of banks might
negatively affect the growth of manufacturing added (maybe as a result of politicizing
lending decisions, softening budget constraints, and diverting funds towards politically
motivated projects rather than economically viable ones); its direct credit schemes may be
effective for some firms, particularly new ones.
Table 3.3: Baseline Models for Industry Growth and Net Firm Entry
1 2
Variables MVAGR NFEGR
MVAGRt-1 0.0478**
(0.024)
NFEGRt-1 -0.239* (0.133)
BCON 0.00232 -0.103*** (0.023) (0.027)
FBANK -0.0970*** -0.179*** (0.026) (0.035)
GBANK -0.0351* 0.165*** (0.021) (0.029)
BNKDEV 0.0286* 0.0391** (0.017) (0.020)
GDPGR 0.337** 0.368** (0.150) (0.185)
LABPOP 11.60
(7.144)
HUMCAP 0.835*** (0.212)
EXPGDP 0.0382* 0.0581** (0.021) (0.028)
INF -0.00552** -0.165** (0.002) (0.073)
CONS. -3.400 1.157
(7.636) (3.187)
No of Obs. 4516 3756
AR(1) test -13.37 (0.000)
-2.05 (0.041)
AR(2) test -0.42 (0.677)
-1.10 (0.272)
Hansen test 3.71 (0.156)
0.38 (0.827)
The robust standard errors are in parentheses, where * indicates significance at the 10% level, **
indicates significance at the 5% level and ***
at 1% level. AR(1) and AR(2) are p-values and t-statistics of the test of first and second order autocorrelations and Hansen is the p-value and t-statistic of the Hansen test of overidentifying-restrictions.

119
3.4.3. Interaction Models: Industry-Specific Effects.
3.4.3.1. External Financial Dependence
In Table 3.4, we report the results of regressions based on the specifications in (3.3) and
(3.4), where we include the interaction terms between external financial dependence and bank
market structure. Also, we include external financial dependence by itself as a regressor.
Interaction terms are only significant in columns 4 and 8 (where the interaction terms have
been included simultaneously). In column 4, the coefficient of the interaction term between
foreign ownership of banks and external finance dependence is negatively related to
manufacturing growth. Based on significant interaction term in column 4, the elasticity is -
0.15.60
The marginal effect of foreign bank ownership on manufacturing growth falls by a
negative 0.15 percentage points when external finance dependence increases by 1percent. At
high levels of foreign bank presence, industries that depend more on external finance do
benefit. Put differently, industries that depend more on external finance, grow slower when
the presence of foreign banks is high. This result does not support the view which suggests
that industries which depend more on external finance grow faster in the presence of foreign
banks. To calculate the total impact of the interaction term on industrialization, we compute
the elasticities in the same form as Chapter 2. In column 8, the coefficient of the interaction
term between bank concentration and external finance dependence suggest a positive
relationship with net firm entry. The elasticities of the interaction terms with bank
concentration, foreign ownership of banks and state ownership of banks on net firm entry are
1.32, -1.60 and 2.15 respectively.61
The elasticities indicate that the marginal effect of bank
concentration and state ownership of banks on net firm entry increase by 1.32 and 2.15
percentage points, while the effect of foreign ownership of banks is a negative 1.60
percentage points when external finance dependence increases by 1 percent. Based on the
results, those industries that are more financially dependent tend to experience fast growth of
new entrants when the level of bank concentration is high. This result does not support the
argument that bank concentration induces concentration in industries that depend more on
external finance.
60
Standard error is 0.08738. 61
Standard errors: 0.84353, 0.69757, and 0.78628.

120
Table 3.4: External Financial Dependence
1 2 3 4 5 6 7 8
Variables MVAGR MVAGR MVAGR MVAGR NFEGR NFEGR NFEGR NFEGR
MVAGRt-1 0.0480** 0.0476** 0.0480** .0476**
(0.024) (0.024) (0.024) (0.024)
NFEGRt-1 -0.240* -0.244
* -0.236* -0.245
*
(0.134) (0.131) (0.133) (0.131)
BCON -0.00222 0.00211 0.00193 0.0012 -0.119*** -0.102*** -0.0976*** -0.115***
(0.032) (0.023) (0.023) (0.032) (0.0350) (0.0268) (0.0261) (0.0341)
BCON ×ED 0.0146 0.00097 0.0594 0.097*
(0.073) (0.074) (0.071) (0.067)
FBANK -0.0970*** -0.0985*** -0.0823*** -0.0698** -0.179*** -0.145*** -0.193*** -0.136***
(0.026) (0.026) (0.030) (0.032) (0.0353) (0.0477) (0.0394) (0.0473)
GBANK -0.0352* -0.00978 -0.0356* -0.0016 0.165*** 0.166*** 0.166*** 0.175***
(0.021) (0.026) (0.021) (0.027) (0.0292) (0.0289) (0.0292) (0.0292)
BNKDEV 0.0286* 0.0280
* 0.0286* 0.0276
* 0.0386
* 0.0389** 0.0394
** 0.0432**
(0.017) (0.017) (0.017) (0.017) (0.0199) (0.0198) (0.0200) (0.0199)
GDPGR 0.337** 0.338
** 0.336** 0.333
** 0.373
** 0.373** 0.378
** 0.411**
(0.150) (0.150) (0.150) (0.150) (0.186) (0.185) (0.186) (0.184)
LABPOP 11.69 11.54 11.60 11.431
(7.124) (7.159) (7.143) (7.111)
HUMCAP 0.843*** 0.849*** 0.848*** 0.898***
(0.212) (0.211) (0.212) (0.206)
EXPGDP 0.0384* 0.0380
* 0.0385* 0.0381
* 0.0584
** 0.0595** 0.0519
* 0.0371
(0.021) (0.021) (0.021) (0.21) (0.0280) (0.0280) (0.0275) (0.0265)
INF -0.00553*** -0.00550*** -0.00551** -0.00548*** -0.167** -0.166** -0.163** -0.156**
(0.002) (0.002) (0.002) (0.002) (0.0735) (0.0733) (0.0742) (0.0757)
ED -1.170 2.053 1.214 5.754 -2.641 3.763* -1.779 -0.0903**
(4.757) (2.156) (2.581) (6.365) (4.073) (2.224) (2.240) (0.0455)
FBANK ×ED -0.0873 -0.119* -0.128 -0.378***
(0.066) (0.071) (0.109) (0.133)
GBANK ×ED -0.0498 -0.0985 0.0912 0.367***
(0.075) (0.081) (0.0755) (0.0829)
CONS. -3.134 -3.858 -3.730 -4.738 1.812 -0.0300 0.687 0.0705
(7.728) (7.626) (7.536) (7.709) (3.447) (3.313) (3.256) (3.569)
No of Obs. 4516 4516 4516 4516 3756 3756 3756 3756
AR(1) test -13.37 (0.000)
-13.37 (0.000)
-13.37 (0.000)
-13.37 (0.000)
-2.03 (0.042)
-2.05 (0.041)
-2.06 (0.039)
-2.04 (0.041)
AR(2) test -0.41 (0.678)
-0.42 (0.674)
-0.41 (0.680)
-0.42 (0.673)
-1.10 (0.272)
-1.16 (0.246)
-1.07 (0.285)
-1.16 (0.245)
Hansen test 3.71 (0.457)
3.58 (0.167)
3.69 (0.158)
3.51 (0.173)
0.38 (0.805)
0.35 (0.839)
0.41 (0.816)
0.39 (0.823)
The robust standard errors are in parentheses, where * indicates significance at the 10% level, ** indicates significance at the 5% level and *** at 1% level. AR(1) and AR(2) are p-values and t-statistics of the test of first and second order autocorrelations and Hansen is the p-value and t-statistic of the Hansen test
of overidentifying - restrictions.
Similarly, the interaction between state ownership of banks and external finance dependence
supports the view that the growth of new entrants is faster in industries that depend more on
external finance when the presence of state owned banks is higher. On the other hand, since
the coefficient of the interaction between foreign ownership of banks and external finance
dependence is negative, we find that in those industries that are more dependent on external
finance, there is a slower growth of new entrants, when foreign bank presence is high,
suggesting that foreign banks may lead to concentration in industries that depend more on
external finance. In Table 3.3, interaction terms are only significant in specifications where
we have included them simultaneously. This might occur because it is possible, in a sense,
that the elements of banks market structure are proxying each other.

121
3.4.3.2. Small Firm Share
In Table 3.5, we report the results of regressions based on the specifications where we
include the interaction terms between small firm share and bank market structure variables. In
columns 2 and 4, the interaction between foreign bank ownership and small firm share is
positively related to manufacturing growth. The results indicate that industries composed of
small firms grow faster in countries where foreign bank presence is high because they face
lower financing obstacles.
Table 3.5: Small Firm Share 1 2 3 4 5 6 7 8
Variables MVAGR MVAGR MVAGR MVAGR NFEGR NFEGR NFEGR NFEGR
MVAGRti1 0.0478** 0.0469** 0.0476** 0.0469**
(0.024) (0.024) (0.024) (0.025)
NFEGRt-1 -0.243* -0.239* -0.237* -0.243*
(0.133) (0.133) (0.133) (0.133)
BCON 0.00227 0.00182 0.00162 -0.0170 -0.0177 -0.104*** -0.104
*** -0.0165
(0.039) (0.023) (0.023) (0.039) (0.0420) (0.0271) (0.0270) (0.0421)
BCON ×SFS -0.0000474 0.00246 -0.0113** -0.0114**
(0.004) (0.004) (0.00505) (0.00503)
FBANK -0.0970*** -0.177*** -0.0970*** -0.179*** -0.180*** -0.148*** -0.179*** -0.159***
(0.026) (0.040) (0.026) (0.0423) (0.0353) (0.0556) (0.0351) (0.0529)
GBANK -0.0354* -0.0356* -0.0108 -0.0337 0.165*** 0.164*** 0.133*** 0.134***
(0.021) (0.021) (0.035) (0.036) (0.0288) (0.0287) (0.0434) (0.0398)
BNKDEV 0.0282* 0.0275* 0.0281* 0.0275* 0.0385* 0.0384* 0.0386* 0.0388**
(0.017) (0.017) (0.017) (0.17) (0.0197) (0.0196) (0.0198) (0.0197)
GDPGR 0.336** 0.336** 0.338** 0.337** 0.373** 0.368** 0.366** 0.374**
(0.150) (0.150) (0.150) (0.149) (0.185) (0.184) (0.184) (0.184)
LABPOP 11.52 11.33 11.49 11.31
(7.146) (7.207) (7.149) (7.194)
HUMCAP 0.835*** 0.835*** 0.834*** 0.836***
(0.210) (0.214) (0.211) (0.211)
EXPGDP 0.0382* 0.0383* 0.0387* 0.0384* 0.0585** 0.0584** 0.0582** 0.0581**
(0.021) (0.020) (0.021) (0.019) (0.0279) (0.0281) (0.0280) (0.0278)
INF -0.00551** -0.00546** -0.00548** -0.00545*** -0.165** -0.167** -0.167** -0.166**
(0.002) (0.002) (0.002) (0.002) (0.0728) (0.0735) (0.0735) (0.0728)
SFS 0.143 -0.178 0.226** -0.337 0.811** 0.199 -0.0134 0.766
(0.255) (0.132) (0.112) (0.334) (0.343) (0.154) (0.170) (0.360)
FBANK ×SFS 0.0105*** 0.0109*** -0.00407 -0.00255
(0.004) (0.004) (0.00663) (0.00631)
GBANK ×SFS -0.00318 -0.0027 0.00410 0.00399
(0.003) (0.003) (0.00499) (0.00428)
CONS. -4.348 -1.688 -4.960 -0.449 -4.987 -0.271 1.330 -4.662
(7.772) (7.969) (7.725) (8.103) (4.042) (3.409) (3.436) (3.997)
No of Obs. 4516 4516 4516 4516 3756 3756 3756 3756
AR(2) test -13.36 (0.000)
-13.35 (0.000)
-13.37 (0.000)
-13.35 (0.000)
-2.03 (0.043)
-2.05 (0.040)
-2.06 (0.040)
-2.02 (0.043)
AR(2) test -0.42 (0.678)
-0.44 (0.662)
-0.42 (0.675)
-0.43 (0.664)
-1.13 (0.260)
-1.10 (0.270)
-1.08 (0.280)
-1.14 (0.256)
Hansen test 3.73 (0.155)
3.48 (0.176)
3.63 (0.163)
3.46 (0.177)
0.36 (0.837)
0.38 (0.826)
0.40 (0.820)
0.36 (0.837)
The robust standard errors are in parentheses, where * indicates significance at the 10% level, ** indicates significance at the 5% level and *** at 1% level. AR(1) and AR(2) are p-values and t-statistics of the test of first and second order autocorrelations and Hansen is the p-value and t-statistic of the Hansen test of overidentifying - restrictions
The elasticities of both interaction terms on manufacturing growth are a positive 0.39 and
0.40 percentage points.62
The elasticities indicate that the marginal effect of foreign bank
ownership on manufacturing growth increases by 0.39 and 0.40 percentage points when
62
The standard errors are 0.14311 and 0.15862.

122
industry small firm share increases by 1 percent. In columns 5 and 8, the coefficient of the
interaction between bank concentration and small firm share is negatively related to net firm
entry. The elasticities of the interaction terms in columns 5 and 8 on net firm entry are
negative 3.56 and 3.61 percentage points63
. The elasticities indicate that the marginal effect of
bank concentration on net firm entry falls by 3.56 and 3.61 percentage points when industry
small firm share increases by 1 percent. Banks with market power might be unwilling to
develop lending relationships with new entrants to into industries composed of small firms to
reduce the likelihood that incumbents (firms which they support financially) will face further
competition. By doing this, bank concentration is likely to lead to concentration in industries
composed of small firms, and thus industry monopoly profits.
3.4.3.3. Average Firm Size
In Table 3.6, we report the results of regressions where we include the interaction terms
between average firm size and bank market structure variables. In columns 1 and 4, the
coefficients of the interaction between average firm size and bank concentration are
positively related to manufacturing growth. Based on the coefficients in both columns, the
elasticities indicate that the marginal effect of bank concentration on manufacturing growth
increases by 0.30 and 0.31 percentage points when industry average firm size increases by 1
percent. The results indicate that banks with market power are more likely to develop lending
relationships with large domestic firms; resulting in continued financial support towards. For
that reason, industries composed of large firms are expected to growth faster when the level
of bank concentration is high. In columns 5 and 7, the coefficient of the interaction between
bank concentration/state ownership of banks and average firm size is positively related with
net firm entry, while the interaction term with foreign bank ownership in column 6 is
negatively related to net firm entry. In column 8, the coefficients for bank concentration and
foreign bank ownership interactions are consistent with the results in columns 5 and 6.
63
The standard errors are 1.78929 and 1.8003.

123
Table 3.6: Average Firm Size 1 2 3 4 5 6 7 8
Variables MVAGR MVAGR MVAGR MVAGR NFEGR NFEGR NFEGR NFEGR
MVAGRt-1 0.0511* 0.0512* 0.0519* 0.0512*
(0.028) (0.028) (0.028) (0.028)
NFEGRt-1 -0.331** -0.349
** -0.317** -0.349
**
(0.152) (0.153) (0.153) (0.153)
BCON -0.0132 0.00881 0.00865 -0.127 -0.0967*** -0.0424 -0.0504* -0.0637**
(0.035) (0.036) (0.036) (0.036) (0.0305) (0.0275) (0.0274) (0.0309)
BCON×AFS 0.000227** 0.000232* 0.000574*** 0.000191**
(0.0001) (0.0001) (0.000125) (0.000119)
FBANK -0.0600 -0.0545 -0.0622 -0.0574 -0.182*** -0.103
*** -0.188*** -0.113
***
(0.039) (0.041) (0.039) (0.0419) (0.0316) (0.0323) (0.0342) (0.0333)
GBANK -0.0559* -0.0539* -0.0493* -0.0489* 0.0871*** 0.103*** 0.0613* 0.0859***
(0.029) (0.029) (0.029) (0.029) (0.0300) (0.0294) (0.0333) (0.0303)
BNKDEV -0.0128 -0.0103 -0.00874 -0.0125 0.0361 0.0435** 0.0320 0.0395
*
(0.024) (0.024) (0.023) (0024) (0.0223) (0.0214) (0.0219) (0.0215)
GDPGR -0.265 -0.262 -0.263 -0.267 0.540** 0.545** 0.503** 0.561***
(0.193) (0.193) (0.193) (0.193) (0.213) (0.215) (0.210) (0.215)
LABPOP -1.036 -0.330 -0.455 -0.607
(8.007) (8.033) (7.965) (8.137)
HUMCAP 0.512** 0.754*** 0.830*** 0.736***
(0.231) (0.215) (0.244) (0.216)
EXPGDP 0.00270 0.00139 0.00195 0.00189 -0.0117 -0.0194 0.00428 -0.0151
(0.028) (0.028) (0.028) (0.028) (0.0303) (0.0296) (0.0314) (0.0300)
INF 0.0000667 -0.000341 -0.000443 0.0000315 -0.117 -0.149** -0.123* -0.148**
(0.002) (0.002) (0.002) (0.002) (0.0725) (0.0717) (0.0723) (0.0722)
AFS -0.0212** -0.000823 -0.000476 -0.0198* -0.0566*** -0.0000201 -0.0151** 0.0202**
(0.011) (0.001) (0.001) (0.012) (0.0121) (0.000940) (0.00590) (0.00905)
FBANK×AFS -0.0000554 -0.0000153 -0.000259*** -0.000322***
(0.0001) (0.0001) (0.0000558) (0.0000643)
GBANK×AFS -0.0000267 -0.00005 0.000281** 0.000401
(0.000) (0.000) (0.000132) (0.000341)
CONS. 17.60* 14.80 14.82 16.92 8.135** -0.541 2.927 2.109
(9.392) (9.482) (9.395) (9.705) (3.431) (2.977) (3.384) (3.261)
No of Obs. 3212 3212 3212 3212 3588 3588 3588 3588
AR(1) test -10.70 (0.000)
-10.69 (0.000)
-10.73 (0.000)
-10.69 (0.000)
-1.32 (0.186)
-1.21 (0.227)
-1.38 (0.169)
-1.22 (0.223)
AR(2) test -0.79 (0.429)
-0.83 (0.404)
-0.82 (0.410)
-0.78 (0.433)
-1.50 (0.135)
-1.58 (0.113)
-1.45 (0.148)
-1.58 (0.114)
Hansen test 0.20 (0.906)
0.24 (0.889)
0.19 (0.908)
0.19 (0.869)
1.87 (0.393)
2.04 (0.360)
2.23 (0.329)
2.03 (0.362)
The robust standard errors are in parentheses, where * indicates significance at the 10% level, ** indicates significance at the 5% level and *** at 1% level. AR(1) and AR(2) are p-values and t-statistics of the test of first and second order autocorrelations and Hansen is the p-value and t-statistic of the Hansen test of overidentifying – restrictions.
The interaction term in columns 1 and 4 indicates that Banks with market power develop a
lending relationship with firms when they are young and continue to lend to them when they
become incumbents (or large firms). The marginal effect of bank concentration on
manufacturing growth based on the coefficients in columns 1 and 4 are a positive 0.30 and
0.31 percentage points when industry average firms size increases by 1 percent.64
This results
into faster growth of industries composed of large firms when the level of bank concentration
is high. In columns 5 and 8, the interaction terms with bank concentration are positively
related to net firm entry. The marginal effect of bank concentration on net firm entry based
on these coefficients are positive 6.99 and 2.35 percentage points when average firm size
increases by 1 percent.65
These results indicate that more bank concentration promotes faster
growth in the entry of large firms into industries composed of large firms. These results are in
64
Standard error (0.15437 and 0.17129). 65
Standard errors (4.05435 and 1.61576)

124
line with the results in the previous section where bank concentration represents a barrier to
entry into industries composed of small firms.
In column 7, the interaction term is positively related to net firm entry, suggesting state
owned banks promote the entry of large firms in to industries composed of large firms. The
marginal effect of state ownership of banks on net firm entry increases by 1.2266
percentage
points when industry average firm size increase by 1 percent. A possible indication of the
result is that state owned bank promotes ‘national champions’. By national champions, we
mean the most successful domestic firms (which are likely to be large firms) in terms of
performance, local content application, employment rate of domestic nationals and its
contribution to the development process. State owned banks would probably promote the
start-up of firms that fall under this category. Hence, while they might shift towards large
firms under exceptional terms, overall entry is made easier in the presence of state owned
banks. In columns 6 and 8, the interaction term is negatively related to net firm entry,
suggesting that growth of entry into industries composed of large firms slows down when
foreign bank presence is high. The marginal effect of foreign bank ownership on net firm
entry based on the coefficients falls by -1.40 and -1.1167
percentage points when average firm
size increases by 1 percent. This result might indicate that is that foreign banks are not likely
to lend to large domestic entrants because they could compete with their existing clients
(large domestic firms or multinationals). If entrants are funded at all, they are more likely to
be small than large.
3.4.3.4. Labour Intensity
In Table 3.7, we report the results of regressions where we include the interaction terms
between labour-intensity and bank market structure. In columns 1 and 4, the interaction terms
suggest that bank concentration promotes the growth of industries composed of labour-
intensive firms. The marginal effect of bank concentration on manufacturing growth
increases by 1.05 and 0.85 percentage points when industry labour-intensiveness increases by
1 percent percentage point68
. The results indicate that banks with market power are more
likely to finance large firms which are labour intensive (i.e. have a large workforce). In
developing countries, banks would rather finance firms that use low technology than firms
66
Standard error (0.95411). 67
Standard errors (0.76104 and 0.65275). 68
Standard errors (0.40709 and 0.43804).

125
that use high technology in their production process because of the risk that might be
associated with application of technology that is advanced and new. We make reference to
technology because low technological intensity is positively associated with labour intensive
industries. In other words, banks in developing countries are unlikely to finance firms that use
technology where they are not competitive.
Table 3.7: Labour Intensity
1 2 3 4 5 6 7 8
Variables MVAGR MVAGR MVAGR MVAGR NFEGR NFEGR NFEGR NFEGR
MVAGRt-1 0.0664** 0.0646** 0.0657** 0.0653***
(0.027) (0.027) (0.027) (0.027)
NFEGRt-1 -0.202 -0.202 -0.195 -0.193
(0.150) (0.149) (0.148) (0.147)
BCON -0.0775* 0.0278 0.0275 -0.0572 -0.0686 -0.0767
*** -0.0918*** -0.0898
*
(0.045) (0.025) (0.026) (0.0456) (0.0502) (0.0264) (0.0268) (0.0492)
BCON ×LI 0.00346*** 0.00283** -0.000308 -0.000222
(0.001) (0.001) (0.00173) (0.00161)
FBANK -0.0619** 0.0372 -0.0707*** 0.0302 -0.171*** -0.170** -0.168*** 0.128**
(0.027) (0.058) (0.026) (0.0591) (0.0367) (0.0669) (0.0367) (0.0667)
GBANK -0.0469* -0.0492
** -0.0761** -0.0331 0.123
*** 0.124*** 0.210
*** 0.221***
(0.024) (0.023) (0.037) (0.041) (0.0291) (0.0292) (0.0471) (0.0465)
BNKDEV -0.000559 -0.00115 0.00170 -0.00261 0.0421** 0.0426** 0.0379* 0.0351*
(0.020) (0.020) (0.020) (0.020) (0.0210) (0.0207) (0.0200) (0.0196)
GDPGR 0.277* 0.290* 0.287* 0.280* 0.455** 0.458** 0.433** 0.440**
(0.159) (0.161) (0.161) (0.159) (0.218) (0.218) (0.216) (0.215)
LABPOP 5.146 4.991 9.880 1.551
(7.939) (8.010) (7.724) (8.154)
HUMCAP 0.857*** 0.855*** 0.965*** 0.947***
(0.221) (0.222) (0.227) (0.227)
EXPGDP 0.0329 0.0254 0.0325 0.0258 0.0256 0.0256 0.0441 0.0440
(0.021) (0.021) (0.022) (0.0216) (0.0292) (0.0291) (0.0289) (0.0287)
INF -0.00600*** -0.00629*** -0.00568*** -0.00649*** -0.142** -0.144** -0.123* -0.129*
(0.002) (0.002) (0.002) (0.00225) (0.0705) (0.0694) (0.0680) (0.0691)
LI -0.335*** -0.00324 -0.118*** -0.200 -0.0266 -0.0465 0.0434 0.0927
(0.091) (0.045) (0.040) (0.133) (0.127) (0.0530) (0.0509) (0.129)
FBANK ×LI -0.00332** -0.00289* -0.0000593 -0.00131
(0.001) (0.001) (0.00207) (0.00207)
GBANK ×LI 0.000456 0.000175 -0.00265** -0.00303**
(0.001) (0.001) (0.00106) (0.00169)
CONS. 11.82 2.420 1.255 11.24 -0.889 -0.397 -3.877 -5.229
(9.148) (8.307) (8.438) (9.410) (4.423) (3.274) (3.456) (4.654)
No of Obs. 3738 3738 3738 3738 3447 3447 3447 3447
AR(1) -11.51 (0.000)
-11.59 (0.000)
-11.55 (0.000)
-11.55 (0.000)
-1.94 (0.052)
-1.95 (0.051)
-1.98 (0.047
-2.01 (0.044)
AR(2) -0.47 (0.641)
-0.38 (0.707)
-0.41 (0.685)
-0.43 (0.668)
-0.52 (0.601)
-0.53 (0.597)
-0.48 (0.629)
-0.46 (0.643)
Hansen test 0.51 (0.774)
0.48 (0.787)
0.51 (0.775)
0.49 (0.784)
1.30 (0.523)
1.30 (0.522)
1.30 (0.521)
1.24 (0.539)
The robust standard errors are in parentheses, where * indicates significance at the 10% level, ** indicates significance at the 5% level and *** at 1% level. AR(1) and AR(2) are p-values and t-statistics of the test of first and second order autocorrelations and Hansen is the p-value and t-statistic of the Hansen test of overidentifying – restrictions.
In Columns 2 and 4, the interaction terms are negatively related to manufacturing growth
suggesting that the growth of industries composed of labour-intensive industries is slowed
down by the presence of foreign banks. The marginal effect of foreign bank ownership on
manufacturing growth based on the coefficients falls by 0.53 and 0.4669
percentage points
when labour-intensiveness in industries increase by 1 percent. Previously, foreign banks in
69
Standard errors (0.23579 and 0.25502).

126
developing countries financed firms involved in the extractive and labour-intensive
manufacturing activities. However, presently, they are more involved in the service-based
sectors. The negative effect of foreign banks on the growth of industries composed of labour
intensive industries might be linked to their lending portfolios, which is largely directed
towards multinationals and large domestic firms. Moreover, their entry could put competitive
pressure on domestic banks by reducing their profit margins and charter values, resulting in a
fall of credit towards labour intensive firms. These results are supported by Chen (2009). He
suggested that foreign bank customers are mainly capital-and technology-intensive
companies rather than labour-intensive businesses.
In columns 7 and 8, the interactions terms are negatively related to net form entry suggesting
that the growth of labour-intensive industries is slowed down by the presence of state owned
banks. The marginal effect of state owned ownership of banks on net firm entry falls by 1.39
and 1.5970
percentage points when labour-intensiveness of industries increases by 1 percent.
These results could be linked to our results in column 7 of Table 3.6, where state owned
banks are seen to positively promote start-ups of large firms in the manufacturing sector. One
explanation for this could be that state owned banks generally promote firms that are
relatively capital intensive (Lin et al. 2012). In other words, if they promote the entry of large
firms, which could most likely be ‘national champions’, it may well be that these large firms
are more capital-intensive. Also, this says that state banks may be more willing to fund
capital intensive-firms than labour-intensive firms.
3.4.3.5. High Technology-Intensity
In Table 3.8, we report the results of regressions where we include the interaction terms
between high technology intensity dummy and bank market structure variables. There are no
significant interaction terms in any of the specifications. In the next few sections, we examine
the effect of bank market structure on industry performance by employ a variety measures
that represent economic importance of industries in an economy.
70
Standard errors (0.63418 and 0.65071).

127
Table 3.8: High Technology Intensity 1 2 3 4 5 6 7 8
Variables MVAGR MVAGR MVAGR MVAGR NFEGR NFEGR NFEGR NFEGR
MVAGRt-1 0.0479** 0.0477** 0.0478** 0.0478**
(0.0236) (0.0236) (0.0236) (0.0236)
NFEGRt-1 -0.242* -0.239
* -0.239* -0.239
*
(0.133) (0.134) (0.133) (0.134)
BCON 0.00296 0.00241 0.00232 -0.00424 -0.108*** -0.103*** -0.103*** -0.123***
(0.0237) (0.0233) (0.0233) (0.0242) (0.0273) (0.0268) (0.0269) (0.0277)
BCON×HTI -0.00278 0.0299 0.0218 0.0848
(0.0158) (0.0272) (0.0178) (0.0265)
FBANK -0.0968*** -0.0901
*** -0.0969*** -0.0829
*** -0.180
*** -0.178*** -0.179
*** -0.160***
(0.0260) (0.0274) (0.0260) (0.0280) (0.0354) (0.0391) (0.0353) (0.0397)
GBANK -0.0351* -0.0350* -0.0334 -0.0316 0.165*** 0.165*** 0.166*** 0.187***
(0.0207) (0.0207) (0.0212) (0.0216) (0.0291) (0.0290) (0.0300) (0.0325)
BNKDEV 0.0287* 0.0288
* 0.0286* 0.0287
* 0.0392
** 0.0391** 0.0390
** 0.0392**
(0.0168) (0.0168) (0.0168) (0.0168) (0.0200) (0.0199) (0.0199) (0.0202)
GDPGR 0.337** 0.339** 0.338** 0.339** 0.371** 0.368** 0.369** 0.368**
(0.150) (0.150) (0.150) (0.150) (0.185) (0.185) (0.185) (0.185)
LABPOP 11.61 11.56 11.57 11.67*
(7.129) (7.163) (7.132) (7.089)
HUMCAP 0.833*** 0.835*** 0.836*** 0.839***
(0.210) (0.212) (0.212) (0.209)
EXPGDP 0.0383* 0.0389
* 0.0382* 0.0388
* 0.0570
** 0.0582** 0.0582
** 0.0572**
(0.0210) (0.0211) (0.0210) (0.0210) (0.0280) (0.0281) (0.0281) (0.0279)
INF -0.00551** -0.00550** -0.00550** -0.00551** -0.165** -0.165** -0.165** -0.163**
(0.00214) (0.00214) (0.00214) (0.00214) (0.0727) (0.0734) (0.0732) (0.0724)
FBANK×HTI -0.0269 -0.0592 -0.00428 0.00773
(0.0249) (0.0434) (0.0518) (0.0664)
GBANK×HTI -0.00727 -0.0156 -0.00534 -0.00879
(0.0334) (0.0416) (0.0314) (0.0478)
CONS. -3.430 -3.433 -3.374 -3.527 1.197 1.159 1.151 1.559
(7.630) (7.652) (7.630) (7.586) (3.183) (3.194) (3.192) (3.192)
No of Obs. 4516 4516 4516 4516 3756 3756 3756 3756
AR(1) test -13.37 (0.000)
-13.37 (0.000)
-13.37 (0.000)
-13.37 (0.000)
-2.03 (0.043)
-2.03 (0.042)
-2.04 (0.041)
-2.03 (0.042)
AR(2) test -0.41 (0.678)
-0.42 (0.675)
-0.42 (0.677)
-0.42 (0.675)
-1.12 (0.264)
-1.09 (0.275)
-1.10 (0.273)
-1.08 (0.279)
Hansen test 3.70 (0.157)
3.66 (0.161)
3.71 (0.157)
3.71 (0.157)
0.37 (0.833)
0.38 (0.825)
0.38 (0.826)
0.39 (0.824)
The robust standard errors are in parentheses, where * indicates significance at the 10% level, ** indicates significance at the 5% level and *** at 1% level. AR(1) and AR(2) are p-values and t-statistics of the test of first and second order autocorrelations and Hansen is the p-value and t-statistic of the Hansen test of overidentifying – restrictions.
3.4.3.6. Lagged Industry Value Added Ratio
In Table 3.9, we report the results of regressions where we include the interaction terms
between the lagged industry value added ratio and bank market structure variables. In
columns 1 and 4, the interaction terms are positively related to manufacturing growth,
suggesting that bank concentration promotes the growth of firms in industries that are
important to the economy (where the economic importance of industries is measured by the
lagged industry value added ratio). The marginal effect of bank concentration on the growth
of manufacturing value added increases by 0.07 and 0.1171
percentage points when
industries’ economic importance increases by 1 percent.
71
Standard errors (0.03169 and 0.05471)

128
Table 3.9: Lagged Industry Value added Ratio 1 2 3 4 5 6 7 8
Variables MVAGR MVAGR MVAGR MVAGR NFEGR NFEGR NFEGR NFEGR
MVAGRt-1 0.0409* 0.0406* 0.0406* 0.0410*
(0.0244) (0.0244) (0.0244) (0.0244)
NFEGRt-1 -0.308** -0.309
** -0.309** -0.309
**
(0.143) (0.144) (0.143) (0.143)
BCON 0.00495 0.0132 0.0120 0.0155 -0.0877*** -0.0816*** -0.0857*** -0.0792**
(0.0243) (0.0235) (0.0235) (0.0252) (0.0287) (0.0281) (0.0281) (0.0295)
BCON ×MVAR 0.00138** 0.00220** 0.000691 -0.00107
(0.000575) (0.00105) (0.000502) (0.000447)
FBANK -0.0988*** -0.105
*** -0.0996*** -0.0891
*** -0.201
*** -0.206*** -0.201
*** -0.204***
(0.0260) (0.0279) (0.0260) (0.0299) (0.0367) (0.0385) (0.0368) (0.0392)
GBANK -0.0396* -0.0400* -0.0492** -0.0379 0.129*** 0.128*** 0.119*** 0.112***
(0.0208) (0.0210) (0.0228) (0.0251) (0.0302) (0.0302) (0.0311) (0.0332)
BNKDEV 0.0146 0.0155 0.0156 0.0149 0.0410** 0.0418
** 0.0410** 0.0415
**
(0.0164) (0.0164) (0.0164) (0.0164) (0.0207) (0.0208) (0.0207) (0.0207)
GDPGR 0.392** 0.394** 0.392** 0.393*** 0.308 0.308 0.307 0.307
(0.164) (0.164) (0.164) (0.164) (0.201) (0.202) (0.201) (0.201)
LABPOP 11.46 12.30* 11.64 11.21
(7.114) (7.164) (7.138) (7.142)
HUMCAP 0.780*** 0.779*** 0.786*** 0.791***
(0.228) (0.228) (0.228) (0.228)
EXPGDP 0.0388* 0.0384
* 0.0393* 0.0389
* 0.0299 0.0286 0.0322 0.0307
(0.0207) (0.0206) (0.0206) (0.0206) (0.0287) (0.0286) (0.0287) (0.0285)
INF -0.00732*** -0.00734*** -0.00730*** -0.00729*** -0.158** -0.157** -0.160** -0.159**
(0.00227) (0.00227) (0.00227) (0.00226) (0.0760) (0.0762) (0.0759) (0.0761)
FBANK ×MVARt-1 0.000733 -0.00196 0.000689 0.000534
(0.000943) (0.00139) (0.000685) (0.000395)
GBANK ×MVARt-1 0.00217* -0.000345 0.00236* 0.00375*
(0.00130) (0.00186) (0.00123) (0.00228)
CONS. -2.907 -3.769 -3.183 -2.656 4.120 3.962 4.017 3.831
(7.608) (7.645) (7.620) (7.628) (3.137) (3.114) (3.134) (3.138)
No of Obs. 4184 4184 4184 4184 3612 3612 3612 3612
AR(1) test -12.34 (0.000)
-12.34 (0.000)
-12.34 (0.000)
-12.34 (0.000)
-1.49 (0.137)
-1.48 (0.138)
-1.49 (0.137)
-1.48 (0.139)
AR(2) test -0.64 (0.522)
-0.66 (0.507)
-0.66 (0.511)
-0.63 (0.530)
-1.36 (0.174)
-1.36 (0.174)
-1.36 (0.173)
-1.37 (0.171)
Hansen test 2.84 (0.497)
2.85 (0.488)
2.80 (0.491)
2.83 (0.494)
1.07 (0.585)
1.10 (0.578)
1.06 (0.589)
1.07 (0.584)
The robust standard errors are in parentheses, where * indicates significance at the 10% level, ** indicates significance at the 5% level and *** at 1% level. AR(1) and AR(2) are p-values and t-statistics of the test of first and second order autocorrelations and Hansen is the p-value and t-statistic of the Hansen test of overidentifying – restriction.
Our result in column 1 suggests that important industries are favored. For example, if banks
with market power lend to firms in the food and beverage industry, they continue lending to
firms in this industry. This might mean that incumbents are favored, but strictly speaking, the
results do not rule out the fact new firms in the food and beverage industry get funding. Put
differently, the evidence is that, with concentrated banking systems, information capital is
vital: if they lend to an industry, they acquire knowledge in the industry and continue to lend
to it.
In columns 3, 7 and 8, the interaction terms are positively related to manufacturing growth
and net firm entry, suggesting that state owned banks promote the growth of as well as the
entry into industries of economic importance. The marginal effect of state ownership of banks
on manufacturing growth increases by 0.05 percentage points; while its effect on net firm
entry increases by 0.18 and 0.8 percentage points when economic importance of industries
increase by 1 percent. The results indicate that firms in important industries are favored by

129
state banks and may also mean that incumbents as well as entrants into the manufacturing
industry get funding from state banks. Some of the incumbents may fall under the category of
‘national champions’, which are likely to be funded by state banks.
3.4.3.7. Initial Industry Value Added Ratio
In Table 3.10, we report the results of regression where we include the interaction terms
between the initial industry value added ratio and bank market structure variables. In columns
6 and 8, the interaction terms are positive, signifying that foreign banks slow down the
growth of entry into industries of economic importance (when economic importance is
measures as the initial industry value added ratio) when the presence of foreign banks is high.
Table 3.10: Initial Industry Value Added Ratio
1 2 3 4 5 6 7 8
Variables MVAGR MVAGR MVAGR MVAGR NFEGR NFEGR NFEGR NFEGR
MVAGRt-1 0.0237 0.0237 0.0237 0.0238
(0.0240) (0.0240) (0.0240) (0.0239)
NFEGRt-1 -0.268* -0.269* -0.268* -0.269*
(0.157) (0.157) (0.157) (0.157)
BCON -0.0154 -0.00540 -0.00570 -0.0149 -0.105*** -0.103*** -0.106*** -0.116***
(0.0316) (0.0260) (0.0260) (0.0323) (0.0316) (0.0274) (0.0276) (0.0341)
BCON×IMVAR 0.00192 0.00187 -0.000195 -0.00254
(0.00214) (0.0220) (0.00186) (0.00277)
FBANK -0.106*** -0.101*** -0.106*** -0.101*** -0.194*** -0.205*** -0.195*** -0.205***
(0.0262) (0.0296) (0.0262) (0.0308) (0.0378) (0.0395) (0.0376) (0.0395)
GBANK -0.0327 -0.0324 -0.0319 -0.0286 0.176*** 0.175*** 0.183*** 0.178***
(0.0223) (0.0223) (0.0264) (0.0271) (0.0304) (0.0303) (0.0335) (0.0395)
BNKDEV 0.0238 0.0236 0.0236 0.0235 0.0430** 0.0458** 0.0425** 0.0457**
(0.0165) (0.0165) (0.0165) (0.0165) (0.0214) (0.0219) (0.0214) (0.0220)
GDPGR 0.363** 0.363** 0.362** 0.363*** 0.480** 0.473** 0.478** 0.472**
(0.155) (0.155) (0.155) (0.155) (0.208) (0.207) (0.208) (0.207)
LABPOP 9.736 9.748 9.721 9.758
(7.099) (7.100) (7.092) (7.106)
HUMCAP 0.827*** 0.825*** 0.822*** 0.825***
(0.227) (0.226) (0.228) (0.228)
EXPGDP 0.0414** 0.0418** 0.0419** 0.0413** 0.0602** 0.0572** 0.0593** 0.0551**
(0.0207) (0.0207) (0.0207) (0.0207) (0.0294) (0.0292) (0.0293) (0.0292)
INF -0.00525** -0.00522
** -0.00523** -0.00524
** -0.188
** -0.188** -0.189
** -0.188***
(0.00205) (0.00205) (0.00205) (0.00207) (0.0784) (0.0787) (0.0785) (0.0785)
IMVAR -0.0809 0.0702 0.0401 -0.0263 0.0479 -0.0701 0.0740 -0.0223
(0.123) (0.0661) (0.0445) (0.157) (0.106) (0.0538) (0.0487) (0.184)
FBANK ×IMVAR -0.000867 -0.000782 0.00171** 0.0021**
(0.00129) (0.00142) (0.000781) (0.000826)
GBANK ×IMVAR -0.000156 -0.000836 -0.00157 -0.000239
(0.00136) (0.00158) (0.00173) (0.00186)
CONS. -0.202 -1.016 -0.817 -0.487 1.375 1.691 1.362 2.560
(7.718) (7.718) (7.660) (7.823) (3.250) (3.097) (3.119) (3.332)
No of Obs. 4100 4100 4100 4100 3428 3428 3428 3428
AR(1) test -12.65 (0.000)
-12.65 (0.000)
-12.65 (0.000)
-12.65 (0.000)
-1.54 (0.124)
-1.53 (0.126)
-1.54 (0.154)
-1.53 (0.126)
AR(2) test -0.42 (0.677)
-0.42 (0.672)
-0.42 (0.672)
-0.42 (0.677)
-1.14 (0.256)
-1.14 (0.254)
-1.13 (0.258)
-1.14 (0.253)
Hansen test 2.06 (0.357)
2.06 (0.357)
2.06 (0.358)
2.06 (0.357)
4.08 (0.130)
4.10 (0.129)
4.08 (0.130)
4.12 (0.127)
The robust standard errors are in parentheses, where * indicates significance at the 10% level, ** indicates significance at the 5% level and *** at 1% level. AR(1) and AR(2) are p-values and t-statistics of the test of first and second order autocorrelations and Hansen is the p-value and t-statistic of the Hansen test of overidentifying - restrictions

130
The marginal effect of foreign bank ownership on net firm entry increases by 0.22 and 0.2772
percentage points when industry economic importance increases by 1 percent. This means
that foreign banks concentrate their lending towards firms in industries that have previously
experienced high growth, resulting in a ‘divergence effect’. In high-growth industries, more
entry increases competition and consequently, development, while low-growth industries
continue to remain concentrated without adequate funding from foreign banks or any
motivation to improve.
3.4.3.8. Industry Employment Share
In Table 3.11, we report the results of regressions where we include the interaction terms
between industry employment share and bank market structure variables. Industry
employment share could in some way serve as robustness to labour-intensity because both
measures emphasize the importance of the labour force in industrial performance. In columns
2 and 4, the interaction term is negative, suggesting that the growth of industries of economic
importance (when economic importance is measures as industry employment share) slows
down when the presence of foreign banks is high. The marginal effect of foreign bank
ownership on manufacturing growth based on the coefficients fall by 0.09 and 0.11
percentage points when industry economic importance increases by one percent. We
highlight similar results in columns 2 and 4 of Table 3.7: foreign bank ownership may harm
the growth of industries composed of labour-intensive firms. Similarly, they may harm the
growth of economically important industries when economic importance is measured as
industry employment share.
3.5. Conclusion
Using a sample of 26 developing countries between 1995 and 2007, this chapter examines the
role of bank market structure (where bank market structure is measured as bank
concentration, foreign bank entry and state ownership of banks) on industrialization (where
industrialization is measured as the growth of manufacturing value added and net firm entry),
with the primary aim of investigating whether there are other characterizations besides
external finance dependence (if such a characterization is indeed valid) that should be
common to industries that benefit from financial development. We carry out this
72
Standard error (0.13225 and 0.16154).

131
investigation by incorporating interaction terms between bank market structure and industry-
specific characteristics to the specifications.
Table 3.11: Industry Employment Share
1 2 3 4 5 6 7 8
Variables MVAGR MVAGR MVAGR MVAGR NFEGR NFEGR NFEGR NFEGR
MVAGRt-1 0.0625** 0.0622** 0.0624** 0.0623**
(0.0255) (0.0255) (0.0255) (0.0255)
NFEGRt-1 -0.291* -0.292* -0.292* -0.293*
(0.159) (0.159) (0.159) (0.159)
BCON 0.00672 0.00934 0.00899 0.00858 -0.0693** -0.0753
*** -0.0754*** 0.0680
**
(0.0293) (0.0242) (0.0242) (0.0294) (0.0333) (0.0284) (0.0284) (0.0335)
BCON×IES 0.000460 0.000161 -0.00115 -0.00145
(0.00183) (0.00197) (0.00246) (0.00257)
FBANK -0.0806*** -0.0619
** -0.0806*** -0.0601
** -0.218
*** -0.222*** -0.217
*** -0.225***
(0.0259) (0.0289) (0.0259) (0.0301) (0.0379) (0.0410) (0.0379) (0.0407)
GBANK -0.0476** -0.0473** -0.0527* -0.0432 0.109*** 0.109*** 0.101*** 0.0981***
(0.0230) (0.0228) (0.0274) (0.0283) (0.0295) (0.0296) (0.0339) (0.0332)
BNKDEV -0.0100 -0.0104 -0.0101 -0.0104 0.0366* 0.0366* 0.0367* 0.0364*
(0.0203) (0.0203) (0.0203) (0.0203) (0.0218) (0.0217) (0.0218) (0.0217)
GDPGR 0.337** 0.337** 0.336** 0.338** 0.427** 0.429** 0.428** 0.428**
(0.162) (0.162) (0.162) (0.162) (0.211) (0.212) (0.211) (0.211)
LABPOP 6.938 6.879 6.951 6.877
(7.244) (7.237) (7.236) (7.243)
HUMCAP 0.697*** 0.701*** 0.699*** 0.697***
(0.219) (0.219) (0.219) (0.219)
EXPGDP 0.0455** 0.0465** 0.0457** 0.0465** 0.0126 0.0125 0.0122 0.0127
(0.0206) (0.0206) (0.0205) (0.0205) (0.0319) (0.0320) (0.0320) (0.0319)
INF -0.00579*** -0.00586*** -0.00581*** -0.00585*** -0.136* -0.136* -0.136* -0.135*
(0.00212) (0.00211) (0.00212) (0.00212) (0.0727) (0.0726) (0.0726) (0.0727)
IES -0.0501 0.134 -0.0456 0.160 0.128 0.0237 0.0154 0.0579
(0.134) (0.0860) (0.0615) (0.187) (0.183) (0.0810) (0.0829) (0.195)
FBANK×IES -0.00373** -0.00409** 0.000746 0.00136
(0.00163) (0.00189) (0.00272) (0.00266)
GBANK×IES 0.00102 0.000823 0.00129 0.00197
(0.00176) (0.00208) (0.00235) (0.00208)
CONS. 1.855 1.004 1.827 0.873 2.681 3.197 3.274 3.087
(8.246) (8.138) (8.095) (8.339) (3.312) (3.143) (3.177) (3.333)
No of Obs. 3886 3886 3886 3886 3588 3588 3588 3588
AR(1) test -11.89 (0.000)
-11.89 (0.000)
-11.89 (0.000)
-11.89 (0.000)
-1.44 (0.149)
-1.44 (0.150)
-1.44 (0.151)
-1.44 (0.151)
AR(2) test -0.93 (0.354)
-0.93 (0.354)
-0.93 (0.354)
-0.93 (0.354)
-1.27 (0.206)
-1.27 (0.205)
-1.27 (0.203)
-1.27 (0.202)
Hansen test 0.51 (0.774)
0.49 (0.781)
0.51 (0.775)
0.50 (0.780)
2.25 (0.324)
2.28 (0.320)
2.28 (0.320)
2.28 (0.320)
The robust standard errors are in parentheses, where * indicates significance at the 10% level,
** indicates significance at the 5% level and
*** at 1% level.
AR(1) and AR(2) are p-values and t-statistics of the test of first and second order autocorrelations and Hansen is the p-value and t-statistic of the Hansen test of overidentifying - restrictions.
The initial findings of this chapter are based on the results from the baseline regression,
where net firm entry has been used as the dependent variable, are that bank market structure
affects the growth of entry into manufacturing industries. The negative effect of bank
concentration on net firm entry emphasizes the oligopolistic nature of banks with market
power while the negative effect of foreign bank entry highlights its ability to squeeze credit
available to incumbents as well as new entrants in the manufacturing sector. On the other
hand, the growth of entry into manufacturing industries is faster in the presence of state banks
because of its welfare-enhancing effect by lending to new entrants, financially constrained
firms and during periods of uncertainly and instability.

132
On the relationship between bank market structure and industrial performance, a significant
amount of literature suggests that industries that depend more on external finance benefit
more in countries where the level of financial development is higher. For that reason, we
would expect bank concentration and foreign bank entry, and to a lesser extent state owned
banks to promote the growth of industries that depend more on external finance, as well as
entry into these industries. We find no evidence of this. Bank lending to firms in the
manufacturing sector appear not to be influenced by their external financial dependence
(except when we include the interaction terms simultaneously into the specifications which
might indicate that elements of bank market structure are proxying for each other).
Because we are unsure of the construction and assumptions of external finance dependence,
our investigation of other characterizations that could be common to industries that benefit
from financial development suggest that are affected by bank market structure. On the whole,
the results suggest that industries composed of large firms, labour-intensive firms, and firms
of economic importance (when economic importance is measured as lagged manufacturing
value added growth) growth faster in countries where the level of financial development is
high. The growth of entry into industries composed of large firms is also quicker when the
level of bank concentration is high. However, bank concentration slows down the growth of
entry into industries composed of small firms. On the other hand, while industries composed
of small firms grow faster in countries where foreign banks presence is high, the growth of
industries composed of labour-intensive firms and firms of economic importance (when
economic importance is measures as industry share), as well as the growth of entry into
industries composed of large firms and firms of economic importance (when economic
importance is measured as initial manufacturing value added growth), slows down in
countries where the presence of foreign is high. Finally, we find that the growth of and entry
into industries composed of large firms and firms of economic importance (when economic
importance is measured as lagged manufacturing value added growth) faster in countries
where the presence of state banks is high. The growth of industries composed of labour-
intensive firms slows down when state ownership of banks is high.
We have not previous stated in this section or discussed in the previous, the high-
technological intensity characterization because the interaction terms were insignificant in all
the specifications in Table 3.8. According to Rajan and Zingales (1998), external finance
dependence differs across industries for technological or structural reasons. Also, when we

133
consider the ranking of this index across industries, we find that to a great extent, more
innovative or technologically-intense industries require more external finance in the
manufacturing sector. According to Da Rin and Hellmann (2002), banks with market power
and are profit driven promote industrialization. Also, Berger and Udell (2006) argue that
foreign banks have better lending technologies and are better suited to lend to high-tech firms
in manufacturing industries. We find no evidence of this in our results. This may provide
further evidence that the measure of external financial dependence by Rajan and Zingales is
fundamentally flawed (while they assume that these firms are the dynamic and innovative
ones).
From a policy perspective, while innovative or technologically-intense industries may require
adequate external finance, it is not necessarily the case that they benefit explicitly when the
level of financial development is higher. Rather, while the effect of financial development on
such industries may be positive, this effect on their development may be implicit. In other
words, it is not enough for governments of developing countries to simply assume that
increasing the level of financial development will directly lead to industrialization. Some
form of state intervention on how credit is allocated is required to trigger industrialization.
In general, while different industry characterisations that are expected to benefit from
financial development are influenced by bank market structure, they are not necessarily
industries that depend more on external finance. The significant effects of bank market
structure on industrial performance through a variety of industry characterizations are the
most important aspect of our study. Also, the systematic approach we use by including all
there bank market structure variables is a valuable contribution to the literature. Finally, not
all the interaction terms we employ have been examined in the literature. Some of the results
cast doubts over Rajan and Zingales measure of external financial dependence as well as the
ability of banks in developing countries to fund firms that use innovative technology by
questioning the ability of a general policy like financial development, through bank market
structure to promote industrialization. In other words, the systematic approach and the
econometric results comprise valuable contribution to the literature.
The study is not without drawbacks, some of which relate to data availability. Another
drawback can be related to the insignificance of some of the interaction terms and they may
be due to measurement errors. For example, one would have expected the interaction between
state ownership of banks and small firm share/labour-intensity/high-tech intensity to be

134
significant and positive. These would have suggested the improvement of industrial
performance as a result of the welfare-enhancing effect of state banks.
Finally, it will also been interesting to see if these findings will hold for a larger number of
developing countries, provided adequate is data available. Also, a good idea to improve on
this chapter would be to directly investigate the link financial development/bank market
structure and measures of innovation and technological development.

135
Appendix 3.1: Manufacturing Industry Specific Characteristics
Manufacturing Sector – Industries ED SFS AFS LI
Food and beverages 0.14 3.93 146.58 23.78
Tobacco products -0.45 0.3 782.93 23.56
Textiles 0.4 2.81 223.79 36.06
Wearing apparel, fur 0.03 8.18 172.27 41.15
Leather, leather products and footwear -0.14 10.45 162.50 36.68
Wood products (excl. furniture) 0.28 21.37 118.30 31.41
Paper and paper products 0.18 3.03 115.8 26.46
Printing and publishing 0.2 16.32 63.01 35.77
Coke, refined petroleum products, nuclear fuel 0.25 5.8 464.79 16.14
Chemicals and chemical products 0.33 9.26 99.52 23.58
Rubber and plastics products 0.23 4.62 125.18 31.14
Non-metallic mineral products 0.06 14.17 111.59 25.11
Basic metals 0.24 9.98 135.50 24.78
Fabricated metal products 0.09 4.76 76.26 32.36
Machinery and equipment n.e.c. 0.45 13.68 94.93 38.79
Office, accounting and computing machinery 1.06 2.85 346.20 27.14
Electrical machinery and apparatus 0.77 3.44 124.31 35.66
Radio, television and communication equipment 1.04 3.09 262.84 30.48
Medical, precision and optical instruments 0.96 4.01 108.03 36.83
Motor vehicles, trailers, semi-trailers 0.39 2.28 119.48 32.24
Other transport equipment 0.31 2.21 119.07 38.49
Furniture; manufacturing n.e.c. 0.24 9.09 135.91 37.23
Recycling 0.47 19.95 45.16 31.22
Note: Data for ED (external financial dependence) was obtained from Rajan and Zingales (1998), data on SFS (small firm share was obtained from Beck et al. (2008), while AFS (average firm size) & LI (labour intensity) were calculated by the author, where data was gotten from the UNIDO industry database.
Appendix 3.2: Scatter Plots showing the relationship between Manufacturing Value Added
Growth/Net Firm Entry and Bank Market Structures over different time periods
Figure 1
Figure 1A Figure 1B
-10
-50
510
15
40 50 60 70 80 90Bank Concentration
Manufacturing Value Added Growth Fitted values
Full Sample
-50
510
15
20 40 60 80 100Bank Concentration
Manufacturing Value Added Growth Fitted values
Period 1: 1995-1998

136
Figure 1C Figure 1D
Figure 2
Figure 2A Figure 2B
Figure 2C Figure 2D
Plot A of figure 1 shows a positive relationship between average of manufacturing value added
growth and bank concentration across countries over the sample period. This relationship is
consistent in plots C and D but not B, the relationship in plot B is negative. On the other hand, plot A
of figure 2 shows a negative relationship between the average of net firm entry and bank
concentration. This relationship is consistent over the other time periods.
-20
-10
01
02
0
40 60 80 100Bank Concentration
Manufacturing Value Added Growth Fitted values
Period 2: 1999-2002
05
10
15
20
40 50 60 70 80 90Bank Concentration
Manufacturing Value Added Growth Fitted values
Period 3: 2003-2007-.
2-.
10
.1
40 50 60 70 80 90Bank Concentration
Net Firm Entry Fitted values
Full Sample-.
10
.1.2
.3
20 40 60 80 100Bank Concentration
Net Firm Entry Fitted values
Period 1: 1995-1998
-.6
-.4
-.2
0.2
40 60 80 100Bank Concentration
Net Firm Entry Fitted values
Period 2: 1999-2002
-.4
-.2
0.2
40 50 60 70 80 90Bank Concentration
Net Firm Entry Fitted values
Period 3: 2003-2007

137
Figure 3
Figure 3A Figure 3B
Figure 3C Figure 3D
Figure 4
Figure 4A Figure 4B
-10
-50
510
15
0 20 40 60 80Foreign Bank Ownership
Manufacturing Value Added Growth Fitted values
Full Sample
-50
510
15
0 20 40 60 80Foreign Bank Ownership
Manufacturing Value Added Growth Fitted values
Period 1: 1995-1998
-20
-10
01
02
0
0 20 40 60 80 100Foreign Bank Ownership
Manufacturing Value Added Growth Fitted values
Period 2: 1999-20020
510
15
20
0 20 40 60 80 100Foreign Bank Ownership
Manufacturing Value Added Growth Fitted values
Period 3: 2003-2007
-.2
-.1
0.1
0 20 40 60 80Foreign Bank Ownership
Net Firm Entry Fitted values
Full Sample
-.1
0.1
.2.3
0 20 40 60 80Foreign Bank Ownership
Net Firm Entry Fitted values
Period 1: 1995-1998

138
Figure 4C Figure 4D
Plot A of figure 3 shows a negative relationship between the average of manufacturing value added
and foreign bank ownership. This relationship is consistent over the different times period specified
in plots B, C and D. On the other hand, plot A of figure 4 shows a negative relationship between the
average values of net firm entry and foreign bank ownership. This relationship is consistent over
different time periods (except in plot C, where the relationship is positive).
Figure 5
Figure 5A Figure 5B
Figure 5C Figure 5D
-.6
-.4
-.2
0.2
0 20 40 60 80 100Foreign Bank Ownership
Net Firm Entry Fitted values
Period 2: 1999-2002
-.4
-.2
0.2
0 20 40 60 80 100Foreign Bank Ownership
Net Firm Entry Fitted values
Period 3: 2003-2007-1
0-5
05
10
15
0 20 40 60 80Government Ownership of Banks
Manufacturing Value Added Growth Fitted values
Full Sample
-50
510
15
0 20 40 60 80Government Ownership of Banks
Manufacturing Value Added Growth Fitted values
Period 1: 1995-1998
-20
-10
01
02
0
0 20 40 60 80Government Ownership of Banks
Manufacturing Value Added Growth Fitted values
Period 2: 1999-2002
05
10
15
20
0 20 40 60Government Ownership of Banks
Manufacturing Value Added Growth Fitted values
Period 3: 2003-2007

139
Figure 6
Figure 6A Figure 6B
Figure 6C Figure 6D
Plot A of figure 5 shows a negative relationship between the average of manufacturing value added
and government ownership of banks, and this relationship is consistent when the sample is divided
into three periods (i.e. in B, C, and D). However, in plot A of figure 6, the relationship between the
average value of net firm country and government ownership of banks across countries is positive.
This relationship is maintained in periods 2 and 3, but not 1. The relationship in period one is
negative. In general, we find the relationships to be relatively stable over subsamples of the time
period.
-.2
-.1
0.1
0 20 40 60 80Government Ownership of Banks
Net Firm Entry Fitted values
Full Sample
-.1
0.1
.2.3
0 20 40 60 80Government Ownership of Banks
Net Firm Entry Fitted values
Period 1: 1995-1998
-.6
-.4
-.2
0.2
0 20 40 60 80Government Ownership of Banks
Net Firm Entry Fitted values
Period 2: 1999-2002
-.4
-.2
0.2
0 20 40 60Government Ownership of Banks
Net Firm Entry Fitted values
Period 3: 2003-2007

140
CHAPTER 4: THE EFFECT OF FINANCIAL DEVELOPMENT ON
EXPORT SOPHISTICATION AND EXPORT DIVERSIFICATION IN
DEVELOPING COUNTRIES
4.1. INTRODUCTION
There is an exhaustive literature establishing the link between finance and growth73
and an
additional literature which links trade with growth74
. In this chapter, we suggest that there
might be a close relationship between these two aspects of the literature. In other words, it is
possible that financial development may affect growth through trade. International trade
theories suggest that factor endowments, economies of scale and technological levels are
factors responsible for comparative advantage and consequently responsible for determining
trade quantities and patterns between countries. A strand of the literature additionally
proposes that the level of financial development in countries may be responsible for
determining trade quantities and patterns between countries. Kletzer and Bardhan (1987) are
seen to be the ones who introduced this theoretical concept. They use an amplified
Heckscher-Ohlin trade model, incorporating a financial sector and illustrate that its
development encourages countries to specialize in sectors that rely heavily on external
finance. Even though some recent empirical studies seem to support this hypothesis, it is fair
to say that there is still no consensus, not only because the literature is not expansive, but also
on the grounds of the issue of direction of causality or indeed if a relationship financial
development and trade specialization really exists.
Traditional models of international trade suggest that trade expansion leads to improved
future economic performance by countries through the principle of comparative advantage. It
has however been documented that from a long-term outlook, the impact of exported
products (and services) are heterogeneous on economic performance75
. It has also been
documented in the literature that potential economic growth as a result of specialization in
exports in more pronounced in some products than others. Previously, prospective economic
73
See King and Levine (1994). 74
See Frankel and Romer (1999). 75
In other words, it has been documented that because exported goods and services have different
characteristics, their impact on economic performance will vary. Some will have a more pronounced effect on
economic growth than others.

141
growth was seen to be positively influenced by the volume of trade76
, but in the last twenty
years or so, the quality and content of what you exported was seen to significantly determine
how competitive you were in the international market, and primarily future economic growth.
Recent trade theory also highlights the importance of sophisticated exports for economic
growth and suggests that countries which are at the top of the scale in terms of sophisticated
exports are likely to have better economic performance (Funke and Ruhwedel, 2001; Amiti
and Freund, 2008 and Hausmann, et al., 2007).
While the sophistication of exports is important, the diversification of exported products is
equally important, particularly for developing countries. They experience external shocks
because of their over-reliance on commodity exports. To tackle the problems of external
shocks, policies that increase export revenues, sustain export earnings, and upgrade the trade
structure have to be implemented. Free trade, based on comparative advantage,
specialization, and international division of labour was the view before the First World War.
This view was based on traditional trade theories developed by Smith (1776) and Ricardo
(1817). However, Prebisch (1950) and Singer (1950) criticized this view after the Second
World War by suggesting that increased specialization in developing countries meant
exporting raw materials and agricultural products for consumer and investment goods
manufactured in developed countries. Therefore, for developing countries to increase export
revenues, sustain export earnings and upgrade their export structure, it was essential to
diversify products that were exported. This led many of them to gradually implement policies
that facilitated outward orientation and reduced trade barriers from the 1980s. However, the
results of expanding and diversifying exports have been mixed from a developing country
point of view, so, this remains a key concern for governments in many developing countries.
Our motivation for this chapter is that, compared to the literature linking financial
development and international trade, the literature linking financial development and export
structures (particularly export diversification) has not been exhaustively explored. This
relationship is relevant for developing countries as many of them have undertaken structural
reforms (including financial reforms) in the last 30 years with the sole aim of improving
economic growth. One channel through which economic growth can be sustained is being
competitive in international trade (i.e. increasing export sophistication and product
76
Countries (particularly developing countries) sought to increase the volume of exports because they saw it as
an active channel through which economic growth could be achieved.

142
diversification). Therefore, we consider the link between financial development and structure
of exports rather than aggregate trade or exports in developing countries.
4.2. CONCEPTUAL FRAMEWORK
4.2.1. Background to the Effects of Financial Development on International Trade.
Baldwin (1989) developed one of the early theoretical models where financial institutions
were seen to be a source of comparative advantage. In his model, he shows that in countries
equipped with better financial institutions, the ability to diversify risk is greater, and therefore
firms are able to produce risky goods at lower risks and marginal costs. Also, Kletzer and
Bardhan (1987) develop a model where a country’s comparative advantage depends on the
development of financial institutions. However, while Baldwin emphasizes the ability of
financial institutions to diversify risk, Kletzer and Bardhan concentrate on the ability of
financial institutions to provide external finance to activities that require it the most. They use
two models to show that comparative advantage of a country explicitly depends on financial
institutions. One model shows that international lending to countries with poor reputation
requires higher interest rates and firms are unable to specialize in sophisticated manufactured
products, while the second model shows that in countries with weak financial institutions,
firms do not face higher interest rates but tighter credit rationing. It is also important to note
that in both models the level of technology is assumed to be the same across countries.
The above studies find that better financial institutions will improve the growth of activities
that require more external finance. We find these suggestions to be vague without a more
precise definition of what characteristics are similar in industries that largely depend on
external finance.77
The idea by Rajan and Zingales (1998) that highly external dependent
industries would experience faster growth rates in countries with better financial institutions
might not be saying much. According to them, industries that depend more on external
finance are more technologically-intense. However, it is possible that better financial
institutions may promote the growth of industries with other characteristics. For example,
Kowalski (2011) finds that better financial institutions may improve the growth of capital
intensive industries; Becker et al. (2013) finds that better financial institutions may promote
77
In the previous chapter, we were able to show that there are no common characteristics among industries that
depend more on external finance as defined by Rajan and Zingales (1998) and our findings are supported by
Von Furstenberg and Von Kalckreuth (2006) and Kabango and Paloni (2011).

143
the growth of industries with high up-front costs; and Manova (2008) finds that better
financial institutions promote the growth of industries with limited tangible assets.
Apart from the theoretical studies of Baldwin (1989) and Kletzer and Bardhan (1987), Beck
(2002, 2003) and Svaleryd and Vlachos (2005), provide empirical support for the importance
of financial institutions in shaping up a country’s comparative advantage. As an extension to
Kletzer and Bardhan’s model, Beck (2002) specifies technology to be different across
countries but supports the theoretical predictions of Baldwin (1989) and Kletzer and Bardhan
(1987). His model emphasizes how important financial institutions are at financing large-
scale and high-return projects. He provides further evidence through empirical examination to
show that countries with better financial institutions are expected to have higher exports as
well as trade balance of manufactured goods.
On the other hand, Beck (2003) uses data at a more disaggregated level i.e. industry level
data, to show that in countries with better financial institutions, the cost of financial
intermediation is lower, resulting in higher exports and trade balances in industries that
depend more on external finance. In other words, Beck provides empirical support for the
theory using a methodology introduced by Rajan and Zingales (1998). On a similar note,
Svaleryd and Vlachos (2005) use OECD countries to show that the effects of the financial
system on patterns of specialization are more significant when compared to human and
physical capital endowments. These studies show a robust positive relationship between
financial development and exports in sectors that depend heavily on external finance i.e.
comparative advantage and specialization in international trade occur as a result of financial
development.
Functions of the financial system as described by Levine (1997) allow the economy of a
country to specialize and take advantage of economies of scale. These functions include the
ability of financial institutions to mobilize savings and facilitate trading, hedge, diversify and
pool risk, allocate resources efficiently, and monitor managers and exert corporate control.
In a theoretical model of finance and trade by Beck (2002), he predicts that economies with a
better financial system are net exporters of goods with increasing returns to scale. In the
model, he presents an open economy with two production technologies (one with constant
returns to scale-for food production-the other with increasing returns to scale for
manufactures). Producers who use both technologies will supplement their existing capital
with debt financing from savers. Market uncertainties and friction as a result of moral hazards

144
and asymmetric information will create a situation where financial intermediaries have to
intervene. However, it proves expensive for financial intermediaries to channels savings to
producers. Financial development is now modelled to reduce the cost of financial
intermediation and therefore increase the volume of external finance in the economy. Given
that financial development creates incentives for the producer to produce more goods with
increasing returns to scale, industrial specialization, and consequently the structure of trade
flows, is determined by the level of financial development.
Figure 4.1 shows a positive but weak relationship between the average data for trade (ratio of
exports plus imports over GDP) and financial development (credit provided by commercial
banks to the private sector over GDP) in the last 4078
. However, it also possible that financial
development levels increase as a result of international trade due to the demand for increased
financial services.
While the positive relationship between financial development and trade has only been
recently established in the last decade, a contrary view does exist in the literature. In this
strand of the literature, financial development occurs as a result of the demand and supply of
external finance. It is assumed that the demand for financial services from well-developed
financial sectors is likely to be more evident in countries where industries are structured to
rely mainly on external finance. For that reason, the quality and pattern of trade may be
responsible for influencing the quality of financial institutions in countries. how countries
demand for financial service.
In other words, countries structured with industries heavily reliant on external finance will
require more financial services, and consequently higher levels of financial intermediary
development. Do and Levchenko (2007) develop this hypothesis, while Huang and Temple
(2005), Klein and Olivei (2008) and Baltagi et al. (2009) provide empirical support for it.
Generally, these studies postulate that countries that export goods from industries that rely
heavily on outside finance are likely to have highly developed financial systems when
compared with countries who primarily exports goods from industries that are not heavily
reliant on external finance.
78
In figure 1, we can see that both variables are increasing (although the growth in world trade is slower than
that of financial development).

145
Figure 4.1: Average Trade and Financial Development (World, 1970-2010)
Source: World Development Indicators (WDI) for Trade and Beck and Al-Hussainy (2010) for Private Credit.
At firm-level, the importance of financial institutions is measured by how much they are able
to reduce problems of information asymmetries and contract enforcement, as well as how
firms with promising projects can effectively meet their external financial needs. When
financial institutions are good, exporting firms find it easier to meet their external financial
needs; this makes it easier for them to effectively compete in the international market even
after making the initial costs that cannot be recovered. Also, the presence of good financial
institutions increases funds available for lending in the credit market and reduces any form of
volatility that may be associated with exporting firms (Manova, 2008).
There is some evidence in the literature to suggest that the performance of exporting firms in
the international market suffers when they are faced with financial constraints. For example,
Chaney (2005) builds a model of international trade with financial constraints and predicts
that, if firms must pay sunk costs to enter international markets and if they are liquidity
constrained to finance these costs, only those firms that have sufficient liquidity are able to
export; Manova (2008) develops a model which predicts that financial market imperfections
severely restrict international trade flows because exporting firms require outside finance;
Greenaway et al. (2007) use over 9000 UK firms (1993-2003) to investigate the link
between firms’ financial health and their export market participation decision. They find that
exporting firms reveal better financial health than non-exporting firms. In other words, firms
that face credit or liquidity constraints are unlikely to export. Muuls (2008) uses a theoretical
model to predict that firms are more likely to export if they enjoy higher productivity levels
and lower credit constraints. Bellone et al. (2010) analyse the link between financial
0.5
11.5
2
0.5
11.5
21970 1980 1990 2000 2010
year
1970 1980 1990 2000 2010year
trade private credit

146
constraints and firms’ exporting behaviour, and the main finding is that firms enjoying better
financial health are likely to become exporters. These studies suggest that better financial
institutions help in reducing the problem of financial constraints that might be faced by
exporting firms.
Some scepticism exists on the positive relationship between financial development and trade
in the literature. Some studies find a negative or insignificant relationship between financial
development and international trade. For example, Kim et al. (2010) investigate the dynamic
relationship between trade openness and financial development and finds that the positive
relationship between financial development and trade openness is only existent in the long-
run, while a negative relationship exist in the short-run; Demir and Dahi (2011) shows some
evidence of the effect of financial development on trade between developing countries; and
trade between developed and developing countries by emphasizing the positive significant
relationship between financial development and trade between two developing countries and
an insignificant relationship of financial development and trade between a developing and a
developed country.
While there is some theoretical and empirical evidence that financial development promotes
production in technologically advancement, we believe these results are vague because the
measure which the empirical results are based on-sectors that are more external finance
dependent (Rajan and Zingales, 1998)-are not clearly defined and have been criticized on
these grounds (Von Furstenberg and Von Kalckreauth, 2006 and Kabango and Paloni, 2011).
Our findings in the previous chapter casts further doubts over characteristics of sectors
described as more external finance dependent. While technologically innovative sectors may
share the characteristics identified in this literature, it is the case that these sectors are not
singled out explicitly and that, therefore, the positive effect financial development might have
on the development of such sectors remains implicit. This may simply be suggesting that the
impact of financial development on industries that depend largely on external finance is not
clearly understood, and also signifies that assumptions on the effect of financial development
in industry specialization might be based on questionable foundations.
Theoretically, it might also be difficult to suggest that better financial institutions in
developing countries would ensure that exports are more sophisticated. The fundamentals of
such arguments are based on an abstract and unrealistic modeling of technological

147
advancement in developing countries because market failures may prevent this from
happening. Market failures require some form of government welfare-enhancing
interventions but have been criticized on the grounds of political economy considerations79
by the mainstream literature. According to Neoclassical theory, the role of the state in
financial markets is to ensure it operates freely and remains competitive (Khan, 2008).
Some critics have argued that restricting the role of the state to creating a favorable
environment for both financial markets and the rest of the economy may be responsible for
hindering technological advancement in developing countries. Their arguments are based on
two fundamentals of technological progress i.e. the centrality of learning and the tacit
character of knowledge/technology. In developing countries, technological progress occurs
through innovation rather than invention. By innovation, we mean the ability of developing
countries to disseminate and familiarize themselves with the machines/technologies,
organizational and commercial processes imported from developed countries and applying
them to the local economy. In other words, technological progress in developing countries
occurs through learning80
rather than through invention or R&D which makes countries more
technologically advanced (UNCTAD, 2007).
Although, technological progress may occur through the transfer of technology, it is not
exactly straightforward. In other words, the fact that developing countries have access to
foreign technology does not mean that they immediately accrue the benefits. For foreign
technology to be clearly understood, its assimilation and absorption requires an understanding
of its tacit element, which mostly occurs through learning that depends on training and
experience (Hausmann and Rodrik, 2003). Hence, understanding the tacit elements of
technology is associated with high costs and risks, and an effective application of the process
would also hinge on technological efforts, i.e. investment in technological change. The
difficulty is that firms may not be able to get funds to finance these investments. Outside
financiers find it exceedingly difficult to differentiate between high-and-low value investment
opportunities because of significant information asymmetries which results in inadequate (or
lack of) history of managers’ entrepreneurial abilities and the uncertainties about the
profitability of innovative projects.
79
i.e. government failure and its rent-seeking behaviour. 80
Learning in this case could occur through seeking technological alternatives, choosing a technology and
learning how to use it efficiently.

148
There are no easy solutions to this problem, because the innovating firm would have little or
no incentive to make public insider information on the project’s potential because it faces the
risk of competing firms copying its strategies or innovations. As a result of these
circumstances, banks may be reluctant to fund such innovative projects, particularly since the
loan contract is unlikely to give them any opportunity to make claim to any part of the
productivity gains if the firm’s project prospers. Another scenario that may occur is that
banks may only be willing to fund firms’ projects if they invest in projects that have lower-
risk or use known technologies (Lall, 2004). Additionally, banks may only be willing to fund
projects based on short-termism. In other words, they tend to favour short-term projects with
front-loaded returns and discouraging entrepreneurial learning. Banks may be willing to lend
to innovative entrepreneurs with no history of their abilities and collateral, who engage in
innovative projects, but charge high risk premiums, particularly in a liberalized financial
environment. Banks may feel safer increasing their lending portfolio towards the more
profitable and less risky government and household sectors (Carpenter and Peterson, 2002).
Therefore, it is possible that financial development may not have the positive effect that it has
been hypothesized to have on markets failures that prevent innovative projects from being
funded and could worsen the situation.
Technologies differ in their tacit elements and, while learning in general faces market
failures, the solutions may be dependent on the activity. Generalized interventions
(liberalization of finance and trade and investment in education) will ensure countries exploit
existing comparative advantage: in developing countries, low-technology and value added
sectors are more likely to experience growth because they are internationally competitive.
Since developing countries are associated with low levels on investment in technological
change and productivity-enhancing industries, their production is concentrated in technology
with lower learning potentials. Under these circumstances, substantial growth in
manufactured exports is not impossible but, for it to be sustainable, incessant technological
upgrading and deepening is required, and this requires selective (Lall, 2004). For this reason,
therefore, it is possible that financial development may result in reduction in the degree of
sophistication of the export basket in developing countries.
It has been argued that the ability of developing countries to diversify their export baskets is a
significant step towards fast-paced economic development. It is generally recognized that an
economy’s susceptibility to exogenous shocks is largely dependent on its degree of trade

149
openness (Briguglio, 2009; Rodrik, 2010; and World Bank, 2010). Because trade openness is
commonly measured as the ratio of exports plus imports to GDP, an economy becomes
vulnerable through its exports or imports. Import-dependent countries are vulnerable to the
availability and cost of the imports (Briguglio, 2009), while export earnings and economic
growth of export-dependent countries become volatile due to economic shocks. Countries
that depend on exports are largely exposed to external shocks because foreign exchange
earnings finance imports and directly contribute to investment and growth (Foxley, 2009).
Although, economic shocks occur through foreign exchange earnings, the degree of the
impact depends on the degree of export diversification.
The link between financial development and export diversification in the literature is scarce,
but Manova (2008) finds that if financial development reduces liquidity constraints and
increases the number of exporting firms, then it is expected that financial development may
increase the degree of export diversification of a country’s export basket. On the other hand,
the effect of financial development may be the opposite if banks decide to finance activities
where the country already has comparative advantage. Empirical studies that have clearly
examined the effect of financial development on export diversification are scarce. First of all,
Agosin et al. (2012) find the effect of financial development on export diversification to be
insignificant in all of their regressions. Bebczuk and Berrettoni (2006) on the other hand, find
that financial development either reduces diversification or it has no effect.81
Finally, in a
study of the five members of the Southern African Customs Union, Seabe and Mogotsi
(2012) present some weak evidence that financial development helps diversification, as its
estimated coefficient is only significant at 10 percent.
4.2.2. Export Structure: A Theoretical Framework
4.2.2.1. Export Sophistication.
Traditional models of international trade suggest that trade expansion leads to improved
future economic performance by countries through the principle of comparative advantage. It
has also been documented in the literature that potential economic growth as a result of
specialization in export products in more pronounced in some products than others.
Previously, prospective economic growth was seen to be positively influenced by the volume
81
The latter result is obtained in their preferred specification.

150
of trade82
, but in the last twenty years or so, the quality and content of what you exported was
seen to significantly determine how competitive you were in the international market, and
primarily, future economic growth. Recent trade theory also highlights the importance of
sophisticated exports to economic growth and suggests that countries which are at the top of
the scale in terms of sophisticated exports are likely to have better economic performance
(Funke and Ruhwedel, 2001; Hausmann, et al. 2007 and Amiti and Freund, 2008).
According to Lall et al. (2006), “export sophistication” is a way of classifying traded
products which does not require industry data. It infers product characteristics from the
characteristics of the exporter rather than the parent industry data on factor content.” (p. 5). In
other words, according to the authors, countries with higher average income levels export
more sophisticated products. While highly sophisticated exports require a high level of
technology, Lall et al. suggest that the level of sophistication also requires other factors that
affect location. In their paper, they include technology (R&D, production capacities and
innovation), marketing, logistics and proximity (transport costs), fragmentability (divisible
production processes), information and familiarity, natural resources, infrastructure, and
value chain organization.83
Apart from the economic factors that affect sophistication, policy
factors like “trade restrictions, subsides, trading blocs and trading preference can affect the
location of export production, and so sophistication”. (p. 6). The authors stress that while
export sophistication is largely determined by the level of technology; other factors
mentioned are important determinants of the degree of export sophistication.
This chapter uses an empirical proxy for the productivity level of projects/goods as described
by Hausmann et al. (2007) to represent export sophistication, EXPY. Other measures have
previously been used84
in the literature but the important aspect of this measure is that it links
productivity levels with a country’s exports.85
To calculate EXPY, commodities are classified
in accordance with their exporting countries.86
The authors use the commodity-specific
calculations of sophistication to construct the degree of sophistication for each country. They
use trade data from the United Nations Commodity Trade Statistics Database (COMTRADE)
and it covers over 5000 products at the Harmonized System 6-digit level for the years 1992-
82
Countries (particularly developing countries) sought to increase the volume of exports because they saw it as
an active channel through which economic growth could be achieved. 83
See Lall et al. (2006) for more on these factors. 84
Michaely (1984), Lall et al. (2006), Fan et al. (2006), and Xu (2007). 85
See Hausmann et al. (2007) for a complete discussion of the model. 86
Commodities exported by rich countries are ranked higher than commodities exported by poor countries.

151
2003. They also trade data from the World Trade Flow dataset (Feenstra et al. 2005). It
covers 700 products and is based on the 4-digit standard international trade classification
(SITC rev. 2) from the years 1962-2000. In this study, we utilize EXPY constructed from the
trade flow dataset because it has a relatively longer time span and covers more countries in
the initial period when compared to EXPY constructed from the COMTRADE data.
In the first instance, PRODY is constructed87
. PRODY is the weighted average of the per
capita GDPs of countries exporting a given product, and therefore represents the income level
associated with that product. Accordingly, let countries be indexed by j and goods be indexed
by l. The total exports of country j is equivalent to
j jl
l
X x (4.1)
where Xj (the total exports of country j or the country’s overall export basket) is equivalent to
jl
l
x (the summation of the export of all commodities l in country j).
Let the per-capita GDP of a country j be represented by Yj. Then the productivity level
associated with product k, PRODYk , equals
.
( / )
( / )
jk j
k j
j j jk j
x XPRODY Y
x X
(4.2)
The numerator of the weight, /jk j
x X , is the value-share of the commodity in the country’s
overall export basket. The denominator of the weight, ( / )j jk j
x X , aggregates the value-
shares across all countries exporting the good. Therefore, the index represents a weighted
average of per capita GDPs, where the weights correspond to the revealed comparative
advantage of each country in good k.
Next, the PRODYs are used to calculate the productivity level associated with country j’s
export basket of goods, EXPYj. Specifically, EXPYj is the average income and productivity
level associated with all commodities exported by a country. It is calculated as the weighted
average of all relevant PRODY’s, where the weights represent the share of the relevant
87
PRODY is the commodity-specific calculation.

152
product in the country’s export basket. The productivity level associated with country j’s
export basket, EXPYj, is therefore defined by
.
jl
j l l
l
xEXPY PRODY
X
(4.3)
This is a weighted average of PRODY for that country, where the weights are simply the
value shares of the products in the country’s total exports.
Lall et al. (2006) and Hausmann et al. (2007) find that the positive relationship between the
levels of sophistication and GDP per capita is relatively high. In other words, an economy
experiences growth when the level of sophistication in the products she produces and exports
is increased. Hausmann et al. suggest that high growth countries like China and India have
sophistication levels comparable to developed countries even when their GDP per capita is
somewhat low. The reason for this they suggest is that, unlike many of their developing
counterparts, their exports are relatively more sophisticated.
In figure 4.288
, the degree of sophistication is in logs. Overall, figure 4.2 shows a continuous
rise in the level of sophistication over the time during the period under consideration. Anand
et al. (2012) may help in explaining the way export sophistication has evolved overtime.89
First of all, they note that while the ratio of exports to GDP increased for all developing
country groups, sub-Sahara Africa experienced the lowest increase. Also, when they
decompose export products into resource/primary based and manufactures, they find that the
share of manufactures increased significantly in high-and middle-income countries, while it
decreased in low-income countries but marginally increased in sub-Sahara Africa. In other
words, the export baskets of low-income countries and sub-Sahara Africa remain largely
composed of primary/resource based products.
When they decompose the exports of resources into primary products and higher-value added
resource-based products, they find that the share of primary products declined in high-income
and fast growing economies, while it remained constant is sub-Sahara Africa and increased in
low-income countries. After they decompose manufactured exports are decomposed into low-
88
In the appendix, we present graphs which show how export sophistication has evolved for each country over
the sample period. 89
Their sample period runs from 1990 to 2010.

153
tech, medium-tech and high-tech, the share of high-tech increased in high, medium and low-
income countries but it declined in sub-Sahara Africa. The share of medium-tech
manufactures have increased in all regions with low-income countries and sub-Sahara Africa
having the smallest share. Finally, while the sophistication levels of exported goods and
services have increased, they are relatively low in low-income countries and sub-Sahara
Africa. The reason for this can be traced to exports of low-income countries (particularly sub-
Sahara Africa), and its export basket which is dominated by primary/resource based product
that are low-value, low-tech manufactures and only has a small number of medium-and high-
tech manufactures. In other words, growth in the degree of export sophistication in figure 4.2
may have been triggered by high and medium-income countries (Lall, 2000).
Figure 4.390
shows a positive relationship between the degree of sophistication and GDP per
capita after both variables have been standardized to give them similar scales. The
relationship is explained by the fact that an element of EXPY, a commodity’s PRODY, is
determined by per capita GDPs of countries that are large exporters of that commodity (Lall
et al. 2006 and Hausmann et al. 2007).
FIGURE 4.2
90
. In appendix 4.3, we present scatter plots between export sophistication and GDP per capita for every year
between 1985 and 2000 to check if this relationship is consistent on a yearly basis.
8.4
8.5
8.6
8.7
8.8
Expo
rt So
phis
ticat
ion
(log)
1985 1990 1995 2000Years
Data Source: Dani Rodrik's website
63 Developing Countries (1985-2000)
Trend of Export Sophistication in Developing Countries

154
FIGURE 4.3
Determinants of Export Sophistication
The theory of comparative advantage states that the nature and understanding of trade
between countries is largely dependent on how the cost of production of the exporting
country varies from the production costs of its trading partners. The difference in production
costs between trading partners can be directly linked to the level of productivity in the
countries’ sectors and industries (Ricardo, 1817) or the endowment and comparative
accessibility of production factors between countries (Kletzer and Bardhan, 1987). While
both models are simple in nature, they have been used as a theoretical foundation in
explaining the complex nature of trade between countries.
Ricardo’s model of international trade assumes comparative advantage to be determined by a
relationship between trade and differences in labour supply by means of varied levels of
technology. In other words, Ricardo identifies technological differences in labour as the
factor of production to determine comparative advantage. On the other hand, the Heckscher-
Ohlin model of international trade assumes that the production structure of a country is
determined by its resources. In other words, a country with relatively abundant capital will
export mostly capital-intensive goods, while a country that is endowed with labour is likely to
export mostly labour-intensive goods.
Hence, trade theory principally assumes that the exports of a country should reveal its factor
endowments. This theory also suggests that the production structure of a country and its
-2-1
01
2
1985 1990 1995 2000Year
Export Sophistication GDP per Capita
Data Source: Dani Rodrik's website for export sophistication and WDI GDP per capita
63 Developing Countries (1985-2000)
Export Sophistication and GDP per capita

155
export is largely dependent on its comparative advantage. The Heckscher-Ohlin model
creates a foundation by which the quality of exports from a country is measured. It links
countries’ comparative advantage to the types of production they can profitably engage in
and export. It is however assumed that a country’s exports should include products where it
has comparative advantage; therefore comparative advantage largely determines its export
sophistication.
Factor endowments of a country are classified as natural resources, labour, physical capital,
knowledge capital and institutional quality. Land, crude oil and minerals are typical examples
of natural resources. Countries with abundant natural resources are associated with low
human and physical capital accumulation according to the so-called ‘resource curse’
hypothesis. In the literature, there is empirical evidence to support the hypothesis that
countries with abundant natural resources are likely to experience slow-paced economic
growth and slow technological development in the long-run (Auty, 1998; Sachs and Warner,
1995, 1997, 2001; and Leamer et al. 1999).91
Similarly, Hausmann et al. (2007) finds a
negative relationship between a country’s land area and its degree of export sophistication.
Other factors that affect the production process are knowledge capital (Romer, 1990). Two
fundamental factors that contribute to the creation of knowledge creation are human capital
and Research and Development (Ascari and Di Cosmo, 2004). An increase in human capital
(when human capital is measured by educational attainment) makes the export structure of a
country converge towards the export structure of the group of OECD countries.92
The quality
of institutions is likely to be an important factor that indirectly affects the degree of export
sophistication. It ‘oils’ the effect of factors of production on the export sophistication of
countries. For example, important trade policies can ‘make’ or ‘break’ the volume of exports
as well as it quality (Lo and Chan, 1998; and Schott (2008).
4.2.2.2. Export Diversification
External shocks are a major challenge facing developing countries because they are largely
reliant on commodity exports. Policies that can increase export revenues, sustain export
earnings, and upgrade the trade structure in developing countries are seen as a key solution to
this challenge. Before the First World War, Smith (1776) and Ricardo (1817) developed
91
However, Lederman and Maloney (2003) criticise the robustness of Sachs and Warner by stating that
measurement of resource abundance and estimation techniques used might have determined their conclusion. 92
See Schott (2008) for a detailed discussion on this.

156
traditional theories with the view that free trade was based on comparative advantage,
specialization and international division of labour. However, this view has been criticized on
the grounds that increasing specialization in developing countries meant the continuous
exportation of raw materials and agricultural products in exchange for the consumer and
investment goods manufactured in developed countries (Prebisch, 1950 and Singer,
1950).The Presbisch-Singer hypothesis suggest that when countries specialize their exports in
a few products, it exposes them to increased instability in export revenues and worsens when
the products are subject to worsening terms of trade. The hypothesis emphasizes that the
trade theories of Smith and Ricardo restricted developing countries to the production of
primary products which had negative effects for developing countries irrespective of the time
horizon.
Therefore, for developing countries to increase export revenues, sustain export earnings and
upgrade their export structure, it was essential to diversify the products that were exported. In
the 1980s, many developing countries were led to gradually implement policies that
facilitated outward orientation with the sole aim of maximizing the benefits of exporting.
However, the results of expanding and diversifying exports have been mixed from a
developing country’s point of view. From a developing country point of view, export
diversification is seen to be an upgrade from traditional to more modern exports.
Trade theory suggests that exports diversification can occur via different dimensions.
According to Samen (2010), export diversification mainly occurs through horizontal and
vertical dimensions. Horizontal export diversification occurs within the same sector or
industry and requires changes in the country’s export basket by accumulating new products
on the existing ones within the same sector or industry with the intention of reducing the
negative effects of external shocks and political instability. On the other hand, vertical export
diversification in the production of manufactured products requires an entire shift from the
production sector. For example, it is a shift from the primary to the secondary sector or from
the secondary to the tertiary sector. It requires improving the quality or value of existing
exports by upgrading the production process through technological progress, as well as
improving marketing and logistics. Vertical export diversification particularly has the
potential to create a larger market for raw materials and improve growth since goods that are
processed are likely to have grater price stability than when they are in a raw state.

157
While aggregate exports are seen to be relevant for economic growth and development,
developing countries have struggled to expand and diversify their export baskets. Collier and
Hoeffler (2004) identify economic and political risks as possible dangers accompanied with
an export basket that is concentrated in a few primary commodities. Economic risk associated
with foreign exchange earnings volatility can negatively affect economic growth in the short-
run through increased unemployment, reduced investment, trade volumes and foreign
exchange cash flows, increased inflation, and capital flight. The economic risks are
aggravated in the long-run due to worsening terms of trade conditions. Political risk on the
other hand is associated with a deteriorating level of governance and the likelihood of severe
instability in politically-tense countries. The over-reliance on primary commodities by
countries is related to poor governance, which leads to poor economic performance.
In the literature, export diversification has been measured in different ways and the different
measures are based on the different definitions. In the literature, the most widely used
measure of export diversification is the Concentration Ratio93
i.e. across products. Using the
Concentration Ratio is advantageous because it is easy to compute, available for a large
number of countries and comparisons across countries can be easily examined
In this study, we utilize the Herfindhal-Hirschman index from UNCTADstat. An aggregate
measure of export diversification EXPCON is used in this study because this is what is
prevalent in the literature that explores the relationship between export diversification and
economic growth. The export diversification index is calculated by taking the sum of squares
of all exported products in a country. It has been normalized to obtain value ranking from 0 to
1 (maximum concentration or when only one product is exported). Export diversification
according to the Herfindahl-Hirschman index is based on the following formula:
2
11/
1 1/
ni
i
j
xn
XH
n
(4.4)
where j
H = country index
i
x = value of exports of product i
93 See Agosin (2009), Lederman and Maloney (2003) and Hesse (2008).

158
X = 1
n
i
i
x
and,
n = number of products (SITC rev. 3 at 3-digit group level).
In general, Table 4.494
shows that export concentration has fallen in developing although
there are periods where it increased. For example, during the 1997/1998 Asian financial
crisis, export concentration appears to have risen. Also, the Y2K.com bubble scare may have
been partly responsible for the rise in 2000, although it started to decrease in 2001. The rise
in export concentration was also pronounced after the 2008 crisis. Figure 4.595
shows a
negative relationship between export concentration and GDP per capita (both variables have
been standardized to be similar in scale) - which is expected because it has been highlighted
that export diversification is beneficial for economic growth and development. The area to
the left of Figure can be associated with the period of structural adjustment programmes in
many developing countries (late 1980s to mid-1990s), particularly financial liberalization
policies. A lot of these countries experienced financial and economic instability after the
implementation of these policies.
FIGURE 4.4
94
In the appendix, we present graphs which show how export concentration has evolved for each country over
the sample period. 95
In the appendix, we present scatter plots between export concentration and GDP per capita for every year
between 1995 and 2010 to check if this relationship is consistent on a yearly basis.
.33
.34
.35
.36
.37
Expo
rt Co
ncen
tratio
n
1995 2000 2005 2010Years
Data Source: UNCTAD
68 Developing Countries (1995-2010)
Trend of Export Concentration in Developing Countries

159
FIGURE 4.5
Determinants of Export Diversification
The factors that determine international trade have been previously discussed in the
theoretical trade literature. However, as we previous mentioned, there are no theoretical
model of reference for the determinants of export diversification. We have to rely on
international trade models as well as some empirical studies that examine the determinants of
export diversification. According to the Ricardian model of international trade, the level of
productivity can be seen as a potential determinant of export diversification. Melitz (2003)
suggest that the level of productivity varies across firms, and therefore only firms with the
highest level of productivity are able to export. However, studies like Klinger and Lederman
(2006) and Cadot et al. (2010) find a non-linear (or U-shaped) relationship between the level
of productivity and the degree of export diversification.
Accordingly, Agosin et al. (2012) use the Melitz (2003) model of trade with firm
heterogeneity to determine factors that might affect export diversification. The factors are
classified under three categories: economic reforms, structural factors and macroeconomic
variables. Economic factors include trade openness and financial development. Agosin et al.
measure trade openness as the ratio of trade (exports plus imports) to GDP and financial
development as the ratio of credit to the private sector from commercial banks to GDP. In his
model, Melitz (2003) hypothesizes that trade liberalization can increase the level of export
-2-1
01
2
1995 2000 2005 2010Year
Export Concentration GDP per capita
Data Source: UNCTAD for export concentration and WDI for GDP per capita
68 Developing Countries (1995-2010)
Export Concentration and GDP per capita

160
diversification by raising the number of exporting firms in industries and sectors where there
are enhanced export opportunities.
Melitz (2003) does not directly explore the relationship between financial development
(financial liberalization) and export diversification. Nevertheless, according to an extension
of his model, the effect of financial factors show that liquidity constraint may impede entry
into international markets (Chaney, 2005 and Manova, 2008). Financial development is thus
seen to reduce liquidity constraints and increase the number of exporting firms, resulting in
an increase in the degree of export diversification. Manova (2008) uses a multi-sector model
to show that sectors which rely more on external finance will perform better when the level of
financial development is high. Put differently, financial development would facilitate export
diversification if sectors that rely heavily on external finance produce highly differentiated
goods.
The second classification (structural factors) includes factor endowments and economic
distance. According to Melitz (2003), human capital will positively affect export
diversification if its accumulation makes it possible for a country to upgrade their production
process through specialization from primary to manufactured products. Economic distance on
the other hand could proxy for trade costs. As Melitz (2003) has shown, high variable and
fixed trade cost reduce export volumes (including the number of exporting firms and
differentiated products). So it is expected that the relationship between economic distance
(trade costs) and export diversification will be negative.
The third classification, macroeconomic factors, is understood to reduce the profitability of
production. This could occur directly through exchange rate over-valuation, or indirectly
through uncertainty due, for example, to exchange rate volatility. Terms of trade changes
could also have an effect on export diversification. Exchange rate over-valuation and
volatility are expected to negatively affect export diversification. The effect of exchange rate
over-valuation has a similar effect as economic distance (trade cost) bearing in mind that
stronger exchange rates make export more expensive thereby reducing the profits and number
of exporting firms. The negative effect on exchange rate volatility on export diversification is
linked to the literature on hysteresis96
. This simply means uncertainty creates a situation
96
Hysteresis is a situation where short-run effects are consistent. It could also mean that long-run equilibria are
determined by short-run ones.

161
where production might be adversely affected due to firms’ persistence in production and
trade decisions in the presence of trade costs. Melitz (2003) argues that a weaker exchange
rate is likely to increase the number of exporting firms but, where sunk costs are vital, firms
are unlikely to export because they are unsure if any profits will be made as a result of the
sunk costs. This shows that exchange volatility increases volatility and could possibly have a
negative impact on export diversification.
A positive trend in terms of trade can increase export concentration according to a simple
factor-endowment model. In Agosin et al. (2012), if the world price for a commodity that is
the main export of a country increases, factor resources are reallocated towards this sector,
reducing the access of other sectors to resources due for new production processes (classical
Dutch Disease phenomenon).97
Conversely, Melitz (2003) sees a positive trend in terms of
trade to increase the profits of exporting firms that benefit from this process and could
facilitate export diversification. The effect of terms of trade is therefore an empirical matter.
However, Agosin et al. (2012) investigate this matter further by examining the effect of terms
of trade improvements on export diversification in the presence of human capital
endowments. An interaction term between human capital and the terms of trade improvement
is included in the model since high levels of human capital are seen to be associated with the
production of highly differentiated products. The results suggest that terms of trade
improvement will negatively affect export diversification but only in countries with low
human capital levels. The results on the other hand suggest that terms of trade improvements
will facilitate export diversification in countries with high human capital levels and an
already diversified production base.
Another determinant of export diversification is the size of the economy which is mostly
proxied by the population. The intuition is that larger economies are expected to be more
diversified because they have larger domestic markets and highly specialized production
processes. Market access is another factor that they believe will affect export diversification.
In their study, market access is measured using the country’s membership to preferential
trade agreement. It is understood that due to this membership, exports should improve in
terms of volumes and differentiation. They also see the quality of institutions and FDI as
potential determinants of export diversification.
97
For example, Krugman (1980) and Schott (2008) identify a negative relationship between export
diversification and endowment in natural resources.

162
4.2.3. Methodological Approach
Lall et al. (2000) and Hausmann et al. (2007) do not consider financial factors are important
determinants of export sophistication. Samen (2010) and UNDP (2011) suggest that financial
factors, though trade credits and the reduction of transaction costs can improve export
diversification but they show no empirics to support this, while Agosin et al. (2012) does not
find any evidence that financial development helps countries diversify their exports. Finally,
Cadot et al. (2010) makes no mention of financial factors as possible determinants of export
diversification.
The main objective is to examine the effect of financial sector development on export
structures in developing countries. Export sophistication and diversification are
independently modelled to examine this relationship. This chapter investigates the link
between financial development and export sophistication and diversification for one key
reason: if it is established that financial development increases export sophistication and
reduces concentration, it emphasizes the significance of financial sector development not just
for economic growth and development but for export structure and therefore increases the
importance of financial sector policy reforms with regards to trade policies.
To examine the effect of financial development on export structures, we first examine the
effect of bank development on export sophistication. The benchmark bank development
variable we use is the ratio of private credit to GDP because it by far the most frequently used
measure of financial development in the literature. To identify different functional aspects of
financial sector development, we use four other bank development indicators are used: the
ratio of deposit money bank assets to GDP, liquid liabilities to GDP, the ratio of deposit
money bank assets to central bank assets and deposit money bank assets, and the standardized
sum of all four indicators. Since countries with high per capita GDPs and productivity levels
are assumed to export more sophisticated products, we assume that a significant number of
these products will be high-technologically intensive. For this reason, we extend the model
by replacing export sophistication with high-skill manufactured exports as a ratio of total
exports. High-skill manufactured exports are from the UNCTADstat database and data sample
is similar to export concentration. Secondly, we examine the effect of bank development on
export sophistication. Similar to export sophistication, the ratio of private credit to GDP is the
benchmark bank development variable and the other four are used for robustness. For
robustness analysis, we include an export diversification index from UNCTAD. The index

163
measures whether the structure of exports by product of a given country differ from the
structure of product of the world. The index ranges from 0 to 1 reveals the extent of the
difference between the structure of a country and the world average. A higher value would
indicate larger difference from the world average, and therefore more concentration. This
index is sometimes referred to as a ‘similarity index’ of trade.
The methodology proceeds by broadly investigating the impact of financial development on
export sophistication and diversification where financial development includes general
characteristics of the financial system and includes relevant control variables to the respective
models of export sophistication and diversification. The country sample and time period are
restricted to relevant data availability. The time period is relevant to this study because it
overlaps a period where most countries in the sample have already initiated some form of
financial liberalization
4.3. EMPIRICAL FRAMEWORK
4.3.1. Model Specification
The empirical model estimates that export sophistication is function of the level of financial
development, through the functions of the financial system that were stated in Levine (1997).
The chapter would help in determining whether cross-country variation in financial
development can help in explaining cross-country variation in export structures, as well as
exploiting time-series variation on the data. Additionally, panel data estimation makes it
possible to control for biases due to country-specific effects. Time dummies are also included
in the model to control for possible policy changes that have been undertaken over the period
under consideration but are not presented because of economic of space. The following
regression is therefore estimated:
1 , 1 2 3 ,it i t it it i t it
EXPY EXPY BNK CV
(4.5)
where EXPYit measures the degree of export sophistication in country i at time t, EXPYi,t-1 is
the lagged dependent variable, BNKit is some measure of bank development, CVit is set of
conditioning variables in country i at time t, i
and t are country-and time-specific effects,
and it is the error term. We estimate the impact of financial development on export
concentration using the following model:

164
1 , 1 2 3 ,it i t it it i t itEXPCON EXPCON BNK CV
(4.6)
where it
EXPCON measures the degree of export concentration in country i at time at time t,
while , 1i t
EXPCON
.The existence of the so-called dynamic panel bias involves some
econometric problems in estimating (4.5) which can be solved using a system-GMM
estimator proposed by Blundell and Bond (1998). The system-GMM estimator was used in
the previous chapter and how it solves the associated econometric problems with dynamic
panels, as well as its advantages over other panel estimators have already been discussed in
Chapter 3.
4.3.2. Variable Descriptions
1. Financial Development
The importance of financial development is largely established in the literature and has
already being previously discussed in this study. The next issue with financial development is
the existence of an adequate direct measure of it. According to Cihak et al. (2012), for
financial development to be properly measured, one would need to have direct measures of
how well the financial system processes information prior to probable investment projects
and capital allocation; monitors investment projects and ensures corporate governance after
financing; manages risk; mobilizes and pools savings; and eases the exchange of goods and
services. However, it has not been possible to obtain precise measures for these functions.
While proxy measures for different characteristics98
of the financial systems have been made
available, this study will employ proxy measures of financial depth for financial institutions
for reasons related to data availability and the fact that banks are more active in many
developing countries.
Financial depth refers to the extent of services provides by the financial system (particularly
banks). Financial depth proxies used in the study include the ratio of private sector credit to
GDP99
(BNKDEV), ratio of deposit money bank assets to GDP (BNKSIZE), ratio of M2 to
GDP (BNKLIQ), ratio of deposit money bank assets to central bank assets plus deposit money
bank assets (BNKCBN) and financial intermediation development 100
(FININTDEV).
98
Financial depth, financial access, financial efficiency, and financial stability. 99
This proxy is the one that is most widely used in the empirical literature. 100
This is a summation of the standardized values of all four financial indicators previously mentioned.

165
BNKDEV measures to large extent financial intermediary services provided for the private
sector. BNKSIZE measures the importance of financial services in relation to the size of the
economy. BNKLIQ broadly measures financial intermediation since it includes the central
bank, commercial banks and non-bank financial intermediaries. BNKCBN measures the
relative importance of deposit money banks relative to central banks. Finally, FININTDEV is
a broad measure of the other four indicators.
2. Trade
Agosin et al. (2012) established that international trade was a determinant of export
diversification. In this study, we measure trade openness TRADE as the ratio of the sum of
exports and imports to GDP. We treat trade openness as exogeneous to export sophistication
because when exporters are more productive than non-exporters, this would help
sophistication (for example, through learning by exporting as well as other effects. Similarly,
its effect on export concentration is exogeneous because it increases the variety of exports.
3. GDP per capita
Income level of a country is a significant determinant of the level of export sophistication and
diversification. We measure this by using the log of GDP per capita GDPPC. We treat
GDPPC as exogenous in these models not only because higher EXPY and less EXPCON can
increase GDPPC, but because both variables change as a result of policy shocks.
4. Human Capital
In Hausmann et al. (2007), the model hypothesizes human capital and the size of the labour
force to be two key determinants of production specialization. Melitz (2003) emphasizes the
importance of human capital in export diversification. In this study, human capital is
measured by using the average years of schooling in the population over 15 years, from Barro
and Lee (2010).101
We treat human capital as an endogenous determinant of export
sophistication. According to Hausmann et al. (2007), it might be difficult to define a causality
from human capital to export sophistication, rather they suggest that export sophistication is
more likely to cause human capital accumulation.
101
Average years of schooling by Barro and Lee are only in 5-year intervals, rather than yearly. To use this
indicator in our estimation, we used a linear interpolation to estimate the ‘missing observations’.

166
5. Land-Labour Ratio
Although not discussed in their study, Hausmann et al. (2007) have included the log of land
area as a determinant of export sophistication and it tends to have a negative effect on export
sophistication. In this study we have included the land-labour ratio LANDLAB to control for
countries that are rich in natural resources. The land-labour ratio is simply the ratio of total
land area to the size of the labour force. We therefore, would expect LANDLAB to have a
negative impact on export sophistication as we would expect it to impede export
diversification. LANDLAB is relatively an exogenous variable for both EXPY and EXPCON,
because we believe causality runs from LANDLAB to EXPY and EXPCON.
6. Terms of Trade Growth
Countries with positive terms of trade of trade growth rate are expected to have larger trade
balances (Beck, 2002). According to Agosin et al. (2012), a simple factor-endowment model
shows that an improvement in terms of trade can increase export concentration (or reduce
export diversification). However, in the Melitz (2003) model, terms of trade improvements
are modelled to increase export profitability which in turn increase export diversification,
leaving the sign of the effect of terms of trade on export diversification to be purely an
empirical matter. However, as we would see in our study, terms of trade growth TOTGR
improves export sophistication and increases export concentration. TOTGR is the rate of
change in the level of terms of trade. We treat TOTGR in both models as exogenous because
in terms of international trade, many developing countries are price takers in the world
market for their exports and imports and consequently they face the outcome of adverse
movements in the terms of trade, stemming from exogenous price shocks in its imports and
exports. Increasing EXPY or reducing EXPCON is unlikely to affect export or import prices,
and therefore TOTGR.
7. Foreign Direct Investment
FDI inflows are seen to improve export sophistication and reduce export concentration. This
is possible through two channels: one direct, the other indirect. Through the direct channel,
domestic firms that are in a joint venture with foreign firms export more sophisticated
products (See Rodrik, 2006; Xu and Lu, 2007 and Harding and Javorcik, 2009). Indirectly,
FDI can affect the economy through spillovers and this is evidenced in domestic firm
productivity and innovation. In their model, Koko and Globerman (2000) identify the factors
that determine the extent and scale of FDI spillovers to domestic firms in the host countries.

167
They find that a competitive market in the host country and its absorptive capacity are
important for positive spillovers102
. In other words, it is possible that FDI could affect export
sophistication and diversification positively but this will depend on how competitive the host
market is and on its absorptive capacity. However, in our study, we would expect FDI to
positively affect export sophistication and diversification. We measure FDI as the net inflows
of foreign direct investment. We treat FDI as an exogenous determinant EXPY and EXPCON.
However, it is possible that higher EXPY and less EXPCON could also attract FDI, leading to
a problem of endogeneity. We believe that rather than high EXPY and low EXPCON, it is
factors that lead to high EXPY and low EXPCON that attract FDI e.g. favourable investment
climate, resource availability and quality of institutions (Weldemicael, 2012).
4.3.3. Data Specification
For the specification which uses export sophistication, the data covers an annual period of
1985-2000 for 63 developing countries. While data for export sophistication is available from
1962, the consistent availability of bank development data begins from 1985. On the other
hand, the country sample was determined by data availability for both export sophistication
and bank development. From the country sample, we have also dropped former members of
the defunct Union of Soviet Socialist Republics and small island nations. The specification on
export concentration uses data from 1995 to 2010 for 68 developing countries. The time
period was primarily determined by data availability for export concentration, while the
country sample was determined in the same manner as export sophistication.
The summary statistics for the key variables employed in this study are presented in Tables
3.1 and 3.2 based on yearly observations. Table 3.1 presents summary statistics of export
sophistication and key variables between 1985 and 2000. The export sophistication index has
been converted into logs with an average of 8.6 but with a large difference between the
minimum value of 7.37 (e.g. in Chad Republic) and the maximum value of 9.56 (e.g. Korea
Republic). The export sophistication index is expected to be higher in countries that are richer
as seen in the paper by Hausmann et al. (2007). Export diversification on the other hand, has
an average of 34.7 percent with a low of 6.2 percent (e.g. in South Africa) and a maximum of
96.1 percent (e.g. in Nigeria). In appendix 4.6, we present scatter plots to portray stability of
102
These factors have been established by Girma (2005), Markusen and Venebales (1998), and Cheung and Lin
(2004).

168
the relationship between financial development and export structures over different time
subsamples of the time period.
Table 4.1: Summary Statistics of Key Variables Annually (1985-2000) VARIABLE OBS. MEAN STD.DEV. MIN MAX
EXPY 1007 8.60351 0.45846 7.3732 9.5599
BNKDEV 927 0.28206 0.27000 0.011 1.7645
BNKSIZE 932 0.34545 0.29137 0.0219 1.8759
BNKLIQ 898 0.39267 0.28613 0.0463 2.1737
BNKCBN 962 0.7253 0.2032 0.0905 1
FININTDEV 875 -0.2108309 3.061826 -6.043654 13.48106
HUMCAP 928 5.42669 2.26489 0.777 11.055
TRADE 1008 0.67017 0.38740 0.1345 3.2643
TRADEOPEN 1003 9.58e-10 0.35925 -0.7202 2.2286
TOTGR 1008 0.12927 16.22986 -52.357 182.2143
GDPPC 971 6.800674 1.14453 4.7526 10.2157
LANDLAB 1008 0.087522 0.12268 0.0003 0.7493
FDI 979 18.40204 2.88214 -20.1012 24.849
Table 4.2: Summary Statistics of Key Variables Annually (1995-2010) VARIABLE OBS. MEAN STD.DEV. MIN. MAX.
EXPCON 1088 0.3471864 0.201606 0.061831 0.9607
BNKDEV 1045 0.389988 1.958288 0.019615 0.609
BNKSIZE 1045 0.504918 2.907805 0.024319 0.9132
BNKLIQ 1032 0.578064 3.333245 0.069142 1.0335
BNKCBN 1032 0.7951572 0.183 .1241956 0.9999
FININTDEV 996 -.0100296 3.105871 -4.391611 46.04941
HUMCAP 1008 6.36505 2.351744 0.9248 11.8479
TRADE 1008 0.771728 0.603299 0.137859 4.3305
TRADEOPEN 1086 0.011657 6.555648 -43.6547 65.8651
TOTGR 1056 0.129667 3.701493 -32.4864 68.2540
GDPPC 1088 7.213545 1.274857 4.723108 10.687
LANDLAB 1088 0.182861 0.3773741 0.000002 2.5510
FDI 969 19.98664 2.474918 2.374347 25.94406
Tables 4.3 and 4.4 show the correlation matrix between the key variables used in the
regression for export sophistication and concentration during both time periods. The
significant relationships between some of these variables are evident. First of all, in Table
4.3, the significant and positive relationship between financial development (BNKDEV,
BNKSIZE, BNKLIQ, BNKCBN and FININTDEV) and export sophistication is evident. In
other words, financial development and export sophistication are positively related. This
relationship has not been thoroughly examined in the literature but in the first instance, it is
what you would expect. Other variables have the expected signs in terms of relationship with
export sophistication except the terms of trade growth. The level of human capital, trade
openness, GDP per capita and foreign direct investment all correlate positively with export
sophistication and are significant. The land-labour ratio is negatively correlated as we would
expect and is significant. Terms of trade growth is negative and not significant but like has
been stated previously, the sign is an empirical matter. Another correlation to take note of is
the relationship between human capital and terms of trade growth: positive and significant. In

169
other words, high level of human capital is present with positive terms of trade growth. Trade
openness is also positively correlated with terms of trade growth.
In Table 4.4, the correlation between financial development and export concentration is
negative and significant; suggesting that export diversification is accompanied by financial
development. Other variables such as trade openness, GDP per capita, and foreign direct
investment are negatively correlated with export concentration and significant. Human capital
and the land-labour ratio have a positive and significant relationship with export
concentration, while terms of trade growth has an insignificant relationship.
4.4. EMPIRICAL RESULTS
4.4.1. Result Diagnostics
After estimating the model, the following regression results are presented and discussed: first,
the impact of financial development on export sophistication is presented in Table 4.5, while
the impact of financial development on export concentration is presented in Table 4.6. Each
table has five columns: in each column, banking development represents a different measure,
i.e. column 1 uses private credit to GDP, column 2 uses total banking assets to GDP, column
3 uses liquid liabilities to GDP, column 4 uses bank assets to central bank plus bank assets,
and column, financial intermediation development. We have included period dummies in all
regressions although we do not present them in the regressions, and the relevant regression
tests have been included at the end of the tables. The robustness analyses are presented in
Tables 4.7 and 4.8.
4.4.2. Export Sophistication
Table 4.5 shows regressions results for the export sophistication index. All of the control
variables are significant with most of them have the have the expected signs, and largely
robust across the different specifications. Trade openness seems to favour export
sophistication except in column 4. The results also suggest that per capita GDP is positively
related to export sophistication (i.e. per capita GDP is a good predictor of the quality of
export specialization). The results on human capital suggest that countries associated with
higher skill- or human capital accumulation can export more sophisticated goods (except in
column 3). The coefficients for land-labour ratio are negative and significant in all the
specifications, supporting the ‘resource hypothesis’ hypothesis that abundance in natural
resources hinders a country’s efforts in skills accumulation and industry upgrading.

170
The coefficients of the growth in terms of trades are consistently negative in the first 3
columns. Positive terms of trade shocks may hinder export sophistication when a price
increase of major exports reallocates factors away from other sectors, making it more
expensive to produce and export sophisticated goods. However, in column 5, export
sophistication could benefit from positive terms of trade shocks through an increase in export
profitability. FDI tends to promote export sophistication through joint-ventures between
domestic and foreign firms, and through positively spillover effects on productivity and
innovativeness of domestic firms. The lagged dependent variable is significant and positive
across all specifications, suggesting a strong persistent behavior of export sophistication. In
other words, the current degree of sophistication in exported products depends on previous
learning from exporting. For example, exporting firms that aggressively run efficient and
low-cost operations are more likely to produce more sophisticated products than firms that
are operated less efficiently and more conservatively.
Our interest lies in the coefficients of financial development. Results suggest that financial
development has a negative and significant effect on export sophistication at 1, 5 and 10
percent (except for the bank liquidity ratio in column 3 which is negative but insignificant).
To some extent, we argue that these results are robust across the different specifications. The
results also show that it is not implausible to suggest that the degree of financial development
is a robust determinant of export sophistication. Based on the elasticities, a 1% increase in
financial development significantly decreases export sophistication by between 0.23 and 1.42
percentage points. In contrast to a significant number of studies in the literature, financial
development may lead to less quality in export specialization because investors are unlikely
to take the risk of financing in untried projects but would rather finance activities where the
economy uses known technology or where they have comparative advantage. These results
are supported by the empirical study of Jaud et al. (2012) where they suggest the allocative
and disciplining role of finance. In their paper, they argue that banks do not promote exports
in a broad unbiased manner. Rather, banks encourage exporting firms to optimally produce
and export in activities where the country has comparative advantage. In this manner,
financial sector development reduces the ability of innovative firms to produce and export
more sophisticated goods.

171
Table 4.3: Pairwise Correlation Matrix of the Key Variables Annually (1985-2000)
EXPY BNKDEV BNKSIZE BNKLIQ BNKCBN FININTDEV HUMCAP TRADE TRADEOPEN TOTGR GDPPC LANDLAB FDI
EXPY 1.00
BNKDEV 0.34*** 1.00
BNKSIZE 0.36*** 0.97*** 1.00
BNKLIQ 0.33*** 0.86*** 0.91*** 1.00
BNKCBN 0.20*** 0.53*** 0.51*** 0.40*** 1.00
FININTDEV 0.31*** 0.94*** 0.95*** 0.87*** 0.72*** 1.00
HUMCAP 0.60*** 0.42*** 0.40*** 0.36*** 0.34*** 0.33*** 1.00
TRADE 0.18*** 0.41*** 0.40*** 0.43*** 0.10*** 0.25*** 0.24*** 1.00
TRADEOPEN 0.09*** 0.31*** 0.31*** 0.35*** 0.02 0.17*** 0.05 0.93*** 1.00
TOTGR -0.00 -0.03 -0.02 -0.01 -0.03 -0.04 0.02 0.01 0.02 1.00
GDPPC 0.52*** 0.51*** 0.51*** 0.43*** 0.41*** 0.49*** 0.74*** 0.20*** -0.12*** 0.00 1.00
LANDLAB -0.26*** -0.21*** -0.23*** -0.28*** -0.10*** -0.23*** -0.15*** -0.09*** -0.16*** -0.05* -0.01 1.00
FDI 0.48*** 0.49*** 0.50*** 0.39*** 0.25*** 0.46*** 0.50*** 0.15*** 0.11*** 0.02 0.50*** -0.13*** 1.00
Note: The robust standard errors are in parentheses where * indicates significance at the 10% level,
** indicates significance at the 5% level and
*** indicates significance at the 1% level
Table 4.4: Pairwise Correlation Matrix of the Key Variables Annually (1995-2010)
EXPCON BNKDEV BNKSIZE BNKLIQ BNKCBN FININTDEV HUMCAP TRADE TRADEOPEN TOTGR GDPPC LANDLAB FDI
EXPCON 1.00
BNKDEV -0.14*** 1.00
BNKSIZE -0.15*** 0.86*** 1.00
BNKLIQ -0.17*** 0.86*** 0.97*** 1.00
BNKCBN -0.33*** 0.02 0.05 0.05 1.00
FININTDEV -0.04 0.88*** 0.93*** 0.93*** 0.36*** 1.00
HUMCAP 0.12*** 0.65*** 0.72*** 0.73*** -0.12*** 0.64*** 1.00
TRADE -0.05* 0.03 0.12 0.03 -0.01 0.24*** 0.17*** 1.00
TRADEOPEN -0.07** 0.02 -0.11*** -0.22*** 0.03 -0.10*** 0.20*** 0.09*** 1.00
TOTGR 0.03 0.13*** 0.24*** 0.19*** 0.03 0.04 0.14*** -0.02 0.19*** 1.00
GDPPC -0.29*** -0.01 -0.03 -0.05 0.14*** 0.11*** -0.15*** 0.13*** 0.02 0.03 1.00
LANDLAB 0.05* -0.10*** -0.14*** 0.15*** -0.16*** 0.08*** 0.15*** -0.03 0.01 0.05 -0.13*** 1.00
FDI -0.15*** -0.24*** 0.29*** 0.30*** 0.17*** 0.32*** 0.22*** 0.03 0.03 0.03 0.12*** 0.55*** 1.00
Note: The robust standard errors are in parentheses where * indicates significance at the 10% level,
** indicates significance at the 5% level and
*** indicates significance at the 1% level.

172
Table 4.5: The Effect of Financial Development on Export Sophistication.
Variables 1 2 3 4 5
EXPY EXPY EXPY EXPY EXPY
EXPYt-1 0.809*** 0.825*** 0.825*** 0.806*** 0.762***
(0.0760) (0.0736) (0.0770) (0.109) (0.0897)
BNKDEV -0.0597*
(0.0356)
TRADE 0.151** 0.139** 0.136* 0.211 0.309*
(0.0777) (0.0742) (0.0762) (0.161) (0.0829)
GDPPC 0.0004** 0.0004* 0.0004** 0.0011** 0.0013**
(0.000223) (0.000245) (0.000267) (0.000571) (0.000557)
HUMCAP 0.157* 0.150* 0.137 0.173* 0.252*
(0.103) (0.105) (0.109) (0.170) (0.179)
LANDLAB -0.0512*** -0.0432*** -0.0423*** 0.0860** -0.124***
(0.0192) (0.0154) (0.0157) (0.0479) (0.0507)
TOTGR -0.0562*** -0.0541** -0.0429** 0.0460 0.0695*
(0.0206) (0.0202) (0.0229) (0.0406) (0.0555)
FDI 0.0157* 0.0141* 0.0142* 0.0234* 0.0297**
(0.0084) (0.0082) (0.0084) (0.0154) (0.0146)
BNKSIZE -0.0617**
(0.0291)
BNKLIQ -0.0344
(0.0316)
BNKCBN -0.525*
(0.323)
FININTDEV -0.143***
(0.0581)
CONS 1.673*** 1.550*** 1.498*** 1.932** 1.814***
(0.607) (0.582) (0.604) (1.063) (0.739)
No. of Obs. 842 841 840 822 806
AR(1) test -3.29 (0.001)
-3.32 (0.001)
-3.31 (0.001)
-3.35 (0.001)
-3.29 (0.001)
AR(2) test -0.29 (0.774)
-0.27 (0.786)
-0.27 (0.786)
-0.17 (0.862)
0.11 (0.912)
Hansen test 3.43 (0.489)
3.26 (0.515)
3.08 (0.544)
4.31 (0.366)
3.45 (0.485)
Note: Each column in this table reports statistics from system GMM two-step regressions, where the dependent variable is the log of export sophistication. The robust standard errors are in parentheses where * indicates significance at the 10% level, ** indicates significance at the 5% level and *** indicates significance at the 1% level. AR(1) and AR(2) are p-values and t-statistics of the test of first and second order autocorrelations and Hansen is the p-value and t-statistics of the Hansen test of overidentifying
restrictions.
4.4.3. Export Concentration.
Table 4.6 shows the regression results for export concentration. All control variables are
significant and most of them have the expected signs. Trade openness is seen to reduce export
concentration and this result is consistent across all specification. In line with previous
theoretical literature, trade openness is associated with product differentiation and
heterogeneous firms. These findings are in contrast to Agosin et al. (2012) who find that
trade openness is associated with export concentration. The negative and significant
coefficients of per capita GDP suggest that it reduces export concentration. This evidence
suggests that there is a uniform positive relationship between the level of development and
export diversification. These results are in line with theoretical contributions which suggest
that increased export concentration is associated with lower levels of development, as a result
of scarcity of capital and indivisibility of investment project (Acemoglu and Zilibotti, 1997).

173
There is a possibility of non-linear effects; however, I did not find any. The turning point of
such relationship is at high level of income which is too high for the countries included in the
sample. The land-labour ratio, a measure of countries’ natural resources increases the degree
of export concentration. Developing countries with abundant natural resources are unlikely to
invest in human capital, capital accumulation and technological advancement; rather, they
would be more interested in exporting these resources, particularly in their raw forms. This is
unlikely to diversify the production base of the economy; therefore, it leads to an increase in
the degree of concentration.
The coefficients suggest that terms of trade improvements increase the degree of export
concentration. Similar to the discussion we have provided for positive terms of trade shocks
in export sophistication, increase in export prices can negatively affect export diversification.
The negative and significant coefficients of FDI suggest that FDI inflows lead to higher
productivity in developing countries, as well as positive externalities which help domestic
firms become more competitive resulting in a higher degree of export diversification. Finally,
the lagged dependent variable is positive and significant is all specifications suggesting
persistence overtime of export concentration: the inability of exporting firms to diversify their
export base predicts the degree of future export concentration.
For our variable of interest, our results suggest that financial development worsens export
concentration. The results are significant at 5 and 10 percent (except for BNKCBN, which is
insignificant). While there are currently no theoretical models where financial factors are
seen possible predictors of the degree of concentration, our results suggest financial
development not only predicts export concentration, but it promotes it. Based on the
elasticities, a 1% increase in financial development significantly increases export
concentration by between 0.21 and 0.87 percentage points. Empirical studies that have not
considered financial factors as possible determinants of export diversification include Cadot
et al. (2010) and Parteka and Tamberi (2013). In Agosin et al. (2012), we find some
interesting facts about the relationship between export concentration and financial reforms
between 1962 and 2000. Their graph shows that the degree of export concentration falls after
different episodes of financial reforms. However, they also point out that export
concentration was already falling before the episodes of financial reforms, casting doubt on
the effect of financial reforms on export diversification. Empirically, they find no evidence
that financial development is a significant predictor of export diversification.

174
In a similar argument to the relationship we find between export sophistication and financial
development, we find more evidence that supports our results and we trace this effect to the
fact that banks are more likely to finance exporting activities in which the country has
competitive advantage relative to activities that are unknown and untried because of the costs
and risk involved. Financial development is expected to increase export concentration in
developing countries through the following channel: when the main exported products of a
country are performing well, it is possible that the financial system would reallocate financial
resources towards these industries and away from other industries where the potentials and
opportunities are not as high. This improves the specialization of the main exports while
other exports worsen in performance or even disappear from the market. An increase in
specialization of the main exports increases concentration in the export structure as has been
seen in many developing countries.
Table 4.6: The Effect of Financial Development on Export Concentration.
Variables 1 2 3 4 5
EXPCON EXPCON EXPCON EXPCON EXPCON
EXPCONt-1 0.718*** 0.563*** 0.618*** 0.695*** 0.566***
(0.0912) (0.107) (0.122) (0.206) (0.202)
BNKDEV 0.0082*
(0.0049)
TRADE -0.0413* -0.0505* -0.0489* -0.0612* -0.0721*
(0.0267) (0.0291) (0.0292) (0.0381) (0.0409)
GDPPC -0.0118* -0.0236** -0.0185** -0.0121 -0.0242*
(0.0076) (0.0097) (0.0093) (0.0128) (0.0149)
LANDLAB 0.0042* 0.0065* 0.0058* 0.0059 0.0084*
(0.0041) (0.0043) (0.0045) (0.0053) (0.0067)
TOTGR 0.0636*** 0.0949*** 0.0797*** 0.0741* 0.0957**
(0.0247) (0.0204) (0.0279) (0.0459) (0.0429)
FDI -0.0149** -0.0271*** -0.0217*** -0.165 -0.0276*
(0.0067) (0.0098) (0.0058) (0.0121) (0.0149)
BNKSIZE 0.0073**
(0.0035)
BNKLIQ 0.0035**
(0.0018)
BNKCBN -0.0146
(0.0658)
FININTDEV 0.0087**
(0.0044)
CONS. 0.120 0.301 0.231 0.120 0.307
(0.118) (0.177) (0.148) (0.160) (0.240)
No. of Obs. 949 947 946 931 905
AR(1) test -3.89 (0.000)
-3.54 (0.000)
-3.97 (0.000)
-3.56 (0.000)
-3.31 (0.001)
AR(2) test 1.27 (0.206)
1.27 (0.206)
1.25 (0.210)
0.95 (0.343)
1.12 (0.264)
Hansen test 7.30 (0.121)
6.93 (0.145)
6.95 (0.139)
6.48 0.134
6.46 (0.151)
Note: Each column in this table reports statistics from system GMM two-step regressions, where the dependent variable is the log of export sophistication. The robust standard errors are in parentheses where * indicates significance at the 10% level, ** indicates significance at the 5% level and *** indicates significance at the 1% level. AR(1) and AR(2) are p-values and t-statistics of the test of first and second order autocorrelations and Hansen is the p-value and t-statistics of the Hansen test of overidentifying
restrictions.

175
4.4.4: Robustness
While our results are firmly robust across different measures of financial development, we go
a step further to check whether the results will hold when we replace the dependent variables:
ratio of high-skill manufactures to total exports HIGHEXP for export sophistication and the
similarity index EXPDIV for export concentration. If the assumptions based on our previous
results are correct, then we should expect financial development to have a negative effect on
HIGHEXP and a positive effect on EXPDIV. In both models, we have excluded the growth in
terms of trade improvements because it was insignificant in all specifications. In Table 4.7,
we present regression results for the high-skill manufactures ratio. The coefficients for the
control variables have the expected signs are significant across all specifications (except for
columns 4 and 5 where trade openness, human capital and FDI inflows have the expected
signs but are insignificant). The lagged dependent variable is positive and significant in all
the specifications and continues to show persistence. In all but one of the specifications, we
get coefficients which suggest that financial development may hinder the ability of
developing countries to export high-value or sophisticated products.
Table 4.7: The Effect of Financial Development on High-Skill Manufacture Exports
Variables 1 2 3 4 5
HIGHEXP HIGHEXP HIGHEXP HIGHEXP HIGHEXP
HIGHEXPt-1 0.572*** 0.589*** 0.602*** 0.669*** 0.693***
(0.164) (0.157) (0.154) (0.085) (0.085)
BNKDEV -0.0215***
(0.0092)
TRADE 0.0328** 0.0304** 0.0283** 0.0311 0.0282
(0.0153) (0.0153) (0.0142) (0.0263) (0.0191)
GDPPC 0.0006* 0.0006* 0.0006** 0.0002** 0.0001**
(0.00032) (0.00032) (0.00035) (0.0067) (0.0006)
HUMCAP 0.0534* 0.0531* 0.0463* 0.0427 0.0322
(0.0302) (0.0307) (0.0266) (0.0309) (0.0290)
LANDLAB -0.0074* -0.0064* -0.0059* -0.0111** -0.0110**
(0.0044) (0.0043) (0.0043) (0.0056) (0.0507)
FDI 0.0026** 0.0027** 0.0026* 0.0025 0.0297
(0.0014) (0.0014) (0.0014) (0.0019) (0.0017)
BNKSIZE -0.0171*
(0.0096)
BNKLIQ -0.0112**
(0.0056)
BNKCBN -0.0570*
(0.0335)
FININTDEV -0.075
(0.0050)
CONS -0.021 -0.020 -0.023 0.016 -0.029
(0.0217) (0.0213) (0.0220) (0.0375) (0.0279)
No. of Obs. 908 909 905 896 869
AR(1) test -2.55 (0.011)
-2.61 (0.009)
-2.66 (0.008)
-2.91 (0.004)
-2.93 (0.003)
AR(2) test -0.18 (0.857)
-0.19 (0.851)
-0.22 (0.823)
-0.30 (0.761)
-0.26 (0.795)
Hansen test 6.75 (0.150)
6.96 (0.138)
6.56 (0.164)
3.06 (0.548)
4.92 (0.295)

176
In Table 4.8, we present regression results for export diversification. All the control variables
are significant and have the expected signs (except for the land-labour ratio in columns 2 and
5 which has the expected sign but is insignificant). The lagged dependent variable is positive
and significant in all the specifications suggesting persistence. Finally, in all but one of the
columns, the coefficients for our bank development variables are positive and significant,
indicating that financial development hinders the ability of countries diversify their export
structures similar to the world average.
Table 4.7: The Effect of Financial Development on Export Diversification (Similarity Index)
Variables 1 2 3 4 5
EXPDIV EXPDIV EXPDIV EXPDIV EXPDIV
EXPDIVt-1 0.241* 0.292* 0.297* 0.461** 0.433***
(0.153) (0.187) (0.171) (0.208) (0.156)
BNKDEV 0.0030*
(0.0019)
TRADE -0.0028*** -0.0019* -0.0014*** -0.0017* -0.0016***
(0.0011) (0.012) (0.0038) (0.0099) (0.0065)
GDPPC -0.0426*** -0.0413*** -0.0419*** -0.0269** -0.0354***
(0.0123) (0.0149) (0.0138) (0.0119) (0.0129)
LANDLAB 0.0637* 0.0493 0.0294* 0.0376* 0.0078
(0.0229) (0.0371) (0.0176) (0.0206) (0.0153)
FDI -0.0221** -0.0241*** -0.0252*** -0.0157** -0.0202***
(0.0068) (0.0098) (0.0094) (0.0081) (0.0075)
BNKSIZE 0.0029*
(0.0014)
BNKLIQ 0.0044***
(0.0017)
BNKCBN -0.0239
(0.0646)
FININTDEV 0.0134***
(0.0054)
CONS. 1.239*** 1.227*** 1.246*** 0.839*** 1.022**
(0.269) (0.357) (0.349) (0.340) (0.302)
No. of Obs. 949 947 946 931 905
AR(1) test -3.74 (0.000)
-3.22 (0.001)
-3.35 (0.001)
-3.43 (0.001)
-4.19 (0.000)
AR(2) test 1.33 (0.183)
1.30 (0.192)
1.32 (0.210)
0.97 (0.332)
1.05 (0.295)
Hansen test 3.55 (0.737)
3.99 (0.262)
6.95 (0.188)
3.82 (0.282)
5.07 (0.535)
4.5. CONCLUSION
This chapter analyzed the effects of financial development on the export structure of
developing countries. The empirical results from a 16 year panel (1985-2000 and 1995-2010)
with between 63 and 68 developing countries provide some evidence that is largely not in
support of previous research on the relationship between financial development and
specialization in international trade. Specifically, we find that financial development hinders
the sophistication of exports in developing countries and these results hold when we use a
battery of bank sector development indicators and high-skill manufactures exports. Also, we

177
find that financial development negatively predicts export concentration and these results
hold when we a different measure of export concentration. In other words, financial
development may be unable to reduce the funding difficulties experienced by innovative
firms caused by market failures in developing countries, and may even worsen it. For
exporting firms to increase the degree of sophistication and to diversify their exports, they
require new technology but banks are unlikely to finance these investments because of the
costs and risk involved, leading to less sophisticated and more concentrated exports, making
developing countries poorer.
Our results contribute to the literature in two ways. First of all, it finds that financial
development reduces the degree of export sophistication in developing countries. This finding
is unique because it is an original contribution to the literature. Secondly, the study
contributes to the literature by finding that financial development increases export
concentration in developing countries. As we previously stated, there are no theories that link
financial factors with export diversification and some recent studies have not considered
financial factors as important determinants of export diversification. Our contribution is
unique because it links financial development to export diversification and it identifies a
significant negative effect.
From a policy perspective, conventional wisdom tells us that financial sector development
should promote the export sophistication and diversification because firms suffer less from
financial constraints. However, financial development might harm export sophistication and
diversification in developing because of persistent market failures. For financial development
to positively affect the degree of export sophistication and diversification in developing
countries, government intervention might be required in financial markets through the
provision of finance to exporters, particularly during market failures. This not only helps
firms to produce more value-added products, it helps them to develop and export new
products. However, this step alone might not be enough to make the exports of domestic
firms more competitive. More government intervention might be required through divisive
selective measures in the form of fiscal and direct credit incentives and selective subsidies.
Also, Government can intervene through maintaining market discipline. For example, banks
might need to be persuaded to provide loans to exporters at rates fixed by the government.

178
Our results suggest that financial development without government intervention in
developing countries may be bad for export sophistication and diversification due to market
failures. Therefore, it would be interesting to directly test the effect of government
intervention on this relationship. Also, compared to data on bank development, data on
capital market is limited103
. However, it would be interesting to see if the relationship will
hold if capital market development indicators are used.
This study has one key drawback. There are no widely accepted theoretical models that
explain export diversification. Therefore, it may take some time to identify the key
determinants of export diversification. Presently, there are still studies that try to examine the
determinants of export diversification. So, hopefully in the near future, determinants based on
widely accepted theoretical models will become available.
103
Although this might reduce the period and country sample because many developing countries do not have
active capital markets.

179
Appendix 4.1: Export Sophistication and Concentration at Country-Level
Country Export Sophistication Export Concentration
Algeria - 53.95
Argentina 9770.28 14.03
Bangladesh 4887.43 37.17
Benin 2523.56 49.45
Bolivia 6180.90 30.14
Botswana - 57.11
Brazil 10098.11 9.51
Burkina-Faso 3303.93 59.52
Burundi 2869.42 56.90
Cameroon 4437.38 39.89
Central African Republic - 46.71
Chad 1894.85 78.21
Chile 7971.44 31.70
China 9555.77 9.11
Colombia 6448.73 24.48
Congo 5337.65 74.19
Costa Rica 6118.17 27.51
Cote d'Ivoire 3213.81 35.25
Dominican Rep 7093.15 21.66
Ecuador 5145.62 43.98
Egypt 6588.16 26.36
Ethiopia 3199.75 44.99
Gabon 5278.91 73.84
Gambia 5311.39 40.48
Ghana 5013.24 39.02
Guatemala 4529.56 17.75
Honduras 4976.47 26.44
Hong Kong 11269 13.31
India 7665.60 13.96
Indonesia 7434.40 13.64
Iran 5445.47 75.67
Jamaica 6725.95 54.03
Jordan 6526.97 18.10
Kenya 4049.28 22.03
Korea, Republic 11953 15.26
Madagascar 3714.40 23.22
Malawi 2591.85 59.00
Malaysia 9418.51 19.08
Mali 2880.60 61.42
Mauritania - 50.64
Mauritius 7116.87 31.72
Mexico 11336.99 13.65
Morocco 6368.45 16.74
Mozambique 5467.46 42.89
Nepal 3777.94 22.42
Nicaragua 4372.27 20.86
Niger 2800.33 36.62
Nigeria 5403.24 87.15

180
Pakistan 5546.32 21.94
Panama 8300.73 20.68
Paraguay 5418.15 36.85
Peru 6766.78 24.15
Philippines 9123.63 36.84
Senegal 5087.71 23.72
Singapore 9445.63 24.74
South Africa 5938.65 11.96
Sri Lanka 5585.27 22.29
Syria 3383.30 46.20
Tanzania 8949.19 21.95
Thailand 3288.53 9.38
Togo 7515.40 27.47
Trinidad and Tobago 7263.69 34.08
Tunisia 2859.26 19.29
Uganda 9873.56 38.46
Uruguay 7707.89 18.08
Venezuela 3961.27 61.01
Zambia 5349.47 56.32
Zimbabwe - 24.71
Note: Data on export sophistication was obtained from Rodrik’s website, while data on export
concentration was obtained from the UNCTAD trade database.
Appendix 4.2: Trend in Export Sophistication for each Developing Country, 1985-2000.
7.5
88.
59
9.5
7.5
88.
59
9.5
7.5
88.
59
9.5
7.5
88.
59
9.5
7.5
88.
59
9.5
7.5
88.
59
9.5
7.5
88.
59
9.5
7.5
88.
59
9.5
1985 1990 1995 2000
1985 1990 1995 2000 1985 1990 1995 2000 1985 1990 1995 2000 1985 1990 1995 2000 1985 1990 1995 2000 1985 1990 1995 2000 1985 1990 1995 2000
Argentina Bangladesh Benin Bolivia Brazil Burkina Faso Burundi Cameroon
Chad Chile China Colombia Congo, Rep. Costa Rica Cote d'Ivoire Dominican Republic
Ecuador Egypt, Arab Rep. Ethiopia Gabon Gambia, The Ghana Guatemala Honduras
Hong Kong SAR, China India Indonesia Iran, Islamic Rep. Jamaica Jordan Kenya Korea, Rep.
Madagascar Malawi Malaysia Mali Mauritius Mexico Morocco Mozambique
Nepal Nicaragua Niger Nigeria Pakistan Panama Paraguay Peru
Philippines Senegal Singapore South Africa Sri Lanka Syrian Arab Republic Tanzania Thailand
Togo Trinidad and Tobago Tunisia Uganda Uruguay Venezuela, RB Zambia
Exp
ort S
ophi
stic
atio
n
YearsGraphs by country

181
Appendix 4.3: Relationship between Export Sophistication and GDP per capita, 1985-2000.
Appendix 4.4: Trend in Export Concentration for each Developing Country, 1995-2010
7.5
88
.59
9.5
7.5
88
.59
9.5
7.5
88
.59
9.5
7.5
88
.59
9.5
4 6 8 10 4 6 8 10 4 6 8 10 4 6 8 10
1985 1986 1987 1988
1989 1990 1991 1992
1993 1994 1995 1996
1997 1998 1999 2000
Export Sophistication Fitted values
GDP per capita
Graphs by Years
0.5
10
.51
0.5
10
.51
0.5
10
.51
0.5
10
.51
1995 2000 2005 2010 1995 2000 2005 2010 1995 2000 2005 2010 1995 2000 2005 2010
1995 2000 2005 2010 1995 2000 2005 2010 1995 2000 2005 2010 1995 2000 2005 2010 1995 2000 2005 2010
Algeria Argentina Bangladesh Benin Bolivia Botswana Brazil Burkina-Faso Burundi
Cameroon Central African Republic Chad Chile China Colombia Congo Costa Rica Cote d'Ivoire
Dominican Rep Ecuador Egypt Ethiopia Gabon Gambia Ghana Guatemala Honduras
Hong Kong India Indonesia Iran Jamaica Jordan Kenya Korea, Rep Madagascar
Malawi Malaysia Mali Mauritania Mauritius Mexico Morocco Mozambique Nepal
Nicaragua Niger Nigeria Pakistan Panama Paraguay Peru Philippines Senegal
Singapore South Africa Sri Lanka Syria Tanzania Thailand Togo Tri and Tob Tunisia
Uganda Uruguay Venezuela Zambia Zimbabwe
Exp
ort
Co
nce
ntra
tion
YearsGraphs by country

182
Appendix 4.5: Relationship between Export Concentration and GDP per capita, 1995-2010.
Appendix 4.6: Appendix 3.2: Scatter Plots showing the relationship between Export
Sophistication/ Concentration over different time periods.
Figure 1
Figure 1A Figure 1B
0.5
10
.51
0.5
10
.51
4 6 8 10 4 6 8 10 4 6 8 10 4 6 8 10
1995 1996 1997 1998
1999 2000 2001 2002
2003 2004 2005 2006
2007 2008 2009 2010
Export Concentration Fitted values
GDP per capita
Graphs by Years
-.3
-.2
-.1
0.1
.2
0 .5 1 1.5Private Credit to GDP
Export Sophistication Fitted values
Full Sample
-1-.
50
.51
0 .2 .4 .6 .8Private Credit to GDP
Export Sophistication Fitted values
Period1: 1985-1988

183
Figure 1C Figure 1D
Figure 1E
In figure 1A, we show a negative relationship between the average growth in export sophistication and the ratio of private credit to GDP. This relation seems to be consistent under different time periods of the sample except in period 2 (1988-1992), where the relationship seems to be weakly positive.
Figure 2
Figure 2A Figure 2B
-1-.
50
.51
0 .5 1 1.5Private Credit to GDP
Export Sophistication Fitted values
Period2: 1988-1992
-10
12
3
0 .5 1 1.5Private Credit to GDP
Export Sophistication Fitted values
Period3: 1993-1996
-.5
0.5
11
.5
0 .5 1 1.5Private Credit to GDP
Export Sophistication Fitted values
Period4: 1997-2000
0.2
.4.6
.8
0 .5 1 1.5Private Credit to GDP
Export Concentration Fitted values
Full Sample
0.2
.4.6
.8
0 .5 1 1.5Private Credit to GDP
Export Concentration Fitted values
Period 1: 1995-1998

184
Figure 2C Figure 2D
Figure 2E
Figure 2A shows a negative relationship between export concentration and the ratio of private credit to GDP, and this relationship is when we split the sample into different time period, suggesting stability of the coefficients.
0.2
.4.6
.81
0 .5 1 1.5Private Credit to GDP
Export Concentration Fitted values
Period 2: 1999-2002
0.2
.4.6
.81
0 .5 1 1.5Private Credit to GDP
Export Concentration Fitted values
Period 3: 2003-2006
0.2
.4.6
.81
0 .5 1 1.5Private Credit to GDP
Export Concentration Fitted values
Period 4: 2007-2010

185
CHAPTER 5: CONCLUSION AND POLICY RECOMMENDATIONS
5.1. SUMMARY OF STUDY FINDINGS.
The structure of the banking system has been identified as one channel thorough the financial
system can affect economic development and industrialization. This study defines bank
market structure as bank sector concentration, foreign ownership of banks, and state
ownership of banks. Bank concentration is argued to affect economic development and
industrialization in two ways: on the one hand, there is the idea that concentration reflects the
banks’ oligopolistic position and, hence, a high degree of concentration would be associated
with tight credit access constraints and high borrowing costs. On the other hand, it has been
argued that it would be easier for firms to access credit if the banking system is concentrated.
For foreign banks, standard mainstream thought envisages that the entry of foreign banks
would promote financial development and spur economic growth. By contrast, it has been
argued that a larger foreign bank presence in developing countries is associated with less
credit to the productive private sector. Also, a large aspect of the literature argues that
government ownership of banks is responsible for lower economic growth and found to
retard financial development; Rodrik (2005) thinks that the negative effect is as a result of
market failures, while others believe that government ownership of banks promote long-run
economic growth. Finally, it has been argued that a developed financial system should help in
improving the production process in countries, thereby improving the value added of
domestically produced goods which are exported, making countries more competitive. The
importance of these theoretical predictions and empirical evidence has been examined in
developing countries, focusing on industries in the manufacturing sector and export
structures.
The theoretical and empirical literature on the issues discussed above remains ambiguous, but
they remain largely skewed towards mainstream thoughts. For example, a competitive
banking system rather than a concentrated is more suited to promoting economic
development and industrialization; less regulatory restrictions on foreign bank entry are seen
to promote financial development and economic growth; state-owned banks are seen to be
responsible for lower economic growth and to retard financial development, and financial
development is seen as an important factor for improving the value of exports. However,

186
some of the evidence we find are not in line with the widely accepted views, particularly for
developing countries. First of all, our results show that bank market concentration is seen to
promote the growth of manufacturing industries, although it does not encourage entry.
Foreign bank entry is neither seen to promote the growth of nor entry into these industries.
Finally, government ownership of banks negatively affects industry growth but it promotes
entry.
Our view of these results is as follows: banks with market power are likely to lend more to
large firms than small and medium firms, so firms that benefit from such lending would grow
in size, but such lending might not encourage overall entry; Foreign banks on the other hand,
would rather lend to their multinational clients, large domestic firms and the government,
resulting in a negative effect on overall industry growth and entry; government banks are
more active during market failures, so, their positive effect on industry growth may be is
ambiguous; however, they promote overall entry.
We also examine the role of institutional quality as well as the regulatory and supervisory
environment on the effect of bank market structure on industry growth. The results suggest
that while good institutions may benefit industrialization through the effect of bank market
structures, the importance of good institutions for industrialization may not be robust. For
example, not all the institutional variables proved to have a significant influence on the effect
of bank market structure on industrialization in the cross-sectional estimation. Also, while
some of the interaction terms in the panel data estimation suggest the positive effect of good
institutions on the effect of bank market structure on industrialization, the effect of the
institutional variable by itself on industrialization was negative. In some cases, the interaction
terms were insignificant. These inconsistencies suggest inconsistencies in the ‘good
institution’ approach to growth.
On the impact of bank market structure on industries that depend more on external finance,
we find no evidence that bank concentration, foreign bank entry and state owned banks affect
the growth of industries or the entry into industries that depend more on external finance. In
line with Von Furstenberg and Von Kalckreuth (2006) and Kabango and Paloni (2009), we
are of the opinion that the measure does not reflect the true level of external financial

187
dependence by manufacturing industries and that a measure based on listed firms in the
United States is not easily applicable in other countries, particularly developing countries.
Also, we find some evidence that other industry-specific characteristics that are expected to
benefit from financial development are affected by bank market structure. For example, in the
literature, there is strong empirical evidence that small firms would benefit from financial
development through a concentrated banking system and foreign bank entry. However, based
on the measures of firm size we use, we find that foreign bank entry promotes the growth of
industries composed of small firms (although this measure is only a theoretical measure) and
that foreign banks negatively affect entry of large firms into manufacturing industries. We
don’t find overwhelming evidence that bank concentration and foreign bank entry promote
the performance of small firms.
Another example is when we use high-technological intensity as an industry characteristic.
Our results suggest that none of the bank market structures we have employed significantly
affects industrialization in developing countries. When we consider Da Rin and Hellmann
(2002), we would expect an increase in the level of banks concentration to have some sort of
positive effect on industrialization, or Berger and Udell, (2006), who argue that foreign banks
with better lending technologies are better suited to lend to high-tech firms in manufacturing
industries. However, we find no evidence of this. For both examples, it may well be that the
generalizations about who benefits from financial development might not hold, or to put it
differently, the effect of financial development may to a large extent be country-specific,
rather than industry-or sector specific. It may well be that financial development benefits
sectors in which the country has comparative advantage.
With regards to the results based on high-technology intensity, our understanding is that it
may provide some evidence that the measure of external financial dependence by Rajan and
Zingales is fundamentally flawed (while they assume that these firms are the dynamic and
innovative ones). These particular results require more examination and led us to directly
explore the importance of financial development for technological advancement or
innovation through export sophistication and diversification. Technological innovation is
highly risky, and in banking markets where foreign banks are present, it is unlikely that banks
would be willing to fund firms using new technology, particularly in developing countries.

188
The literature largely suggests that financial development is positively linked to international
trade. Specifically, Beck (2002) finds that countries with a higher quality of financial
development have higher shares of manufactured exports in GDP and in total merchandise
exports and have a higher trade balance in manufactured goods. While Beck’s conclusions
are not related to the export structure, he specifically talks about the quality of exports
(manufactured exports). It can generally be assumed that financial development improves the
quality of exports and makes them more diversified. Results in this study, however, conflict
these assumptions. Specifically, financial development is seen to negatively impact the
sophistication of and increase the concentration of exports in developing countries. In other
words, developing countries continue to export low value-added products that are not
diversified. As this particular research objective is based on results which suggest that banks
with market power, foreign banks and government banks are unlikely to fund industries
composed of firms that are high-technologically intensive, it could mean that in a liberalized
environment, banks will prefer to fund firms using known technology rather than innovative
ones because of the costs and risks associated technological advancement.
5.2. CONTRIBUTION TO THE LITERATURE
The study makes the following contributions to the literature:
1. First, it contributes to the literature by suggesting that it is not possible to discover
robust or consistent findings concerning the effects of good institutions in developing
countries;
2. Second, its cast doubts over the Rajan and Zingales measure of ‘External Finance
Dependence’ and questions the consistent use of it in the literature. Also, it
systematically finds that’s financial development, through bank market structure may
equally be important for industries with other characteristics (i.e. apart from
depending more on external finance);
3. Third, it questions the willingness of banks to fund innovative firms in developing
countries because of the costs and risks involved in technological advancement and
suggest that it might result in detrimental effects i.e. reducing the degree of export
sophistication and increasing the level of export concentration.

189
Other secondary contributions include:
1. It contributes to the literature on industrial organization by examining how bank
market structure affects industrial performance while considering industry-specific
characteristics in relation to developing countries.
2. It applies an empirical technique that relates bank market structure, industry
performance and institutions in developing countries. The Pooled Mean Group
estimator has previously been used to link financial liberalization with growth,
however, we don't know of any studies that have used it to link bank market
structure, industry performance and institutions;
3. All financial characteristics are treated within the same framework, resulting in less
problems of omitted variables bias. Normally, financial characteristics are treated in
isolation with little or no analysis of them within the same framework; and
4. Data on government ownership of bank is longitudinal. Not many studies on
government ownership of banks use longitudinal data because it is not available.
Also, even less studies use it for cross-country studies. Like a few others, we have
used Bankscope to obtain most of the data. The utilization of this data provides an in-
depth analysis.
5.3. POLICY RECOMMENDATIONS
A number of policy issues have been identified in this study, and they may not only be
relevant to only the developing countries in our sample, but all developing countries, where
policies that promote competition, internationalization of banking, and privatization of state-
owned banks are been implemented.
We therefore, discuss the following policy issues:
1. In the first instance, from a policy perspective, the study finds that good institutions
might not be enough for developing countries to achieving and sustain the required
level of growth, particularly when they are persuaded to integrate with the
international economy. For example, Carlin (2010) uses East Germany to argue that
the success of a capitalist economy is not primarily determined by high quality
institutions, rather, it also requires to the ability of an economy to identify its area of
comparative advantage in the international labour market. Also, Khan (2008) argues
that while the difference in growth rate between converging and diverging developing

190
countries is significant, their market-enhancing governance are not significantly
different. In other words, there are other dimensions of governance capabilities that
explain the difference in growth rate between these two groups of countries.
According to Khan, for developing countries to enjoy sustained growth and
productivity, they have to improve specific governance capabilities. First of all, the
capacity to improve weak property rights is required; second, the capacity to
technologically catch-up with developed countries; and the capacity to overcome
structural political corruption. In other words, while good institutions are good for
development, developing countries require governance capabilities to overcome some
of the impediments to developing good quality institutions.
2. Also, the study finds that financial institutions in developing countries are unlikely
fund industries that produce high technology and high-value added products because
of the risks and cost involved or they may be more motivated to fund short-term
projects with front-loaded returns or more profitable and less risky projects. A
generalized policy like financial development may primarily benefit activities where
the country is competitive or has comparative advantage (i.e. low technology and low-
value added products). The ability of financial institutions to finance activities in a
discriminatory manner may require some form of government intervention to ensure
innovative firms succeed. In other words, the growth-enhancing effects of government
might not be enough; it requires the welfare-improving effect of government
intervention. Without selective policies, it is improbable that technological upgrading
and deepening will occur in developing countries where market failures are presents
and the financial system is liberalized. According to Stiglitz et al. (1993), government
interventions in financial markets are motivated by market failures. The use the case
of the fast growing Asian economies to stress the role of government in creating
financial institutions, regulating them, and using selective policies to direct credit in
ways that ensure economic stability, healthy financial institutions and growth
prospects. So, for developing countries to benefit from financial development in the
area of technological advancements and export structure, government intervention
may be required. While government failures and rent-seeking behavior have been
rightly used to criticize government intervention (outside regulation and supervision),
without the kind of intrusive government interventions we suggest, technological
development will be impeded in developing countries.

191
5.4. FURTHER RESEARCH AND CONCLUSION
In general, the finance-growth literature suggest that the structure of the banking system,
through bank sector concentration, foreign bank ownership and state ownership of banks, and
financial development, through bank development, affect industry performance in developing
countries. This in turn may be determined by industry specific factors. However, ongoing
research in this literature is required as some areas remain unexploited. For example, the
relationship between how institutions and institutional change effect economic development
is too simplistic. It requires further research to examine all possible links and channels
through with institutions affect economic development. Also, the availability of more robust
industry-specific characteristics would be beneficial to the literature. For example, if actual
data on external finance dependence on industries that has time variation and is country-
specific becomes available, it might be possible to determine the characteristics of these
industries. It would also be interesting to examine the impact of stock market development on
industrial performance in developing countries using industry data and industry-specific
characteristics. The stock markets in many developing countries are not very active, and are
sometimes seen to negatively affect growth in developing countries. In other words, these
will not only give new insights on the relationship between bank market structure and
industrial performance, it may also be a relevant tool for developing policies that promote
industrial performance in developing countries. A robust theoretical model that predicts the
determinants of export diversification is also required in the literature to improve the outcome
of empirical studies and to improve general knowledge on the concept. Finally, more research
is required on the impact of state owned banks on economic development. Particularly, the
effect of state owned banks on technological advancement, export sophistication and
diversification in developing countries. It would be better if data on state owned banks were
longitudinal.

192
BIBLIOGRAPHY:
Acemoglu, D., Johnson, S. and Robinson, J. A., (2001), The Colonial Origins of
Comparative Development: An Empirical Investigation, American Economic Review,
91(5):1369-1401.
Acemoglu, D., Johnson, S. and Robinson, J. A., (2002a), Reversal of Fortune:
Geography and Institutions in the Making of the Modern World Income Distribution,
Quarterly Journal of Economics, 117(4): 1231-1294.
Acemoglu, D., Johnson, S. and Robinson, J. A., (2002b), The Rise of Europe: Atlantic
Trade, Institutional Change and Economic Growth, NBER Working Paper No. 9378,
Cambridge, Massachusetts: NBER.
Aghion, P., Bacchetta, P, and Banerjee, A., (2004), Financial Development and
Instability in Open Economies, Journal of Monetary Economics, 51(6): 1077-1106.
Aliber, R. Z., (1984), International Banking: A Survey, Journal of Money, Credit and
Banking, 16(1): 661-712.
Allen, F. and D. Gale, (2000), Comparing Financial Systems, Cambridge, MA: MIT
Press.
Altunbas, Y., Evans, L. and Molyneux, P., (2001), Bank Ownership and Efficiency,
Journal of Money, Credit and Banking, 33(4): 926-954.
Amiti, M. and Caroline L. Freund (2008), The Anatomy of China's Export Growth,
World Bank Policy Research Working Paper Series, No.462, Washington DC: World
Bank.
Anand, R., Mishra, S., and Spatafora, N., (2012), Structural Transformation and the
Sophistication of Production, IMF Working Paper 12/59, International Monetary Fund,
Research Department.
Andrianova, S., Demetriades, P. and Shortland, A., (2008), Government Ownership of
Banks, Institutions and Financial Development, Journal of Development Economics,
85(1-2): 218-252.
Andrianova, S., Demetriades, P. and Shortland, A., (2012), Government Ownership of
Banks, Institutions and Economic Growth, Economica, 27(315): 449-469. Angeles, L., (2011), Institutions, Property Rights, and Economic Development in
Historical Perspective, Kyklos, 64(2): 157-177.
Arellano, M. and Bond, S., (1991), Some Tests of Specification for Panel Data: Monte
Carlo Evidence and an Application to Employment Equations, Review of Economics
Studies, 58(2): 277-297.
Arellano, M. and Bover, O., (1995), Another look at the Instrumental Variable
Estimation of Error-Components Models, Journal of Econometrics, 68(1): 29-51.
Arestis, P., Demetraides, P. and Luintel, K., (2001), Financial Development and
Economic Growth: The Role of Stock Markets, Journal of Money, Credit and
Banking, 33(1): 16-41. Aron, J., (2000), Growth and Institutions: A Review of Evidence, The World Bank
Research Observer, 15(1): 99-135.
Ascari, G. and Di Cosmo, V., (2004), Determination of Total Factor Productivity in
Italian Regions, Working Paper No.170(12-04), Dipartimento di Economia Politica e
Metodi Quantitative, Universita Degli Studi di Pavia.
Atje, R. and Jovanovic, B., (1993), Stock Markets and Development, European
Economic Review, 37(2-3): 632-640.
Auty, R. M., (1998), Resource Abundance and Economic Development, Helsinki:
UNU-WIDER.

193
Baltagi, B. H., (2001), Econometric Analysis of Panel Data, 2nd
Edition, New York:
John Wiley and Sons.
Baltagi, B. H., Demetriades, P. and Law, S. H., (2009), Financial Development and
Openness: Panel Data Evidence, Journal of Development Economics, 89(2): 285-296.
Bardhan, P., (2005), Institutions Matter, but Which Ones? Economics of Transition,
13(3): 499-532.
Barro, R. J., (1997), Determinants of Economic Growth: A Cross-Country Empirical
Study. Cambridge: MIT Press.
Barro, R., and Lee, J. W., (2010), A New Dataset of Educational Attainment in the
World: 1950 -2010, NBER Working Paper No. 15902, Cambridge, Massachusetts:
NBER.
Barth, J., Caprio, G., and Levine, R., Banking Systems around the Globe: Do
Regulations and Ownership Affect Performance and Stability? In Prudential
Regulation and Supervision: Why it is Important and What are the Issues, edited F.
Mishkin: 31-96. Cambridge, MA: National Bureau of Economic Research, 2001.
Barth, J., Caprio, G. and Levine, R., (2001), Regulation and Supervision of Banks
around the World: A New Database, World Bank Policy Research Working Paper No.
2588, Washington D.C: World Bank.
Barth, J., Caprio, G. and Levine, R., (2004), Bank Regulation and Supervision: What
Works Best? Journal of Financial Intermediation, 13(2): 205-248.
Barth, J., Caprio, G. and Levine, R., (2006), Rethinking Bank Regulation: Till Angels
Govern, New York: Cambridge University Press.
Barth, J., Caprio, G. and Levine, R., (2012), The Evolution and Impact of Bank
Regulations, Policy Research Working Paper No.6288, Washington, D.C: World
Bank.
Bas, M., and Berthou, A., (2012), The unequal effect of financial development on
firms’ growth in India, CEPII Working Papers No. 2012-22, Paris: CEPII.
Bassanini, A. and Scarpetta, S., (2002), Growth, Technological Change, And ICT
Diffusion: Recent Evidence from OECD Countries, Oxford Review of Economic
Policy, 18(3): 342-344.
Beck, T., Demirguç-Kunt, A. and Levine, R., (2000), A New Database on Financial
Development and Structure, World Bank Economic Review, 14(3): 597-605.
Beck, T. and Levine, R., (2002), Industry Growth and Capital Allocation: Does having
a Market-Based of Bank-Based System Matter? Journal of Financial Economics,
64(2): 147-180.
Beck, T., (2002), Financial Development and International Trade: Is there a Link?
Journal of International Economics, 57(1): 107-131.
Beck, T., (2008), The Econometrics of Finance and Growth, Policy Research Working
Paper Series No. 4608, Washington D.C: World Bank.
Beck, T., and Levine, R., (2004), Stock Markets, Banks, and Growth: Panel
Evidence, Journal of Banking & Finance, 28(3): 423-442.
Beck, T., and Levine, R., Legal Institutions and Financial Development. In Handbook
of New Institutional Economics, edited by C. Menard and M. M. Shirley: 251-278,
Netherlands: Springer, 2005.
Beck, T., Demirguc-Kunt, A. and Levine, R., (2006a), Bank Concentration,
Competition, and Crisis: First Results, Journal of Banking and Finance, 30(5): 137-
181.
Beck, T., Demirguc-Kunt, A. and Maksimovic, V., (2008), Financing Patterns around
the World: Are Small Firms Different? Journal of Financial Economics, 89(3): 467-
487.

194
Beck, T., Demirguc-Kunt, A., and Levine, R., (2003), Law and Finance: Why does
Legal Origin Matter? Journal of Comparative Economics, 31(2): 653-675.
Beck, T., Demirguc-Kunt, A. and Levine, R., (2006b), Bank Supervision and
Corruption in Lending, Journal of Monetary Economics, 53(8): 2131-2163.
Beck, T., Demirguç-Kunt, A. and Levine, R., (2007), Finance, Inequality, and the
Poor, Journal of Economic Growth, 12 (1): 27-49.
Beck, T., Demirguc-Kunt, A., and Levine, R., (2009), Financial Institutions and
Markets across Countries and Over Time, World Bank Policy Research Working
Paper No. 4943. Washington D.C: World Bank.
Beck, T., Demirguc-Kunt, A. and Maksimovic, V., (2003), Financial and Legal
Institutions and Firm Size, World Bank, Policy Research Working Paper No. 2997,
Washington D.C: World Bank.
Beck, T., Demirguc-Kunt, A. and Maksimovic, V., (2004), Bank Competition and
Access to Finance: International Evidence, Journal of Money, Credit and Banking,
36(6): 627-648.
Beck, T., Demirguc-Kunt, A. and Martinez Peria, S. M., (2008), Bank Financing for
SMEs around the World: Drivers, Obstacles, Business Models and Lending Practices,
World Bank Policy Research Working Paper No. 4785, Washington D.C: World Bank.
Beck, T., Demirguc-Kunt, A. and Singer, D., (2011), Is Small Beautiful? Financial
Structure, Size and Access to Finance, Policy Research Working Paper 5806,
Washington D.C: World Bank.
Beck, T., Demirgüç-Kunt, A., Laeven, L. and Levine, R., (2008), Finance, Firm Size,
and Growth, Journal of Money, Credit, and Banking, 40 (7): 1379–1405.
Beck, T., Demirguc-Kunt, A., Levine, R., and Maksimovic, V., (2000), Financial
Structure and Economic Development: Firm, Industry and Country Evidence, World
Bank Policy Research Working Paper No. 2423, Washington D.C: World Bank.
Beck, T., (2002), Financial Development and International Trade: Is There a Link?
Journal of International Economics, 57(1): 107-131.
Beck, T., (2003), Financial Dependence and International Trade, Review of
International Economics, 11(2): 296-316.
Becker, B. and Greenberg, D., (2007), Financial Development, Fixed Costs and
International Trade, Harvard Business School, mimeo.
Becker, B. and Greenberg, D., (2003), The Real Effects of Finance: Evidence from
Exports, University of Chicago, mimeo.
Becker, B., Chen, J., and Greenberg, D., (2013), Financial Development, Fixed Costs,
and International Trade, Review of Corporate Finance Studies, 2(1): 1-28.
Bellone, F., Musso, P., Nesta, L. and Schiavo, S. (2010). Financial Constraints and
Firm Export Behaviour, The World Economy, 33(3): 347-373
Beltratti, A. and Stulz, R. M., (2012), The Credit Crisis around the Globe: Why did
Some Banks Perform Better? Journal of Financial Economics, 105(1): 1-17.
Bencivenga, V. R., and Smith, B. D., (1991), Financial Intermediation and
Endogenous Growth, The Review of Economic Studies, 58(2): 195-209.
Bergantino, A. S. and Capozza, C., (2012), The Effect of Bank Concentration on
Entrepreneurship in Central and Eastern European Transition Countries, University of
Bari SERIES Working Paper No. 43, University of Bari.
Berger, A. N. and Udell, G. F., (2006), A More Complete Conceptual Framework for
SME Finance, Journal of Banking and Finance, 30(11): 2945-2966.
Berger, A. N., Klapper, L. F. and Udell, G. F., (2001), The Ability of Banks to Land to
Informationally Opaque Small Businesses, Journal of Banking and Finance, 25(12):
2127-2167.

195
Berger, A., De Young, R., Flannery, M., Lee, D. and Oztekin, O, (2008), How do
Large Banking Organizations Manage their Capital Ratios? Journal of Financial
Services Research, 34(2-3): 123-149.
Berger, A. N., Clarke, G. R. G., Cull, R., Klapper, L. and Udell G. F., (2004),
Corporate Governance and Bank Performance: A Joint Analysis of the Static,
Selection, and Dynamic Effects of Domestic, Foreign, and State Ownership, World
Bank Policy Research Working Paper No. 3632. Washington D.C: World Bank.
Bernanke, B. S., and Gurkaynak, R. S., (2001). In NBER Macroeconomics Annual
2001, Volume 16, Cambridge, MA: NBER.
Bertay, A. C., Demirgüç-Kunt, A. and Huizinga, H., (2012), Bank Ownership and
Credit over the Business Cycle: Is Lending by State Banks less Procyclical? CEPR
Discussion Paper No. 9034, Washington D.C: CEPR.
Berthou, A. (2010). The Distorted Effect of Financial Development on International
Trade Flows, CEPII Working Papers No. 2010 – 09, Paris: CEPII.
Bhaumik, S. K., and Dimova, R., (2013), Good and Bad Institutions: Is the Debate
Over? Cross-Country Firm-Level Evidence from the Textile Industry, Cambridge
Journal of Economics, (2013): 1-18.
Bhide, A., (1993), The Hidden Costs of Stock Market Liquidity, Journal of Financial
Economics, 34(1): 1-51.
Black, S. E. and Strahan, P. E., (2002), Entrepreneurship and Bank Credit Availability,
Journal of Finance, 57(6): 2807-2833.
Bonaccorsi di Patti, E. and Dell’Ariccia, G., (2004), Bank Competition and Firm
Creation, Journal of Money Credit and Banking, 36(2): 225-251.
Boot, A. and Thakor, A., (2000), Can Relationship Banking Survive Competition?
Journal of Finance, 55(2): 679-713. Bose, N., Panni, M. A., and Wurm, M. A., (2012), The Growth Effects of Property
Rights: The Role of Finance, World Development, 40(9): 1784-1797.
Boyd, J. H. and Prescott, E.C., (1986), Financial Intermediary-Coalitions, Journal of
Economic Theory, 38(2): 211-232.
Boyd, J. H. and Smith, B. D., (1998), The Evolution of Debt and Equity Market in
Economic Development, Economic Theory, 12(3): 519-560. Breitung, J., (2000), The Local Power of some Tests for Panel Data. In Baltagi (ed)
Nonstationary Panels, Panel Cointegration, and Dynamic Panels, Advances in
Econometrics, vol. 15, 161-178. JAI.
Brownbridge, M. and Harvey, C., (1998), Banking in Africa: The Impact of Financial
Sector Reform since Independence, Trenton, NJ: Africa World Press.
Bruno, V. and Hauswald, R., (2013), The Real Effect of Foreign Banks, Review of
Finance, (2013): 1-34.
Byrne, J. P, and Davis, E, P., (2005), The Impact of Short-and Long-Run Exchange
Rate Uncertainty on Investment: A Panel Study of Industrial Countries, Oxford
Bulletin of Economics and Statistics, 67(3): 307-329.
Cadot, O., Carrere, C. and Strauss-Khan, V., (2010), Trade Diversification: Drivers
and Impacts. In Trade and Employment: From Myths to Facts, edited by Jasen, M.,
Peters, R., and Salaza-Xirinaachs, J. M: Chapter 7. Geneva: International Labour
Organization and the European Union.
Cadot, O., Carrere, C. and Strauss-Kahn, V., (2007), Export Diversification: What is
behind the Hump? CEPR Discussion Paper No. 6590, Washington, D.C: CEPR.
Capasso, S., (2004), Financial Markets, Development and Economic Growth: Tales of
Informational Asymmetries, Journal of Economic Surveys, 18(3): 267-292.

196
Caprio, G., Laeven, L. and Levine, R., (2007), Governance and Bank Valuations,
Journal of Financial Intermediation, 16(4): 584-617. Carlson, F., and Lundstrom, S., (2002), Economic Freedom and Growth: Decomposing
the Effects, Public Choice, 112(3-4): 335-344.
Carlton, D. and Pearloff, J., (1994), Modern Industrial Organization, 2nd Edition,
London: Harper Collins College Publishers. Carpenter, R., and Petersen, B. C., (2002), Capital Market Imperfections, High Tech
Investments and New Equity Financing, Economic Journal, 112(477): F54-72.
Carree, M. and Thurik, R., (1999), The Carrying Capacity and Entry and Exit Flows in
Retailing, International Journal of Industrial Organization, 17(7): 985-1007. Carter, M. R., and Olinto, P., (2003), Getting Institutions “Right” for Whom? Credit
Constraints and the Impact of Property Rights on the Quantity and Composition of
Investment, American Journal of Agricultural Economics, 85(1): 173-186.
Caselli, F., Esquivel, G., and Lefort, F., (1996), Reopening the Convergence Debate: A
New Look at Cross-Country Growth Empirics, Journal of Economic Growth, 1(3):
363-389.
Catao, L. A. V. and Solomou, N, S., (2005), Effective Exchange Rate and the Classical
Gold Standard Adjustment, American Economic Review, 95(4): 1259-1275.
Catao, L. A V., and Terrones, M. E., (2005), Fiscal Deficits and Inflation, Journal of
Monetary Economics, 52(3), 529-554.
Cetorelli, N. and Gambera, M., (2001), Banking Market Structure, Financial
Dependence, and Growth: International Evidence from Industry Data, Journal of
Finance, 56(2): 617-648.
Cetorelli, N. and Strahan, P. E., (2006), Finance as a Barrier to Entry: Bank
Competition and Industry Structure in Local U.S. Markets, Journal of Finance, 6(1):
437-461.
Cetorelli, N., (1997), The role of credit market competition on lending strategies and
on capital accumulation, Working Paper Series No. WP-97-14, Federal Reserve Bank
of Chicago.
Cetorelli, N., (2001), Does Bank Concentration Lead to Concentration in Industrial
Sectors? Working Paper Series No. WP-01-01, Federal Reserve Bank of Chicago.
Cetorelli, N., (2002), Life-Cycle Dynamics in Industrial Sectors: The Role of Banking
Market Structure, Working Paper Series No. WP-02-26, Federal Reserve Bank of
Chicago.
Cetorelli, N., (2004), Real Effect of Bank Competition, Journal of Money, Credit and
Banking, 36(3): 543-558.
Cetorelli, N. and Paretto, F. P., (2000), Oligopoly Banking and Capital Accumulation,
Working Paper Series No. WP-00-12, Federal Reserve Bank of Chicago.
Chaney, T., (2005), Liquidity Constrained Exporters, Massachusetts Institute of
Technology, mimeo.
Claessens, S. and Van Horen, N., (2012), Foreign Banks: Trends, Impact, and
Financial Stability, IMF Working Paper No. WP/12/10, Washington D.C: IMF.
Claessens, S, (2006), Comments on ‘Foreign Banks in Poor Countries: Theory and
Evidence’, Washington D.C: World Bank.
Claessens, S. and Laeven, L., (2005), Financial Dependence, Banking Sector
Competition, and Economic Growth, Journal of the European Economic Association,
3(1): 179-207.
Claessens, S. and Laeven, L., (2003), Financial Development, Property Rights and
Growth, Journal of Finance, 58(2): 2401-2436.

197
Claessens, S., Demirguc-Kunt, A. and Huizinga, H., (2001), How does Foreign Entry
Affect Domestic Banking Markets? Journal of Banking and Finance, 25(5): 891-911.
Claessens, S., Djankovic, S. and Lang, L., (2000), The Separation of Ownership and
Control in the East Asian Corporations, Journal of Financial Economics, 58(1-2): 81-
112.
Claessens, S., Van Horen, N., Gurcanlar, T. and Mercado, J., (2008), Foreign Bank
Presence in Developing Countries, 1995-2006: Data and Trends. [Online] Available at
SSRN: http://ssrn.com/abstract=1107295.
Clarke, G. R. G., Cull, R., Martinez Peria, M. S. and Sanchez, S., (2005), Bank lending
to Small businesses in Latin America: Does bank origin matter? Journal of Money,
Credit and Banking, 37(1): 83-118.
Clarke, G. R. G., Cull, R. and Martinez Peria, M. S., (2006), Foreign Bank
Participation and Access to Credit Across Firms in Developing Countries, Journal of
Comparative Economics, 36(4): 774-795.
Clarke, G. R. G., Cull, R., and Shirley, M., (2003), Empirical Studies of Bank
Privatization: An Overview, Paper prepared for the Conference on Bank Privatization
in Low- and Middle-Income Countries. Washington D.C: World Bank, 23 November.
Clarke, G. R. G., Cull, R. and Shirley, M., (2005), Bank Privatization in Developing
Countries: A Survey of Lessons and Findings, Journal of Banking and Finance, 29(8-
9): 1905-1930.
Clarke, R. (1985), Industrial Economics, New York; Oxford: Blackwell.
Coase, R., (1937), The Nature of the Firm, Economica, 4(16): 386–405.
Collender, R. N. and Shaffer, S., (2003), Local Bank Office Ownership, Deposit
Control, Market Structure, and Economic Growth, Journal of Banking and Finance,
27(1): 27-57.
Collier, P. and Hoeffler, A., (2004), Greed and Grievance in Civil War, Oxford
Economic Papers, 56(4): 563-595.
Cornett, M. M., Guo, L., Khaskari, S. and Tehranian, H., (2009), The Impact of State
Ownership on Performance in Privately-Owned versus State-Owned Banks: An
International Comparison, Journal Of Financial Intermediation, 19(1): 74-94.
Cull, R. and Martinez Peria, M. S., (2010), Foreign Bank Participation in Developing
Countries: What do We Know about the Drivers and Consequences of this
Phenomenon? World Bank Policy Research Working Paper No. 5398, Washington
D.C: World Bank.
Da Rin, M. and Hellman, T., (2002), Banks as Catalysts for Industrialization, Journal
of Financial Intermediation, 11(4): 366-397.
Davis, S. J. and Henrekson, M., (1997), Explaining National Differences in the Size
and Industry Distribution Employment, Small Business Economics, 12(1): 59-83. De Haas, R., and Van Lelyveld, I., (2006), Foreign Banks and Credit Stability in
Central and Eastern Europe: Friends or Foes? Journal of Banking and Finance, 30(7):
1927-1952.
Demir, F. and Dahi, O.S., (2011), Asymmetric Effects of Financial Development on
South–South and South–North Trade: Panel Data Evidence from Emerging Markets,
Journal of Development Economics, 94(1): 139–149.
Demirguc-Kunt, A. and Detragiache, E., (1998), The Determinants of Banking Crises
in Developing and Developed Countries, IMF Staff Papers, 45(1): 81-109.
Demirguc-Kunt, A. and Detragiache, E., (2000), Does Deposit Insurance Increase
Banking System Stability? IMF Working Paper No. 00/3, Washington DC: IMF.

198
Demirguc-Kunt, A. and Levine, R., (2001), Financial Structures and Economic
Growth: A Cross-Country Comparison of Banks, Market, and Development.
Cambridge: MIT Press.
Demirgüç-Kunt, A. and V. Maksimovic., (2002), Funding Growth in Bank-Based and
Market- Based Financial Systems: Evidence from Firm Level Data”, Journal of
Financial Economics, 65(3): 337-363.
Demirguc-Kunt, A. and Maksimovic, V., (1998), Law, Finance and Firm Growth,
Journal of Finance, 53(6): 2107- 2137.
Demirguc-Kunt, A., Cihak, M., Feyen, E., Beck, T. and Levine, R., (2010), Financial
Development and Structure Dataset, World Bank.
Demirguc-Kunt, A., Cihak, M., Feyen, E., Beck, T. and Levine, R., (2013), Financial
Development and Structure Dataset, World Bank.
Demirguc-Kunt, A., Leaven, L. and Levine, R., (2004), Regulation, Market Structure,
Institutions, and the Cost of Financial Intermediation, Journal of Money Credit and
Banking, 36(3): 593-622.
Detragaiche, E., Tressel, T. and Gupta, P., (2008), Foreign Banks in Poor Countries:
Theory and Evidence, Journal of Finance, 63(5): 2123-2160.
Do, Q. and Levchenko, A., (2007), Comparative Advantage, Demand for External
Finance, and Financial Development, Journal of Financial Economics, 86(3): 796-834.
Dopico, L.G. and Wilcox, J.A., (2002), Openness, Profit Opportunities and Foreign
Banking, Journal of Financial Markets, Institutions, and Money, 12(4–5): 299–320.
Dos Santos, P., (2013), A Cause for Policy Concern: the Expansion of Household
Credit in Middle-Income Economies, International Review of Applied Economics,
27(3): 316-338.
Eicher, T. S. and Leukert, A., (2009), Institutions and Economic Performance:
Endogeneity and Parameter Heterogeneity, Journal of Money, Credit and Banking, 41
(1): 197-219.
Ergungor, E., (2004), Comment on ‘Bank Competition and Access to Finance’ by
Thorsten Beck, Asli Demirguc-Kunt and Vojislav Maksimovic, Journal of Money,
Credit and Banking, 36(3): 649-654.
Fan, G., ChiHung, K. and Zhizhong, Y., (2006), Analyzing the Foreign Trade
Structure Based on Technologies of Traded Goods, Economic Research, 8: 70-80.
Fernandez, A., Gonzalez, F., and Suarez, N., (2010), How Institutions and Regulations
Shape and Influence Bank Concentration and Economic Growth: International
Evidence, International Review of Law and Economics, 30(1): 28-36.
FOA (2006), Rapid Growth of Selected Asian Economies: Lessons and Implications
for Agriculture and Food Security in China and India, Bangkok: UN Focarelli, D., and Panetta, F., (2003), Are Mergers Beneficial to Consumers? Evidence
from the Market for Bank Deposits, American Economics Review, 93(4): 1152-1172.
Focarelli, D. and Pozzolo, A. F., (2005), Where do Banks Expand Abroad? An
Empirical Analysis, Journal of Business, 78(6): 2435-2463.
Frankel, J. A. and Romer, D., (1999), Does Trade Cause Growth? American Economic
Review, 89(3): 37 –399.
Frank, M. W., (2009), Inequality and Growth in the United States: Evidence from a
New State-Level Panel of Income Inequality Measures, Economic Inquiry, 47(1): 55-
68.
Fry, M. J., (1973), Manipulating Demand for Money. In Essays in Modern Economics,
edited by Micheal Parkin: 371-385, London: Longman.
Fry, M. J., (1995), Money, Interest, and Banking in Economic Development, 2nd
Ed,
John Hopkins University Press: London.

199
Funke, M., and R.Ruhwedel (2001), Product Variety and Economic Growth: Empirical
Evidence for the OECD Countries, IMF Staff Papers, 48(2): 225-242.
Galindo, A., and Micco, A., (2004), Do state owned banks promote growth? Cross-
country Growth, Economic Letters, 84(1): 371-376.
Garber, P. M., (1997), Transition to a Functional Financial Safety Net in Latin
America, Research Department Publication 4056, Inter-American Development Bank,
Research Department.
Geroski, P., (1995), What do we know about Entry, International Journal of Industrial
Organization, 13(4): 421-440.
Gerschenkron, A. (1962), Economic Backwardness in Historical Perspective. A Book
of Essays, Cambridge, Massachusetts: Harvard University Press.
Giannetti, M and Ongena, S., (2009), Financial Integration and Firm Performance:
Evidence from Foreign Bank Entry in Emerging Markets, Review of Finance, 13(2):
181-223.
Goldberg, L.G. and Saunders, A., (1981), The Determinants of Foreign Banking
Activity in the US, Journal of banking and Finance, 5 (1): 17-32.
Goldsmith, R., (1969) Financial Structure and Development, New Haven: Yale
University Press.
Gort, M. and Komakayama, A., (1982), A Model of Diffusion in the Production of an
Innovation, American Economic Review, 72(5): 1111-1120.
Gourinchas, P., Valdes, R. O. and Landerretche, O., (2001), Lending Booms: Latin
America and the World, Economia, 1(2): 47-99.
Greenaway, D., Guariglia, A. and Kneller, R., (2007), Financial Factors and Exporting
Decisions, Journal of International Economics, 73(2): 377-395
Greenwood, J. and Jovanovic, B., (1990), Financial Development, Growth and the
Distribution of Income, Journal of Political Economy, 98(5): 1076-1107.
Greif, A., (2006), Institutions and the Path to the Modern Economy: Lessons from
Medieval Trade, Cambridge: Cambridge University Press.
Guzman, M., (2000), Bank Structure, Capital Accumulation, and Growth: A Simple
Macroeconomic Model, Economic Theory, 16(2): 421-255.
Haber, S. and Musacchio, A., (2005), Contract Rights and Risk Aversion: Foreign
Banks and the Mexican Economy, 1997-2004, Harvard Business School Working
Paper, No. 05-025, Harvard University.
Haggard, S. M., and Tiede, L. B., (2011), The Rule of Law and Economic Growth:
Where are We? World Development, 39(5): 673-685.
Hall, R. and Jones, C. I., (1999), Why do some Countries produce so much more
Output per Worker than others? Quarterly Journal of Economics, 114 (1): 82-116.
Harding, T. and Javorcik, S, B., (2009), A Touch of Sophistication: FDI and Unit
Value of Exports, CESifo Working Paper, No. 2865. Munich: CESifo.
Harris, R.D.F., (1997), Stock markets and Development: A Reassessment, European
Economic Review, 41(1): 139-146.
Hatzichronoglou, T., (1997), Revision of the High Technology Sector and Product
Classification, OECD Science, Technology and Industry Working Papers, 1997/02,
OECD Publishing.
Hausmann, R. and Rodrik, D., (2003), Economic Development as Self-Recovery,
Journal of Development Economics, 72(2): 603-633.
Hausmann, R., Hwang, J. and Rodrik, D., (2007), What You Export Matters, Journal
of Economic Growth, 12(1): 1-25.

200
Hellwig, M., (1991), Banking, Financial Intermediation and Corporate Finance. In
Giovanni, A., Mayer, C. (eds), European Financial Integration, Cambridge University
Press, Cambridge, England: 35-63. Helpman, E., (2004), The Mystery of Economic Growth, Cambridge, MA: MIT Press.
Heritage Foundation [Online]. Available at: http://www.heritage.org/index/rule-of-law
[Accessed 29th
May 2012].
Hesse, H., (2008), Export Diversification and Economic Growth, Commission on
Growth and Development Working Paper No. 21, Washington D.C: World Bank.
Holtz-Eakin, D., Newey, W. and Rosen, H. S., (1988), Estimating Vector
Autoregressions with Panel Data, Econometrica, 56(6): 1371-1395. Houston, D. A., (2007), Can Corruption Ever Improve an Economy? Cato Journal,
27(3): 325-342.
Hsiao, C., (2003), Analysis of Panel Data, 2nd
Edition, Econometric Society
Monograph 36, New York: Cambridge University Press.
Huang, Y. and Temple, J .R. W., (2005), Does External Trade Promote Financial
Development? Discussion Paper No. 5150, Washington D.C, CEPR.
Huang, Y., (2010), Determinants of Financial Development, New York Oxford.
Palgrave Macmillan.
Hwang, J. J., (2006), Patterns of Specialization and Economic Growth, unpublished
PhD dissertation, Economics Department, Harvard University.
Ilyina, A. and Samaniego, R., (2011), Technology and Financial Development,
Journal of Money, Credit and Banking, 43(5): 899-921.
International Monetary Fund (2008), World Economic Outlook, January.
Jaud, M., Kukenova, M. and Strieborny, M., (2012), Finance, Comparative Advantage,
and Resource Allocation, Working Paper Series No. 6111, Washington D.C: World
Bank.
Javorcik, B. S., (2004), Does Foreign Direct Investment Increase the Productivity of
Domestic Firms? In Search of Spillovers through Backward Linkages, American
Economic Review, 94(3): 605-627.
Jayaratne, J. and Strahan, P., (1996), The Finance-Growth Nexus: Evidence From
Bank Branch Deregulation, Quarterly Journal of Economics, 111(3): 639-670.
Johnson, P. and Parker, S., (1994), The Interrelationship Between Births and Deaths,
Small Business Economics, 6(4): 283-290. Jutting, J., (2003), Institutions and Development: A Critical Review, Working Paper
210 (Paris: OECD)
Kabango, G, P. and Paloni, A., (2011), Financial Liberalization and Industry
Response: Concentration and Entry in Malawi, World Development, 39(10): 1771-
1783.
Kaminsky, L. G., and Reinhart, M. C., (1999), The Twin Crises: The Causes of
Banking and Balance-of-Payments Problems, The American Economic Review, 89(3):
473-500.
Kaminsky, L. G., and Schmukler, L. S., (2008), Sort-Run Pain, Long-Run Gain:
Financial Liberalization and Stock Market Cycles, Review of Finance, European
Finance Association, 12(2): 253-292.
Kamuganga, D. N., (2012), What Drives Export Diversification? Graduate Institute of
International and Development Studies Working Paper No. 15/2012, The Graduate
Institute-Geneva.
Karas, A., Schoors, K. and Weill, L., (2008), Are Private Banks more Efficient than
Public Banks? Evidence from Russia, BOFIT Discussion Paper No. 3/2008, Bank of
Finland.

201
Kaufmann, D., Kraay, A. and Mastruzzi, M., (2002), Governance Matters III:
Governance Indicators for 1996, 1998, 2000 and 2002, World Bank Economic Review,
18(2): 253-287. Khan, M., (2008), Governance and Development: The Perspective of Growth-
Enhancing Governance. In: Diversity and Complementarity in Development Aid: East
Asian Lessons for African Growth. Tokyo: GRIPS Development Forum/National
Graduate Institute for Policy Studies: 107-152.
Kim, D., Lin, S. and Suen, Y., (2010), Dynamic Effects of Trade Openness on
Financial Development, Economic Modelling, 27(1): 254-261.
King, R. and R. Levine, 1994, Capital Fundamentalism, Economic Development, and
Economic Growth, Carnegie-Rochester Conference Series on Public Policy 40: 259–
292.
Kim, D. H., Lin, S. C., and Suen, Y. B., (2010), Dynamic Effect of Trade Openness on
Financial Development, Economic Modelling, 27(1): 254-261.
King, R. G. and Levine, R., (1993a), Finance and Growth: Schumpeter might be right,
Quarterly Journal of Economics, 108(3): 717-738.
King, R. G, and Levine, R., (1993b), Finance, Entrepreneurship and Growth: Theory
and Evidence, Journal of Monetary Economics, 32(3): 513-542.
Klein, M.W. and Olivei, G.P., 2008, Capital Account Liberalization, Financial Depth,
and Economic Growth, Journal of International Money and Finance 27(6): 861-875.
Kletzer, K. and Bardhan, P., (1987) Credit Markets and Patterns of International
Trade. Journal of Development Economics, 27(1-2): 57-70.
Klinger, B. and Lederman, D., (2004), Discovery and Development: An Empirical
Exploration of ‘New’ Products, Mimeo.
Knack, S. and Keefer, P., (1995), Institutions and Economic Performance: Cross-
country tests using alternative Measures, Economics and Politics, 7(3): 207-227. Kowalski, P., (2011), Comparative Advantage and Trade Performance: Policy
Implications, OECD Trade Working Paper 121 (Paris: OECD).
Krugman, P, (1980), Scale Economies, Product Differentiation, and the Pattern of
Trade, American Economic Review, 70(5): 950–959.
Kumar, K., Rajan, R. and Zingales, L., (1999), What determines Firm Size? Working
Paper No. 7208, University of Chicago: NBER.
La Porta, R., De-Silanes, L. and Shleifer, A., (2002), Government Ownership of
Banks, The Journal of Finance, 57(1): 265-296.
La Porta, R., Lopez-de-Silane, F., Shleifer, A. and Vishny, R. W., (1998), Law and
Finance, Journal of Political Economy, 106(6): 1113-1155.
La Porta, R., Lopez-de-Silanes, F., Shleifer, A. and Vishny, R. W., (1999), The
Quality of Government, Journal of Law, Economics and Organization, 15(1): 222-
279. Lall, S., (2004), Reinventing Industrial Strategy: The Role of Government Policy in
Building Industrial Competiveness, QEH Working Paper Series No. 30, mimeo.
Lall, S., Weiss, J. and Zhang, J, K., (2006), The “Sophistication” of Export: A New
Trade Measure, World Development, 34(2): 222-237.
Lapavitsas, C. and Dos Santos, P., (2008), Globalization and Contemporary Banking:
On the Impact of New Technology, Contributions to Political Economy, 27(1): 31-56.
Leamer, E. E., Maul, H., Rodriguez, S. and Schott, P, K., (1999), Does Natural
Resource Abundance Increase Latin American Income Inequality? Journal of
Development Economics, 59(1): 3-42.
Lederman D. and W. Maloney (2003), Trade Structure and Growth, Policy Research
Working Paper, No. 3025, Washington D.C: World Bank.

202
Lensink, R., Meesters, A. and Naaborg, I., (2008), Bank Efficiency and Foreign
Ownership: Do Good Institutions Matter? Journal of Banking and Finance, 32(5):
834-844. Levin, A., and Lin, C. F., (1993), Unit Root Test in Panel Data: New Results,
University of California at San Diego, Discussion Paper No. 93-56. Levin, A., Lin, C. F., and Chu, C. S. J., (2002), Unit Root Test in Panel Data:
Asymptotic and Finite-Sample Properties, Journal of Econometrics, 108(2002): 1-24.
Levine, R (1997), Financial Development and Economic Growth: Views and Agenda,
Journal of Economic Literature, 35: 688-726.
Levine, R., (1996), Foreign Banks, Financial Development and Growth, In
International Financial Markets: Harmonization versus Competition edited by C.
Barfield, 224-254: Washington D.C, AEI Press.
Levine, R., (1997), Financial Development and Economic Growth: Views and Agenda,
Journal of Economic Literature, 35(2): 688-726.
Levine, R., (1998), The Legal Environment, Banks, and Long-Run Economic Growth,
Journal of Money, Credit and Banking, 30(3): 688-726.
Levine, R., (1999), Law, Finance and Economic Growth, Journal of Financial
Intermediation, 8(1-2): 36-67
Levine, R., (2003), Denying Foreign Bank Entry: Implication for Bank Interest
Margins, Central Bank of Chile Working Papers No. 222, Santiago, Chile.
Levine, R. and Zevros, S., (1998), Stock Markets, Banks and Economic Growth,
American Economic Review, 88(3): 537-558.
Levine, R., Loayza, N. and Beck, T., (2000), Financial Intermediation and Growth:
Causality and Causes, Journal of Monetary Economics, 46(1): 31-77.
Lewis, W.A., (1950), The Principles of Economic Planning, G. Allen and Unwin:
London. Lin, S. C., (2009), Inflation and Real Stock Returns Revisited, Economic Inquiry,
47(4): 783-795.
Lin, J. Y., Sun, X. and Wu, H. X., (2012), Banking Structure, Labour Intensity and
Industrial Growth: Evidence from China, mimeo, Washington, DC: World Bank.
Lin, J. Y, Sun, X. and Jiang, Y. (2009), Toward a Theory of Optimal Financial
Structure, World Bank Policy Research Working paper No. 5038, Washington D.C:
World Bank.
Lin, S., (2009), Inflation and Real Stock Returns Revisited, Economic Inquiry, 47(4),
783-795.
Lindgren, C. J., Garcia, G., and Saal, M., (1996), Bank Soundness and Macroeconomic
Policy, International Monetary Fund.
Lo, D. and Chan, M. H. T., (1998), Machinery and China’s Nexus of Foreign Trade
and Economic Growth, Journal of International Development, 10, (6): 733-749. Loayza, N., Schmidt—Hebbel, K., and Serven, L., (2000), What Drives Private
Savings across the World? Review of Economics and Statistics, 82(2): 165-181.
Loayza, N., and Ranciere, R., (2006), Financial Development, Financial Fragility, and
Growth, Journal of Money, Credit and Banking, 38 (4): 1051-1076.
Lucas, R, Jr. (1988), On the Mechanics of Economic Development, Journal of
Monetary Economics, 22(1): 3-42.
Luintel, B. K., Khan, M., Arestis, P. and Theodoridis, K. (2008), Financial Structure
and Economic Growth, Journal of Development Economics, 86(1): 181-200.
Mian, A., (2003), Foreign, Private Domestic, and Govern Banks: New Evidence from
Emerging Markets, University of Chicago, Mimeo.

203
Mian, A., (2006), Distance Constarints: The Limit of Foreign Lending in Poor
Economies, Journal of Finance, 61(3): 1465-1505.
Manova, K. (2008). Credit Constraints, Heterogeneous Firms and International Trade,
NBER Working Paper No. 14531, Cambridge, MA: NBER.
McKinnon, R. I., (1973), Money and capital in Economic Development, Washington,
D.C.: Brookings Institution.
Melitz, M. J., (2003), The Impact of Trade on Intra-Industry Reallocations and
Aggregate Industry Productivity, Econometrica, 71(6): 1695-725.
Micco, A and Panizza, U., (2006), Bank Ownership and Lending Behaviour, Economic
Letters, 93(2): 248-254.
Micco, A., Panizza, U. and Yanez, M., (2007), Bank Ownership and Performance:
Does Politics Matter? Journal of Banking and Finance, 31(1): 219-241.
Mitchener, K. J. and Wheelock, D. C., (2013), Does the Structure of Banking Markets
affect Growth? Evidence from U.S. States Banking Markets, Explorations in
Economic History, 50(2): 161-178.
Mohanty, S. Schnabel, G., and Garcia-Luna, P., (2004), Banks and Aggregate Credit:
What is New? BIS Papers, 28(2): 11-39.
Muuls, M. (2008). Exporters and Credit Constraints. A Firm Level Approach. London
School of Economics. mimeo.
Nichols, D. A., (1974), Some Principles of Inflationary Finance. Journal of Political
Economy, 82(345): 47-70.
North, D. C., (1989), Institutions and Economic Growth: An Historical Introduction,
World Development, 17(9): 1319-1332.
North, D. C., (1990), Institutions, Institutional Change and Economic Performance,
Cambridge: Cambridge University Press.
Pagano, M., (1993), Financial Markets and Growth: An Overview, European
Economic Journal, 37(2- ): 613-622.
Parteka, A. and Tamberi, M., (2013), What Determines Export Diversification in the
Development Process? Empirical Assessment, The World Economy, 36(3): 807-826.
Paseran, M., Shin, H., and Smith, Y., (1999), Pooled Mean Group Estimator of
Dynamic Heterogeneous Panels, Journal of Econometrics, 68: 79-113.
Peterson, M.A. and Rajan, R.G., (1995), The Effect of Credit Market Competition on
Lending Relationship, Quarterly Journal of Economics, 110(2): 407 – 443.
Prebisch, R., (1950), The Economic Development of Latin America and its Principal
Problems, United Nations, New-York.
Rajan, R., (1992), Insiders and Outsiders: The Choice between Informed and Arms’
Length Debt, Journal of Finance, 47(4): 1367-1400.
Rajan, R. and L. Zingales, 1998, Financial Dependence and Growth, American
Economic Review 88(3): 559-86.
Ratti, R. A., Lee, S. and Seol, Y., (2008), Bank Concentration and Financial
Constraints on Firm-Level Investment in Europe, Journal of Banking and Finance,
32(12): 2684-2694.
Ricardo, D., 1817. On the Principles of Political Economy and Taxation. In The Works
and Correspondence of David Ricardo, Vol. I. edited by Sraffa, P. Cambridge
University Press, Cambridge, 1951.
Rodrik, D, (2001), The Global Governance of World Trade as if Development Really
Mattered, mimeo.
Rodrik, D, (2006), ‘What Is So Special about China’s exports?’ China and the World
Economy, 14(5): 1-19.

204
Rodrik, D., (2012), Why we Learn Nothing from Regressing Economic Growth on
Policies, Seoul Journal of Economics, 25(2): 137-151.
Romer, P. (1990), Endogenous Technical Change, Journal of Political Economy,
98(5): S71–S102.
Rousseau, P. and Xiao, S., (2007), Banks, Stock market, and China’s Great Leap
Forward, Emerging Market Review, 8(3): 206-217.
Rudolph, H. P., (2009), State Financial Institutions: Mandates, Governance and
Beyond, World Bank Policy Research Working Paper WPS5141, Washington D.C:
World Bank.
Sachs, J. D. and Warner, A, M., (1997), Sources of Slow Growth in African
Economies, Journal of African Economies, 6(3): 335–76.
Sachs, J. D. and Warner, A., (1995), Economic Reform and the Process of Global
Integration, Brookings Papers of Economic Activity, 1995(1): 1 – 95.
Sachs, J.D. and Warner, A, M., (2001), Natural Resources and Economic
Development: The Curse of Natural Resources, European Economic Review, 45(4-6):
827–838.
Samen, S., (2010), A Primer on Export Diversification: Key Concepts, Theoretical
Underpinnings and Empirical Evidence, Growth and Crisis Unit, World Bank Institute.
Sapienza, P., (2004), The effect of government ownership on bank lending, Journal of
Financial Economics, 79(1): 357-384.
Satta, T. A., (2004), The Influence of Foreign Bank Entry on Lending to Small Firms
in Tanzania, Policy Reform, 7(3): 165-173.
Scherer, R. and M. Ross (1990), Industrial Structure and Economic Performance, (3rd
Edition), Houghton Mifflin, Boston, USA.
Schneider, M. and Tornell, A., (2004), Balance Sheet Effects, Bailout Guarantees and
Financial Crises, The Review of Economic Studies, 71(07): 883-913.
Schott, P. (2008), The Relative Sophistication of Chinese Exports, Economic Policy,
23(53): 5-49.
Schumpeter, J.A. (1912), The Theory of Economic Development, Oxford University
Press, Oxford.
Shaffer, S., (1998), The Winner’s Curse in Banking, Journal of Financial
Intermediation, 7(4): 359-392.
Shaw, E.S. (1973), Financial Deepening in Economic Development, New York:
Oxford University Press.
Shen, C. H. and Lin, C. Y., (2012), Why Government banks Underperform: A Political
Interference View, Journal of Financial Intermediation, 21(2): 181-202.
Singer, H. W., (1950), The Distribution of Trade between Investigating and Borrowing
Countries, American Economic Review, 40: 531-548.
Smith, A., (1776), The Wealth of Nations, edited by Cannan, E., vols 2, Methuen,
London.
Stein, H., (2010), Financial Liberalization, Institutional Transformation, and Credit
Allocation in Developing Countries: The World Bank and the Internalization of
Banking, Cambridge Journal of Economics, 34(2): 257-273.
Stiglitz, J.E. (1985), Credit Markets and the Control of Capital, Journal of Money,
Credit and Banking, 17(1): 133-152.
Stiglitz, J.E., Jaramillo-Vallejo, J. and Park, Y.C., (1993), The Role of The State in
Financial Markets, World Bank Research Observer, Annual Conference on
development Economics Supplement, 19-61.
Sutton, J., (1991), Sunk Costs and Market Structure, Cambridge, MA: MIT Press.

205
Svaleryd, H. and Vlachos, J., (2005), Financial markets, the pattern of industrial
specialization and comparative advantage: Evidence from OECD countries, European
Economic Review 49(1): 113-144.
Thirwall, A. P., (2006), Growth and Development: with special reference to
developing economies, Palgrave Macmillan: London. UNCTAD, (2007), The Least Developed Countries Report 2007, (Geneva: UNCTAD).
UNCTAD, (2011), UNCTADSTAT [online] Available at:
http://unctadstat.unctad.org/ReportFolders/reportFolders.aspx [Accessed between
August 2011 and September 2012].
UNDP, (2011), Towards Human Resilience: Sustaining MDG Progress in an Age of
Economic Uncertainty, United Nations Development Programme, Bureau of
Development Policy, UN-New York.
UNIDO, (2009), UNIDO Industrial Statistics [online] Available at:
http://stats.ukdataservice.ac.uk/. [Accessed between August 2009 and May 2012].
Walter, I., and Gray, H.P., (1983), Protectionism, and International Banking, Sectorial
Efficiency, Competitive Structure and National Policy. Journal of Banking and
Finance, 7(4): 597-609.
Wang, S., (2003), The State, Market Economy and Transition, Asian Exchange, 19(3):
224-244.
Weinstein, D. E. and Yafeh, Y., (1998), On the cost of a Bank-centred Financial
System: Evidence from the Changing Bank Relations in Japan. Journal of Finance
53(2): 635- 672. Wooldridge, J. M., (2002), Econometric Analysis of Cross Section and Panel Data,
Cambridge, MA: MIT Press.
Wooldridge, J. M., (2006), Introductory Econometrics: A Modern Approach, 3rd
Edition, Cincinnati, OH: South-Western College Publishing.
World Bank, (2001), Finance and Growth: Policy Choices in a Volatile World
(Washington D.C: World Bank).
World Bank, (2002), World Development Report 2002, Washington, D.C, World
Bank.
World Bank, (2008), Bank Regulation and Supervision Database, Washington D.C,
Word Bank.
World Bank, (2009), World Development Indicators [online] Available at:
http://esds80.mcc.ac.uk/wds_unido/ReportFolders/reportFolders.aspx [Accessed
between Aug 2010 and May 2012].
Wurgler, J. (2000), Financial Markets and the Allocation of Capital, Journal of
Financial Economics, 58(1-2): 187-214.
Xu, B., (2007), Measuring China’s Export Sophistication, China Europe International
Business School, mimeo.
Xu, B. and Lu, J., (2007), The Impact of Foreign MNEs on Export Sophistication of
Host Countries: Evidence from China, China Europe International School, mimeo.
Yeyati, L.E., Micco, A. and Panizza, U., (2007), A Reappraisal of State Owned Banks,
Economia, 7 (2): 209-259.
Recommended