Early Statistical Inferences :Early Statistical Inferences :
“The Eyes have it”“The Eyes have it”“The Eyes have it”
Chris WildUniversity of Auckland
THE UNIVERSITY OF AUCKLANDDEPARTMENT OF STATISTICS
University of Auckland
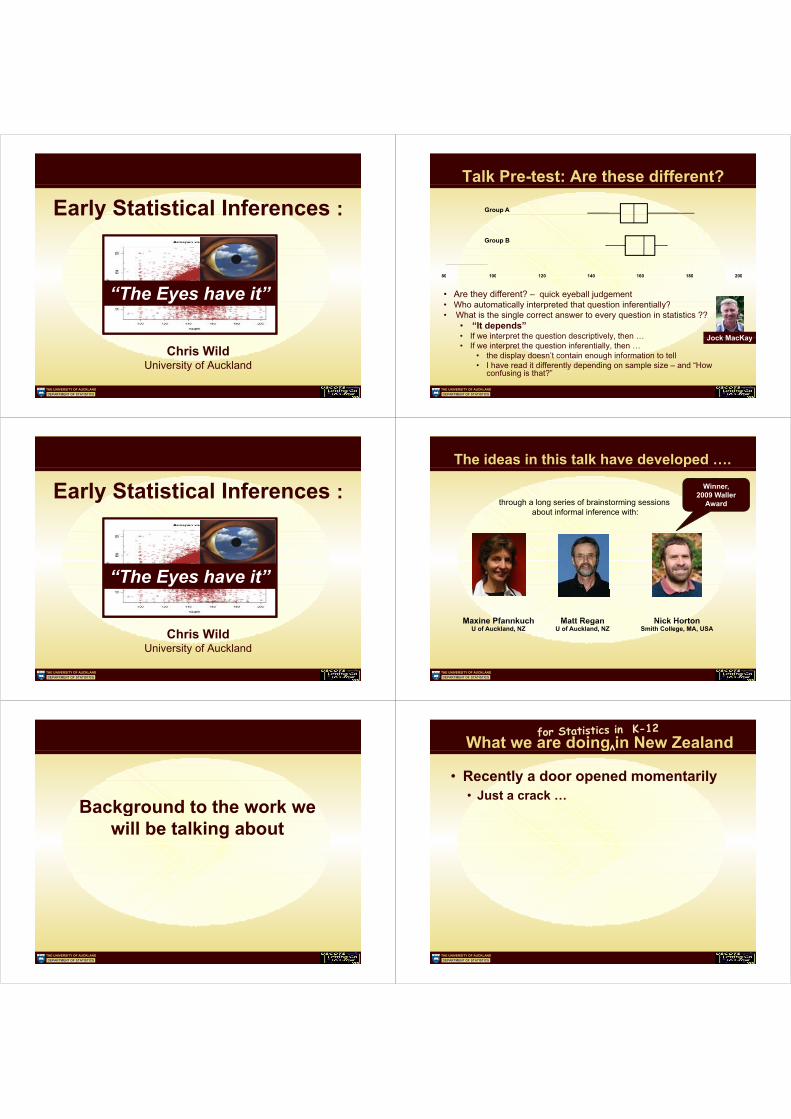
Talk Pre-test: Are these different?
Group A
Group B
80 100 120 140 160 180 20080 100 120 140 160 180 200
• Are they different? – quick eyeball judgement• Who automatically interpreted that question inferentially?Who automatically interpreted that question inferentially?• What is the single correct answer to every question in statistics ??
• “It depends”• If we interpret the question descriptively then Jock MacKayIf we interpret the question descriptively, then …• If we interpret the question inferentially, then …
• the display doesn’t contain enough information to tell• I have read it differently depending on sample size – and “How
Jock MacKay
THE UNIVERSITY OF AUCKLANDDEPARTMENT OF STATISTICS
I have read it differently depending on sample size and Howconfusing is that?”
Early Statistical Inferences :Early Statistical Inferences :
“The Eyes have it”“The Eyes have it”“The Eyes have it”
Chris WildUniversity of Auckland
THE UNIVERSITY OF AUCKLANDDEPARTMENT OF STATISTICS
University of Auckland
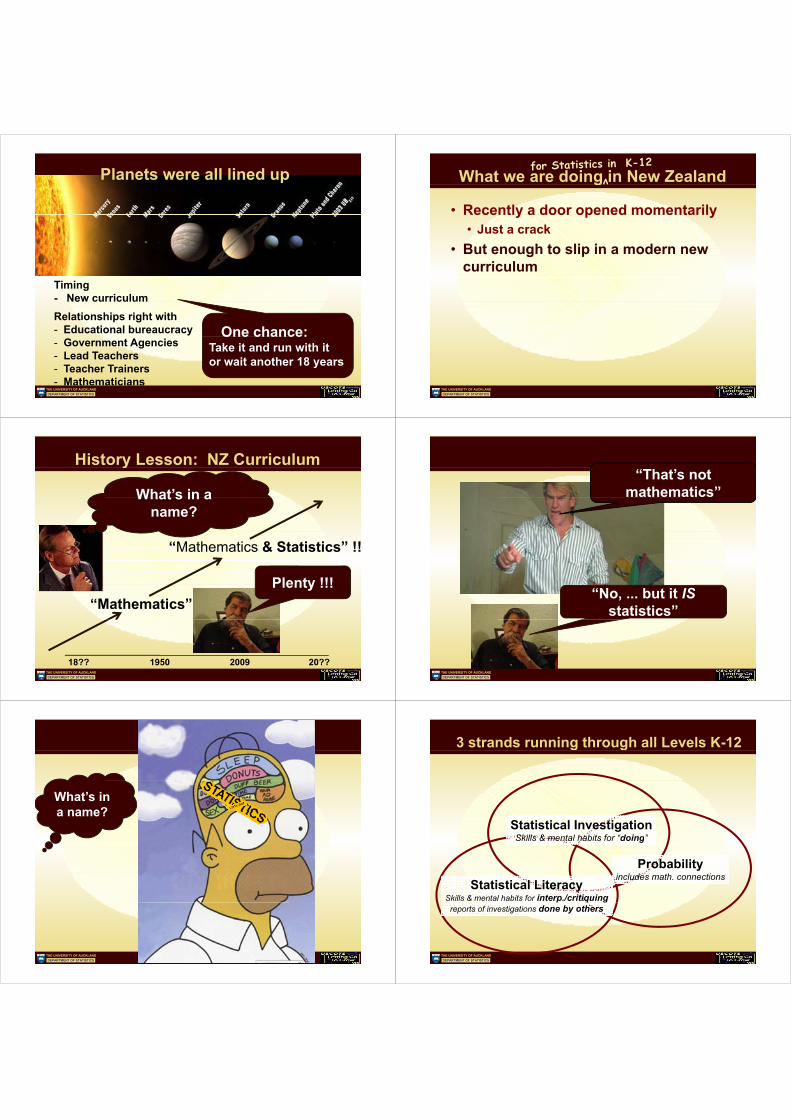
The ideas in this talk have developed ….Winner,
2009 Waller through a long series of brainstorming sessions
about informal inference with:Award
Maxine Pfannkuch Matt Regan Nick HortonMaxine PfannkuchU of Auckland, NZ
Matt ReganU of Auckland, NZ
Nick HortonSmith College, MA, USA
THE UNIVERSITY OF AUCKLANDDEPARTMENT OF STATISTICS
Background to the work weBackground to the work wewill be talking about
THE UNIVERSITY OF AUCKLANDDEPARTMENT OF STATISTICS
What we are doing in New Zealandvg
• Recently a door opened momentarily
v
Recently a door opened momentarily• Just a crack …
THE UNIVERSITY OF AUCKLANDDEPARTMENT OF STATISTICS
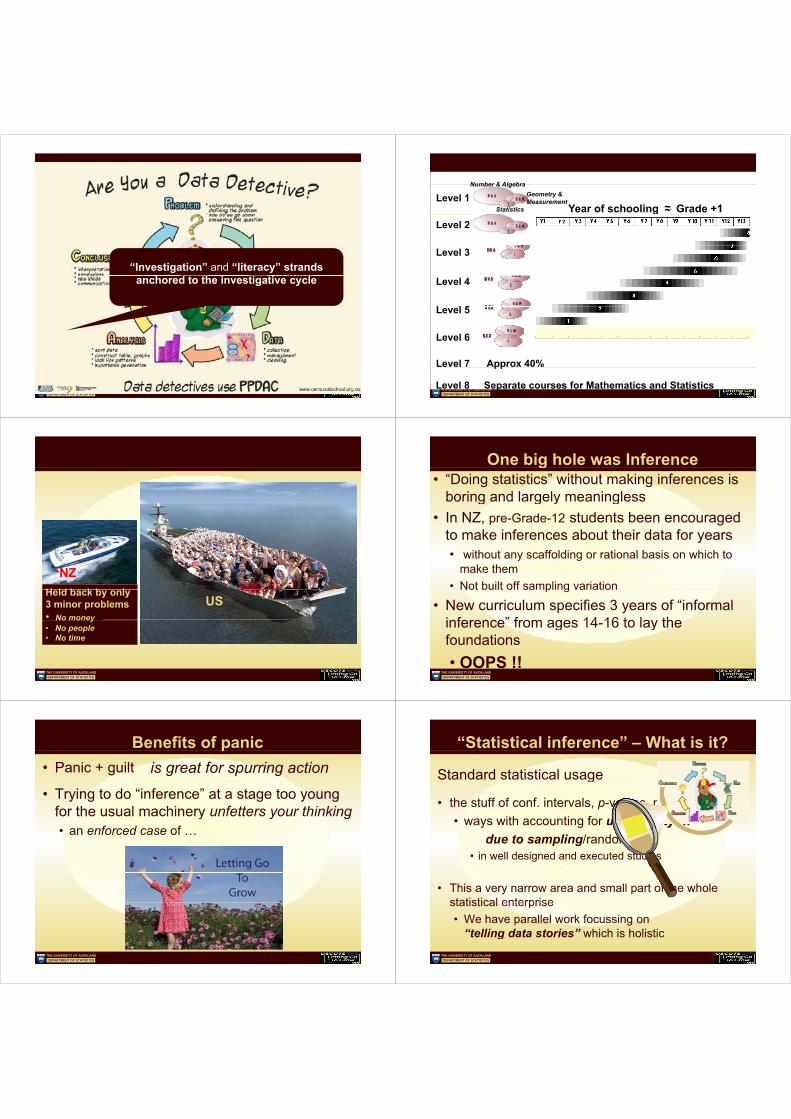
Planets were all lined up
Timing- New curriculumRelationships right with- Educational bureaucracy One chance:- Government Agencies- Lead Teachers
Teacher Trainers
Take it and run with it or wait another 18 years
THE UNIVERSITY OF AUCKLANDDEPARTMENT OF STATISTICS
- Teacher Trainers- Mathematicians
y
What we are doing in New Zealandvg
• Recently a door opened momentarily
v
Recently a door opened momentarily• Just a crack
B t h t li i d• But enough to slip in a modern new curriculum
THE UNIVERSITY OF AUCKLANDDEPARTMENT OF STATISTICS
History Lesson: NZ Curriculum
What’s in a
y
What s in aname?
“Mathematics & Statistics” !!
Plenty !!!“Mathematics”
y
THE UNIVERSITY OF AUCKLANDDEPARTMENT OF STATISTICS
18?? 2009 20??1950
“That’s not mathematics”
“N b t it IS“No, ... but it ISstatistics”
THE UNIVERSITY OF AUCKLANDDEPARTMENT OF STATISTICS
What’s in a name?a name?
THE UNIVERSITY OF AUCKLANDDEPARTMENT OF STATISTICS
3 strands running through all Levels K-12g g
Statistical InvestigationSkills & mental habits for “doing”g
Probabilityincludes math. connections
Statistical LiteracySkills & mental habits for interp./critiquing
reports of investigations done by others
THE UNIVERSITY OF AUCKLANDDEPARTMENT OF STATISTICS
“Investigation” and “literacy” strands anchored to the investigative cycle
THE UNIVERSITY OF AUCKLANDDEPARTMENT OF STATISTICS
Number & Algebra
Level 1Year of schooling Grade +1~~
Number & AlgebraGeometry &Measurement
Statistics
Level 2
Level 3
Level 4
L l 5Level 5
Level 6Level 6
Level 7 Approx 40%
THE UNIVERSITY OF AUCKLANDDEPARTMENT OF STATISTICS
Level 8 Separate courses for Mathematics and Statistics
pp
NZH ld b k b l
USHeld back by only3 minor problems• No moneyNo money• No people• No time
THE UNIVERSITY OF AUCKLANDDEPARTMENT OF STATISTICS
One big hole was Inferenceg• “Doing statistics” without making inferences is
boring and largely meaninglessboring and largely meaningless• In NZ, pre-Grade-12 students been encouraged
to make inferences about their data for years• without any scaffolding or rational basis on which to y g
make them• Not built off sampling variationNot built off sampling variation
• New curriculum specifies 3 years of “informal inference” from ages 14 16 to lay theinference” from ages 14-16 to lay thefoundations
THE UNIVERSITY OF AUCKLANDDEPARTMENT OF STATISTICS
• OOPS !!
Benefits of panicp• Panic + guilt is great for spurring action
• Trying to do “inference” at a stage too young for the usual machinery unfetters your thinkingfor the usual machinery unfetters your thinking• an enforced case of …
THE UNIVERSITY OF AUCKLANDDEPARTMENT OF STATISTICS
“Statistical inference” – What is it?
Standard statistical usageg
• the stuff of conf. intervals, p-values, posteriors, …• ways with accounting for uncertainty …
due to sampling/randomizingdue to sampling/randomizing• in well designed and executed studies
• This a very narrow area and small part of the whole statistical enterprisestatistical enterprise• We have parallel work focussing on
“telling data stories” which is holisticTHE UNIVERSITY OF AUCKLANDDEPARTMENT OF STATISTICS
telling data stories which is holistic
Plan of Attack• Identify and work from a minimal set of the
biggest ideas of “statistical inference” Why?biggest ideas of statistical inference .• Because students cannot pay attention too many
issues simultaneously
Why?
issues simultaneously• So make those few connections that matter most• Eliminate “busy work”• Eliminate busy work
• Put approximate big picture securely in place,then, over a period of years, …• iteratively refine the details, add subtleties, make
corrections• Exploit the power of the visual sense
THE UNIVERSITY OF AUCKLANDDEPARTMENT OF STATISTICS
p p• Integrate inference within investigative cycle•
Building of inferential ideas takes substantial time, BUT want …
• an implementation in which the equivalent of a“Notice how the more attention you pay to any one element – picture story theory or rules – the less attention goes to• an implementation in which the equivalent of a
statistical-significance decision can be made extremely quickly
– picture, story, theory, or rules – the less attention goes tothe other three. In Step … you have to … and the more effectively you do extremely quickly
• In the context of a particular investigation a student is doing the mechanics of the inferential step
p y y ythat, the more the story fades into the background.”
– George Cobb (1997)is doing, the mechanics of the inferential stepshould not be at all demanding
• Whenever students have to struggle with
George Cobb (1997)
• Whenever students have to struggle withimplementation details the big picture gets lost
including any consciousness of why they are• including any consciousness of why they aredoing it
d h t it ll h th h fi i h dTHE UNIVERSITY OF AUCKLANDDEPARTMENT OF STATISTICS
• and what it all means when they have finished
Ideally, …y,• want students to have experiences where can
ask a question• ask a question• get the data• obtain the graphs• make descriptive commentsa e desc p e co e s• and inferential conjectures• make a call on the direction of a group differences• make a call on the direction of a group differences• and write up the whole storyall within a one hour lesson period
Inference step made without taking eyes off the plotsTHE UNIVERSITY OF AUCKLANDDEPARTMENT OF STATISTICS
Inference step made without taking eyes off the plots
Desiderata• Work from a minimal set of the biggest ideas of
statistical inference building off intuitive understandings of the naturestatistical inference building off intuitive understandings of the natureof sampling variation
• Mechanics of the inferential step should not be at allMechanics of the inferential step should not be at alldemanding• Should be able to be performed without students taking theirShould be able to be performed without students taking their
eyes off their graphs• Should have connections to the more formal methodsShould have connections to the more formal methods
to be used later (a developmental pathway)
Recipe:Recipe:Blend hands-on activities & novel computer animations.Add i it f J h T k d ti
THE UNIVERSITY OF AUCKLANDDEPARTMENT OF STATISTICS
Add spirit of John Tukey and stir. Bake but do not half-bake
“Statistical Inference” is a response to … p• that particular type of uncertainty that is caused by
having data from random samples rather than thehaving data from random samples rather than thewhole universe
(The nature of the beast)(The nature of the beast)
“S li i ti ” i d f t f id d• “Sampling variation” is a code for a set of ideas andexperiences motivating the need for inference and
ti h h ld d it
It has nothing to say about design & execution issues,data quality, data relevance, importance, …
suggesting how we should do it• not just how samples differ from one another, but how they
relate to the parent population(s)/process(es)/distributionsrelate to the parent population(s)/process(es)/distributions
(The nature of the problem & pointers to solutions)
THE UNIVERSITY OF AUCKLANDDEPARTMENT OF STATISTICS
Corollaryy• We should initially approach inference by
exploring the nature of sampling variationexploring the nature of sampling variation
But …But …“Sampling variation is difficult”
“St d t j t d ’t t it”“Students just don’t get it”
But maybe that’s a consequence of our approachesBut maybe that s a consequence of our approaches• Maybe there is stuff here that
we can “let go to grow”THE UNIVERSITY OF AUCKLANDDEPARTMENT OF STATISTICS
we can “let go to grow”

Early lnference: Letting go to growy g g g• Take a very small set of ideas
• Run as far as we can with them• You’ll find that it is quite a long way
• Goals• More satisfying & rational ways for beginners to• More satisfying & rational ways for beginners to
answer interesting real-world questionsB ildi i t t i t iti• Building important intuitions
• Foundations for further learning
THE UNIVERSITY OF AUCKLANDDEPARTMENT OF STATISTICS
Let this lot go to Growg
TheoreticalDistributions
H0Conventional
reps of sampl. variationp p
Calculations
THE UNIVERSITY OF AUCKLANDDEPARTMENT OF STATISTICS
Letting theoretical distributions gog g• Build inferential ideas in terms of sampling
f l fi it l tifrom large finite populations• and, in particular, the databases at
http://www.censusatschool.org.nz/
(but use them in more general contexts as well)
ttp // ce susatsc oo o g /
THE UNIVERSITY OF AUCKLANDDEPARTMENT OF STATISTICS
Letting “null hypotheses” gog yp gWhy?• No one believes their null hypotheses
• They make no sense with population dataThey make no sense with population data• Artificial device
• Students find it very hard to think in this way• “What would it look like if there was no effect?”What would it look like if there was no effect?
It’s a little like looking at the world while standingIt s a little like looking at the world while standingon your head
THE UNIVERSITY OF AUCKLANDDEPARTMENT OF STATISTICS
Whywould anyone doWhywould�anyone�do�anything�so�unnatural?
THE UNIVERSITY OF AUCKLANDDEPARTMENT OF STATISTICS
Statistician�looks�at�the�world�under�the�Null
Letting “null hypotheses” gog yp g• Causes silly mistakes
• “There is no difference” back in the populations/processes
• Replace by …(back in the populations/processes)Replace by …(back in the populations/processes)• either making a call on the direction of an effect
or “can’t tell” Aor can t tell AB
• “A’s tend to be bigger than B’s” back in the populations
versus• “I can’t tell which is bigger”
• “If looked again could well turn out other way around”
THE UNIVERSITY OF AUCKLANDDEPARTMENT OF STATISTICS
If looked again could well turn out other way around
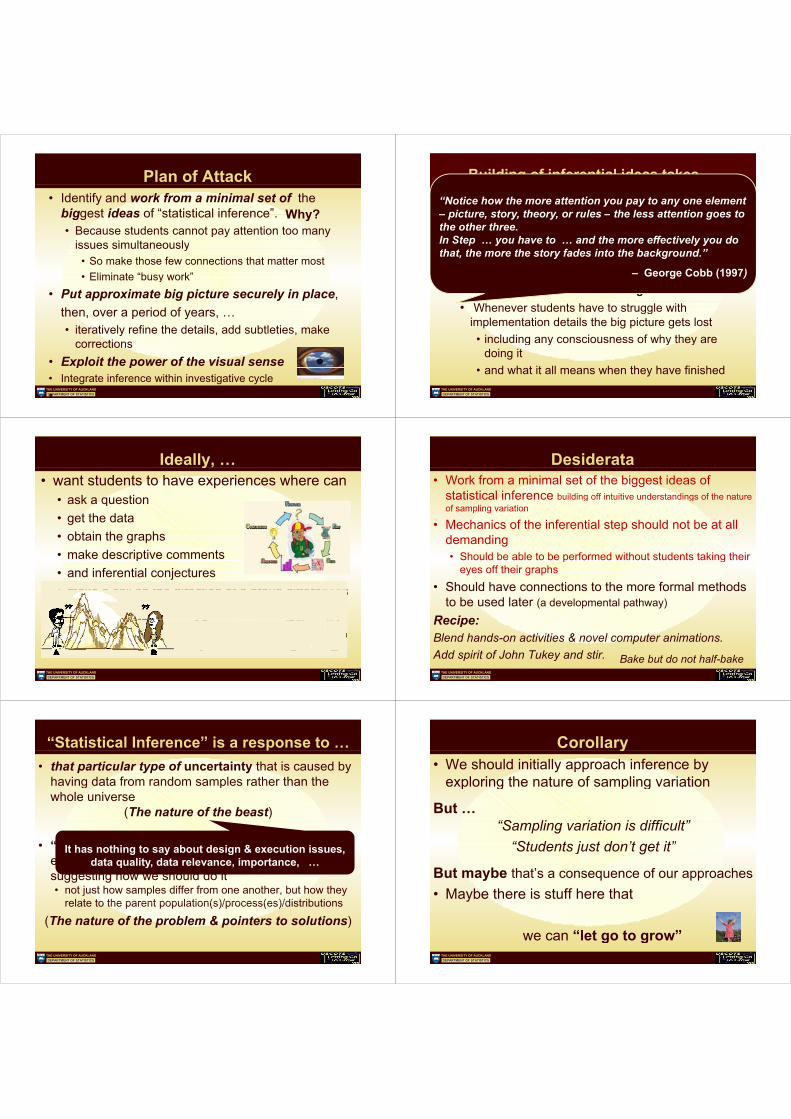
Letting conventional reps of sampling variation go
80 100 120 140 160 180 200
THE UNIVERSITY OF AUCKLANDDEPARTMENT OF STATISTICS
How we usually convey sampling variation
80 100 120 140 160 180 200
THE UNIVERSITY OF AUCKLANDDEPARTMENT OF STATISTICS
THE UNIVERSITY OF AUCKLANDDEPARTMENT OF STATISTICS
THE UNIVERSITY OF AUCKLANDDEPARTMENT OF STATISTICS
THE UNIVERSITY OF AUCKLANDDEPARTMENT OF STATISTICS
How we usually convey sampling variationy y g
Heights of boys and girls aged 12from samples of size 30
Boys
Girls
80 100 120 140 160 180 200
THE UNIVERSITY OF AUCKLANDDEPARTMENT OF STATISTICS

the eyes have it !y
THE UNIVERSITY OF AUCKLANDDEPARTMENT OF STATISTICS
Let’s look at some data
from
http://www.censusatschool.org.nz/ttp // ce susatsc oo o g /
THE UNIVERSITY OF AUCKLANDDEPARTMENT OF STATISTICS
How did they travel to school ?y
Sample of size 100
50
Sample of size 100
nt
3040
Per
cen
020
01
bike bus car other train walk
THE UNIVERSITY OF AUCKLANDDEPARTMENT OF STATISTICS
How did they travel to school ?y
Sample of size 100
50
Sample of size 100
nt
3040
Per
cen
020
50
Sample of size 100
01
bike bus car other train walkPer
cent
2030
400
10
bike bus car other train walk
THE UNIVERSITY OF AUCKLANDDEPARTMENT OF STATISTICS
How did they travel to school ?ySample of size 100
Sample of size 100
4050
3040
50
Perc
ent
2030P
erce
nt
1020
3
P
1020
bike bus car other train walk
50
Sample of size 100
0
bike bus car other train walk
Per
cent
2030
400
10
bike bus car other train walk
THE UNIVERSITY OF AUCKLANDDEPARTMENT OF STATISTICS
Comparing heights of boys and girls at age 12
From samples of size 30
Boys
Girls
80 100 120 140 160 180 200
THE UNIVERSITY OF AUCKLANDDEPARTMENT OF STATISTICS

Comparing heights of boys and girls at age 12
From samples of size 30
Boys
Girls
80 100 120 140 160 180 200
THE UNIVERSITY OF AUCKLANDDEPARTMENT OF STATISTICS
Comparing heights of boys and girls at age 12
From samples of size 30
Boys
Girls
80 100 120 140 160 180 200
THE UNIVERSITY OF AUCKLANDDEPARTMENT OF STATISTICS
Comparing heights of boys and girls at age 12
Population distributions
Boys
Girls
THE UNIVERSITY OF AUCKLANDDEPARTMENT OF STATISTICS
Arm Span vs Height
THE UNIVERSITY OF AUCKLANDDEPARTMENT OF STATISTICS
Arm Span vs HeightArmspan vs Height: Samples of size 200
200
150
pan
100ar
msp
50
100 120 140 160 180 200
h i ht
THE UNIVERSITY OF AUCKLANDDEPARTMENT OF STATISTICS
height
Arm Span vs HeightArmspan vs Height: Samples of size 200
200
150
pan
100ar
msp
50
100 120 140 160 180 200
height
THE UNIVERSITY OF AUCKLANDDEPARTMENT OF STATISTICS
height
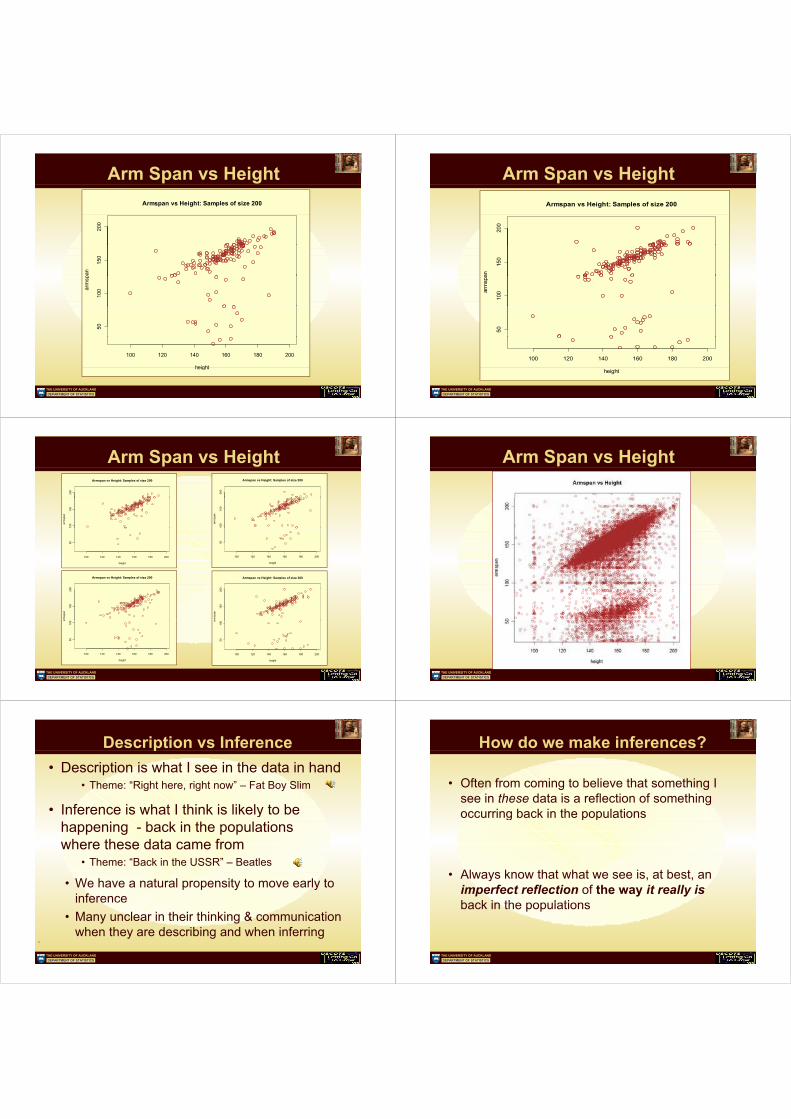
Arm Span vs HeightArmspan vs Height: Samples of size 200
200
150
pan
100ar
msp
50
100 120 140 160 180 200
height
THE UNIVERSITY OF AUCKLANDDEPARTMENT OF STATISTICS
height
Arm Span vs HeightArmspan vs Height: Samples of size 200
200
150
an
100ar
msp
a
50
100 120 140 160 180 200
THE UNIVERSITY OF AUCKLANDDEPARTMENT OF STATISTICS
height
Arm Span vs Height
200
Armspan vs Height: Samples of size 200
200
Armspan vs Height: Samples of size 200
100
150
arm
span
100
150
arm
span
100 120 140 160 180 200
50
100 120 140 160 180 200
50
height height
00
Armspan vs Height: Samples of size 200
00
Armspan vs Height: Samples of size 200
150
20
arm
span
150
20
rmsp
an
5010
0a
5010
0a
THE UNIVERSITY OF AUCKLANDDEPARTMENT OF STATISTICS
100 120 140 160 180 200
height
100 120 140 160 180 200
height
Arm Span vs Height
THE UNIVERSITY OF AUCKLANDDEPARTMENT OF STATISTICS
Description vs Inferencep• Description is what I see in the data in hand
• Theme: “Right here, right now” – Fat Boy Slim
• Inference is what I think is likely to beInference is what I think is likely to behappening - back in the populationswhere these data came fromwhere these data came from
• Theme: “Back in the USSR” – Beatles
• We have a natural propensity to move early to inference
• Many unclear in their thinking & communication when they are describing and when inferring
THE UNIVERSITY OF AUCKLANDDEPARTMENT OF STATISTICS
when they are describing and when inferring.
How do we make inferences?
Often from coming to believe that something I• Often from coming to believe that something Isee in these data is a reflection of something occurring back in the populationsoccurring back in the populations
Always know that what we see is at best an• Always know that what we see is, at best, animperfect reflection of the way it really isback in the populationsback in the populations
THE UNIVERSITY OF AUCKLANDDEPARTMENT OF STATISTICS
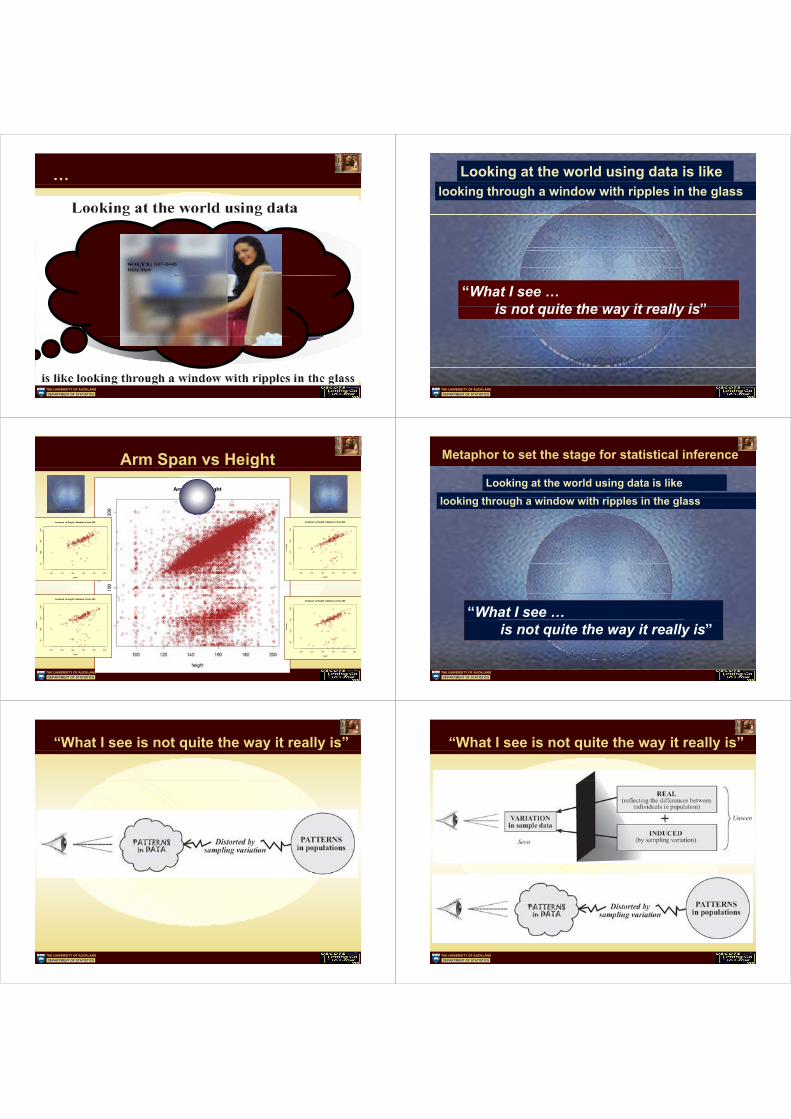
…
THE UNIVERSITY OF AUCKLANDDEPARTMENT OF STATISTICS
Looking at the world using data is likelooking through a window with ripples in the glass
“What I see …is not quite the way it really is”is not quite the way it really is”
THE UNIVERSITY OF AUCKLANDDEPARTMENT OF STATISTICS
Arm Span vs Heightp g
Armspan vs Height: Samples of size 200 Armspan vs Height: Samples of size 200
100
150
200
arm
span
100
150
200
arm
span
100 120 140 160 180 200
50
height
100 120 140 160 180 200
50
height
150
200
Armspan vs Height: Samples of size 200
5020
0
Armspan vs Height: Samples of size 200
100 120 140 160 180 200
5010
0arm
span
5010
015
arm
span
THE UNIVERSITY OF AUCKLANDDEPARTMENT OF STATISTICS
height100 120 140 160 180 200
height
Metaphor to set the stage for statistical inference
Looking at the world using data is likel ki th h i d ith i l i th llooking through a window with ripples in the glass
“What I see …is not quite the way it really is”
THE UNIVERSITY OF AUCKLANDDEPARTMENT OF STATISTICS
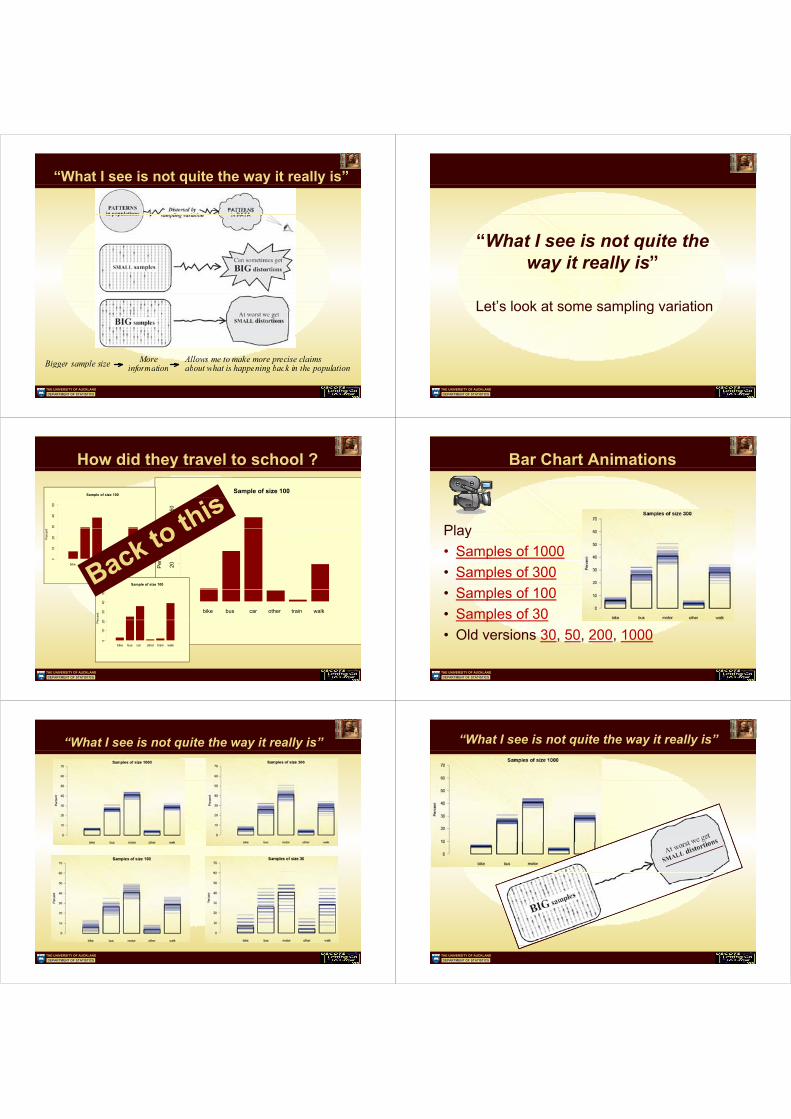
“What I see is not quite the way it really is”y y
THE UNIVERSITY OF AUCKLANDDEPARTMENT OF STATISTICS
“What I see is not quite the way it really is”y y
THE UNIVERSITY OF AUCKLANDDEPARTMENT OF STATISTICS
“What I see is not quite the way it really is”y y
MoreinformationBigger sample size Allows me to make more precise claims
about what is happening back in the population
THE UNIVERSITY OF AUCKLANDDEPARTMENT OF STATISTICS
informationgg p about what is happening back in the population
“What I see is not quite theWhat I see is not quite theway it really is”
Let’s look at some sampling variationLet s look at some sampling variation
THE UNIVERSITY OF AUCKLANDDEPARTMENT OF STATISTICS
How did they travel to school ?ySample of size 100
Sample of size 100
4050
3040
50
cent
304
Per
cent
010
203
Perc
1020
0
bike bus car other train walk
Sample of size 100
0
bike bus car other train walk
erce
nt
030
4050
Pe
010
20
bike bus car other train walk
THE UNIVERSITY OF AUCKLANDDEPARTMENT OF STATISTICS
Bar Chart Animations
PlayPlay• Samples of 1000p• Samples of 300
S l f 100• Samples of 100• Samples of 30p• Old versions 30, 50, 200, 1000
THE UNIVERSITY OF AUCKLANDDEPARTMENT OF STATISTICS
“What I see is not quite the way it really is”
THE UNIVERSITY OF AUCKLANDDEPARTMENT OF STATISTICS
“What I see is not quite the way it really is”
THE UNIVERSITY OF AUCKLANDDEPARTMENT OF STATISTICS
“What I see is not quite the way it really is”
THE UNIVERSITY OF AUCKLANDDEPARTMENT OF STATISTICS
“What I see is not quite the way it really is”q y y• What can we learn from proportions taken
from samples of size 30? (“ l i ”)from samples of size 30? (“classroom size”)
• Very little !!I f ti t t• Information contentof category data points
“D f ll i t thi• “Do you fall into thiscategory? Yes/No”
• is very small• is very small• Need very large samples
before can say anythingbefore can say anythingvery useful• Unfortunate fact of life!
THE UNIVERSITY OF AUCKLANDDEPARTMENT OF STATISTICS
(Better with measurement data)
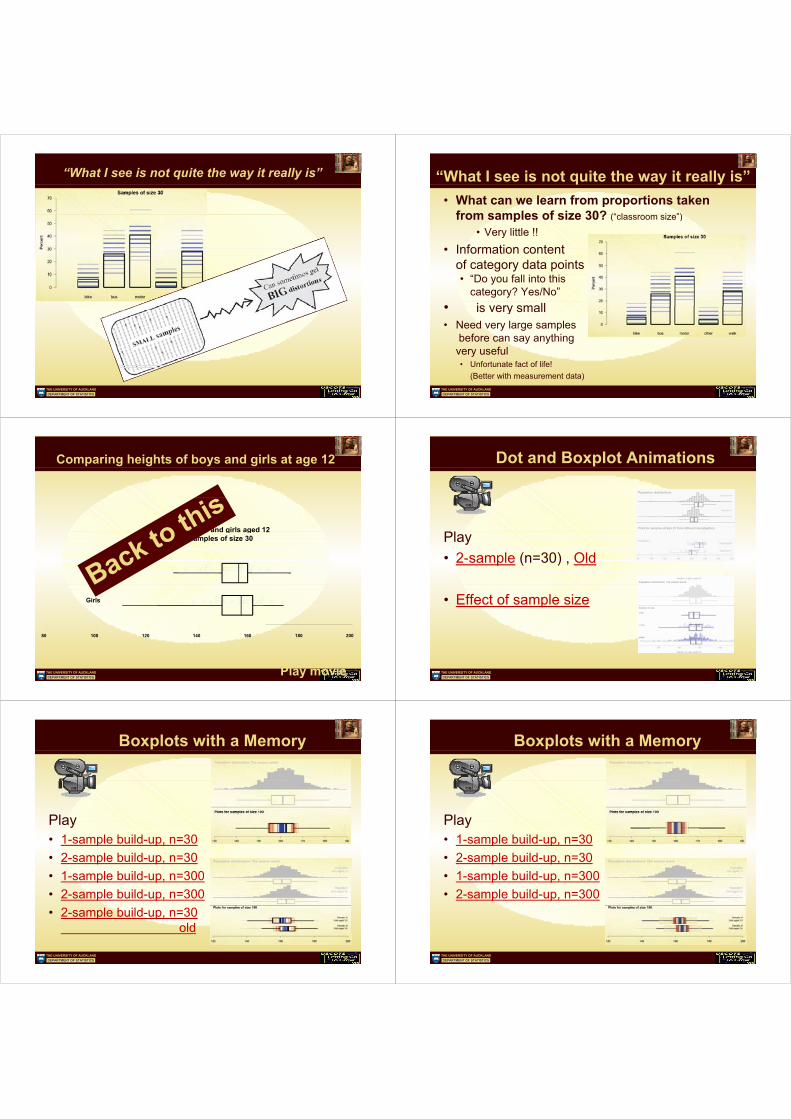
Comparing heights of boys and girls at age 12
Heights of bo s and girls aged 12Heights of boys and girls aged 12from samples of size 30
Boys
Girls
80 100 120 140 160 180 200
THE UNIVERSITY OF AUCKLANDDEPARTMENT OF STATISTICS
Play movie
Dot and Boxplot Animations
Play• 2-sample (n=30) Old• 2-sample (n=30) , Old
• Effect of sample size
THE UNIVERSITY OF AUCKLANDDEPARTMENT OF STATISTICS
Boxplots with a Memory
Play• 1-sample build-up n=301 sample build up, n 30• 2-sample build-up, n=30
1 l b ild 300• 1-sample build-up, n=300• 2-sample build-up, n=300• 2-sample build-up, n=30
old
THE UNIVERSITY OF AUCKLANDDEPARTMENT OF STATISTICS
Boxplots with a Memory
Play• 1-sample build-up n=301 sample build up, n 30• 2-sample build-up, n=30
1 l b ild 300• 1-sample build-up, n=300• 2-sample build-up, n=300
THE UNIVERSITY OF AUCKLANDDEPARTMENT OF STATISTICS
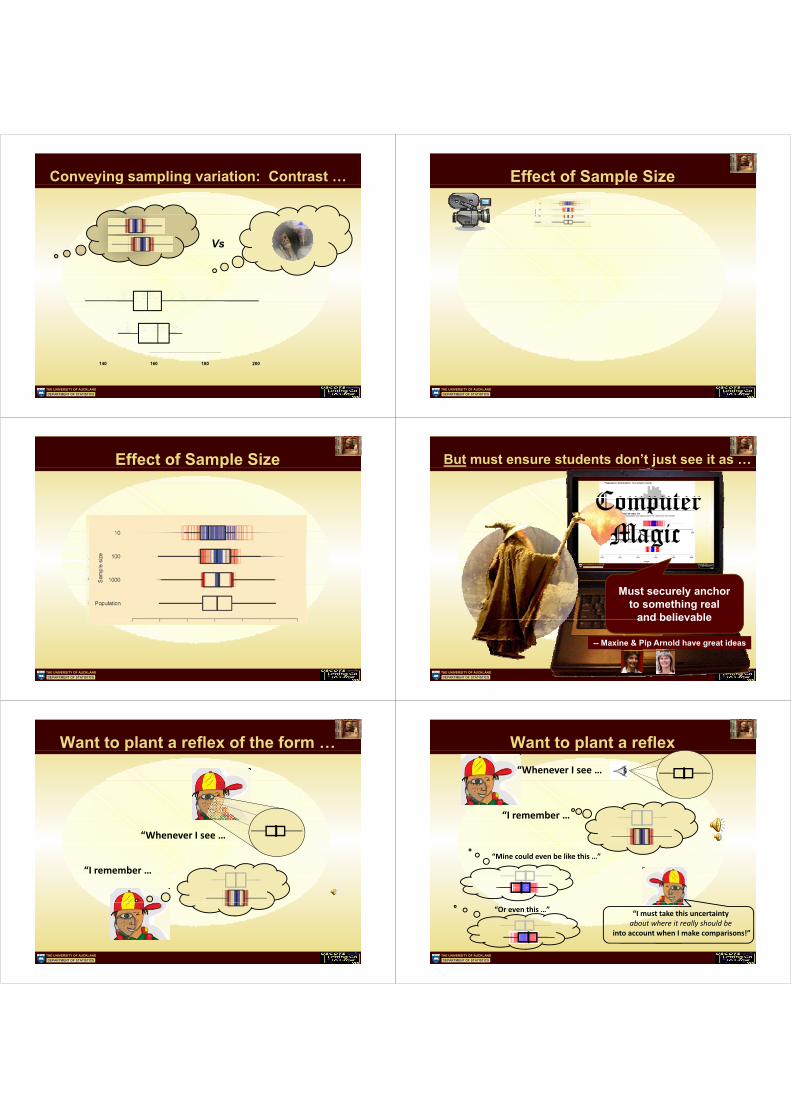
Conveying sampling variation: Contrast …y g g
VsVs
140 160 180 200
THE UNIVERSITY OF AUCKLANDDEPARTMENT OF STATISTICS
Effect of Sample Sizep
THE UNIVERSITY OF AUCKLANDDEPARTMENT OF STATISTICS
Effect of Sample Sizep
THE UNIVERSITY OF AUCKLANDDEPARTMENT OF STATISTICS
But must ensure students don’t just see it as …
ComputerComputerM iMagic
Must securely anchorMust securely anchorto something real
and believableand believable
-- Maxine & Pip Arnold have great ideas
THE UNIVERSITY OF AUCKLANDDEPARTMENT OF STATISTICS
Want to plant a reflex of the form …p
“Whenever�I�see�…
“I remember …I�remember�…
THE UNIVERSITY OF AUCKLANDDEPARTMENT OF STATISTICS
Want to plant a reflex“Whenever�I�see�…
p
“ b“I�remember�…
“Mine�could�even�be�like�this�…”
“Or�even�this�…” “I�must�take�this�uncertaintyabout�where�it�really�should�be
into account when I make comparisons!”
THE UNIVERSITY OF AUCKLANDDEPARTMENT OF STATISTICS
into�account�when�I�make�comparisons!
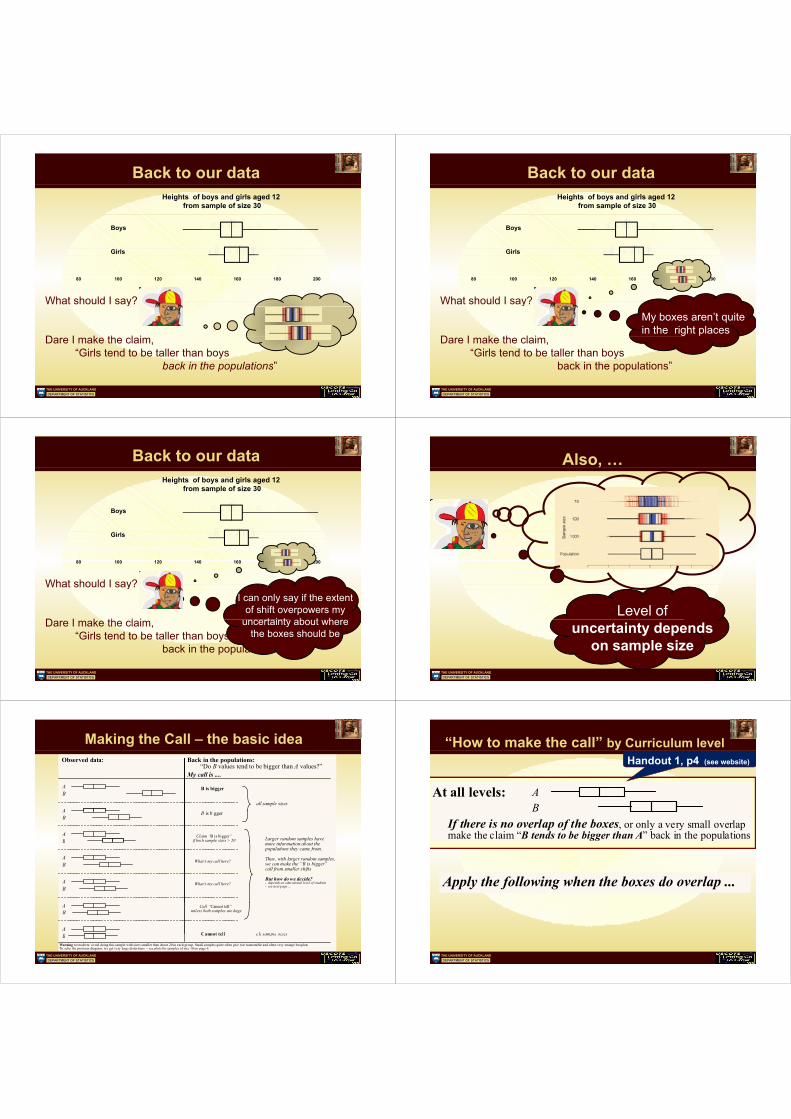
Back to our dataHeights of boys and girls aged 12
from sample of size 30
Boys
Girls
80 100 120 140 160 180 200
What should I say?y
D I k th l iDare I make the claim,“Girls tend to be taller than boys
back in the populations”
THE UNIVERSITY OF AUCKLANDDEPARTMENT OF STATISTICS
back in the populations
Back to our dataHeights of boys and girls aged 12
from sample of size 30
Boys
Girls
80 100 120 140 160 180 200
What should I say?y
D I k th l i
My boxes aren’t quitein the right places
Dare I make the claim,“Girls tend to be taller than boys
back in the populations”
THE UNIVERSITY OF AUCKLANDDEPARTMENT OF STATISTICS
back in the populations
Back to our dataHeights of boys and girls aged 12
from sample of size 30
Boys
Girls
80 100 120 140 160 180 200
What should I say?
D I k th l i
I can only say if the extentof shift overpowers my
uncertainty about whereDare I make the claim,“Girls tend to be taller than boys
back in the populations”
uncertainty about wherethe boxes should be
THE UNIVERSITY OF AUCKLANDDEPARTMENT OF STATISTICS
back in the populations
Also, …,
Level ofuncertainty depends
on sample sizeTHE UNIVERSITY OF AUCKLANDDEPARTMENT OF STATISTICS
p
Making the Call – the basic ideaObserved data: Back in the populations:
“Do B values tend to be bigger than A values?”My call is ....
A
AB
B is bigger
i bi
all sample sizes
AB
AB
B is bigger
Larger random samples havef b h
Claim “B is bigger”if both sample sizes > 20
AB
B more information about thepopulations they came from.
Thus, with larger random samples,we can make the “B is bigger”call from smaller shifts
f p
What’s my call here?
AB
But how do we decide?- depends on educational level of students- see next page ...What’s my call here?
A
AB
Cannot tell all sample sizes
Call “Cannot tell” unless both samples are huge
THE UNIVERSITY OF AUCKLANDDEPARTMENT OF STATISTICS
B Cannot tell all sample sizes
Warning to teachers: avoid doing this sample with sizes smaller than about 20 in each group. Small samples quite often give rise tounstrable and often very strange boxplotsTo echo the previous diagram, we get very large distortions -- see plots for samples of size 10 on page 6
“How to make the call” by Curriculum levelHandout 1, p4 (see website)
At all levels: ABB
If there is no overlap of the boxes, or only a very small overlapmake the claim “B tends to be bigger than A” back in the populations
Apply the following when the boxes do overlap ...
THE UNIVERSITY OF AUCKLANDDEPARTMENT OF STATISTICS
“How to make the call” by Curriculum level
Handout 1, p5 (see website)
Some notes about the rulesAt all levels:E h i th i l k th t tl th l tEmphasize the visual, keep the eyes constantly on the plots
What we are doing here is just one small step in interpreting a comparison� It is definitely not “what the statistics module is all about”
While our depictions are in terms of 2 groups do not hesitate to use more groups� The stories uncovered in data by comparing several groups are often much more interesting
• What we are doing here is just one small step in interpreting a comparison� It is definitely not “what the statistics module is all about”
THE UNIVERSITY OF AUCKLANDDEPARTMENT OF STATISTICS
y
e.g. Handout 2 (see website)
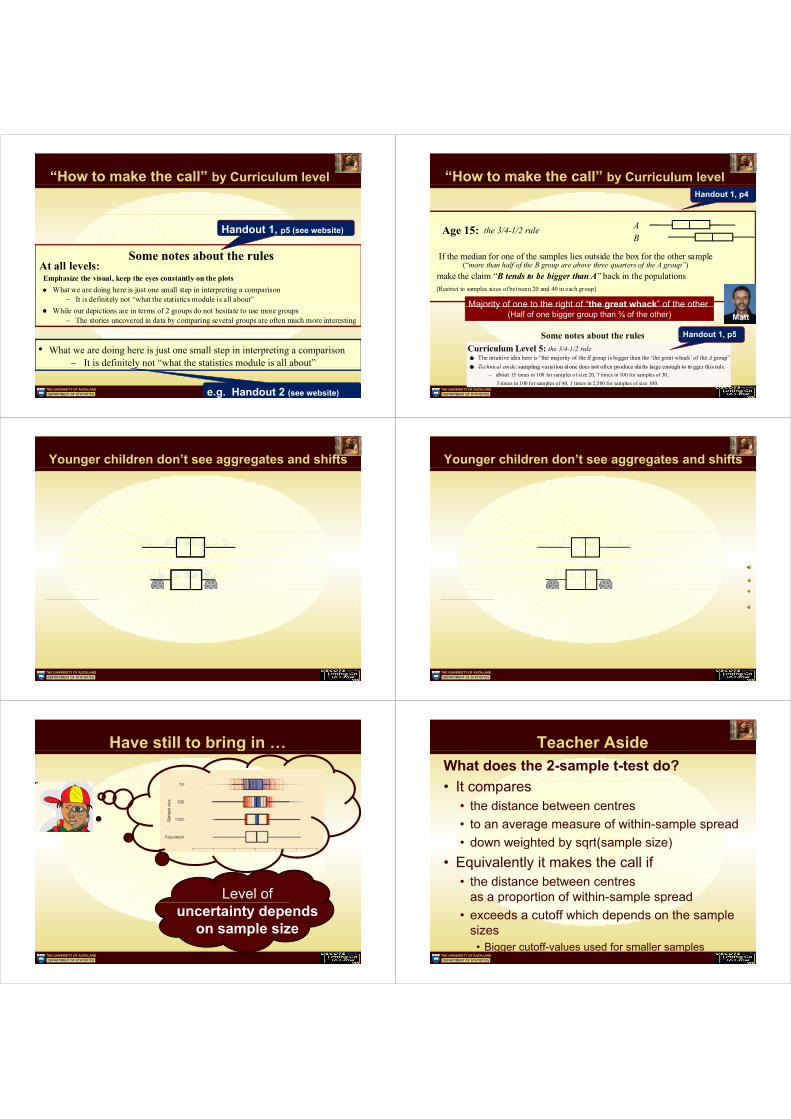
“How to make the call” by Curriculum levelHandout 1, p4
Age 15: the 3/4-1/2 rule AB
If the median for one of the samples lies outside the box for the other sample(“more than half of the B group are above three quarters of the A group”)
make the claim “B tends to be bigger than A” back in the populationsmake the claim B tends to be bigger than A back in the populations[Restrict to samples sizes of between 20 and 40 in each group]
Majority of one to the right of “the great whack” of the other
Some notes about the rules Handout 1, p5
Majority of one to the right of the great whack of the other(Half of one bigger group than ¾ of the other) Matt
Curriculum Level 5: the 3/4-1/2 ruleThe intuitive idea here is “the majority of the B group is bigger than the ‘the great whack’ of the A group”Technical aside: sampling variation alone does not often produce shifts large enough to trigger this rule
Some notes about the rules a dout , p5
THE UNIVERSITY OF AUCKLANDDEPARTMENT OF STATISTICS
Technical aside: sampling variation alone does not often produce shifts large enough to trigger this rule� about 15 times in 100 for samples of size 20, 7 times in 100 for samples of 30, 3 times in 100 for samples of 40, 1 times in 2,500 for samples of size 100.
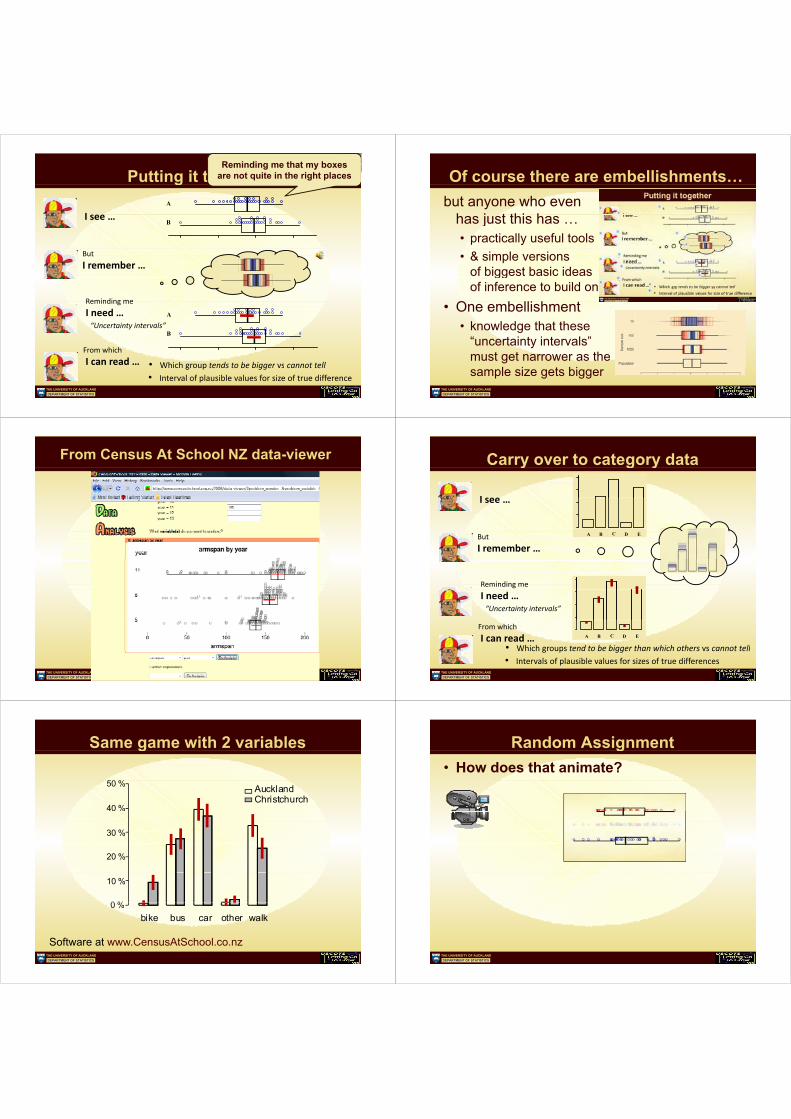
Younger children don’t see aggregates and shifts
THE UNIVERSITY OF AUCKLANDDEPARTMENT OF STATISTICS
Younger children don’t see aggregates and shifts
THE UNIVERSITY OF AUCKLANDDEPARTMENT OF STATISTICS
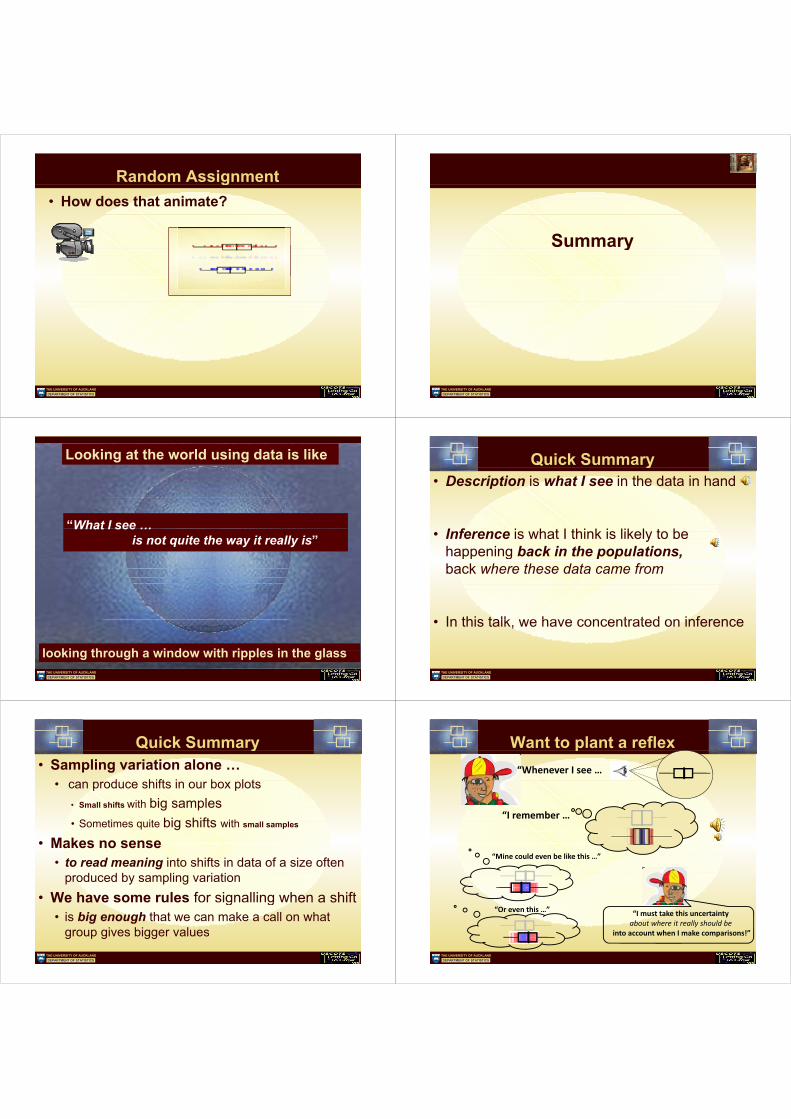
Have still to bring in …g
Level ofuncertainty depends
on sample sizeTHE UNIVERSITY OF AUCKLANDDEPARTMENT OF STATISTICS
p
Teacher AsideWhat does the 2-sample t-test do?• It compares
• the distance between centres• to an average measure of within-sample spread• down weighted by sqrt(sample size)• down weighted by sqrt(sample size)
• Equivalently it makes the call if• the distance between centres
as a proportion of within-sample spreadp p p p• exceeds a cutoff which depends on the sample
sizes
THE UNIVERSITY OF AUCKLANDDEPARTMENT OF STATISTICS
sizes• Bigger cutoff-values used for smaller samples

Techo-aside
• Our rules behave pretty well for normal � 2 and t distributionsnormal, �4
2 and t4 distributions
THE UNIVERSITY OF AUCKLANDDEPARTMENT OF STATISTICS
“How to make the call” by Curriculum levelHandout 1, p. 4
di t b t di ti f “ ll i ibl d”Age 16: distance between medians as proportion of “overall visible spread”
AB
Age 16:
dist. betw. medians
overall visible spread
Make the claim B tends to be bigger than A back in the populationsif distance between medians is greater than about ...
1/3 of overall visible spread for sample sizes of around 30
1/5 of overall visible spread for sample sizes of around 100[Could also use 1/10 of overall visible spread for sample sizes of around 1000]
THE UNIVERSITY OF AUCKLANDDEPARTMENT OF STATISTICS
Stress “eye-ball judgements”See Tech notes on p. 5
Age 17 IntuitiongMedian for my data
I got this
“Where is truthlikely to lie?”
I know this sort ofthing happens Truth is seldom further from
my data median than this
data median than thisData median is seldomPopulation
my data median than this
Truthis seldom further from
further from truth than this(Unseen)
True Median
THE UNIVERSITY OF AUCKLANDDEPARTMENT OF STATISTICS
True Median(“the unseen truth”)
Age 17 IntuitionMedian for my data
I got this
“Where is truthlikely to lie?”
THE UNIVERSITY OF AUCKLANDDEPARTMENT OF STATISTICS
Age 17 Intuition“Where is truth likely to lie?”
I got this Truth is seldom further frommy data median than this
Problem: I don’t actually see width of this “uncertainty” bandWhy?: I only see one frame of sampling variation movie
So: We need some sort of estimate of the width of uncertainty band We know: uncertainty band should be wider for smaller samplese o u ce ta ty ba d s ou d be de o s a e sa p es
Turns out: The following estimate works pretty well
THE UNIVERSITY OF AUCKLANDDEPARTMENT OF STATISTICS
“How to make the call” at Age 17
Curriculum Level 7: based on informal confidence intervals for the population median
D h i l li
Med � 1.5IQR
nMed � 1.5
IQRn
Draw horizontal line
IQR = interquartile range = width of box n = sample size
Make the claim B tends to be bigger than A back in the populationsAB
if these horizontal lines (intervals) do not overlapB
AB
di t l fid li it f diff i l ti didist. = lower confidence limit for difference in population medians
THE UNIVERSITY OF AUCKLANDDEPARTMENT OF STATISTICS
dist. = upper confidence limitfor difference in population medians
Putting it togetherReminding me that my boxes
are not quite in the right places
I see
g gA
I�see�…B
But
I�remember�…
Reminding�me
I�need�… A
B“Uncertainty�intervals”
• Which group tends to be bigger vs cannot tell
From�which�
I�can�read�…���
THE UNIVERSITY OF AUCKLANDDEPARTMENT OF STATISTICS
Which�group�tends�to�be�bigger vs cannot�tell• Interval�of�plausible�values�for�size�of�true�difference
Of course there are embellishments…but anyone who even
h j t thi hhas just this has …• practically useful tools• & simple versions
of biggest basic ideaso b ggest bas c deasof inference to build on
• One embellishment• One embellishment• knowledge that these
“ t i t i t l ”“uncertainty intervals”must get narrower as the
l i t biTHE UNIVERSITY OF AUCKLANDDEPARTMENT OF STATISTICS
sample size gets bigger
From Census At School NZ data-viewer
THE UNIVERSITY OF AUCKLANDDEPARTMENT OF STATISTICS
Carry over to category datay g y
I seeI�see�…
But
I�remember�…
A B C D E
Reminding�me
I�need�…“Uncertainty�intervals”
• Which groups tend to be bigger than which others vs cannot tell
From�which�
I�can�read�…��� A B C D E
THE UNIVERSITY OF AUCKLANDDEPARTMENT OF STATISTICS
Which�groups�tend�to�be�bigger�than�which�others vs cannot�tell• Intervals�of�plausible�values�for�sizes�of�true�differences
Same game with 2 variablesg
50 % AucklandChristchurch
40 %
50 %
30 %
20 %
0 %
10 %
0 %bike bus car other walk
THE UNIVERSITY OF AUCKLANDDEPARTMENT OF STATISTICS
Software at www.CensusAtSchool.co.nz
Random Assignmentg• How does that animate?
THE UNIVERSITY OF AUCKLANDDEPARTMENT OF STATISTICS
Random Assignmentg• How does that animate?
THE UNIVERSITY OF AUCKLANDDEPARTMENT OF STATISTICS
SummarySummary
THE UNIVERSITY OF AUCKLANDDEPARTMENT OF STATISTICS
Looking at the world using data is like
“What I see …What I see …is not quite the way it really is”
looking through a window with ripples in the glassTHE UNIVERSITY OF AUCKLANDDEPARTMENT OF STATISTICS
looking through a window with ripples in the glass
Quick Summaryy• Description is what I see in the data in hand
f• Inference is what I think is likely to be happening back in the populations,pp g p pback where these data came from
• In this talk we have concentrated on inference• In this talk, we have concentrated on inference
THE UNIVERSITY OF AUCKLANDDEPARTMENT OF STATISTICS
Quick Summaryy• Sampling variation alone …
d hift i b l t• can produce shifts in our box plots• Small shifts with big samples• Sometimes quite big shifts with small samples
• Makes no sense• Makes no sense• to read meaning into shifts in data of a size often
produced by sampling variation• We have some rules for signalling when a shiftg g
• is big enough that we can make a call on what group gives bigger values
THE UNIVERSITY OF AUCKLANDDEPARTMENT OF STATISTICS
group gives bigger values
Want to plant a reflex“Whenever�I�see�…
p
“ b“I�remember�…
“Mine�could�even�be�like�this�…”
“Or�even�this�…” “I�must�take�this�uncertaintyabout�where�it�really�should�be
into account when I make comparisons!”
THE UNIVERSITY OF AUCKLANDDEPARTMENT OF STATISTICS
into�account�when�I�make�comparisons!
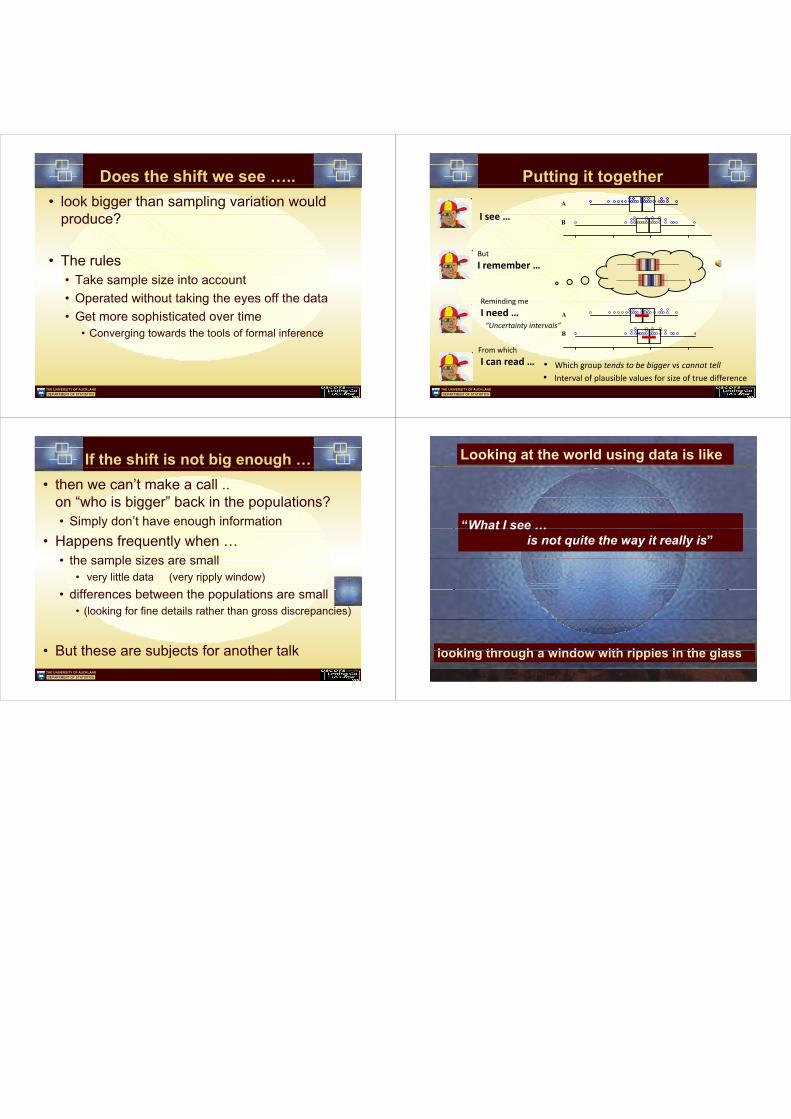
Does the shift we see …..• look bigger than sampling variation would
d ?produce?
• The rulesT k l i i t t• Take sample size into account
• Operated without taking the eyes off the data• Get more sophisticated over time
• Converging towards the tools of formal inferenceg g
THE UNIVERSITY OF AUCKLANDDEPARTMENT OF STATISTICS
Putting it together
I see
g gA
I�see�…B
But
I�remember�…
Reminding�me
I�need�… A
B“Uncertainty�intervals”
• Which group tends to be bigger vs cannot tell
From�which�
I�can�read�…���
THE UNIVERSITY OF AUCKLANDDEPARTMENT OF STATISTICS
Which�group�tends�to�be�bigger vs cannot�tell• Interval�of�plausible�values�for�size�of�true�difference
If the shift is not big enough …g g• then we can’t make a call ..
“ h i bi ” b k i th l ti ?on “who is bigger” back in the populations?• Simply don’t have enough information
• Happens frequently when …• the sample sizes are small• the sample sizes are small
• very little data (very ripply window)diff b h l i ll• differences between the populations are small
• (looking for fine details rather than gross discrepancies)
• But these are subjects for another talkTHE UNIVERSITY OF AUCKLANDDEPARTMENT OF STATISTICS
• But these are subjects for another talk
Looking at the world using data is like
Early Statistical Inferences :
“What I see …What I see …is not quite the way it really is”
Thank you“The Eyes have it”“The Eyes have it”“The Eyes have it”Thank youyyy
looking through a window with ripples in the glassTHE UNIVERSITY OF AUCKLANDDEPARTMENT OF STATISTICS
looking through a window with ripples in the glass
Recommended