Copyright © IJCESEN
International Journal of Computational and
Experimental Science and Engineering
(IJCESEN) Vol. 4-No.1 (2018) pp. 16-23 http://dergipark.gov.tr/ijcesen
ISSN: 2149-9144
Research Article
Dynamic and quantitative Sensitivity analysis on the efficient development of
tight oil
Jie Bai1*, Huiqing Liu1, Jing Wang1,Ling Xie2 and Xueping Li1 1 Department of Petroleum Engineering, China University of Petroleum, Beijing, China
2 Optimization Petroleum Technologies, Inc
* Corresponding Author : [email protected]
ORCID: 0000-0002-5722-8626
(First received 19 December 2017 and in final form 14 March 2018)
Keywords
tight oil
sensitivity analysis
threshold pressure gradient
stress sensitivity
Abstract: The aim of this paper is to present dynamic and quantitative sensitivity
analysis for the tight oil development with horizontal fracturing well. In order to better
show the influence of different parameters on the production index in the development
of tight oil, a set of correlations predict the oil production and effective swept scope are
built correspondingly.
In this paper, 11 parameters are filtered after extensive investigation of typical
characteristics of tight oil in China and America. The parameters include reservoir
characteristics, threshold pressure gradient and stress sensitive effect, fracturing
parameters etc. And then a group of orthogonal schemes were designed and simulated
with the CMG IMEX Simulator. And then each five years’ simulation results, including
cumulative production, oil recovery and effective flow area are analyzed.
The analysis result shows that the initial reservoir pressure and well bottom hole
pressure, which decides whether the energy is sufficient to drive oil flow, is the most
significant factor to influence the tight oil cumulative production. Secondly, reservoir
thickness and porosity influence whether the reservoir oil is rich. However, for the oil
recovery, the contribution of fracturing is more essential, which directly determines
whether it has industrial oil production. In addition, threshold pressure gradient and
stress sensitivity, the distinct seepage characteristics between tight oil and traditional
reservoirs, will further exacerbate the ultra-low permeability and seepage process. The
most immediate effect of the non-Darcy rffect is that the swept scope range becomes
smaller. In addition, a series mathematical model are also established for the
development effect estimation through the use of multivariate regression, Through data
validation, the quantitative model error ranges 5.45% from 9.29%.
1. Introduction With the stimulated fractured measure, tight
formation develops different media, resulting in
complex seepage[1,2,4,9,10,13]. Many factors affect
oil production , and it’s hard to predict and evaluate
the tight oil production. In this paper, considering the
characteristics of tight oil reservoirs (fracturing
parameters[1,2,9,10,11,13], threshold pressure
gradient[3,12] and stress sensitive effect[6,8,13],) a
larger number of orthogonal experiment is carried on
by simulating with CMG IMEX [5]. SPSS software
[7] has also been used to study the sensitivity of well
production and effective flow area of tight oil
horizontal well. In addition, based on the sensitivity
result, we established a set of reliable prediction
models for oil production and effective flow area.
These models are helpful for predicting the
productivity of single well and the effective flow
area, and then it can guide the optimization of
horizontal well fracturing scheme and well pattern
under different reservoir conditions.
2.Parameter selection and research method
Tight oil reservoir is difficult to develop due to the
impact of many factors, including geological
parameters, fracturing methods, non-darcy factors
and well parameters.
Jie Bai, Huiqing Liu, Jing Wang,Ling Xie and Xueping Li/ IJCESEN 4-1(2018)16-23
17
2.1 Parameters selection (1) Reservoir characteristic
The permeability of the tight oil reservoir is usually
less than 0.10mD and the porosity is less than 10%.
The pore throat size reaches the micron and Nano
levels. This basic permeability characteristic
restricts the fluid flow of the reservoir. Despite the
application of fracturing measures bring up effective
industry production, the matrix permeability and
porosity still occupy a large area in the fractured
tight oil. (Km, φ)
In addition, due to tectonic action, diagenesis, burial
depth and other effects, reservoir pressure and
reservoir effective thickness are also very imparity
(Pr, H)
For the different hydrocarbon source environment,
the same as the tight reservoir, the fluid viscosity is
also a key factor with big diversity.
(2) Fracturing parameters
The development of tight oil is mainly dependent on
stimulated reservoir measure with large area, it
supplies the effective technical support for tight
reservoir. In specific, the length and fracturing space
during the fracturing process have a very important
effect on the tight oil production. Moreover, the
choice of different proppant also resulted in a wide
difference in fracture permeability. These fracturing
parameters play an important role in the early high
production of tight oil. (Kf, nf, Hf).
(3) Non-Darcy factor
Through the field practice and the laboratory pilot
study, it is found that the fluid seepage in the tight oil
does not conform to the regular Darcy seepage law.
On the one hand, due to the tight structure of the
reservoir and the development of different degrees
of micro-cracks, there is a certain degree of stress-
sensitive effect - that is, with the increase in
confining pressure, tight porosity and the
permeability will decrease. Moreover, the different
scale of the seepage media will occur in varying
degrees of shrinkage deformation, including
artificial fractures in the proppant compression will
lead to fracture shrink or even closed. The stress
sensitivity[5,16] of the permeability is defined as
follows
( )
0ep p
k k e
(1)
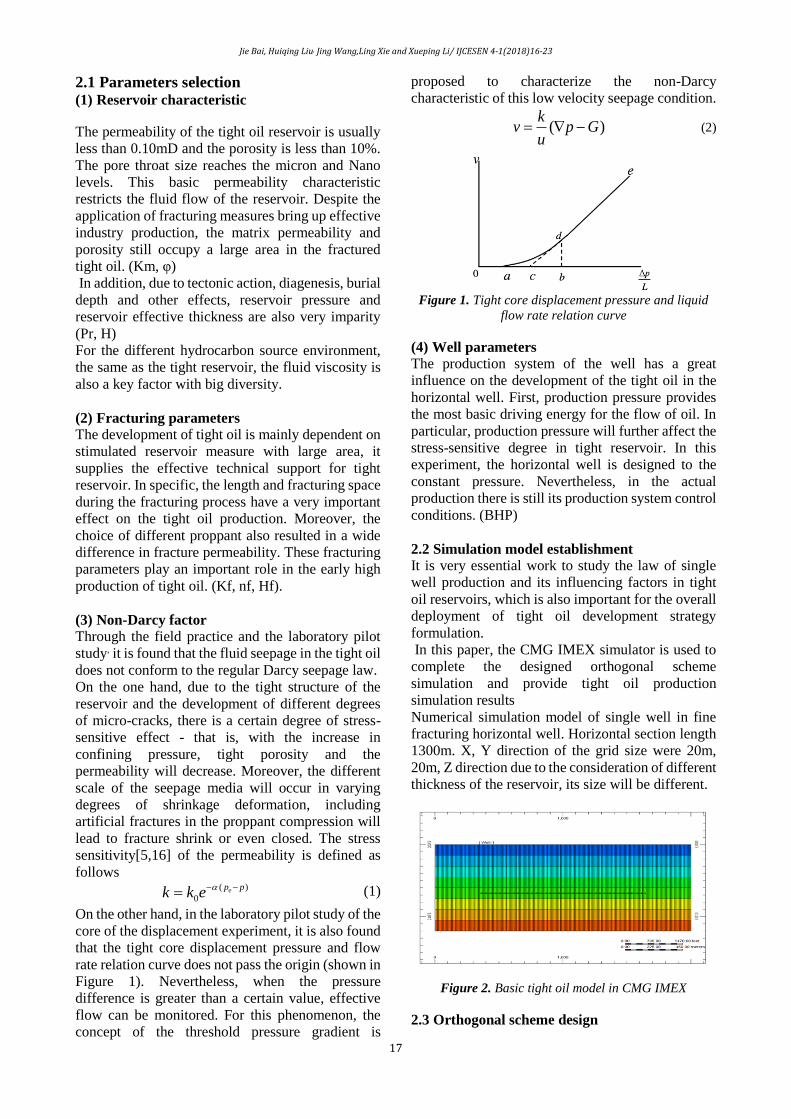
On the other hand, in the laboratory pilot study of the
core of the displacement experiment, it is also found
that the tight core displacement pressure and flow
rate relation curve does not pass the origin (shown in
Figure 1). Nevertheless, when the pressure
difference is greater than a certain value, effective
flow can be monitored. For this phenomenon, the
concept of the threshold pressure gradient is
proposed to characterize the non-Darcy
characteristic of this low velocity seepage condition.
( )
kv p G
u
(2)
Figure 1. Tight core displacement pressure and liquid
flow rate relation curve
(4) Well parameters
The production system of the well has a great
influence on the development of the tight oil in the
horizontal well. First, production pressure provides
the most basic driving energy for the flow of oil. In
particular, production pressure will further affect the
stress-sensitive degree in tight reservoir. In this
experiment, the horizontal well is designed to the
constant pressure. Nevertheless, in the actual
production there is still its production system control
conditions. (BHP)
2.2 Simulation model establishment
It is very essential work to study the law of single
well production and its influencing factors in tight
oil reservoirs, which is also important for the overall
deployment of tight oil development strategy
formulation.
In this paper, the CMG IMEX simulator is used to
complete the designed orthogonal scheme
simulation and provide tight oil production
simulation results
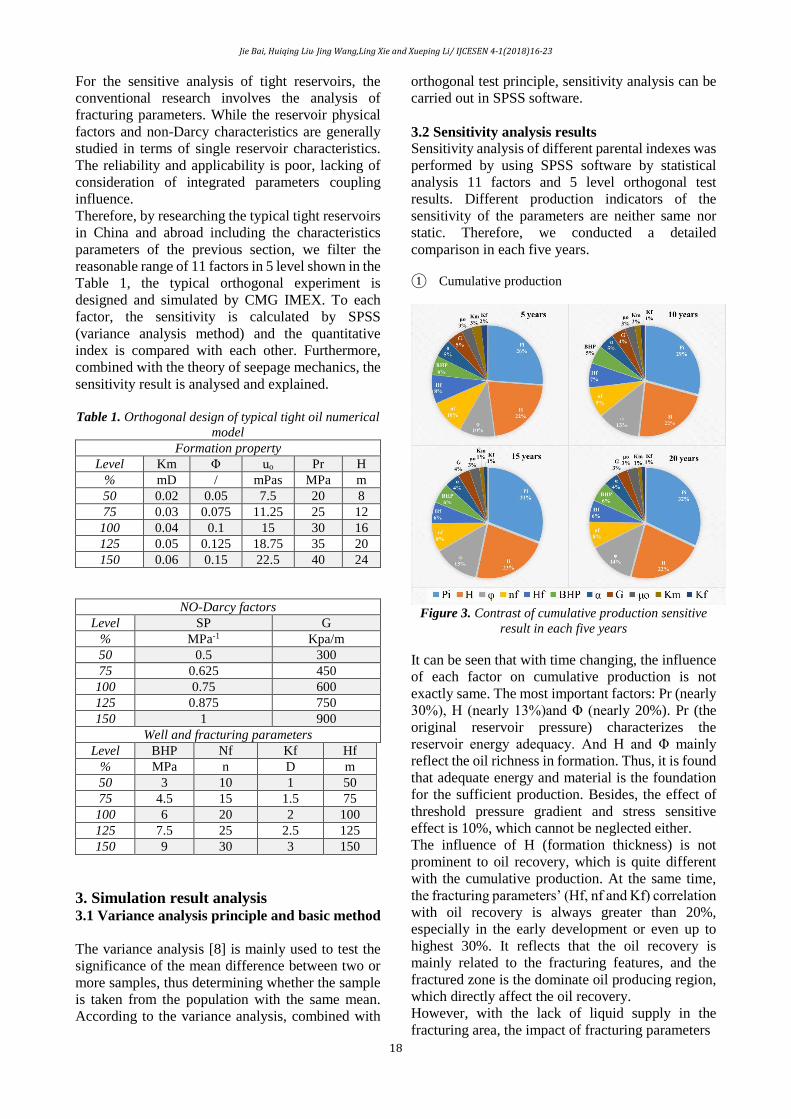
Numerical simulation model of single well in fine
fracturing horizontal well. Horizontal section length
1300m. X, Y direction of the grid size were 20m,
20m, Z direction due to the consideration of different
thickness of the reservoir, its size will be different.
Figure 2. Basic tight oil model in CMG IMEX
2.3 Orthogonal scheme design
Jie Bai, Huiqing Liu, Jing Wang,Ling Xie and Xueping Li/ IJCESEN 4-1(2018)16-23
18
For the sensitive analysis of tight reservoirs, the
conventional research involves the analysis of
fracturing parameters. While the reservoir physical
factors and non-Darcy characteristics are generally
studied in terms of single reservoir characteristics.
The reliability and applicability is poor, lacking of
consideration of integrated parameters coupling
influence.
Therefore, by researching the typical tight reservoirs
in China and abroad including the characteristics
parameters of the previous section, we filter the
reasonable range of 11 factors in 5 level shown in the
Table 1, the typical orthogonal experiment is
designed and simulated by CMG IMEX. To each
factor, the sensitivity is calculated by SPSS
(variance analysis method) and the quantitative
index is compared with each other. Furthermore,
combined with the theory of seepage mechanics, the
sensitivity result is analysed and explained.
Table 1. Orthogonal design of typical tight oil numerical
model
Formation property
Level Km Φ uo Pr H
% mD / mPas MPa m
50 0.02 0.05 7.5 20 8
75 0.03 0.075 11.25 25 12
100 0.04 0.1 15 30 16
125 0.05 0.125 18.75 35 20
150 0.06 0.15 22.5 40 24
NO-Darcy factors
Level SP G
% MPa-1 Kpa/m
50 0.5 300
75 0.625 450
100 0.75 600
125 0.875 750
150 1 900
Well and fracturing parameters
Level BHP Nf Kf Hf
% MPa n D m
50 3 10 1 50
75 4.5 15 1.5 75
100 6 20 2 100
125 7.5 25 2.5 125
150 9 30 3 150
3. Simulation result analysis 3.1 Variance analysis principle and basic method
The variance analysis [8] is mainly used to test the
significance of the mean difference between two or
more samples, thus determining whether the sample
is taken from the population with the same mean.
According to the variance analysis, combined with
orthogonal test principle, sensitivity analysis can be
carried out in SPSS software.
3.2 Sensitivity analysis results
Sensitivity analysis of different parental indexes was
performed by using SPSS software by statistical
analysis 11 factors and 5 level orthogonal test
results. Different production indicators of the
sensitivity of the parameters are neither same nor
static. Therefore, we conducted a detailed
comparison in each five years.
① Cumulative production
Figure 3. Contrast of cumulative production sensitive
result in each five years
It can be seen that with time changing, the influence
of each factor on cumulative production is not
exactly same. The most important factors: Pr (nearly
30%), H (nearly 13%)and Φ (nearly 20%). Pr (the
original reservoir pressure) characterizes the
reservoir energy adequacy. And H and Φ mainly
reflect the oil richness in formation. Thus, it is found
that adequate energy and material is the foundation
for the sufficient production. Besides, the effect of
threshold pressure gradient and stress sensitive
effect is 10%, which cannot be neglected either.
The influence of H (formation thickness) is not
prominent to oil recovery, which is quite different
with the cumulative production. At the same time,
the fracturing parameters’ (Hf, nf and Kf) correlation
with oil recovery is always greater than 20%,
especially in the early development or even up to
highest 30%. It reflects that the oil recovery is
mainly related to the fracturing features, and the
fractured zone is the dominate oil producing region,
which directly affect the oil recovery.
However, with the lack of liquid supply in the
fracturing area, the impact of fracturing parameters

Jie Bai, Huiqing Liu, Jing Wang,Ling Xie and Xueping Li/ IJCESEN 4-1(2018)16-23
19
② Oil recovery
Figure 4. Contrast of oil recovery sensitive result in
each five years
on the oil recovery has been reduced in the later stage
of development. Φ accounts for about 10%
proportion,and Pr (initial formation pressure) for
about 5%, reflecting negligible significance of oil
abundance and formation energy for oil flow. And
for the late stage, a reasonable change in oil supply
zone occur from fracturing area to the matrix area.
Under the influence of ultra-low permeability and
threshold pressure gradient, the flow of oil in the
matrix is demanding for the higher pressure gradient,
that is why the effect of pressure becomes more
pronounced during the later stage.
③ Effective flow area
Figure 5. Contrast of Effective flow area sensitive result
in each five years
The influence of each parameter on effective flow
area changes significantly over time, especially the
impact of fracture spacing and length (Hf and nf)
from 80% gradually reduced to 32%.
In the early stages of development, the flow occurred
mainly in the fracturing area, which result in the
excellent relevance with the effective flow area. But
the effective flow area gradually expands to the close
matrix between the artificial fracture, and then
toward the outer matrix zone. To be specific When
the flow in the close matrix between the artificial
fracture dominates, the effect of the fracture spacing
(equivalent to the fracture number) gradually
increasing from 4% to 14%. And in the same time,
the correlation between flow area and the facture
half length is bound to sharply reduce from 77% to
23%. In the end, when the oil outer matrix zone flow
dominates, the effect of the fracture half length
decease further to 15%, but the influence of fracture
number changes a little. Besides, the impact of
fracture permeability (Kf) is not significant still
below 5%.
The threshold pressure gradient (G)and stress
sensitivity(SP) also showed a limited effect in the
early stage, but a greater effect in the later stage. In
the early stage, effective flow area is small, stress-
sensitive effects are limited in this area. In the same
time, the pressure gradient is large enough, and it is
easy to overcome the threshold pressure gradient.
Their influence is not conspicuous with 6%
proportion (shown in Fig.5).
But later, the expansion of the effective flow area
will cause the pressure gradient to decrease,
overcoming the threshold pressure gradient becomes
more difficult. And the stress-sensitive’s influence
proportion reached 24%, resulting in permeability
deterioration in a wide area.
The effective flow distance along well direction has
a great relationship with the length of the horizontal
well. In the whole 20 years’ production life, the
influence of the parameters changed not much,
among which stress sensitivity (SP), oil viscosity
(μo), matrix permeability (Kmd) and porosity (Φ)
are the main factors. According to the pressure
transmitting coefficient(η) definition, the oil
viscosity (μo), matrix permeability (Kmd) and
porosity (Φ) is included in pressure transmitting
coefficient(η).The stress-sensitive effect on
weakening permeability also directly affects the
pressure transmitting coefficient(η).
=t
k
C
(3)

Jie Bai, Huiqing Liu, Jing Wang,Ling Xie and Xueping Li/ IJCESEN 4-1(2018)16-23
20
④ Effective flow distance along well direction
Figure 6. Contrast of effective flow distance along well
direction sensitive result in each five years
⑤ Effective flow distance along fracture direction
Figure 7. Contrast of effective flow distance along
fracture direction sensitive result in each five years
Different from the flow along well direction, the
fracture length plays the greatest role for the
transmitting along well direction, seen from the
Fig7. And its influence weight aggrandizes from the
original 80% to 21%. The fracture number
proportion increases from 4% to 17%, and the
threshold pressure gradient part changed from 3% to
18%. Stress-sensitive effects and initial pressure also
increase to some extent.
3.3 Sensitivity analysis of seepage mechanics
theory
In previous section, SPSS analysis software was
used to evaluate the 11 factors’ influence on the
effective development in tight oil with horizontal
fracturing well. According to the fracturing theory of
fractured horizontal well rationality analysis. Due to
the presence of multiple seepage zones in fractured
reservoir, the impact of each factor is neither same
nor static. In this section, the seepage process of
different regions is analyzed by combining the
results of sensitivity analysis.
Figure 8. Fracturing horizontal well seepage process
a) Fracture - wellbore seepage stage
In the early stages, the oil in the high permeability
induced fractures takes precedence to flow into the
artificial main fracture, and then into the wellbore.
At this stage, the effect of fracturing parameters is
obvious. And the reservoir pressure is sufficient,
short-term high production can be monitored.
b) Matrix - fracture seepage stage
Driven by sufficient pressure, the fluid in the matrix
near the fracture and well begins to flow and Matrix
between fracture contact with the fracture
extensively, the oil of this zone is more likely to flow
into the fracture, then through the fracture to the
wellbore. Thus, at this stage, the fracture spacing has
a greater effect on the effective flow area. And with
the pressure transmission, the pressure gradient
decreases in the whole reservoir, the influence of
threshold pressure gradient and stress sensitive to the
pressure transmission gradually emerging. Stress
sensitivity decrease the effective permeability, and
the threshold pressure gradient leads to difficulty of
further pressure transmission. But the flow of fluid
in the matrix region is still limited by the ultra-low
permeability, and their contribution is not enough to
maintain high and stable production.
c) Matrix - matrix seepage stage
In the later stage, the oil flows into the near-well area
from the far-well area. The flow of the fluid is low-
velocity influenced by the poor permeability and
non-Darcy effect (threshold pressure gradient and
stress sensitivity). Specifically, the oil in the matrix
area can effectively flow and generate pressure
transmission, but their contribution to the production
is still small. For the actual fracturing well in field,
in the late matrix liquid supply stage, oil production
can only be maintained at 3-4 m3/D or even lower.
The effect of pressure-sensitive and threshold
pressure gradients is still far greater on the low area
than on production.

Jie Bai, Huiqing Liu, Jing Wang,Ling Xie and Xueping Li/ IJCESEN 4-1(2018)16-23
21
3.4 Establishment of multiple regression equation
for horizontal fracturing well in tight oil reservoir
In order to promote the practicability of the analysis
results, the 20-year development effect indicators
such as cumulative production, oil recovery and
effective flow area etc. were selected to perform
multivariate parameter regression [2,17,18]. Through
mathematical modeling, a set of empirical formula is
modeled to guide the evaluation of the development
in tight oil with fracturing horizontal well.
Based on the sensitivity and positive and negative
correlation of the 11 parameters screened in the
Section 1, the basic exponential equation is used as
the basic idea of regression.
The basic structure of the formula is shown in the
Figure8. For the weight ratio of each factor, the
positive and negative correlation is reflected by the
exponential. Considering the theory of seepage
mechanics, the relevant parameters are combined,
such as the combination of permeability and
viscosity (o oil mobility ), and the formation
pressure and bottom hole pressure combination (
P drawdown pressure ).
( ) ( )
( , , ...)
a e c
g f
AE C D
Bf A B CG F
(4)
Similarly, the production formula for different
production times can be obtained as well.
The effective flow area is the most important
parameter in the tight reservoir. Only by determining
the effective area of the single horizontal well can
the fracturing parameters be reasonably designed. In
addition, the scheme of the well pattern also needs to
be made on the basis of the effective flow range.
(1) Quantitative prediction model of effective flow
area
0.55 0.12 0.28 0.4 0.4
f f f
0.42 0.33 0.1
0.35
0.35
m
o
sp K n L p
Gx
h
K
( ) (5)
Figure 9. Effective flow area fitting curve
0.12 0.28 0.40.550.4f f f
0.42 0.33 0
0.35
D .185.64 m
o
K K n Lspp
G hA
(6) It can be seen that the main influencing factors are
the mobility, reservoir pressure, fracture half-length
and start pressure gradient.
(2) Quantitative prediction model of effective flow
distance along well direction
0.9 0.07 0.5
f
0.05 0.48 0.0 3
5
.5 0
0.
m
o
sp n
Gx
pK
h
(7)
In the scheme of the well pattern, it is necessary to
carry out the design of the vector well pattern in
consideration of the geological reality of the tight
reservoir. In particular, the key parameters are the
well spacing and row distance.
Figure 10. Effective flow distance along well direction
fitting curve
0.070.90.15f
0.05 0.48 0.03
0.5
1600.8 1300m
o
nKx
hp
sp
G
(8) It can be seen that the main influencing factors in the
direction of the shaft axis are mobility, porosity and
formation pressure.
(3) Quantitative prediction model of effective flow
distance along fracture direction 0.8 0.25 0.55 0.8 0.75 0.88 0.5 0.25
f f
0.5 0
f
.5/ ( )m ox K sp K n L p G h
(9)
Figure 11. Effective flow distance along fracture
direction fitting curve
y = 85.64x
R² = 0.928
0
30
60
90
120
150
0 0.2 0.4 0.6 0.8 1 1.2 1.4 1.6
x=Km0.35
(Pr-Pwf)0.4
sp0.55
nf0.28
hf0.4
kf0.12
/(G0.42
H0.1ϕ
0.33μo
0.35)
波及
面积
(y)
,10
4 m2
Eff
ect
ive
flo
w a
rea
/m2
92.80%
y = 1600.8x + 1300
R² = 0.9137
1000
1200
1400
1600
1800
2000
2200
0 0.05 0.1 0.15 0.2 0.25 0.3 0.35 0.4 0.45 0.5
x=Km0.5
(Pr-Pwf)0.15
sp0.9
nf0.07
/(μo0.5
G0.05
ϕ0.48
H0.03
)
井轴
方向
动用
范围
(y)
,m
Eff
ect
ive
flo
w d
ista
nce
alo
ng w
ell
dir
ect
ion
/%91.37%
y = 250.14x + 184.77R² = 0.9171
0
100
200
300
400
500
600
700
0 0.25 0.5 0.75 1 1.25 1.5 1.75 2
x=Km0.5
Kf0.25
hf0.8
(Pr-Pwf)0.75
sp0.8
nf0.55
/(μo0.5
G0.88
ϕ0.5
H0.25
)
沿裂
缝方
向动
用范
围(
y),
mE
ffect
ive
flo
w d
ista
nce
alo
ng
fract
ure
dir
ect
ion
/% 91.71%

Jie Bai, Huiqing Liu, Jing Wang,Ling Xie and Xueping Li/ IJCESEN 4-1(2018)16-23
22
0.25 0.55 0.80.80.75f f f
0.88
0
0.5
.5
0.25250.14 184.77m
o
K n Ls
h
KY
pp
G
(10) It can be seen that the main influencing factors in the
direction of the fracture are the half-length of the
fracture, the formation pressure, the threshold
pressure gradient, the mobility and the porosity.
(4) Quantitative prediction model of cumulative oil
production
From the previous part sensitivity analysis, it can be
learned that the cumulative production and oil
recovery have quite difference from the effective
flow indicator. From the multiple regression, we also
verify the rationality of the sensitivity difference
based on the index of the parameters.
0.23 0.05 0.35 0.4 1.35
f f f
0.27 0.65 0.
0.23
0 39 .20.152
m
o
sp K n L p
G h
Kx
(11)
Figure 12. Cumulative oil production fitting curve
0.05 0.35 0.40.231.35f f f
0.27 0.65 0.9
0.23
o0.152
m
o
K n Lspp
G h
KV
(12)
It can be seen that the main influencing factors of accumulated oil are formation pressure, reservoir thic kness, porosity , and half -length of fractures.
(5) Quantitative predict ion model of o il recovery model
0.06 0.32 0.55 0.4 1.3
f f f
0.
0.14
25 0.3 0.170.14120.5
m
o
K n L s
G
K ppx
h
(13)
Figure 13. Oil recovery fitting curve
0.06 0.32 0.550.41.3f f f
0.25 0.
0.14
3 0.17120.5
mR
o
K n LKE p
sp
G h
(14)
It can be seen that the main influencing factors of oil
recovery are formation pressure, half-length of
fracture, porosity and start pressure gradient.
Comparing the sensitivity ranking of each parameter
in the previous section and the exponential index of
the parameters in the regression model, better
consistency can be observed.
4. Conclusion In this paper, we analyzed the sensitivity of single
well production in tight oil and stablished a set of
reliable prediction models for oil production and
effective flow area. The conclusions are as follows:
1. There are many influential factors in the
development of tight reservoirs, which are mainly
affected by the physical properties of tight
reservoirs, fracturing parameters and non-Darcy
factors. The relationship between the three is that the
poor fluidity of the tight reservoir is the root cause
of the fracturing, and the Darcy factor has a
significant effect. on the flow after fracturing, and is
reflected in the degree of development and the range
2. Due to the fracture and matrix reservoirs, there are
different seepage stages with typical differences
throughout the whole development period. In the
early stage, the fracture are the most important
factors, and in the later stages, the influence of the
reservoir property and the non-Darcy factor becomes
more significant.
3. For different development indicators (cumulative
production, recovery, effective flow area), the
weight of each factor will change. It is embodied that
the most important factor for the effect of mulching
is the reservoir physical parameters, which are
mainly the formation pressure and viscosity, and the
most important influence parameter is the fracturing
parameters for the effective use range.
4. The impact of non-Darcy factor on the efficient
development of tight oil from the early 20% to 35%
of the late, which accounted for a large proportion of
the early to start the main pressure gradient effect,
and the corresponding impact of late pressure
Further enhanced.
5. Based on the results of sensitivity analysis, a set
of mathematic models for the prediction of
accumulated oil, oil recovery and effective use of the
range is established. The fitting degree of each
model is more than 91%, which is very important for
the prediction of tight oil Production capacity and
single well control area, and then developed for
different reservoirs under the conditions of
horizontal well fracturing program optimization and
improvement, as well as the layout and optimization
of horizontal well pattern has a guiding role.
y = 65.80x
R² = 0.9455
0
10000
20000
30000
40000
50000
60000
0 100 200 300 400 500 600 700 800 900
x=Km0.05
Kf0.05
ϕ0.65
(Pr-Pwf)1.35
sp0.23
H0.9
nf0.35
hf0.4
/(G0.27
μo0.23
)
累产
油(
y),
tC
um
ula
tiv
e o
il/m
3 94.55%
y = 0.0083x
R² = 0.9454
0
1
2
3
4
5
6
0 100 200 300 400 500 600 700
x=Kw0.14
(Pr-Pwf)1.3
sp0.4
hf0.32
kf0.06
hf0.55
/(ϕ0.3
H0.17
G0.25
μo0.14
)
采收
率(
y),
%O
il r
eco
ve
ry/% 94.54%

Jie Bai, Huiqing Liu, Jing Wang,Ling Xie and Xueping Li/ IJCESEN 4-1(2018)16-23
23
Acknowledgement This paper presented in”4rd International Conference
on Computational and Experimental Science and
Engineering (ICCESEN-2017)”
And this study was supported by National Program
on Key Basic Research Project (No.
2015CB250906) and Innovation Fund of CNPC
(No. 2015D-5006-0204) in China.
References
[1]. Bai, B., Salehi, S., Nygaard, R., & Aladasani, A.
(2014, February 25). Optimizing the Development
of Tight Oil Formations. Society of Petroleum
Engineers.SPE-167742-MS.
http://dx.doi.org/10.2118/167742-MS
[2]. Baig, M. T., Alnuaim, S., & Rammay, M. H. (2015,
June 4). Productivity Increase Estimation for Multi
Stage Fracturing in Horizontal Wells for Tight Oil
Reservoirs. Society of Petroleum Engineers. SPE-
178030-MS. http://dx.doi.org/10.2118/178030-MS
[3]. Baoquan, Z., Linsong, C., & Fei, H. (2010, January
1). Experiment and Mechanism Analysis on
Threshold Pressure Gradient with Different Fluids.
Society of Petroleum Engineers. SPE-140678-MS.
http://dx.doi.org/10.2118/140678-MS
[4]. Chen, H.-Y., & Teufel, L. W. (2001, January 1).
Understanding the Effects of Reservoir and
Operating Parameters on Tight-Gas Production
Decline. Society of Petroleum Engineers. SPE-
71066-MS. http://dx.doi.org/10.2118/71066-MS
[5]. CMG. IMEX User’s Guide, Computer Modeling
Group Ltd, 2012.
[6]. Cui, Q., & Abass, H.H. (2016, May 5). Experimental
Study of Permeability Decline in Tight Formations
During Long-Term Depletion. Society of Petroleum
Engineers.SPE-180257-MS.
http://dx.doi.org/10.2118/180257-MS
[7]. Experimental design and Design-Expert, SPSS
applications.
[8]. Lei, Q., Xiong, W., Yuang, J., Cui, Y., & Wu, Y.-S.
(2007, January 1). Analysis of Stress Sensitivity and
Its Influence on Oil Production From Tight
Reservoirs. Society of Petroleum Engineers. SPE-
111148-MS. http://dx.doi.org/10.2118/111148-MS
[9]. Li, X., Wei, H., Chen, B., Liu, X., Wang, W., &
Zhao, X. (2008, January 1). Multi-Stage Fracturing
Stimulations Improve Well Performance in Tight Oil
Reservoirs of the Chang qing Oilfield. International
Petroleum Technology Conference. IPTC-12303-
MS. http://dx.doi.org/10.2523/IPTC-12303-MS
[10]. Lin, M., Chen, S., Ding, W., Chen, Z. (John), & Xu,
J. (2015, May 1). Effect of Fracture Geometry on
Well Production in Hydraulic-Fractured Tight Oil
Reservoirs. Society of Petroleum Engineers. SPE-
167761-PA. http://dx.doi.org/10.2118/167761-PA
[11]. Roussel, N. P., & Sharma, M. M. (2010, January 1).
Optimizing Fracture Spacing and Sequencing in
Horizontal Well Fracturing. Society of Petroleum
Engineers.SPE-127986-MS.
http://dx.doi.org/10.2118/127986-MS
[12]. Thomas, L. K., Katz, D. L., & Tek, M. R. (1968, June
1). Threshold Pressure Phenomena in Porous Media.
Society of Petroleum Engineers. SPE-1816-PA.
http://dx.doi.org/10.2118/1816-PA
[13]. Wei, Y., et al., Determination of dynamic reserves
of fractured-horizontal wells in tight oil reservoirs
by multi-region material balance method. Petroleum
Exploration & Development, 2016.
http://dx.doi.org/10.1016/S1876-3804(16)30057-X
Recommended