DURABILITY OF CARBON FIBER REINFORCED POLYMER (CFRP)
STRENGTHENING SYSTEMS USED TO REPAIR CORROSION DAMAGE IN REINFORCED CONCRETE
By
MARKUS PETER KUTARBA
A THESIS PRESENTED TO THE GRADUATE SCHOOL OF THE UNIVERSITY OF FLORIDA IN PARTIAL FULFILLMENT
OF THE REQUIREMENTS FOR THE DEGREE OF MASTER OF ENGINEERING
UNIVERSITY OF FLORIDA
2004

Copyright 2004
by
Markus Peter Kutarba

ACKNOWLEDGMENTS
Completion of my thesis and the research associated with it would not have been
successful without the help and guidance of a number of individuals. I thank the chair
and members of my committee (Dr. H.R. Hamilton, Dr. John Lybas, and Dr. Andrew J.
Boyd) for their guidance and assistance. The Department of Civil and Coastal
Engineering provided financial support throughout my graduate studies. The National
Science Foundation (NSF) gave financial support to my study. The Fyfe Cooperation
donated all materials. Sarah Witt is gratefully acknowledged for arranging this
contribution.
Others deserving thanks for contributions of resources and knowledge are John
Levar, Jeff Brown, and Chuck Broward; and Mario Paredes Cruz and Mitch Langley
(Florida Department of Transportation, Materials Office).
Lastly, I thank all of my close friends and family. Their enduring support proved to
be of the utmost value.
iii

TABLE OF CONTENTS page ACKNOWLEDGMENTS ................................................................................................. iii
LIST OF TABLES............................................................................................................. vi
LIST OF FIGURES .......................................................................................................... vii
ABSTRACT....................................................................................................................... ix
CHAPTER 1 INTRODUCTION ........................................................................................................1
Background...................................................................................................................1 Objective of Study ........................................................................................................2
2 LITERATURE REVIEW .............................................................................................4
3 EXPERIMENTAL PROGRAM...................................................................................6
Introduction...................................................................................................................6 Test Specimen Description .....................................................................................6 Initial Corrosion......................................................................................................6 Concrete Repair ......................................................................................................7 Concrete strengthening ...........................................................................................8
Post-Repair Accelerated Corrosion ..............................................................................9 Load Testing .................................................................................................................9
4 TEST RESULTS AND DISCUSSION ......................................................................15
Crack Pattern due to Corrosion...................................................................................15 Repaired Only Specimens.....................................................................................16 Specimens Strengthened by Scheme I and II .......................................................16 Specimens Strengthened by Scheme III ...............................................................16
Corrosion Damage Rating ..........................................................................................17 Category I .............................................................................................................18 Category II ............................................................................................................18 Category III...........................................................................................................18 Category IV ..........................................................................................................18
iv
Structural Behavior.....................................................................................................18 Control Beams ......................................................................................................19 Repaired Beams ....................................................................................................20 Scheme I Specimens .............................................................................................20 Scheme II Specimens............................................................................................21 Scheme III Specimens ..........................................................................................22
5 CONCLUSIONS ........................................................................................................37
LIST OF REFERENCES...................................................................................................39
BIOGRAPHICAL SKETCH .............................................................................................41
v

LIST OF TABLES
Table page 1 Material properties for strengthening system........................................................ 13
2 Test specimen description. .................................................................................... 14
3 Half-cell readings from accelerated corrosion. ..................................................... 35
4 Results load test after initial corrosion. ................................................................. 35
5 Results load test after PR corrosion. ..................................................................... 36
vi

LIST OF FIGURES
Figure page 1 Application of FRP on bridge Girder (Chaffee Rd, Jacksonville) .......................... 3
2 Potential problems with repaired and strengthened reinforced concrete ................ 3
3 Specimen construction details. .............................................................................. 10
4 Ponding area on beam ........................................................................................... 10
5 Beam 7 B-S. .......................................................................................................... 11
6 Beam repair details................................................................................................ 12
7 Repair schemes...................................................................................................... 12
8 Plot of half-cell readings vs. strengthening scheme. ............................................. 13
9 Typical crack pattern after initial accelerated corrosion process. ......................... 24
10 Corrosion induced cracking on beam 6 A-D......................................................... 24
11 Crack pattern on beam 3 A-S. ............................................................................... 24
12 Debonded areas on beam 3 B-D............................................................................ 25
13 Corrosion on beam 4 A-S...................................................................................... 25
14 Pictures taken of category I corrosion-damage. .................................................... 26
15 Pictures taken of category II corrosion-damage.................................................. 276
16 Pictures taken of category III corrosion-damage on control beam. ...................... 27
17 Pictures taken of category IV corrosion-damage on repaired beam. .................... 28
18 Half-cell readings on beams strengthened by scheme III...................................... 29
19 Ring anode corrosion at interface between old concrete and repair material. ...... 29
20 Load-deflection diagram for beam C 2. ................................................................ 30
vii

21 Load-deflection diagram for beams C 2 and 2 B-S............................................... 30
22 Load-deflection diagram for beams C 2, 1 A-S, and 4 A-D. ................................ 30
23 Load-deflection diagram for beams C 1 and 2 A-D.............................................. 31
24 Load-deflection diagram for beams C 2, 5 A-D, and 7 B-S.................................. 31
25 Load-deflection diagram for beams C 2 and 3 B-S............................................... 31
26 Load-deflection diagram for beams C 2 and 7 A-S. ............................................. 32
27 Load-deflection plot for beams C2, 5 B-S and 4 B-D........................................... 32
28 Debonded area on beam 5 B-S. ............................................................................. 32
29 Failure mode for beam 4 B-D at mid-span, view from the north side. ................. 33
30 Load-deflection diagram for beams C 2 and 4 B-S............................................... 33
31 Load-deflection diagram for beams 4 A-S, 5 B-D, and C2................................... 33
32 Load-deflection diagram for beams C2 and 3 B-D. .............................................. 34
33 IR pictures of beam 3 B-D. ................................................................................... 34
viii

Abstract of Thesis Presented to the Graduate School
of the University of Florida in Partial Fulfillment of the Requirements for the Degree of Master of Engineering
DURABILITY OF CARBON FIBER REINFORCED POLYMER (CFRP) STRENGTHENING SYSTEMS USED TO REPAIR CORROSION
DAMAGE IN REINFORCED CONCRETE
By
Markus Peter Kutarba
May 2004
Chair: H.R. Hamilton Major Department: Civil and Coastal Engineering
We studied the use of carbon fiber reinforced polymer (CFRP) systems combined
with concrete repair as a rehabilitation technique for corroded reinforced concrete beams.
Thirty reinforced concrete test specimens were constructed. Twenty-six of them were
subjected to an aggressive environment for 18 weeks. After being corroded, the beams
were repaired and strengthened, with CFRP using three different schemes. A group of
eight beams was load tested after the repair and strengthening process, while the
remaining beams were subjected to an aggressive environment for another 22 weeks.
After the post-repair (PR) corrosion, a second group of eight beams was load tested. The
results were compared to the first group regarding load capacity, stiffness, and degree of
corrosion damage. It was found that the application of CFRP significantly decreases
corrosion activity. The load capacity of PR corroded beams strengthened with CFRP was
about 30% higher than for control beams, and the stiffness was restored to the original
ix

value. Based on the results and observations, a corrosion damage rating system for
reinforced concrete beams was developed.
x

CHAPTER 1 INTRODUCTION
Background
The United States transportation infrastructure continues to age and deteriorate.
Approximately 15% of the nation’s 583,000 bridges are structurally deficient because of
corrosion of steel sections and steel reinforcement. The annual direct cost for corrosion
damage on bridges is estimated at $8.3 billion (Virmani 2002).
Until recently, the most common repair and strengthening methods were
replacement of the damaged element, steel plate bonding, or installation of additional
supports. The introduction of fiber reinforced polymer (FRP) composite systems into
construction is a promising alternative for the rehabilitation of weakened and deficient
concrete members. The advantages of FRP applications over traditional methods include
a high strength-to-weight ratio, ease of material handling and installation, and resistance
to attack in aggressive environments. Examples of current repair methods include
bonded systems in which a plate, saturated fabric, or spray-up system is applied to the
surface of the concrete element. The cured FRP composite provides additional shear
reinforcement, flexural reinforcement, or both to existing beam and slab elements.
shows FRP applied to an existing bridge structure. The bridge girder was
strengthened for flexure and shear using a wet lay-up system.
Figure 1
A large number of experimental studies have demonstrated the effects of moisture,
aggressive environments, fire, UV-light, creep, and fatigue on externally bonded FRP
systems (Karbhari 1996). Results of these studies indicated that bond behavior between
1
2
FRP and concrete is the most critical component. However, few studies have
investigated the long-term performance of FRP systems used as a strengthening material
for corrosion-damaged concrete.
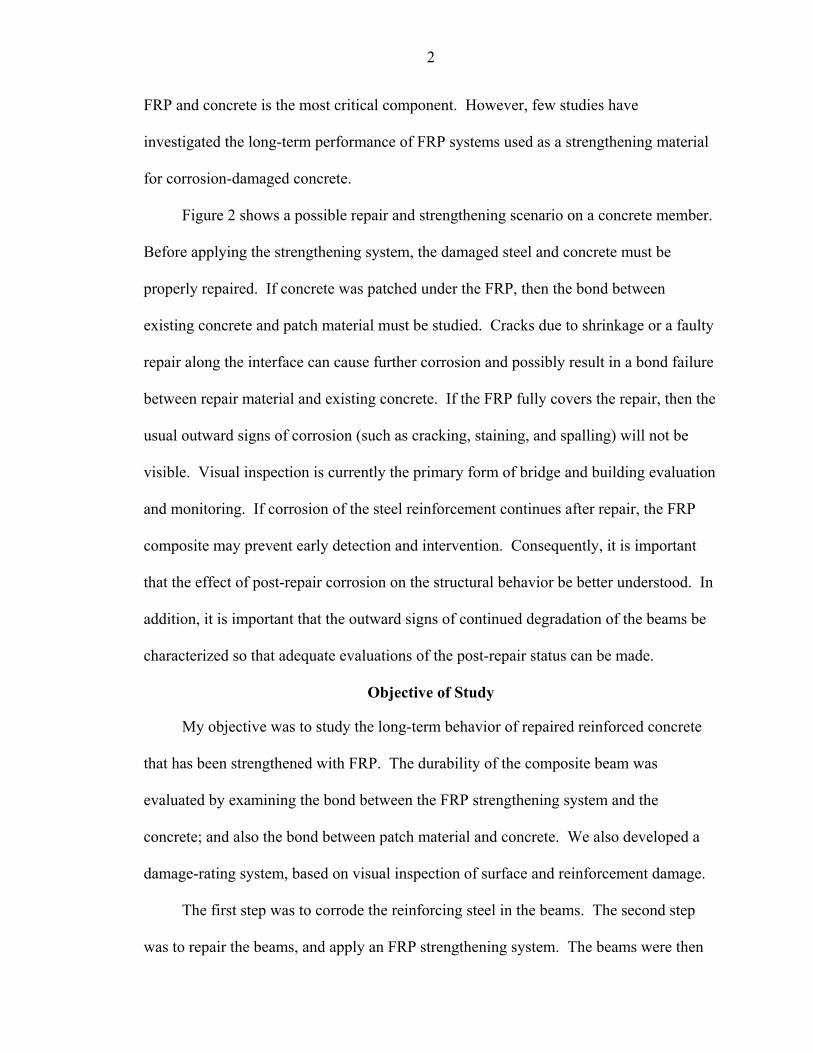
Figure 2 shows a possible repair and strengthening scenario on a concrete member.
Before applying the strengthening system, the damaged steel and concrete must be
properly repaired. If concrete was patched under the FRP, then the bond between
existing concrete and patch material must be studied. Cracks due to shrinkage or a faulty
repair along the interface can cause further corrosion and possibly result in a bond failure
between repair material and existing concrete. If the FRP fully covers the repair, then the
usual outward signs of corrosion (such as cracking, staining, and spalling) will not be
visible. Visual inspection is currently the primary form of bridge and building evaluation
and monitoring. If corrosion of the steel reinforcement continues after repair, the FRP
composite may prevent early detection and intervention. Consequently, it is important
that the effect of post-repair corrosion on the structural behavior be better understood. In
addition, it is important that the outward signs of continued degradation of the beams be
characterized so that adequate evaluations of the post-repair status can be made.
Objective of Study
My objective was to study the long-term behavior of repaired reinforced concrete
that has been strengthened with FRP. The durability of the composite beam was
evaluated by examining the bond between the FRP strengthening system and the
concrete; and also the bond between patch material and concrete. We also developed a
damage-rating system, based on visual inspection of surface and reinforcement damage.
The first step was to corrode the reinforcing steel in the beams. The second step
was to repair the beams, and apply an FRP strengthening system. The beams were then

3
exposed to another corrosion cycle. After a sufficient amount of corrosion has taken
place in the repaired beams, the effects of the corrosion on the repair and strengthening
system can be determined. Results were then used to create the corrosion-damage rating
system.
Figure 1. Application of FRP on bridge girder (Chaffee Rd, Jacksonville).
original concrete
patch debonding FRP system
accumulation of rust
original steel
patch material cracking due
to corrosion
FRP debonding
Figure 2. Potential problems with repaired and strengthened reinforced concrete.
CHAPTER 2 LITERATURE REVIEW
The effect of corrosion on reinforced concrete is well documented. It is known that
concrete provides a high alkaline environment that forms a passive film on the steel
surface, which prevents steel from corroding. Chlorides disrupt this protective layer, and
steel starts to corrode. Expansive forces, which are a result of corrosion, will crack and
spall the surrounding concrete. The consequence is less-protected steel causing
additional corrosion, and a greater loss in steel cross-section (Jones 1996, ACI 1996).
Depending on the degree of damage, a concrete repair in conjunction with strengthening
method (such as bonded FRP composites) can improve the strength and serviceability
(ACI 2001).
FRP composites can be designed to be resistant to the aggressive environments that
attack reinforced concrete, which makes them an attractive material for use in repair and
strengthening of corrosion-damaged structures. While the behavior of the FRP composite
in aggressive environments is well understood, researchers have only recently attempted
to characterize the performance of FRP composites bonded to corrosion
damaged-reinforced concrete. Testing has shown that corrosion-damaged beams
strengthened with an FRP system are stiffer, and have a higher load-carrying capacity
than unstrengthened beams (Bonacci and Maalej 2000, Soudki et al. 2003). It has also
been shown that FRP reduces corrosion rates of reinforcing steel in concrete by
minimizing the diffusion of chlorides (Berver et al. 2001, Soudki, et al. 1999). However,
very little information is available on the durability of repaired corrosion-damaged
4

5
structures. Questions remain concerning the synergistic effects of continued corrosion on
repaired system performance.
This thesis highlights the research findings of a multiphase experimental study
aimed to evaluate the durability and structural behavior of corrosion-damaged beams
repaired and strengthened with FRP.
CHAPTER 3 EXPERIMENTAL PROGRAM
Introduction
Thirty test specimens were fabricated to investigate the long-term behavior of
repaired reinforced concrete beams strengthened with FRP. First, the beams were
subjected to a corrosion process for initial damage. They were then repaired and
strengthened, and exposed to a second corrosion process. At this point, 16 beams were
tested in four-point bending. Eight beams continued to be exposed to an accelerated
corrosion process, and the six remaining beams were reserved for control specimens.
Test Specimen Description
Each rectangular beam was 203 mm x 305 mm (8 in x 12 in) in cross-section and
2900 mm (9 ft-6 in) long. The internal longitudinal steel reinforcement consisted of two
19 mm (#6), 414 MPa (60 ksi) bars at the bottom, and two 9.5 mm (#3), 276 MPa (40
ksi) bars at the top of the beam. The reinforcing steel was extended 76 mm (3 in) beyond
the end of the concrete, for the purpose of making external electrical connections. The
clear concrete cover was 51 mm (2 in) on all aspects of the specimen. Three different
batches of concrete mixtures were used to construct the beams. The average compression
strength ranged between 29.6 and 37.9 MPa (4300 to 5500 psi). Figure 3 shows a typical
beam section.
Initial Corrosion
Twenty-six of the thirty beams were subjected to accelerated corrosion. Before
starting the initial accelerated corrosion, the beams were subjected to center-point loading
6

7
necessary to cause a minimum crack width of 0.33 mm (0.013 in). Next, ponding areas
were constructed around the cracked regions, and a salt solution (5% NaCl by weight)
was applied. The ponding was cycled at 1 week wet and 1 week dry. A 5-volt constant
potential was applied, to accelerate the corrosion process. Half-cell potential readings
were taken at the beginning and end of each cycle, to determine the corrosion activity.
The corrosion process lasted 18 weeks (9 wet and dry cycles), and resulted in severe
corrosion damage to the beams. Figure 4 shows a beam in the initial corrosion process,
with a single ponding area.
Concrete Repair
ACI repair procedures (ACI 2001) were followed in repairing the corrosion
damage. All damaged material was carefully separated from sound concrete without
causing further damage. Undamaged concrete behind the reinforcing steel was removed
to create a clear space of 25.4 mm (1 in). At the perimeter of the removal area 25.4 mm
(1 in) deep saw cuts were made. This prevented the formation of feathered edges and
provided adequate spacing for repair material. After the concrete was removed, all
corroded areas on the reinforcement were sandblasted to white metal. The repair and
cleaning process is shown in . shows the repair layout. Figure 5 Figure 6
To restore the beams’ original shape after the corrosion repair a concrete mixture
with a 46.2 MPa (6700 psi) 28 day-strength was used. The maximum aggregate size was
limited to 10 mm (0.375 in). In addition, a super plasticizer was mixed with the concrete
to reduce the water-cement ratio. The concrete performance evaluation report is shown
in the Appendix.

8
Concrete strengthening
After preparing the concrete surface by a light sandblasting, three strengthening
schemes were applied to the beams.
The first scheme (scheme I) involved strengthening the specimen with separate
FRP sheets for flexure and shear. A typical flexural sheet was 2743 mm (108 in) long
and 203 mm (8 in) wide. The shear strips were 152 mm x 305 mm (6 in x 12 in). On
each side eight sheets were used with a center-to-center spacing of 305 mm (12 in). At
mid-span a 305 mm (12 in) wide field was left un-strengthened to allow for free
development of corrosion cracks. Beams strengthening by the second scheme (scheme
II) used the same FRP layout as scheme I except that the shear sheets were used as
anchors for the flexural sheet. This sheet was fixed either at the ends only or over the
entire length using all shear FRP sheets. The third group was strengthened with a single
FRP sheet used as a full wrap (scheme III). This sheet was 2743 mm x 610 mm (108 in x
24 in) and covered the bottom of the specimens as well as 203 mm (8 in) of each side.
The different strengthening configurations are shown in Figure 7.
A unidirectional carbon fabric with glass veil backing for added fabric stability
during installation was used for strengthening. The matrix, Tyfo S Epoxy, was a two
component epoxy material. The composite material properties as given by the
manufacturer are shown in Table 1.
After the specimens were strengthened, eight beams were load tested to failure.
These tests were done to study the beam behavior under loading conditions and to collect
reference data for future testing.
9
Post-Repair Accelerated Corrosion
For the post-repair (PR) corrosion process 16 beams, 4 repaired only (R), 10
repaired and strengthened (RS) and 2 unrepaired and strengthened (URS) specimens were
pre-cracked under a load of 44.48 kN (10 kip) which simulated service load conditions
for the control beams. Crack widths could not be measured due to the FRP composite.
The beams were then ponded with a 3.5% salt solution for one week under constant 5-
volts followed by one week of drying. Half-cell readings were taken after each wet and
dry cycle. After 22 weeks (11 wet and dry cycles) eight beams were taken from the PR
corrosion process and load tested. The last eight beams remained in the corrosion
process.
Load Testing
After each corrosion process, eight beams were tested in four-point loading to
failure. All beams were simply supported; the distance between the load point and the
end supports was set at 1219 mm (48 in) except for beams C 1 and 2 A-D. The distance
between the load point and the end supports for beams C 1 and 2 A-D was 914 mm (36
in). This resulted in a constant moment zone at mid-span of 914 mm (36 in) for C 1 and
2 A-D, and 305 mm (12 in) for all other beams. The beams were tested in three or four
stages of loading. Deflection was measured with two Linear Variable Displacement
Transducers (LVDT) at mid-span. A hydraulic jack applied the load on the test
specimens at a load rate of 222 N/sec (50 lbf/sec). The data were collected using an
automated data acquisition system.
Two sets of beams have been tested thus far. The first group consisted of control,
repaired only (R), and repaired and strengthened (RS) beams. These tests were
performed after the initial accelerated corrosion, repair and strengthening process.

10
Beams from the second group were tested after PR accelerated corrosion. All beams
except for one (3 B-D) have been repaired as described earlier. Beam 3 B-D was
strengthened without a corrosion repair (URS) by scheme III. The test grouping can be
seen in Table 2; Figure 8 shows the plots of half-cell readings vs. strengthening scheme.
305m
m
(12i
n)
(8in)203mm
(2)#3
(2)#6
2900mm(114in)
51m
m20
3mm
(2i n
)(2
in)
(8in
)
(2)#3 (2)#6
51m
m
A B Figure 3. Specimen construction details. A) Cross section. B) Elevation.
Figure 4. Ponding area on beam.

11
A
B
C Figure 5. Beam 7 B-S. A) Splitting caused by corrosion. B) After removal of damaged
concrete; saw cuts can be seen at the perimeter edges. C) Corroded reinforcement before sandblasting.

12
(8in)
(114in)
(12i
n)
( 8in
)(2
in)
(2in
)
#6
#3
patch material, patch sizedepends on concrete crack
203mm
305m
m
patch material
2900mm
51m
m20
3mm
51m
m
saw cut
203m
m(8
in)
a
Figure 6. Beam repair details.
Scheme I
Scheme II
Scheme III
Figure 7. Repair schemes

13
-700
-600
-500
-400
-300
-200
-100
0
mV
(vs.
Cu/
CuS
O4)
control scheme I scheme II scheme III
after 4 weeks
A
-700
-600
-500
-400
-300
-200
-100
0
mV
(vs.
Cu/
CuS
O4)
control scheme I scheme III
after 22 weeks
scheme II
B
Figure 8. Plot of half-cell readings vs. strengthening scheme. A) After 4 weeks. B) After 22 weeks.
Table 1. Material properties for strengthening system Tensile strength
MPa (ksi) Max.
elongation Tensile modulus
GPa (ksi) Thickness mm (in) Tg
876 (127) 1.2% 72.4 (10500) 1.0 (0.04) 82°C (180°F)
14
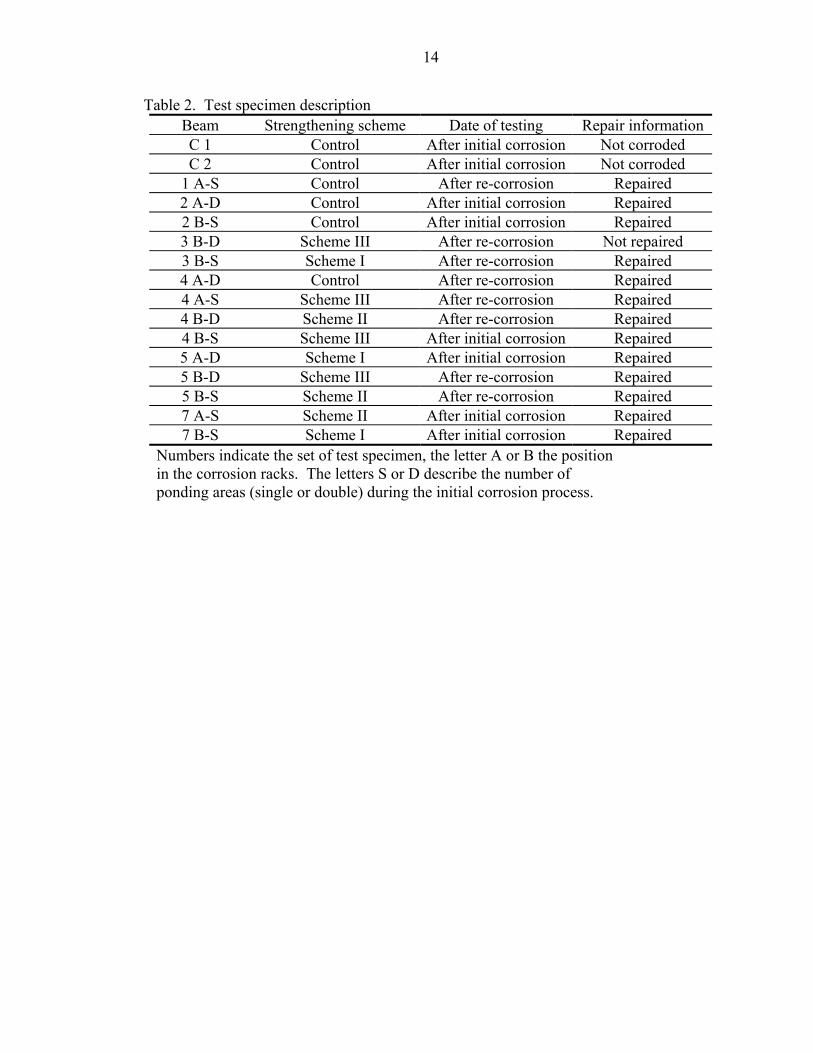
Table 2. Test specimen description Beam Strengthening scheme Date of testing Repair information C 1 Control After initial corrosion Not corroded C 2 Control After initial corrosion Not corroded
1 A-S Control After re-corrosion Repaired 2 A-D Control After initial corrosion Repaired 2 B-S Control After initial corrosion Repaired 3 B-D Scheme III After re-corrosion Not repaired 3 B-S Scheme I After re-corrosion Repaired 4 A-D Control After re-corrosion Repaired 4 A-S Scheme III After re-corrosion Repaired 4 B-D Scheme II After re-corrosion Repaired 4 B-S Scheme III After initial corrosion Repaired 5 A-D Scheme I After initial corrosion Repaired 5 B-D Scheme III After re-corrosion Repaired 5 B-S Scheme II After re-corrosion Repaired 7 A-S Scheme II After initial corrosion Repaired 7 B-S Scheme I After initial corrosion Repaired
Numbers indicate the set of test specimen, the letter A or B the position in the corrosion racks. The letters S or D describe the number of ponding areas (single or double) during the initial corrosion process.

CHAPTER 4 TEST RESULTS AND DISCUSSION
Crack Pattern due to Corrosion
Both corrosion programs were aimed to cause concrete cracks due to corrosion of
the main reinforcing steel. The initial corrosion process was stopped after 18 weeks.
Horizontal cracks had formed at the surface along the level of the main reinforcement
with rust leaching out. Crack lengths depended on the ponding area lay-out; cracks on
beams with two ponding areas were an average 2337 mm (92 in) long and cracks on
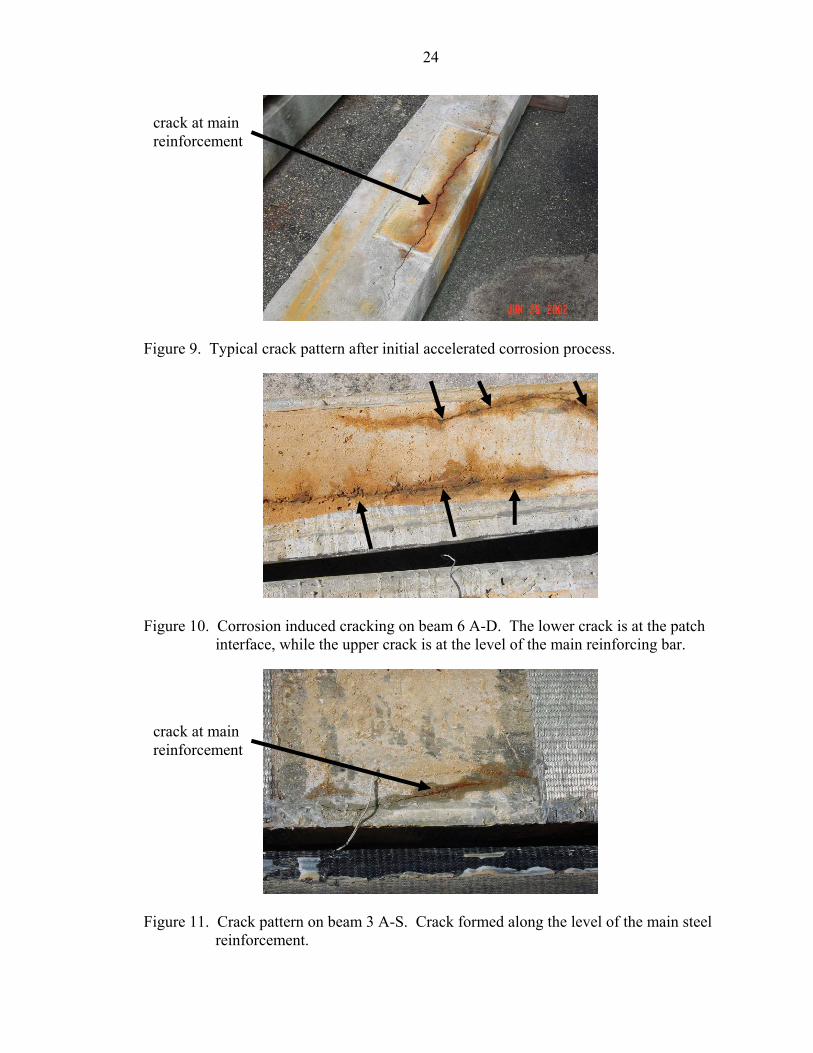
beams with a single ponding area were an average 1600 mm (63 in) long. Figure 9 shows
a typical picture of a horizontal corrosion crack on beam after 18 weeks of wet and dry
cycles. PR corrosion was conducted on the selected 16 beams which were described
earlier. These beams were exposed for 22 weeks to wet and dry cycles before the test
was stopped. The crack pattern and the level of damage on the PR corroded beams
depended on the type of strengthening system; un-strengthened specimen, specimen
strengthened by scheme I or scheme II, and specimens strengthened by scheme III.
summarizes the accelerated corrosion process of all beams. Half-cell readings were
made using a copper/copper sulfate electrode on the concrete surface. Although the
current ASTM Standard (ASTM C 876) requires concrete contact for half-cell
measurements, readings on beams strengthened by scheme III were made on FRP.
Knowing that epoxy is not conductive, half-cell readings taken on the FRP laminate were
expected to be zero. However, it was possible to get stable readings, which will be
Table
3
15

16
compared with the degree of corrosion to verify the measurement. Readings smaller than
-350 mV indicate corrosion activity.
Repaired Only Specimens
First signs of corrosion were observed after four weeks of wet and dry cycles.
Small cracks with rust leaching out were found along the level of the main reinforcing
steel and at the interface between old concrete and patch material. The crack size and the
amount of rust increased over the entire length of the test. By the end of the PR corrosion
period all specimen had the same crack pattern; one major crack at the level of the
reinforcement and a smaller secondary crack at the interface. Figure 10 shows an
unstrengthened beam after the re-corrosion process. Cracks at the interface and the main
reinforcement can be seen.
Specimens Strengthened by Scheme I and II
Beams strengthened by scheme I and II showed no visible signs of corrosion before
the sixth week. After the sixth week small cracks without any rust traces were visible.
By the end of the PR corrosion process, small cracks along the level of the main
reinforcement and at the interface had formed on all beams with very little, or no rust
leaching out. It was also observed that the shear FRP hindered corrosion cracks to grow
in vertical direction but not in horizontal. However, these cracks were much smaller than
the cracks on un-strengthened beams. Typical corrosion-damage for specimens
strengthened by scheme I can be seen in Figure 11.
Specimens Strengthened by Scheme III
This group consisted of two different types of beams, RS beams (4 A-S and 5 B-D)
and URS beams (2 B-D and 3 B-D). No visible signs of corrosion were spotted over the
entire length of testing in both groups. However, half-cell readings verified corrosion
17
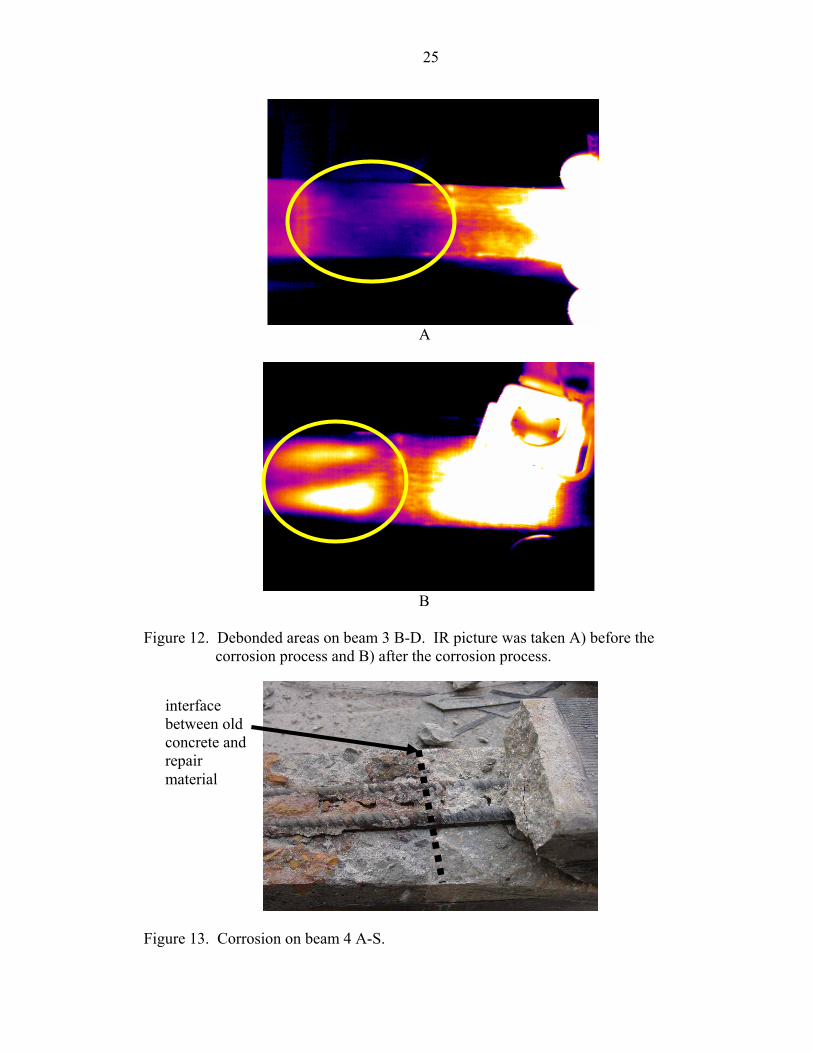
activity on the un-repaired beams. A comparison of infrared (IR) pictures taken after
curing and at the end of the corrosion process showed the development of large debonded
areas on these beams. The debonded regions are a result of tension forces at the concrete
surface caused by steel corrosion. The development of debonded regions can be seen in
b denoted by light-colored regions. Figure 12
No debonded areas or other signs of corrosion were detected on RS beams during
the entire PR corrosion. An investigation of the reinforcement after testing verified the
results from the visual inspection, except for beam 4 A-S.
On beam 4 A-S some corrosion was found at the interface between old and new
concrete on the main reinforcing steel. This corrosion spot was caused by the so called
"ring anode corrosion" or "halo effect". When repairs are completed on
corrosion-damaged structures, the new concrete used to form the patch creates a
corrosion potential with the existing concrete, which initiates new corrosion sites in the
contaminated concrete near the patch interface. But since this spot was small and at the
end of the beam it did not affect the structural behavior. shows this effect on
beam 4 A-S.
Figure 13
Corrosion Damage Rating
After investigating the corrosion damage on the test specimens, each beam was
assigned to one of four categories. Each category represents a specific level of damage
based on visual observations of concrete cracking and reinforcement corrosion. Category
I represents the lowest degree of corrosion damage, category III the highest. Category IV
represents beams with a full FRP wrap on which half-cell measurements indicated
corrosion activity.

18
Category I
Description: Very small horizontal cracks on the concrete surface with little or no
traces of rust. No damage on the reinforcing steel visible. shows typical
category I corrosion damage.
Figure 14
Category II
Description: Visible horizontal cracks with rust traces on concrete surface. Crack
width is less than 1 mm (0.04 in). Very few and very small pitting corrosion spots on
steel reinforcement. Figure 15 shows typical category II corrosion damage.
Category III
Description: Visible horizontal cracks with large rust stains on concrete surface.
Crack width is less than 3 mm (0.12 in). Severe pitting corrosion and uniform surface
corrosion damage on steel reinforcement. A loss of cross section area is visible.
and show typical category III corrosion damage.
Figure
16 Figure 17
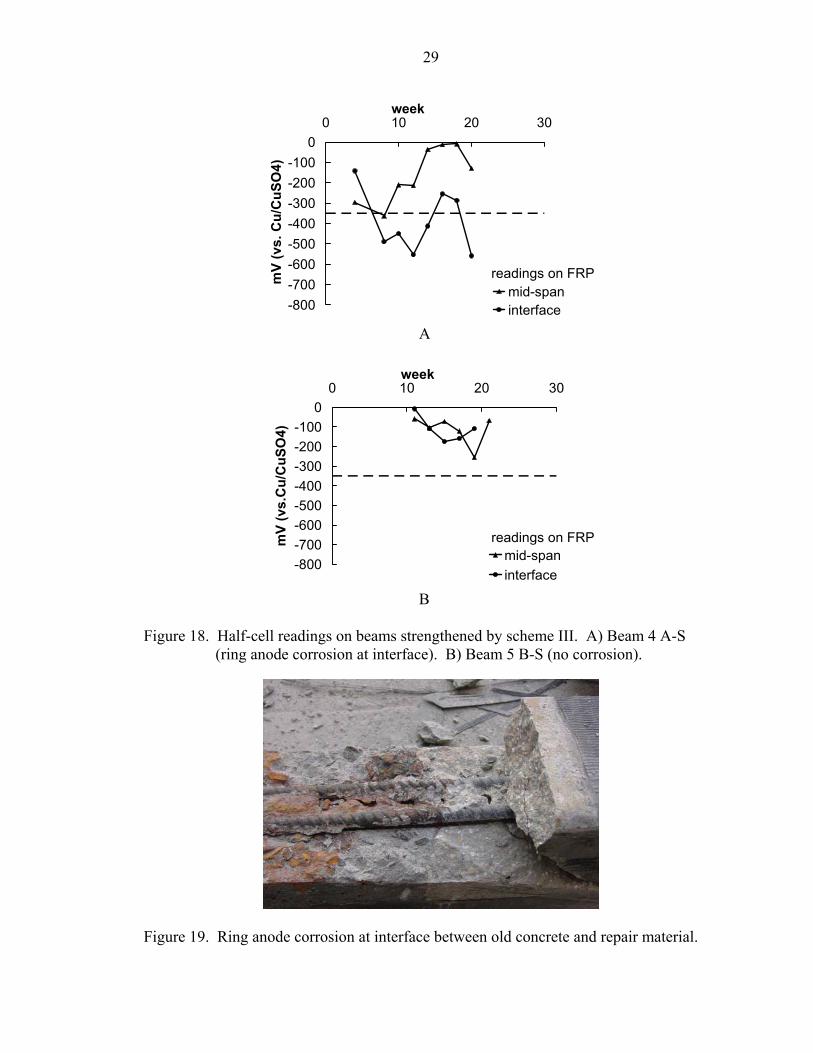
Category IV
Description: The typical outward signs of corrosion were not visible on beams
strengthened by scheme III due to the FRP layout. However, half-cell measurements can
be an indicator of corrosion activity. Figure 18 shows half-cell readings from two RS
beam at mid-span and at the interface between old concrete and repair material. Even
though the readings fluctuate over the period of 20 weeks, the measurements on beam 4
A-S (Figure 18a) at the interface tend to indicate corrosion activity. An investigation
after the test verified ring anode corrosion (Figure 19).
Structural Behavior
After each corrosion process, a group of eight beams was tested in flexure to
failure. Typically, all corroded R beams failed at lower loads than the control beam.

19
RS and URS beams failed at higher loads. Post-cracking stiffness was always less
than the control beam’s stiffness, except for beams strengthened by scheme III.
Those beams stiffness were almost identical with the control beam stiffness.
All beams failed in the form of concrete crushing except for beams C 1 and 2 A-D.
At maximum load, RS and URS specimens showed a brittle failure mode in the form of
concrete crushing. R beams failed in a more ductile mode. It can be seen on the load-
deflection diagrams for R beams ( , ) that the plot plateaus at
approximately 89 kN (20 kip) indicate that the main reinforcing steel has yielded. This
was confirmed by strain measurements on the reinforcement. RS and URS beams,
however, do not exhibit as lengthy a plateau even though strain gauge data indicated that
steel had yielded.
Figure 21 Figure 22
Control beams C 1 and 2 A-D were tested in a different test set-up as described
earlier. Both beams failed in shear and therefore they were not compared in this study.
After testing C1 and 2 A-D the free length at mid-span was reduced to 305 mm (12 in).
displays the results from tests after the initial corrosion and Table 5 displays the
results from tests after PR corrosion. The post cracking slope (PC) was calculated using
load and deflection values between 44.5 kN (10 kip) and 66.7 kN (15 kip) and was used
as a tool to describe the stiffness.
Table 4
Control Beams
Beam C 2 was tested to be used as a control beam for all test specimens. This
beam was not corroded. The maximum load capacity was 96 kN (21.6 kip) at a
deflection of 20 mm (0.79 in). The reinforcement started to yield at approximately 62.3
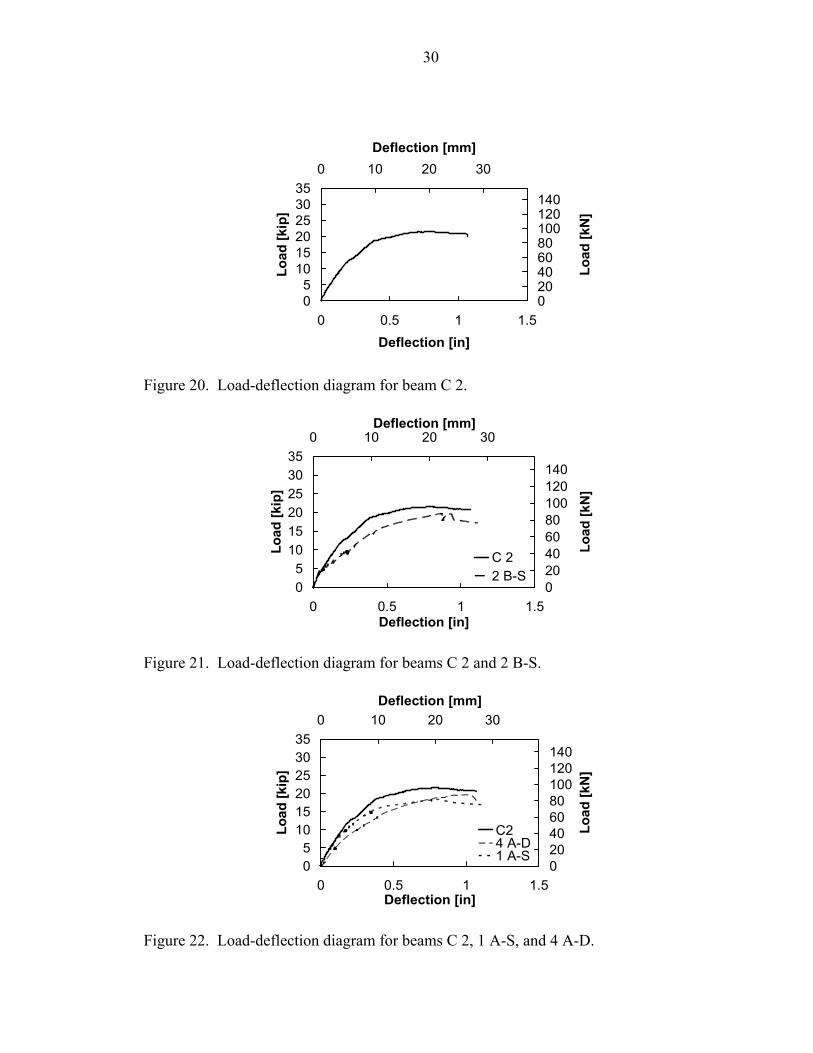
kN (14 kip). Figure 20 shows the load versus mid-span deflection plot. Beam C 2 failed
by concrete crushing.
20
Repaired Beams
Beam 2 B-S was tested to failure after the initial corrosion and repair process. The
ultimate load capacity was 8% lower than the control beam’s capacity. The PC stiffness
was reduced by about 20%. Figure 21 shows the load-deflection diagram for beam C 2
and 2 B-S.
The load deflection plots for PR corroded specimens (1 A-S and 4 A-D) are shown
in Figure 22. Both beams were tested after the initial corrosion, repair, and PR corrosion
process. It can be seen that the load capacities and stiffness are less than that of the
control beam. The ultimate capacities were 8% (4 A-D) and 15% (1 A-S) lower; the
post-cracking stiffness was 29% (4 A-D) and 11% (1 A-S) lower.
It is likely that the lower stiffness and load capacities were caused by the corrosion
process. Typically, steel cross section area loss and bond failure between the
reinforcement and concrete occur during corrosion. A reduced steel cross section area
results in a lower load carrying capability, the loss of bond allows the reinforcing steel to
yield without any restraint and results in a lower stiffness as well as load capacity.
The concrete repairs performed well in the load tests with no significant cracking
debonding, or spalling of the repair material noted. Beams C 1 and 2 A-D both failed in
shear with diagonal cracks forming in the existing concrete and passing through the
interface into the repair material. Figure 23 shows the load deflection diagram for both
beams. It can be seen that beam 2 A-D has the same post corrosion loss in stiffness as
those of the other specimen that had been through the accelerated corrosion.
Scheme I Specimens
The load-deflection response for strengthened beams (5 A-D and 7 B-S) tested after
the initial corrosion process is shown in . Both beams have been repaired Figure 24

21
before FRP application and testing. The flexural FRP sheet on beam 5 A-D covered the
tension face completely, while the sheet on beam 7 B-S was 102 mm (4 in) wide and
covered only 50%. The increase in capacity over the control beam was 14% for beam 7
B-D and 30% for beam 5 A-D. The PC stiffness increased slightly (13%) for beam 5 A-
D; for beam 7 B-S it did not change.
Beam 3 B-D was tested un-repaired after the re-corrosion process. The ultimate
capacity increased by 27%; the stiffness did not change within the limits. Figure 25
shows the load-deflection plot for the re-corroded beam compared to the control beam.
During testing, prior to failure, signs of debonding were observed on the beams.
Several loud cracking sounds indicated that epoxy was cracking at multiple locations.
However, epoxy cracking was limited to very small areas and was not seen at all during
IR inspections. Concrete crushed on beams strengthened by scheme I before FRP
debonding became the failure mechanism.
The change in post cracking stiffness was very small for beam 5 A-D and 7 B-S
compared to the control beam. The same performance was observed on beam 3 B-S.
Since the degree of corrosion damage was small too, this behavior was expected.
Scheme II Specimens
Figure 26 shows the load-deflection diagram for beam 7 A-S. The flexural sheet on
this beam was anchored with U-wraps at multiple points leaving an un-strengthened
length of 305 mm (12 in) at mid-span. Beam 7 A-S was load tested after the initial
corrosion and a repair procedure. The load capacity was 47% higher than the capacity of
the control beam; the post cracking stiffness increased only slightly.
22
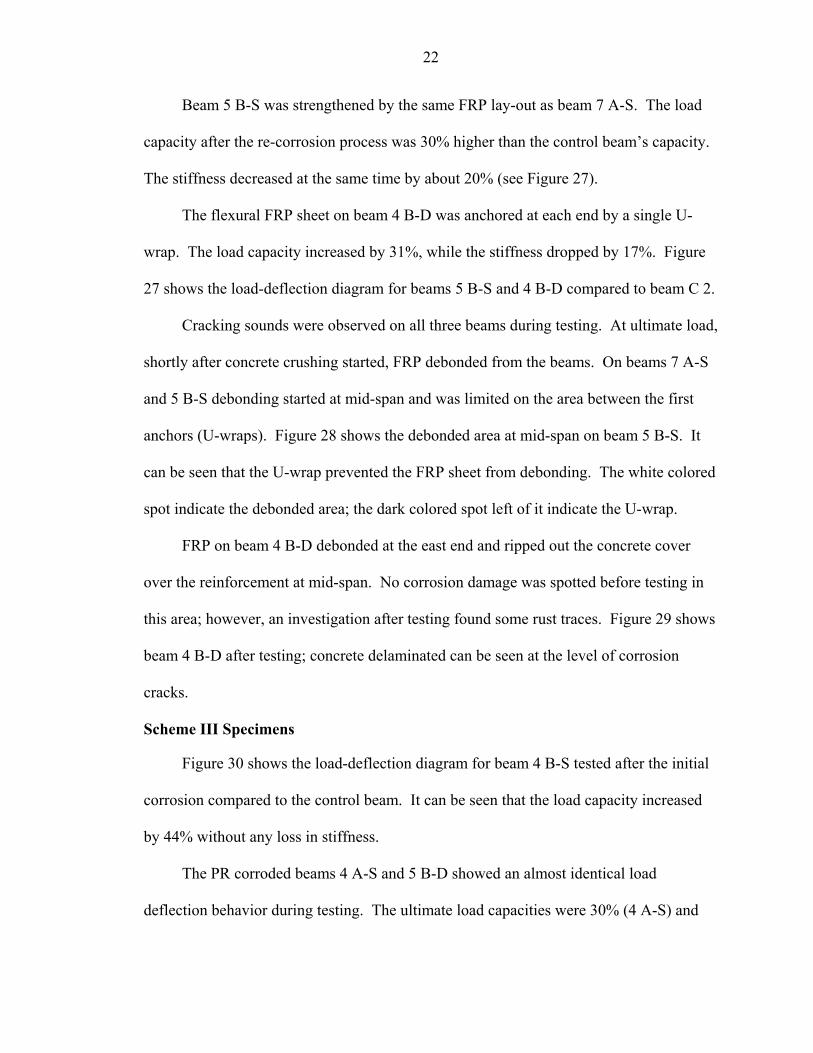
Beam 5 B-S was strengthened by the same FRP lay-out as beam 7 A-S. The load
capacity after the re-corrosion process was 30% higher than the control beam’s capacity.
The stiffness decreased at the same time by about 20% (see ). Figure 27
Figure
27
The flexural FRP sheet on beam 4 B-D was anchored at each end by a single U-
wrap. The load capacity increased by 31%, while the stiffness dropped by 17%.
shows the load-deflection diagram for beams 5 B-S and 4 B-D compared to beam C 2.
Cracking sounds were observed on all three beams during testing. At ultimate load,
shortly after concrete crushing started, FRP debonded from the beams. On beams 7 A-S
and 5 B-S debonding started at mid-span and was limited on the area between the first
anchors (U-wraps). Figure 28 shows the debonded area at mid-span on beam 5 B-S. It
can be seen that the U-wrap prevented the FRP sheet from debonding. The white colored
spot indicate the debonded area; the dark colored spot left of it indicate the U-wrap.
FRP on beam 4 B-D debonded at the east end and ripped out the concrete cover
over the reinforcement at mid-span. No corrosion damage was spotted before testing in
this area; however, an investigation after testing found some rust traces. shows
beam 4 B-D after testing; concrete delaminated can be seen at the level of corrosion
cracks.
Figure 29
Scheme III Specimens
Figure 30 shows the load-deflection diagram for beam 4 B-S tested after the initial
corrosion compared to the control beam. It can be seen that the load capacity increased
by 44% without any loss in stiffness.
The PR corroded beams 4 A-S and 5 B-D showed an almost identical load
deflection behavior during testing. The ultimate load capacities were 30% (4 A-S) and

23
32% (5 B-D) higher than the control beams capacity. No loss in stiffness was observed.
The load-deflection diagram for these beams can be seen in . Figure 31
Throughout all tests several cracking sounds were heard. Like on the other
strengthened beams, the source was epoxy cracking. However, no debonded areas were
found at any point of testing. At ultimate load, all beams strengthened by scheme III
failed suddenly by concrete crushing without any previous warning.
Beam 3 B-D was strengthened by scheme III without a concrete repair after the
initial corrosion (URS). The strengthening FRP sheet was used to cover all corrosion
cracks. After the PR corrosion program several large debonded areas at multiple points
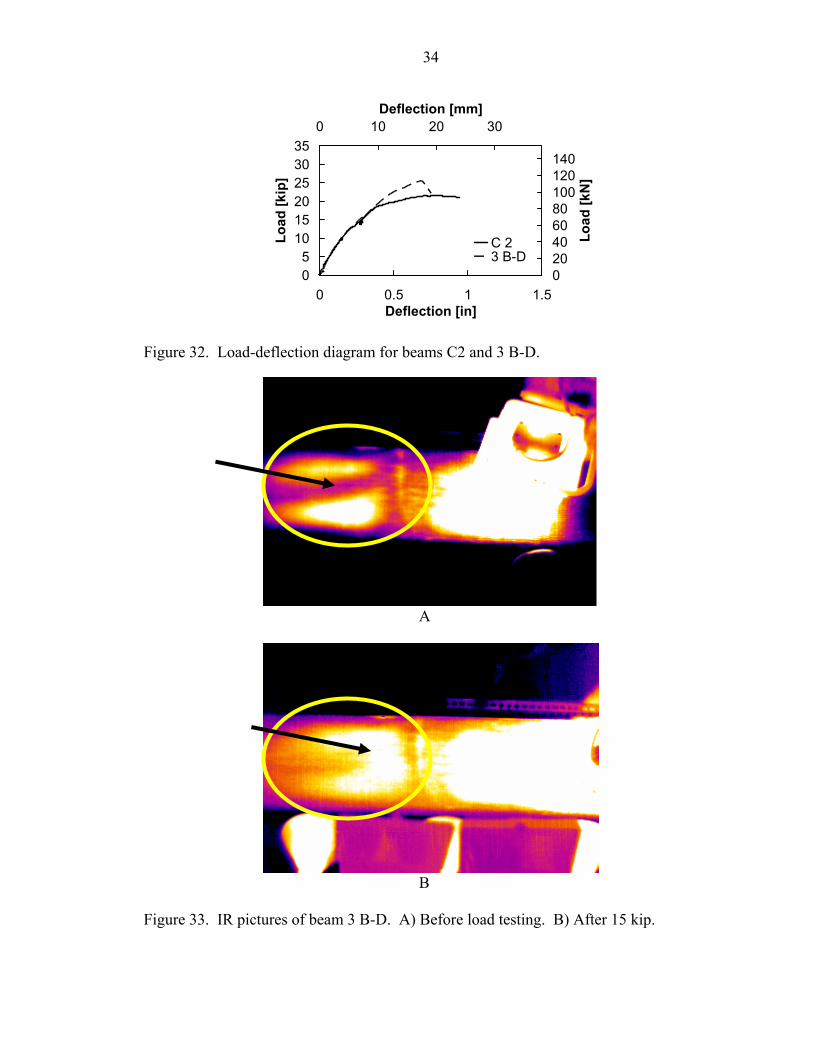
on the specimen were found. Figure 32 shows the load-deflection diagram for beam 3 B-
D compared to the control beam. The load capacity was 18% higher, while the stiffness
did not change. Like the other beams strengthened by scheme III this beam failed
suddenly by concrete crushing without any previous warning.
IR scans of the tension face were taken during loading of a large debonded area
caused by corrosion. At maximum load the beam failed by concrete crushing at mid-
span. The failure mode indicated that the previously debonded area did not adversely
affect the beam capacity. In addition, the two investigated debonded areas did not
expand towards mid-span during loading, but rather grew towards each other forming one
large debonded area (see Figure 33).
24
crack at main reinforcement
Figure 9. Typical crack pattern after initial accelerated corrosion process.
Figure 10. Corrosion induced cracking on beam 6 A-D. The lower crack is at the patch
interface, while the upper crack is at the level of the main reinforcing bar.
crack at main reinforcement
Figure 11. Crack pattern on beam 3 A-S. Crack formed along the level of the main steel
reinforcement.
25
A
B Figure 12. Debonded areas on beam 3 B-D. IR picture was taken A) before the
corrosion process and B) after the corrosion process.
interface between old concrete and repair material
Figure 13. Corrosion on beam 4 A-S.

26
A
B Figure 14. Pictures taken of category I corrosion-damage. A) Horizontal crack. B)
Corresponding damage on reinforcing steel.
A Figure 15. Pictures taken of category II corrosion-damage. A) Horizontal crack. B)
Corresponding damage on reinforcing steel.

27
B Figure 15. Continued.
A
B Figure 16. Pictures taken of category III corrosion-damage on control beam. A)
Horizontal crack. B) Corresponding damage on reinforcing steel.

28
A
B Figure 17. Pictures taken of category IV corrosion-damage on repaired beam. A)
Horizontal crack. B) Corresponding damage on reinforcing steel.
29
readings on FRP
-800-700-600-500-400-300-200-100
00 10 20 30
week
mV
(vs.
Cu/
CuS
O4)
mid-spaninterface
A
readings on FRP
-800-700-600-500-400-300-200-100
00 10 20 30
week
mV
(vs.
Cu/
CuS
O4)
mid-spaninterface
B Figure 18. Half-cell readings on beams strengthened by scheme III. A) Beam 4 A-S
(ring anode corrosion at interface). B) Beam 5 B-S (no corrosion).
Figure 19. Ring anode corrosion at interface between old concrete and repair material.
30
05
101520253035
0 0.5 1 1.5Deflection [in]
Load
[kip
]020406080100120140
0 10 20 30Deflection [mm]
Load
[kN
]
Figure 20. Load-deflection diagram for beam C 2.
05
101520253035
0 0.5 1 1.5Deflection [in]
Load
[kip
]
020406080100120140
0 10 20 30Deflection [mm]
Load
[kN
]
C 22 B-S
Figure 21. Load-deflection diagram for beams C 2 and 2 B-S.
05
101520253035
0 0.5 1 1.5Deflection [in]
Load
[kip
]
020406080100120140
0 10 20 30Deflection [mm]
Load
[kN
]
C24 A-D1 A-S
Figure 22. Load-deflection diagram for beams C 2, 1 A-S, and 4 A-D.

31
05
101520253035
0 0.5 1 1.5Deflection [in]
Load
[kip
]020406080100120140
0 10 20 30Deflection [mm]
Load
[kN
]
C12 A-D
Figure 23. Load-deflection diagram for beams C 1 and 2 A-D.
05
101520253035
0 0.5 1 1.5Deflection [in]
Load
[kip
]
020406080100120140
0 10 20 30Deflection [mm]
Load
[kN
]
C 25 A-D7 B-S
Figure 24. Load-deflection diagram for beams C 2, 5 A-D, and 7 B-S.
05
101520253035
0 0.5 1 1.5Deflection [in]
Load
[kip
]
020406080100120140
0 10 20 30Deflection [mm]
Load
[kN
]
C 23 B-S
Figure 25. Load-deflection diagram for beams C 2 and 3 B-S.

32
05
101520253035
0 0.5 1 1.5Deflection [in]
Load
[kip
]020406080100120140
0 10 20 30Deflection [mm]
Load
[kN
]
C 27 A-S
Figure 26. Load-deflection diagram for beams C 2 and 7 A-S.
05
101520253035
0 0.5 1 1.5Deflection [in]
Load
[kip
]
020406080100120140
0 10 20 30Deflection [mm]
Load
[kN
]
C 25 B-S4 B-D
Figure 27. Load-deflection diagram for beams C2, 5 B-S, and 4 B-D.
Figure 28. Debonded area on beam 5 B-S.

33
Figure 29. Failure mode for beam 4 B-D at mid-span; view from the north side.
05
101520253035
0 0.5 1 1.5Deflection [in]
Load
[kip
]
020406080100120140
0 10 20 30Deflection [mm]
Load
[kN
]
C 24 B-S
Figure 30. Load-deflection diagram for beams C 2 and 4 B-S.
05
101520253035
0 0.5 1 1.5Deflection [in]
Load
[kip
]
020406080100120140
0 10 20 30Deflection [mm]
Load
[kN
]
C 24 A-S5 B-D
Figure 31. Load-deflection diagram for beams 4 A-S, 5 B-D, and C2.
34
05
101520253035
0 0.5 1 1.5Deflection [in]
Load
[kip
]020406080100120140
0 10 20 30Deflection [mm]
Load
[kN
]
C 23 B-D
Figure 32. Load-deflection diagram for beams C2 and 3 B-D.
A
B Figure 33. IR pictures of beam 3 B-D. A) Before load testing. B) After 15 kip.

35
Table 3. Half-cell readings from accelerated corrosion
Beam Type Half-cell reading after 4th week
Half-cell reading after 22nd week
Damage category
1 A-S control -376 mV (conc) -582 mV (conc) III 1 B-D control -382 mV (conc) -563 mV (conc) III 2 B-D scheme III -505 mV (FRP) -593 mV (FRP) IV 3 A-D scheme II -434 mV (conc) -494 mV (conc) I 3 A-S scheme I -309 mV (conc) -552 mV (conc) I 3 B-D scheme III -338 mV (FRP) -440 mV (FRP) IV 3 B-S scheme I -407 mV (conc) -461 mV (conc) I 4 A-D control -440 mV (conc) -545 mV (conc) III 4 A-S scheme III -80 mV (FRP) -80 mV (FRP) IV 4 B-D scheme II -368 mV (conc) -502 mV (conc) I 5 A-S scheme II -280 mV (conc) -312 mV (conc) I 5 B-D scheme III -357 mV (FRP) -63 mV (FRP) 0 5 B-S scheme II -130 mV (conc) -260 mV (conc) 0 6 A-D control -600 mV (conc) -504 mV (conc) III 6 A-S scheme I -496 mV (conc) -467 mV (conc) I 6 B-S scheme I -518 mV (conc) -514 mV (conc) I
Readings made on concrete (conc) or FRP (FRP) Damage categories are explained in chapter 4 0 no signs of corrosion activity
Table 4. Results load test after initial corrosion
FRP configuration Beam Test result in kN (kip)
PC slope in kip/in
Capacity change to beam C 2
control* C 1 104.3 (23.4) 37 not compared control* 2 A-D 128 (28.8) 35 not compared control C 2 96.1 (21.6) 36 0% control 2 B-S 88.1 (19.8) 29 -8%
scheme I 5 A-D 124.5 (28) 41 +30% scheme I (4”) 7 B-S 111.2 (25) 36 +14%
scheme II 7 A-S 141.4 (31.8) 42 +47% scheme III 4 B-S 137.9 (31) 37 +44%
* beam failed in shear

36
Table 5. Results load test after PR corrosion
FRP configuration Beam Test result in kN (kip)
PC slope in kip/in
Capacity change to beam C 2
control 1 A-S 81.8 (18.4) 31 -15% control 4 A-D 87.6 (19.7) 25 -8%
scheme I 3 B-S 121.9 (27.4) 36 +27% scheme II 4 B-D 125.4 (28.2) 30 +31% scheme II 5 B-S 124.5 (28) 29 +30% scheme III 3 B-D 113.4 (25.5) 40 +18% scheme III 4 A-S 125.4 (28.2) 36 +31% scheme III 5 B-D 127.2 (28.6) 36 +32%
CHAPTER 5 CONCLUSIONS
The experimental set-up was designed to evaluate the long-term durability of
externally bonded FRP reinforcement for concrete structures and to develop models to
predict their service life. Thus far, two test groups, with a total of 16 beams, were
investigated after one and two cycles of accelerated corrosion. The first group consisted
of eight specimens tested after the initial corrosion process. Beams out of the second
group were repaired after the initial corrosion process, exposed to the second cycle of
accelerated corrosion, and then load tested. The following conclusions can be withdrawn
from the test program:
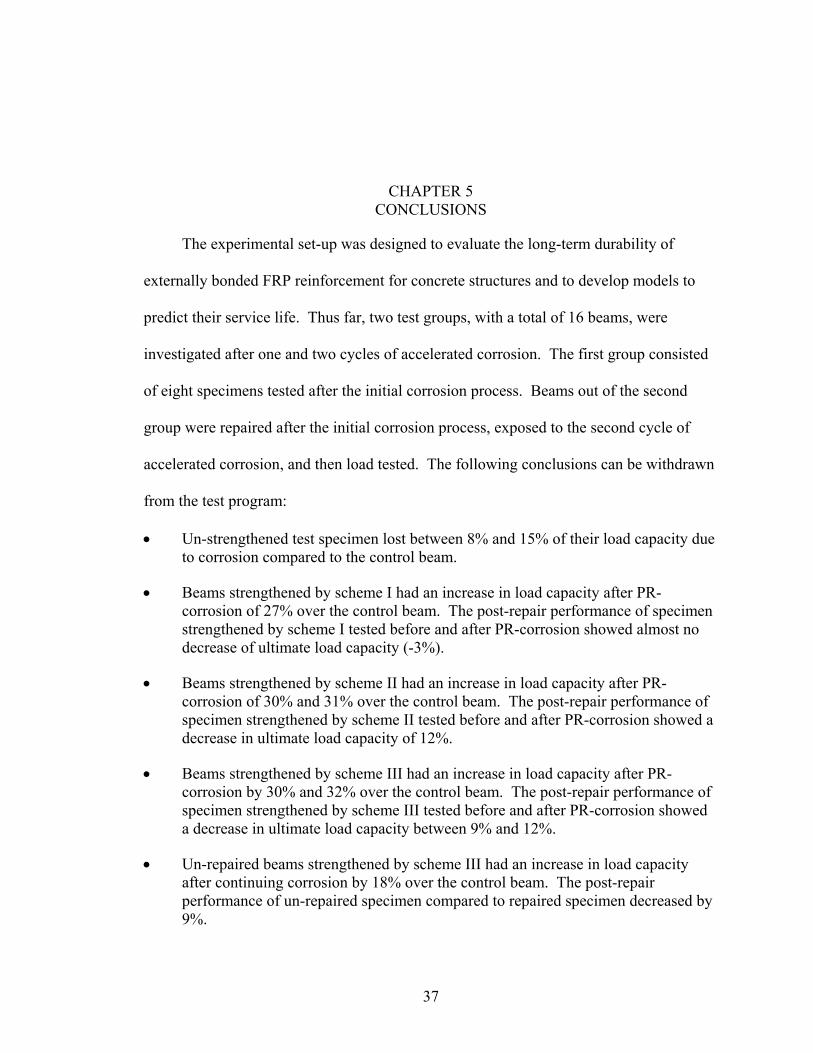
• Un-strengthened test specimen lost between 8% and 15% of their load capacity due to corrosion compared to the control beam.
• Beams strengthened by scheme I had an increase in load capacity after PR-corrosion of 27% over the control beam. The post-repair performance of specimen strengthened by scheme I tested before and after PR-corrosion showed almost no decrease of ultimate load capacity (-3%).
• Beams strengthened by scheme II had an increase in load capacity after PR-corrosion of 30% and 31% over the control beam. The post-repair performance of specimen strengthened by scheme II tested before and after PR-corrosion showed a decrease in ultimate load capacity of 12%.
• Beams strengthened by scheme III had an increase in load capacity after PR-corrosion by 30% and 32% over the control beam. The post-repair performance of specimen strengthened by scheme III tested before and after PR-corrosion showed a decrease in ultimate load capacity between 9% and 12%.
• Un-repaired beams strengthened by scheme III had an increase in load capacity after continuing corrosion by 18% over the control beam. The post-repair performance of un-repaired specimen compared to repaired specimen decreased by 9%.
37
38
• Corrosion caused a loss of stiffness on test specimen. Stiffness can be regained by FRP application.
• FRP applications decreased corrosion rates during post-repair corrosion by minimizing chloride diffusion.

LIST OF REFERENCES
American Concrete Institute (ACI) Committee 222 (1996). “Corrosion of metals in concrete.” American Concrete Institute, ACI 222R-96, Farmington Hills, Michigan.
American Concrete Institute (ACI) Committee 440 (2002). “Guide for the design and construction of externally bonded FRP systems for strengthening concrete structures.” American Concrete Institute, ACI 440.2R-02, Farmington Hills, Michigan.
American Concrete Institute (ACI) Committee 546 (2001). “Concrete repair guide.” American Concrete Institute, ACI 556R-96 (Reapproved 2001), Farmington Hills, Michigan.
American Society for Testing and Materials (ASTM) (1999). “Standard test method for half-cell potentials of uncoated reinforcing steel in concrete.” C 876-91 (Reapproved 1999), West Conshohocken, Pennsylvania.
Berver, E. W., Fowler, D. W., and King, J. J. (2001). “Corrosion in FRP-wrapped concrete members.” 9th International Conference and Exhibition “Structural Faults and Repair 2001”, London, UK.
Bonacci, J. F. and Maalej, M. (2000). “Externally bonded fiber-reinforced polymer for rehabilitation of corrosion damaged concrete beams.” ACI Structural Journal, September/October 2000, 703-711.
Jones, D. A. (1996). “Principles and prevention of corrosion.” Prentice Hall, Upper Saddle River, NJ, 2nd Edition 1996.
Karbhari, V. M. (1996). “Effects of environmental exposure on the external strengthening of concrete with composites short term bond durability.” Journal of Reinforced Plastics and Composites, Vol. 15, 1194-1216.
Soudki, K. A., Zeng, J. S., Meise, B. and Sherwood, E. G. (1999). “ Durability of repaired concrete beams with CFRP laminates subjected to wet-dry cycles.” Proceedings of the first International Conference “Durability of FRP Composites for Construction” (CDCC 98), 499-512
Soudki, K. A., Sherwood, T., and Masoud, S. (2003). “FRP repair of corrosion-damaged reinforced concrete.” University of Waterloo, Canada, Department of Civil Engineering.
39

40
Virmani, P. Y. (2002). “Corrosion costs and preventive strategies in the United States.” Federal Highway Administration, Report FHWA-RD-01-156

BIOGRAPHICAL SKETCH
The author was born June 18, 1975, in Malapane, Poland, to Henrik and Margarete
Kutarba. He graduated from KSL High School in Berlin, Germany, in 1994, and then
started his college career at the Berufsakademie Berlin, Germany. After receiving the
degree of Bachelor of Science in Civil Engineering, he enrolled in the graduate program
of the University of Florida, Department of Civil Engineering to pursue a Master of
Engineering with a focus in structural design. His graduate career was focused on
durability problems of fiber reinforced polymer (FRP) repair methods. After receiving
his Master of Engineering degree in May 2004, he will pursue a career in structural
design.
41
Recommended