
Drought Planning: The Long-Term Context
Connie Woodhouse, School of Geography and Development, University of Arizona
2015 U.S. Drought Monitor ForumDesert Research InstituteWestern Regional Climate CenterApril 14-16, 2015
Photo: Zack Guido
Acknowledgements to the many people who’s work I’ve borrowed for this presentations

Drought: Different metrics, areas, and time frames

Drought: Different metrics, areas, and time frames

Drought: Different metrics, areas, and time frames
Upper Rio Grande Basin Monthly Snowpack, 2012, 2013, 2014, & 2015 as of 4/9/15
Median WY2015 WY2014 WY2013 WY2012
April
March
Feb
Jan
Dec
NovOct
Mo
nth
ly a
ccu
mu
lati
on
as
a %
of
no
rmal
pea
k SW
E

Upper Colorado River natural flow estimates, water year 2000-2014
Drought: Different metrics, areas, and time frames

Sacramento 4 Rivers Index natural flow estimates water year 1906-2013
Drought: Different metrics, areas, and time frames
2014 was about 2/3rds of 2013

Drought assessment challenges…..

Dimensions of Drought
Areal extent is a factor, too

Paleoclimatic data can help assess modern droughts in a long-term context

Tree rings as proxies for past climate

How is tree growth related to climate?
Variations in ring widths reflect the conditions that influence tree growth.
Climate is often the primary influence on growth, and because of this, ring width can be used as a proxy for past
climate.

Douglas-fir Pinyon pine Ponderosa pine
Trees that record variability in moisture

Western CO Annual Precip vs. Pinyon ring width (WIL731)
10
12
14
16
18
20
22
24
26
1930 1940 1950 1960 1970 1980 1990 2000
Pre
cip
ita
tio
n (
in.)
0
0.1
0.2
0.3
0.4
0.5
0.6
0.7
0.8
Rin
g W
idth
(m
m)
Moisture-stressed trees closely track variations in moisture
R = 0.78
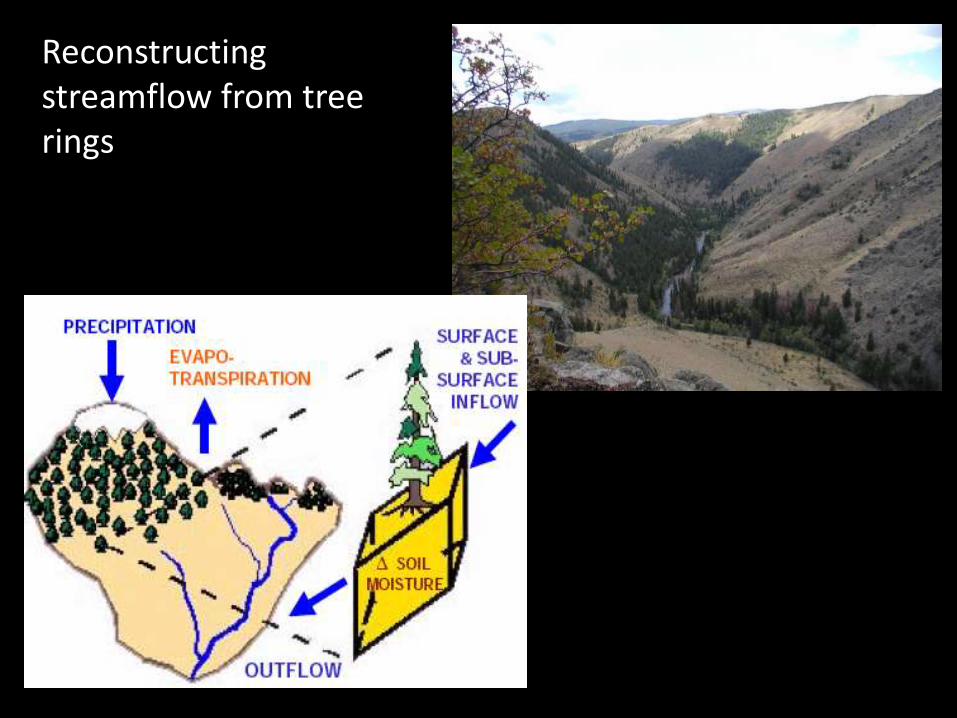
Reconstructing streamflow from tree rings

Statistical Calibration
Reconstruction Model
Time Series of Reconstructed Streamflow
Observed Streamflow
Reconstruction process in a nutshell
Tree Rings

Tree-ring chronologies are calibrated with the gage record to generate a reconstruction model
0
5
10
15
20
25
30
1905 1915 1925 1935 1945 1955 1965 1975 1985 1995
An
nu
al
Flo
w (
MA
F)
obs
7 steps
gage
reconstruction

The model is then applied to the full-length chronologies to produce a record of past hydroclimatic variability
Reconstruction of Colorado River at Lees Ferry, 1490-1997
Woodhouse et al. 2006
Woodhouse et al. 2006

Tree rings can also be used to reconstruct cool season and monsoon precipitation in Southwestern North America

Lees Ferry
Upper Colorado River Basin Drought
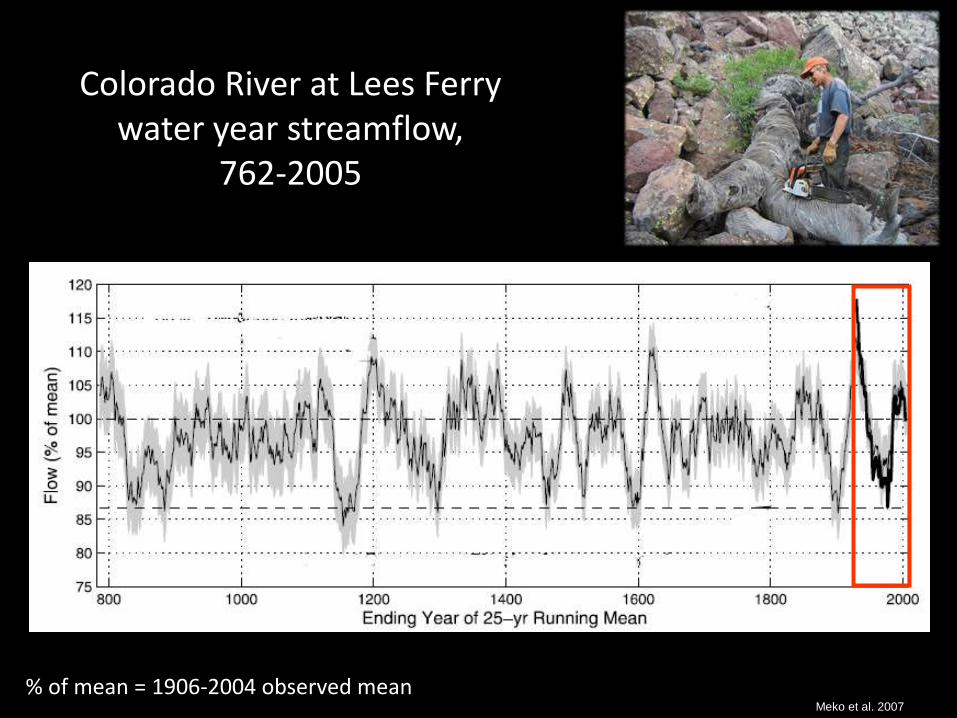
% of mean = 1906-2004 observed mean
Colorado River at Lees Ferry water year streamflow,
762-2005
Meko et al. 2007

Assessment of the 2000-2004* drought in a millennial context
Meko et al. 2007
2000-2004 is 9th lowest
*5-yr period with lowest average flow, gage record, 1906-2014

Colorado River Medieval Drought
*Longest period of consecutively below average flow in the gage record is 5 yearsMeko et al. 2007

Map courtesy of CADWR
Sacramento River Drought:Sacramento 4 Rivers Index

Data smoothed with a 20-yr running average Meko et al. 2014
Sacramento 4 Rivers Index Reconstruction 900-2012 and Gage Record 1906-2012

Sacramento 4 Rivers Index Reconstruction 900-2012 and Gage Record 1906-2012
Data smoothed with a 20-yr running average

Reconstructed Sacramento River Streamflow:
Lowest ranking single and multi-year averages
rank single yr 3 yr 6 yr 10 yr 20 yr 50 yr
1 1580 1580 1934 1933 1936 1175
2 1924 1581 1992 1935 1935 1177
3 1729 1796 1933 1934 1937 1179
4 1977 1931 1846 1931 1158 1178
5 1829 1655 1931 1932 1934 1180
6 1841 1977 1935 1936 1162 1176
7 1783 1778 1480 1580 1157 1174
8 1795 1783 1481 1482 1159 1172
9 1931 1845 1932 1937 1939 1173
10 1571 981 1929 1148 1156 1181
11 1126 1146 1845 1483 1938 1183
12 1532 1961 1148 1481 1160 1187
13 1864 1481 1156 1783 1161 1171
14 1529 1757 1520 1152 1148 1170
15 1632 1156 1157 1929 1164 1188
16 1285 1846 981 1849 1152 1168
17 957 1992 1521 1157 1154 1189
18 1691 1145 1580 1480 1940 1182
19 1579 1933 1844 1159 1155 1185
20 1976 980 1158 1158 1163 1186
Last year in n-year averaged period, bold = 20th century yrs

4 5
76
Central and Southern California DroughtReconstructed PDSI and Precipitation
Griffin and Anchukaitis 2015
OC
T-J
UN
PR
EC
IPIT
AT
ION

Shared Drought, Sacramento and Colorado River flows900-2005
Data smoothed with a 20-yr spline

Spatial extent, duration, and severity of the 1100s Medieval Period drought
Herweijer et al., 2007, Journal of Climate

Upper Rio Grande Streamflow and Lower Rio Grande Monsoon Precipitation

Rio Grande Otowi Index Supply Estimated Natural Streamflow Reconstruction
and Gage Record
Reconstruction: 1450-2013, gage: 1940-2012Data smoothed with a 20-yr running average

Rio Grande Otowi Index Supply Estimated Natural Streamflow Reconstruction
and Gage Record
Highest and lowest 20-year periods (non-overlapping)
Reconstruction: 1450-2013, gage: 1940-2012Data smoothed with a 20-yr running average
4 21 35
5 1 4 2 3

Rio Grande Otowi Water Year Flow and June-July Precipitation
On an annual basis, Rio Grande flow and June-July precipitation are uncorrelated
Data: 1659-2002 (monsoon to 2008) smoothed with a 20-year moving average

In the western US, tree-ring reconstructions have become a useful tool for planning and management…….
Colorado River Commission, 1922, from Water Resources Archive, CSU
These include:
• The long view
• Worst-case scenarios
• Testing system reliability
• Plausible futures
• Communication of risk c
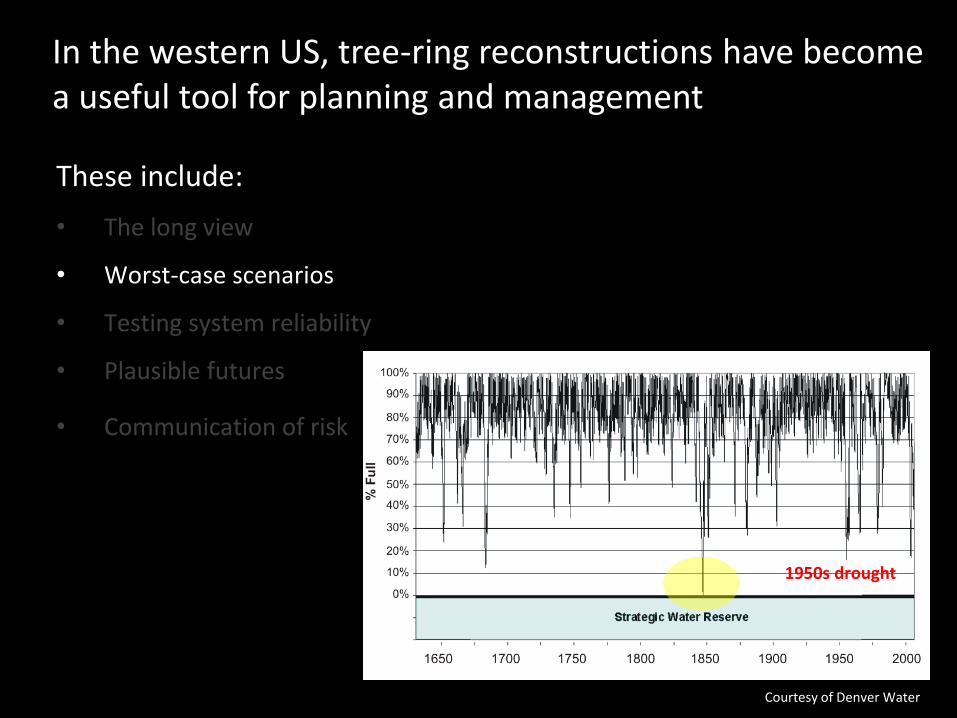
1950s drought
In the western US, tree-ring reconstructions have become a useful tool for planning and management…….
These include:
• The long view
• Worst-case scenarios
• Testing system reliability
• Plausible futures
• Communication of risk
Courtesy of Denver Water

In the western US, tree-ring reconstructions have become a useful tool for planning and management…….
These include:
• The long view
• Worst-case scenarios
• Testing system reliability
• Plausible futures
• Communication of risk
From Nowak, USBR

Probability of Lower Colorado R. Basin Shortage
13 MAF 13.5 MAF 14
MAF 14.5 MAF 15
MAF 15.5 MAF 16
MAF
Based on 1226 18-yr traces from tree-ring reconstructed flow, run through Colorado River Simulation System model
In the western US, tree-ring reconstructions have become a useful tool for planning and management…….
These include:
• The long view
• Worst-case scenarios
• Testing system reliability
• Plausible futures
• Communication of risk
K. Morino unpublished

http://www.denverwater.org/SupplyPlanning/DroughtInformation/UncertainFuture/
In the western US, tree-ring reconstructions have become a useful tool for planning and management…….
These include:
• The long view
• Worst-case scenarios
• Testing system reliability
• Plausible futures
• Communication of risk

Are droughts of the past useful analogues for the future?
• The climate of the past will not be replicated in the future, but the range of natural climate variability is likely to continue, underlying human-induced changes to climate.
• We should anticipate droughts similar to those of the past several thousand years in the future, with the added effects of climate change – and particularly warmer temperatures.
Recommended


![DROUGHT MONITOR [IHP-VIII] - UNESDOC Databaseunesdoc.unesco.org/images/0023/002319/231937e.pdf · DROUGHT MONITOR [IHP-VIII] International Hydrological Programme. THE CONTEXT Drought](https://img.dokumen.tips/doc/110x75/5b99333609d3f26e678b70e8/drought-monitor-ihp-viii-unesdoc-drought-monitor-ihp-viii-international.jpg)


