I
ISTITUTO AGRONOMICO
PER L'OLTREMARE
UNIVERSITÀ DEGLI STUDI DI FIRENZE
FIRST LEVEL MASTER DEGREE IN
IRIGAIRTION PROBLEMS
IN DEVELOPING COUNTRIES
THESIS ON
Drip Irrigation System
in arid area of Iraq for Olive -Cultivation
By
UQBA ISMAEL JASIM
Supervisor Dott.Agr. IVAN SOLINAS
Florence. Italy. 2012/2013

II
DEDICATION
To those who told me go to be doing something. And we are
proud of what you will do.
Despite, their need for my stay with them.
They said: Go and we will wait.
To my wife and my children, I dedicate this work with my
greetings for all.
Uqba Ismael Jasim

III
ACKNOWLEDGMENT
I would like to express my graduated to all those in one way or another
made possible this master program
-the IAO and through it Iraqi-Italy cooperation and consequently their
respective Ministry of foreign Affairs, for the initiative and the hospitality
provided for us.
-My Supervisor, Dott. Agr. Ivan Solinas, for his technical support and his
lofty sense of sharing.
- All the staff of IAO especially, Dr.Giovanni Totino the Director of IAO
,Pr.Elena Bresci , Tiberio Chiari , Elisa Masi , Paolo Enrico Sertoli,
Andrea Merli, etc.
-All the teachers who contributed and participated in this program for
their precious time and knowledge they shared with us.
-All the friends , colleagues and workmaster for the family spirit
maintained during the course .
THANK YOU.
IV
ABSTRACT
Iraq is an ancient agricultural country using drip irrigation is not a new development
patterns in agriculture in Iraq, as well as olive cultivation is not new, especially using
drip irrigation systems. But often occur in the irrigation system failures at any stage of
the project stages . Sometimes be in a great loss of water system , and sometimes the
system does not fully processed water requirements.
The use of information technology in the design of drip irrigation systems such as
Ve.pro.L.G.s and EPANET software provided a solution for all possible failures of
the system, both at the stage of design or construction as well as operation., as well as
this software solved the problem of lack of efficient use of water resources and
excessive irrigation where the software VeproLG.s can measures the efficiency of the
system and regularity of irrigation water distribution and irrigation efficiency and
uniformity.
Note that Software Ve.pro.L.G.S & EPANET has fed data resulting from the use of
other software, such as SPAW for the purpose of knowledge of the properties and
structure soil and CLIMWAT to obtain data on climate and rainfall rates therefore
CROPWAT be able to calculate crop water requirements (olive trees).
The choice of the arid and semi-arid areas to carry out the work and choose the olive
trees was not by chance, but because the olive trees the most important trees that have
proved successful in circumstances such as these regions Moreover, the success of an
olive grove in the region will encourage agricultural investment in this area. Where
the orchards olive many economic benefits, not only as a vegetarian cover to resolve
the problems of desertification .
V
LIST OF FIGURES
Figure 1: the map of Iraqi surface 3
Figure2: wetted area by one emitter depending on the soil type 8
Figure3 flow rate of the ponto drop 9
Figure4 Planting layout 13
Figure5 Irrigation effect on olive yield. 16
Figure6 the development of agricultural patterns in region 21
Figure7 The software utilized in design 22
Figure8 The field location on the region 23
Figure9 The result of HWSD software ,the soil structure in study area 24
Figure10 SPAW analysis result: 25
Figure 11 the map of the orchard 2 x 80m x 250m 30
Figure 12 checking under(StreamlineSL80 d.16q.0.98s0.4(1998) drip-line 34
Figure13 Checking the area under drip line 35
Figure14 The pump curve 37
Figure15 Pressure in the system 38
Figure16: Velocity in pipe-line 39
Figure17:The flow rate in pipe line outlet 40
Figure18:The roughness is 140 in pipe system 41
Figure19 : The diameter of pipe-line
42

VI
LIST OF TABLES
Table 1: The values of Kr 6
Table 2 Effect of low soil moisture 15
Table 3 Agro-climatic data of selected area 20
Table 4 :Crop water requirement 31
Table 5 The scheme supply 31
Table 6 crop irrigation schedule 32
Table 7: Ranking of drip line according to the uniformity
33

VII
THESIS CONTENTS
ACKNOWLEDGMENT……………………………………………………… III
ABSTRACT……………………………………………………………………. IV
LIST OF FIGURES V
LIST OF TABLES……………………………………………………………….. V
THESIS CONTENTS…………………………………………………………… VI
INTRODUCTION ……………………………………………………………… 1
CHAPTER I:LITERATURE REVIEW………………………………………. 5
I.1 Drip irrigation…………………………………………………………….... 5
I.1. a: Advantage of drip irrigation……………………………………… 5
I:1.b: Disadvantages of Drip Irrigation…....................... 5
I:1.c: Water Requirement under Drip Irrigation…………............................... 6
I:1.d: Irrigation Requirement…………………………………………… 7
I:1: f: Wetted Area by the Emitter……………………………………………. 8
I:1.i: Emitter selection………………………………. 9
I .2 OLIVE CULTIVATION………………………………………………… 10
I .2.1:Tolerance to Salinity……………………………………………………. 12
I.2.2:Planting layout…………………………………………………………… 12
I.2.3:Preparing the site:……………………………………………………. 13
I.2.4: Olive Irrigation………………………………………………………. 14
I.2.5:Effect of irrigation on table olive yield…………………………………….. 16
I.2.6:OIL OLIVE irrigation when water is limited……………………….. 17
I.2.7:Choosing cultivar :( Dwarf Arbequina) ………………………………. 17
CHAPTER II: METHODOLOGY AND WORK STYLE…………………….. 19

VIII
II: 1:1: About the selected area: Review Of Selected Area……………………. 19
II.1.2:Climate in study area (Wadi Almany )………………………………….. 19
II.1.3:Agriculture in region: ……………………………………………………. 20
II: 2: Methodological And Work Style ……………………………………….. 21
II: 2:1: II:2:1Google earth software……………………………………………. 22
II:2:2:HWSD Software…………………………………………………………... 23
II:2:3:SPAW Software…………………………………………………………… 25
II:2:4: CLIMWAT 2.0 software ……………………………………………. 26
II :2: 5: CROPWAT version 8.0: ……………………………………………… 26
II:2 :6: Ve.pro.L.G.s ……………………………………………………………. 27
II : 2:7: EPANET 2.0 …………………………………………………………… 28
II :2:8: The Field Plot: ………………………………………………………….. 29
CHAPTER III:RESLTS AND DISCUSSION………………………………….. 31
III :1:Crop Water Requirement……………………………………………….. 31
III:1:1 :Result of CROPWAT……………………………………………………. 32
III :1:2 : The Discussion………………………………………………………… 32
III:2: THE DRIP LINE DESINE: ……………………………………………….. 32
III:2:1: Results ………………………………………………………………….. 33
III:2:2 :Discussion:………………………………………………………………. 35
III:3: 1: The Pipe Line Design Result……………………………………………. 36
III:3:2:Discussion: ………………………………………………………………. 36
III:4 : CONCLUSION……………………………………………………………. 43
References……………………………………………………………………….. 44

IX
1
INTRODUCTION
The geography of Iraq is diverse and falls into four main regions: the desert
(west of the Euphrates), Upper Mesopotamia (between the upper Tigris and Euphrates
rivers), the northern highlands of Iraqi Kurdistan, and Lower Mesopotamia, the
alluvial plain extending from around Tikrit to the Arabian Gulf, the agriculture in Iraq
is concentrated the alluvial plane from the ancient times until this moment in
The mountains in the northeast are an extension of the alpine system that runs
eastward from the Balkans through southern Turkey, northern Iraq, Iran, and
Afghanistan, eventually reaching the Himalayas. The desert is in the southwest and
central provinces along the borders with Saudi Arabia and Jordan and geographically
belongs with the Arabian Peninsula.
The desert zone, an area lying west and southwest of the Euphrates River, is a part of
the Syrian Desert and Arabian Desert, which covers sections of Syria, Jordan, and
Saudi Arabia and most of the Arabian Peninsula. The region, sparsely inhabited by
pastoral Bedouins, consists of a wide stony plain interspersed with rare sandy
stretches. A widely ramified pattern of wadis–watercourses that are dry most of the
year–runs from the border to the Euphrates. Some wadis are over 400 km (250 mi)
long and carry brief but torrential floods during the winter rains.
Western and southern Iraq is a vast desert region covering some 64.900 square miles
(168.000 square km), almost two-fifths of the country. The western desert, an
extension of the Syrian Desert, rises to elevations above 1.600 feet (490 meters). The
southern desert is known as Al-Hajarah in the western part and as Al-Dibdibah in the
east. Both deserts are part of the Arabian Desert. Al Hajarah has a complex
topography of rocky desert, wadis, ridges, and depressions. Al-Dibdibah is a more
sandy region with a covering of scrub vegetation. Elevation in the southern desert
averages between 1.000 and 2.700 feet (300 to 800 meters). A height of 3.119 feet
(951 meters) is reached at Mount 'Unayzah at the intersection of the borders of
Jordan, Iraq and Saudi Arabia. The deep Wadi Al-Batin runs 45 miles (75 km) in a
northeast-southwest direction through Al-Dibdibah. It has been recognized since 1913
as the boundary between western Kuwait and Iraq.
Desertification is a land degradation problem of major importance in the arid regions
of the world. Deterioration in soil and plant cover has adversely affected nearly 50
percent of the land areas as the result of human mismanagement of cultivated and

2
range lands IRAQ have the largest percentage of their arid lands affected.
Overgrazing and woodcutting are responsible for most of the desertification of
rangelands, cultivation practices inducing accelerated water and wind erosion are
most responsible in the rain-fed croplands, and improper water management leading
to salinization is the cause of the deterioration of irrigated lands. In addition to
vegetation deterioration, erosion, and salinization, desertification effects can be seen
in loss of soil fertility, soil compaction, and soil crusting. Urbanization, mining, and
recreation are having adverse effects on the land of the same kind as is seen on range,
dry farming, and irrigated lands. Combating desertification can be done successfully
using techniques already known if financial resources are available and the political
will to act is present. West of the flood plain, the terrain rises steadily toward the west
onto a broad plain that is essentially a desert plateau. Valleys (seasonal streams) flow
downslope toward the east into the Euphrates River. Elevations rise to 900- 1,200 feet
(275-365 meters) on the plateau. In the river valleys, elevations decrease from north to
south from their entry points, Syria at 1,100 feet (335 meters) and Turkey at 1,800
feet (550 meters), to 100-180 feet (30-55 meters) just a few miles north of Baghdad
and to 30-80 feet (9-25 meters) in the flood plain from As Samawah southward to the
gulf. Roughly the southernmost eighth of the river valleys is marshy with areas that
become seasonal lakes. In eastern Iraq, both valleys and permanent rivers flow toward
the west to join the Tigris River from the higher terrain in Iran. It has been reported
that many of the marsh areas have been drained entirely or seriously deprived of water
by reservoir construction upstream. This exacerbates dust problems as the former lake
and marsh beds are exposed and dry silt lifts into the air in the Wind.
Iraq has a huge surface water resources, but nevertheless there are large tracts of
ground suffer from water scarcity and desertification caused by lack of or sometimes
the lack of vegetation resulting from the lack of rainfall and most of the years. That
the height in this region of the level from the level of Euphrates River and the rugged
terrain made it difficult to provide this region with the waters of the Euphrates River.
Generally this area is rich in groundwater arable.
The last ten years have seen the exploitation of a successful underground water by
drilling wells and installing irrigation systems pivotal for the cultivation of wheat
crop., But wheat crop is harvested in the May and remaining land barren during the
summer months and suffer from erosion and sand encroachment and thus the
continuing problem of desertification ..

3
For this reason occurred optional for the cultivation of olive orchards using drip
irrigation systems to bring about a shift in the nucleolus environment of the region
referred to.
Figure 1 the map of Iraqi surface
Why olive tree?
Many reasons shortened made difficult choice heading towards olive trees or rather s
the cultivation of olive groves and in particular to this region and these reasons
include:
1-The olive tree perennial evergreen tree and thus have an important role in improving
the ecosystem in the region and address desertification and desert stop crawling.
4
2- Have economic importance of food and thus contribute to the improvement of the
economy and achieve food security through direct consumption of fruits or olive oil
extraction and use in human nutrition and some industries such as soaps and
cosmetics
3-while trees are astoundingly tolerant of a wide range of soil conditions; they don’t
like wet feet .They prefer the same kind of soil that everything else like, but in most
places around the world thy are relegated to otherwise marginal areas; hillsides that
are not readily tilled or are unsuitable for grass, small pieces of land that are not useful
for row-farmed crops, etc.
4- Olive is a major tree crop in the Mediterranean region and is moderately salt
tolerant. Recent studies suggest that olives can be irrigated with water containing
3200 mg/l of salt (ECw of 5 ds/m) producing new growth at leaf (Na) levels of 0.4–
0.5% d.w. Salt tolerance in olives appears to be cultivar-dependent and is likely due to
control of net salt import to the shoot. The mechanism is located within the roots and
prevents salt translocation, rather than salt absorption. It is probably that K–Na
exchange at the plasmalemma is involved in regulating the transport of Na+ to the
shoot, while calcium plays a key role in limiting the toxic effects of Na+ on integrity
of the plasma membrane in root cells. In addition, osmotic adjustment, stomatal
closure and leaf abscission appear to play a role. Low and moderate salinity is
associated with reduction of CO2 assimilation rate, stomatal and mesophyll
conductance. Salinity reduces the fruit weight and oil content while increases the
moisture content of fruits. Total phenol content in the olive oil is not affected by
moderate NaCl salinity, while the ratio of unsaturated/saturated fatty acids decreases.
5- Climate in the region (Valley almany) suitable for olive cultivation success in terms
of the temperatures required for flowering and fruit development stages.
6- Cultivation of olive groves in the region and contribute significantly to the
installation and reduce soil erosion resulting from monsoon during the dry summer
7 - Drip irrigation has proved a great success with olive trees as a way to achieve
regularity and irrigation efficiency and commensurate with the trees requirements and
the way the growth of roots.
5
CHAPTER I: LITERATURE REVIEW.
I.1 Drip irrigation:
Drip irrigation is a controlled irrigation method or is a watering method which
delivers water to plant slowly and right where they need it. Drip irrigation system
combine flexible poly drip tubing and drip irrigation emitters or dripper; to both
conserve water and save money. (Burt and Styles)
I.1. a: Advantage of drip irrigation
There are many targets we reach with drip irrigation and many claims as to the
advantages have been and are still being made. Currently the following advantages are
-Favorable soil water content: applying water more frequency allows to maintain
water content values high and stable in time
-High efficiency: water is in pipes that’s means reduced evaporating surface
-High uniformity in water distribution.
-Possibility of using a small flow.
-No surface runoff.
-Water saving.
-Reduced labor and that’s lead to reduce the costs of production.
-Reduced energy.
-No needs for slope modification and no erosion.
-Flexibility in fertirrigation operation.
-Reduced the risks of salinity.
-Possibility of using cold water.
-Reduced the weeds presence.
-Possibility of using more than one dripper per tree when the tree be large.
-Easy automatization.
I:1.b: Disadvantages of Drip Irrigation
The major disadvantages of the localized drip irrigation are:
-The movement of salts to the fringes of the wetted area the of the soil may cause
salinity problems through the leaching of salts by the rain to the main root zone .This
problem can be avoided if the system is turned on when it rain especially when the
amount of rain is not enough to leach the salts beyond the root zone depth.
-The relatively high investment cost of the system.
6
-The animals like rodents, dogs, and other which looking for the water may be can
damage the lateral lines.
-Localized system is prone to clogging because of the very small aperture of the water
emitting devices hence the need for proper filtration and at times chemigation
-For crops of very high population density the system may be uneconomic because of
the large number lateral lines emitters required.
-The special development of the root zone is limited and concentrated in the small
area near the dripper thus making plants more susceptible to wind throw.
I:1.c: Water Requirement under Drip Irrigation
Evapotranspiration is composed of the evaporation from the soil and the transpiration
of the plant. Since under localized irrigation only a portion of the soil is wetted, the
evaporation component of evapotranspiration can be reduced according using the
appropriate ground cover reduction factor Kr.
For the design of localized irrigation systems:
ETcrop=ET0*Kc*Kr
Where:
ET0= reference crop evapotranspiration using the Penman-Monteinth method.
Kc = Crop coefficient (crop factor)
Kr = ground cover reduction factor
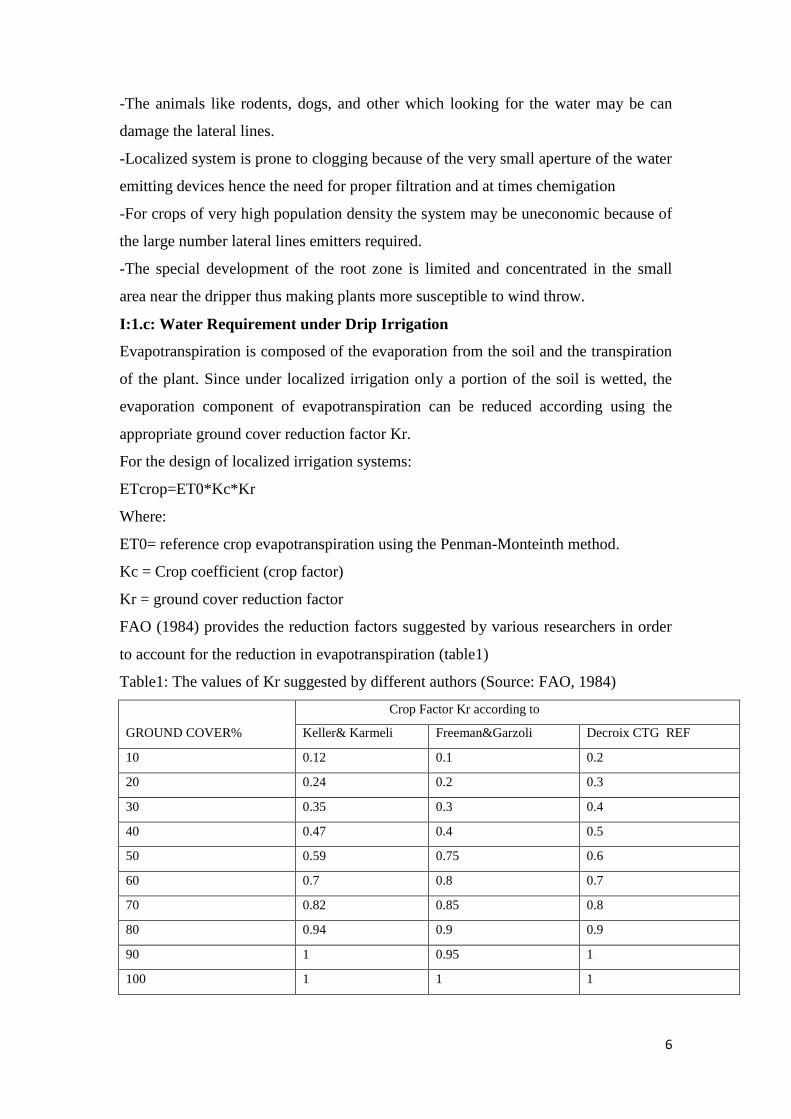
FAO (1984) provides the reduction factors suggested by various researchers in order
to account for the reduction in evapotranspiration (table1)
Table1: The values of Kr suggested by different authors (Source: FAO, 1984)
GROUND COVER%
Crop Factor Kr according to
Keller& Karmeli Freeman&Garzoli Decroix CTG REF
10 0.12 0.1 0.2
20 0.24 0.2 0.3
30 0.35 0.3 0.4
40 0.47 0.4 0.5
50 0.59 0.75 0.6
60 0.7 0.8 0.7
70 0.82 0.85 0.8
80 0.94 0.9 0.9
90 1 0.95 1
100 1 1 1
7
I:1.d: Irrigation Requirement
FAO (1984) defined the net irrigation requirements (IRn) as the depth of the
water required for normal crop production over the whole cropped area, excluding
contribution from other source. Using this following equation:
IRn= ETcrop*Kr_R+ LR
By incorporating the irrigation efficiency in the calculations we can obtain the gross
irrigation requirement (IRg)
IRg = (ETcrop*Kr)/Ea _R +LR
Where
IRn =net irrigation requirement
ETcrop= crop evapotranspiration
Kr=Ground cover reduction factor
R=water received by plant from sources other than irrigation (rainfall)
LR =water amount required for the leaching of salts
Ea = field application efficiency
According to the Railbird 1980 the following efficiencies must be used when the
surface area wetted by one dripper does not exceed (60) cm in diameter
The hot and dry climate Ea= 0.85
The moderate climate Ea = 0.90
The humid climate Ea =0.95
1:1e: The Percentage of Wetted Area
The percentage of wetted area (Pw) is the average of horizontal area wetted within the
top 30 cm of the plant root zone depth in relation to the total cropped area.
This number depends on the desirable percentage of wetted area and the area wetted
by one emitter.
8
often approaches 100% for closely spaced less than 1.8 m apart Keller and Bliesner
(1990) present a relationship that may exist between the potential production and Pw.
They suggest that Pw
Taking this and experience from elsewhere into consideration a Pw of 50-60% for
low rainfall areas and 40% for high rainfall areas is proposed for widely spaced crops
(FAO 2007).
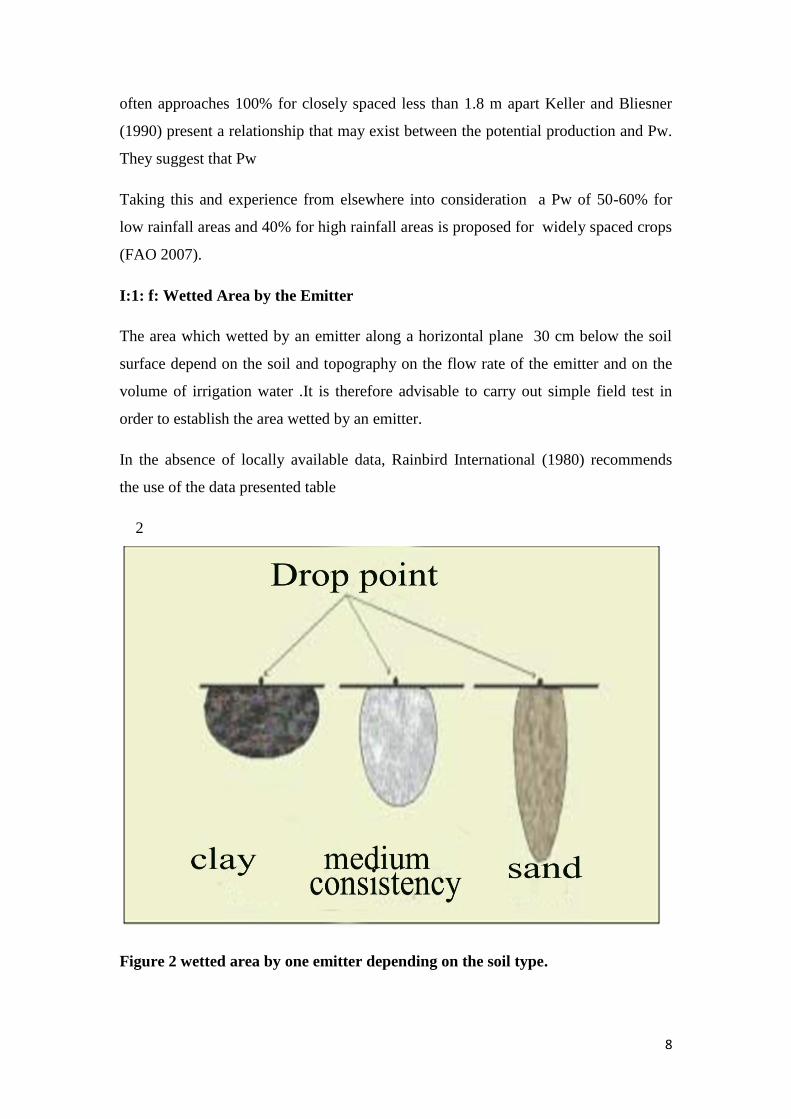
I:1: f: Wetted Area by the Emitter
The area which wetted by an emitter along a horizontal plane 30 cm below the soil
surface depend on the soil and topography on the flow rate of the emitter and on the
volume of irrigation water .It is therefore advisable to carry out simple field test in
order to establish the area wetted by an emitter.
In the absence of locally available data, Rainbird International (1980) recommends
the use of the data presented table
2
Figure 2 wetted area by one emitter depending on the soil type.
9
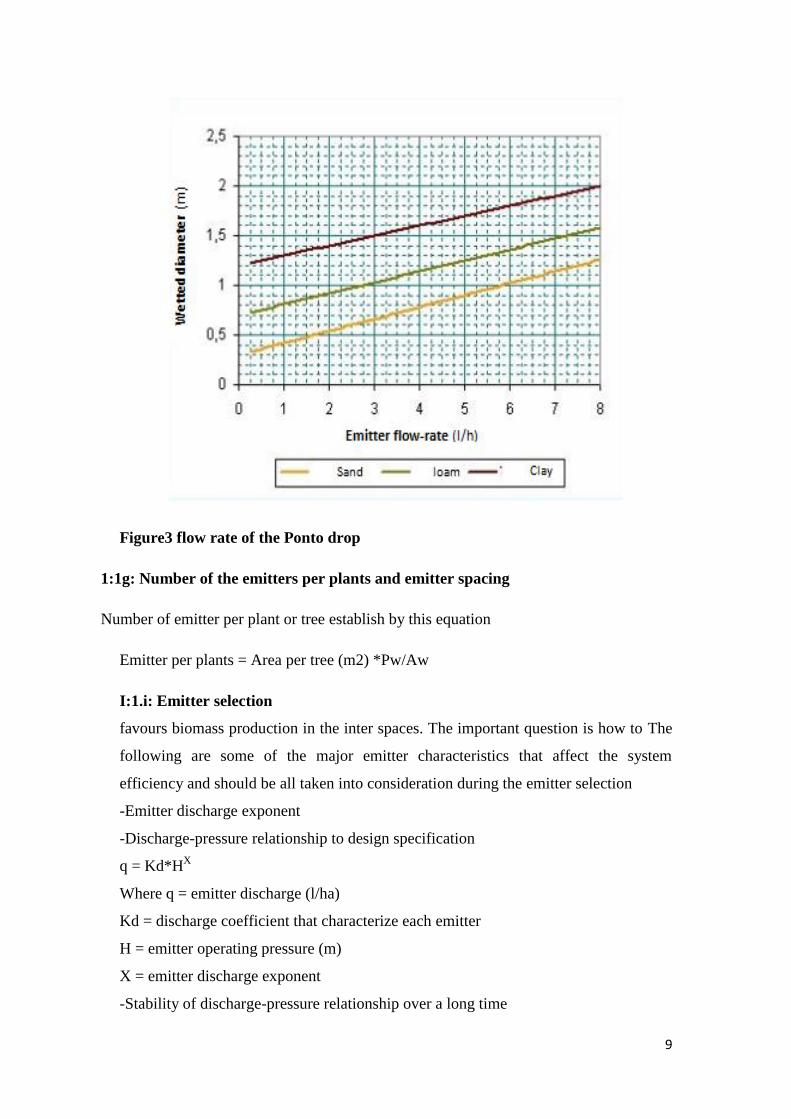
Figure3 flow rate of the Ponto drop
1:1g: Number of the emitters per plants and emitter spacing
Number of emitter per plant or tree establish by this equation
Emitter per plants = Area per tree (m2) *Pw/Aw
I:1.i: Emitter selection
favours biomass production in the inter spaces. The important question is how to The
following are some of the major emitter characteristics that affect the system
efficiency and should be all taken into consideration during the emitter selection
-Emitter discharge exponent
-Discharge-pressure relationship to design specification
q = Kd*HX
Where q = emitter discharge (l/ha)
Kd = discharge coefficient that characterize each emitter
H = emitter operating pressure (m)
X = emitter discharge exponent
-Stability of discharge-pressure relationship over a long time
10
-Manufacture coefficient of variation
-Range of operating pressure
-Susceptibility to clogging
-Type of emitter connection to the lateral and head losses.
I .2 OLIVE CULTIVATION:
Olive (Olea europaea L.) is an evergreen tree grown primarily between 30 and 45°
latitude in both hemispheres. In 2008 total harvested area was over 10 500 000 ha,
95.5 percent of which was concentrated in ten countries surrounding the
Mediterranean Sea (FAO,2011). Spain, Italy and Greece are the main producers of
virgin oil followed by Tunisia, Syria, Turkey and Morocco (years 2002-2008). About
90 percent of the world production of olive fruit is for oil extraction, the remaining 10
percent for table olives. The world cultivated area of olives in 2009 was over 9.2
million ha with an average yield of 2.1 tone/ha (FAO, 2011).The evolution of olive
production over the last decades in the principal countries. European Union countries
produce 78 percent and consume 68 percent of the world's olive oil.
resistance to drought, Olive trees have been sparsely planted for centuries, without
irrigation, on marginal lands in Mediterranean climate conditions because of their
high lime and salinity. Typical densities of traditional groves are between 50 and 100
tree/ha with trees severely pruned to stimulate vegetative growth and renewal of the
fruiting surface, and the soil periodically tilled. Fruit yields are low, ranging from less
than 1 up to 5 tones/ha of olives. Although traditional groves vary in cultivar
composition, tree density, training system, degree of mechanization and chemical
inputs, they are still the most widespread production system and a landmark of
Mediterranean landscapes. Intensive orchards have a density of between 200 and 550
tree/ha, which translates into a higher fraction of intercepted radiation that leads to
higher productivity per unit land area than traditional systems, particularly during the
first 10 years of production. Trees are trained to a single trunk for mechanical
harvesting and the soil is often managed by temporary or permanent grass cover to
reduce erosion and ease traffic in wet periods. In areas of annual rainfall higher than
600 mm, production can be maintained under rainfed conditions in soils with good
water-holding capacity. However, irrigation plays an important role in the drier areas,
and/or for soils with limited water storage., irrigation plays an important role to
11
stabilizing yields in the years of low rainfall. Irrigation is becoming common in the
intensive orchards as it allows early onset of production (from the second to fourth
year after planting), high yields (averages up to 10-15 tone/ha) under optimal
conditions and less variability because of alternate bearing. Most of the world's olive
area is composed of the two systems described above. However, in the last 15 years
very high density, hedgerow type, olive orchards (from 1 000 to 2 000 tree ha) have
been developed to further reduce harvesting costs using over-the tree harvesting
machines. Because of the higher ETc demand of the dense canopies and the low soil
volume available for each tree, irrigation is needed. Average yields can be quite high
(5-15 tons/ha) in the first years of production (third to seventh year after planting) and
may average 10-14 tone/ha over a 10-year period, but there are questions about the
sustainability of high yields in the long term, and about the adaptation of many
cultivars to this production system. The area devoted to these super-intensive
plantations is about 100 000 ha worldwide.
The arid and semi-arid areas of West Iraq are becoming deserts. Most of the research
and development projects in these areas aim at developing alternative technologies to
reduce land degradation and favor sustainable economic activities. The ‘spineless
cactus-alley cropping system’ is an interesting alternative in the low rainfall areas of
North Africa. This system limits land degradation by the use of perennial crops,
produces cheap and drought resistant sources of feed, and promote the adoption of
this technology. A bio-economic model has been developed to identify the conditions
of development of the ‘spineless cactus-alley cropping system’ in an agro-pastoral
community of Central Tunisia. Scenarios relating to different types of institutional
support, either monetary or informational, were analysed. The results revealed larger
cash flow, more livestock and less cereal cultivation on marginal land. Adoption of
the technology is clearly favored by public financial support and also largely by
transmission of information on the expected yield of the system. The findings suggest
that extension services play a crucial role in creating awareness among farmers of the
impact of technology in terms of yields and income diversification. Olive trees can
grow in nutrient-poor, but well-drained soils. They need full sun for fruit production
and slight winter chill for the fruits to set. Olive trees should not be planted in areas
where temperature falls below -5οC because they do not tolerate very low
temperatures and get seriously damaged by winter and spring frosts. A safe criterion
for choosing an area is the presence of undamaged olive trees for at least twenty years
12
in the vicinity. Olive trees are also damaged from hot and dry air, particularly during
flowering and fruit setting. Also, in areas with low air circulation and high humidity,
diseases such as leaf spot appear more easily.
Another criterion for the selection of the planting area is the availability of manpower,
especially during the harvesting period, as well as the presence of processing units
nearby. The decision must also take into account the annual rainfall. Thus, in low
rainfall areas (200-300 mm), olive yield is satisfactory in soils with good water
retaining capacity, unless irrigation is applied. In high rainfall areas (400-600 mm)
olive yield is good on condition that adequate drainage is provided. In fields with
steep slopes, contour cultivation on terraces must be employed. In this case,
specialized tractors (caterpillar or crawler tractors) and other vehicles should be used
to minimize the danger of overturn.
I .2.1:Tolerance to Salinity:
Olive (Olea europaea L.) is a major tree crop in the Mediterranean region and is
moderately salt tolerant. Recent studies suggest that olives can be irrigated with water
containing 3200 mg/l of salt (ECw of 5 dS/m) producing new growth at leaf Na levels
of 0.4–0.5% d.w. Salt tolerance in olives appears to be cultivar-dependent and is
likely due to control of net salt import to the shoot. The mechanism is located within
the roots and prevents salt translocation, rather than salt absorption. It is probably that
K–Na exchange at the plasmalemma is involved in regulating the transport of Na+ to
the shoot, while calcium plays a key role in limiting the toxic effects of Na+ on
integrity of the plasma membrane in root cells. In addition, osmotic adjustment,
stomatal closure and leaf abscission appear to play a role. Low and moderate salinity
is associated with reduction of CO2 assimilation rate, stomatal and mesophyll
conductance. Salinity reduces the fruit weight and oil content while increases the
moisture content of fruits. Total phenol content in the olive oil is not affected by
moderate NaCl salinity, while the ratio of unsaturated/saturated fatty acids decreases.
I.2.2 :Planting layout:
Olive tree planting scheme is decided according to the cultivation system
applied (intensive/non-intensive). For intensive cultivation, in areas with fertile soil
and sufficient rainfall or irrigation, trees are planted densely. A planting density of
200-300 trees/ha is not unusual, depending on variety. Often trees are planted very
densely (400-500 trees/ha), but later as they grow, half of them are removed,

13
especially those planted in the intermediate rows. In areas with less fertile soils and
low rainfall, planting density is reducing row.
In general three are the main planting layouts:
- The traditional, where planting distances are 7 x 7 m., 6 x 8 m, 8 x 8 m, 10 x 10 m,
depending on the area (less than 2000 trees/ha).
- The dynamic, where trees are planted densely at 5 x 6 m, 6 x 6 m, (about 2700-
3000 trees/ha).
- The very densely with Dwarf varieties like Arbequina that’s can planting even (1x
1.5m) or more than.
Figure4: Planting layout
I.2.3: Preparing the site:
Before planting, some necessary cultivation tasks must be carried out, such as
uprooting (other trees and bushes), leveling the soil, construction of terraces, etc. If
the field is uprooted, it is advised to cultivate grains or legumes for a period of 1-2
years, in order to remove all remaining roots from previous crops and minimize the
incidence of root decay in the new trees. Deep ploughing may also be necessary to
destroy weeds in combination with/without herbicides. Afterwards, the field is
14
ploughed to facilitate the growth of the root system of the new trees. Finally,
phosphate and potash fertilizers are added with the last ploughing, that will be used by
the trees during the first years of growth. Before adding any fertilizer, it is strongly
recommended to perform soil analysis by taking samples from different spots and
depths in the field (30, 60, 90 cm).
In areas with mild climate, planting takes place in November-December. In colder
areas, it is advised to plant the trees in February-March, to avoid the hazard of spring
frosts and by all means before the new vegetative cycle. Planting is made into holes
that can be dug manually or mechanically, in dimensions of about 60 x 40 cm (manual
digging) or 20 x 30 cm (mechanical digging). Planting depth should be the same as in
the nursery. In dry areas, planting holes must be 5-10 cm deeper. Digging holes can
raise certain problems. In light (sandy) soils, the walls of the hole fall in, while in
heavy (clay) soils the walls are compacted. In this case, the root system takes more
time to grow beyond these walls. The trees are planted together with the root ball and
the hole is then filled with soil. Special care must be given not to damage the roots
when pressing the earth down to firm the plants. After planting, the surrounding earth
could be covered with straw to minimize water loss from the soil.
Young trees should be irrigated regularly during the first 2-3 years and fertilized with
nitrogen every year. In addition, it is necessary to control weeds in time and take plant
protection measures against pests and other diseases.
If another annual crop is cultivated in the field (e.g. cotton, tomato, potato, pumpkins,
etc) at the same time (co-culture), it should be restricted among the rows of the olive
trees to minimize competition among the plants. As olive trees grow, the area of co-
culture should be reduced gradually.
I.2.4: Olive Irrigation
To be able to survive in hot and dry climate, olive trees have small leaves with a
protective coating and hairy undersides that slows transpiration. This facilitates
cultivation in areas where no other tree can survive. However, this defense system is
at the expense of growth and productivity of the tree. Thus, olive yield is greatly
increased by applying small amounts of water. However, if maximum yields are
desired, greater amounts of water will be needed, on condition that soil humidity does
not become excessive.
Irrigation is essential in the following cases:
- When the rainfall in the area is inadequate.
15
- When there is enough rainfall distributed only during the winter, leaving the soil
without humidity in the critical periods of spring and autumn.
- When the soil is sandy or gravelly with low water retaining capacity.
Irrigation is recommended especially in table olive varieties where large fruit size is
sought. It is also necessary in intensive plantations with densely planted trees for
maximum production. Irrigation also enhances the effectiveness of fertilization and
pruning. Finally, it may minimize the phenomenon of alternate bearing.
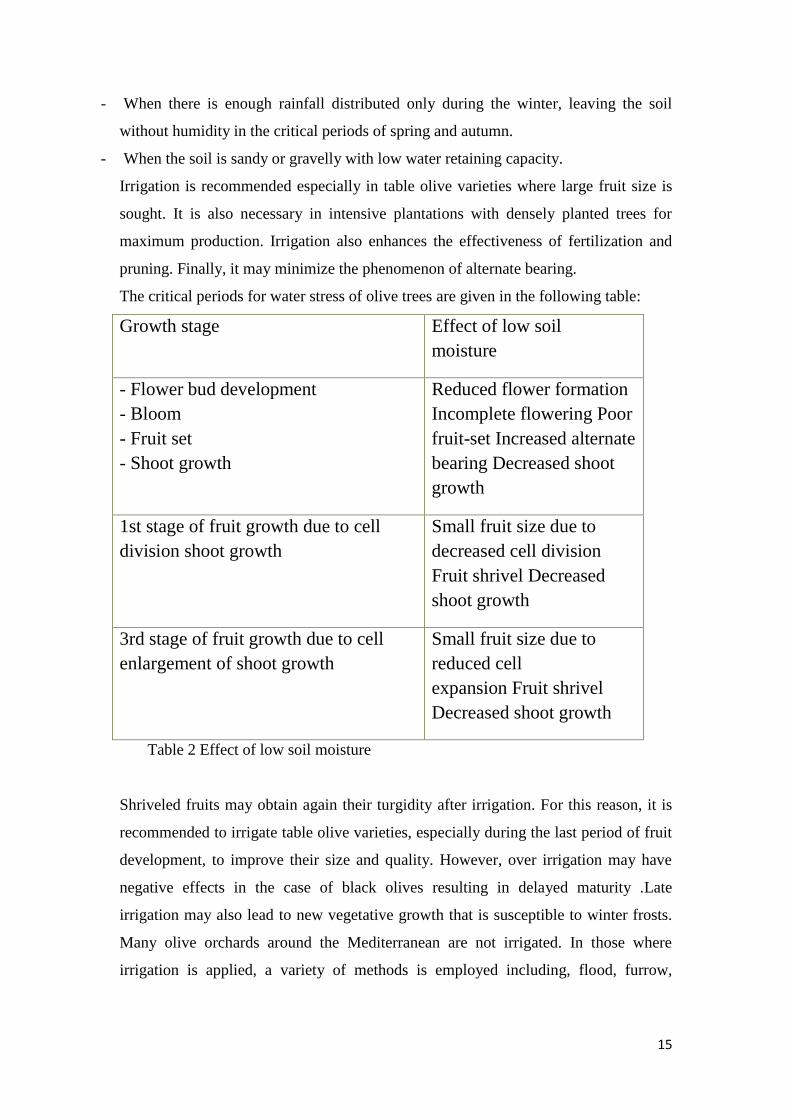
The critical periods for water stress of olive trees are given in the following table:
Growth stage Effect of low soil
moisture
- Flower bud development
- Bloom
- Fruit set
- Shoot growth
Reduced flower formation
Incomplete flowering Poor
fruit-set Increased alternate
bearing Decreased shoot
growth
1st stage of fruit growth due to cell
division shoot growth
Small fruit size due to
decreased cell division
Fruit shrivel Decreased
shoot growth
3rd stage of fruit growth due to cell
enlargement of shoot growth
Small fruit size due to
reduced cell
expansion Fruit shrivel
Decreased shoot growth
Table 2 Effect of low soil moisture
Shriveled fruits may obtain again their turgidity after irrigation. For this reason, it is
recommended to irrigate table olive varieties, especially during the last period of fruit
development, to improve their size and quality. However, over irrigation may have
negative effects in the case of black olives resulting in delayed maturity .Late
irrigation may also lead to new vegetative growth that is susceptible to winter frosts.
Many olive orchards around the Mediterranean are not irrigated. In those where
irrigation is applied, a variety of methods is employed including, flood, furrow,
16
sprinklers, hanging drippers, surface drip irrigation, and during the last years also sub-
surface drip irrigation.
In surface drip irrigated orchards, different practices are followed. In most cases, one
drip-line per row of trees will be placed on the ground. Usage of two drip-lines per
row is also applied. In some orchards, the drip-line is hung on the trees to enable
criss-cross cultivation.
Irrigation frequency depends on water availability so as to ensure sufficient soil
moisture at the critical stages of the crop. The amount of water is different every time
and depends on soil type, age and size of the trees and other factors. For traditional
low tree densities, the application of a constant amount of water, 80-120
liters/day/tree (in heavy soils), will provide good results.
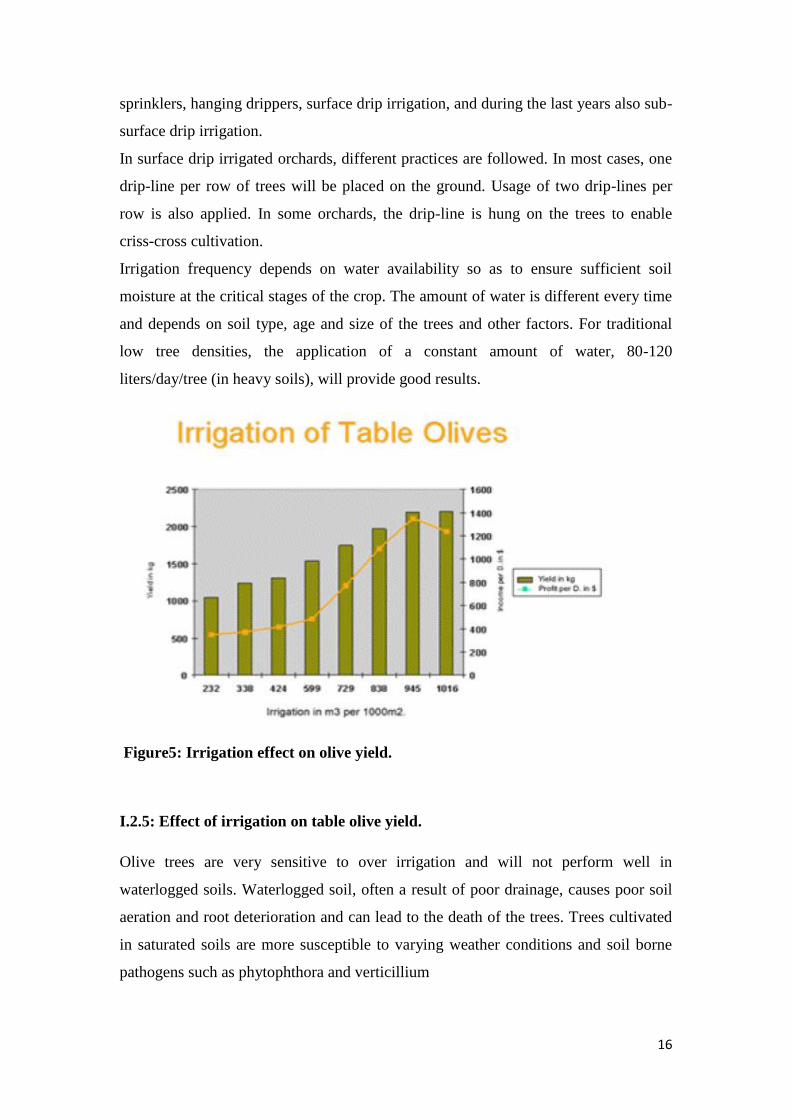
Figure5: Irrigation effect on olive yield.
I.2.5: Effect of irrigation on table olive yield.
Olive trees are very sensitive to over irrigation and will not perform well in
waterlogged soils. Waterlogged soil, often a result of poor drainage, causes poor soil
aeration and root deterioration and can lead to the death of the trees. Trees cultivated
in saturated soils are more susceptible to varying weather conditions and soil borne
pathogens such as phytophthora and verticillium
17
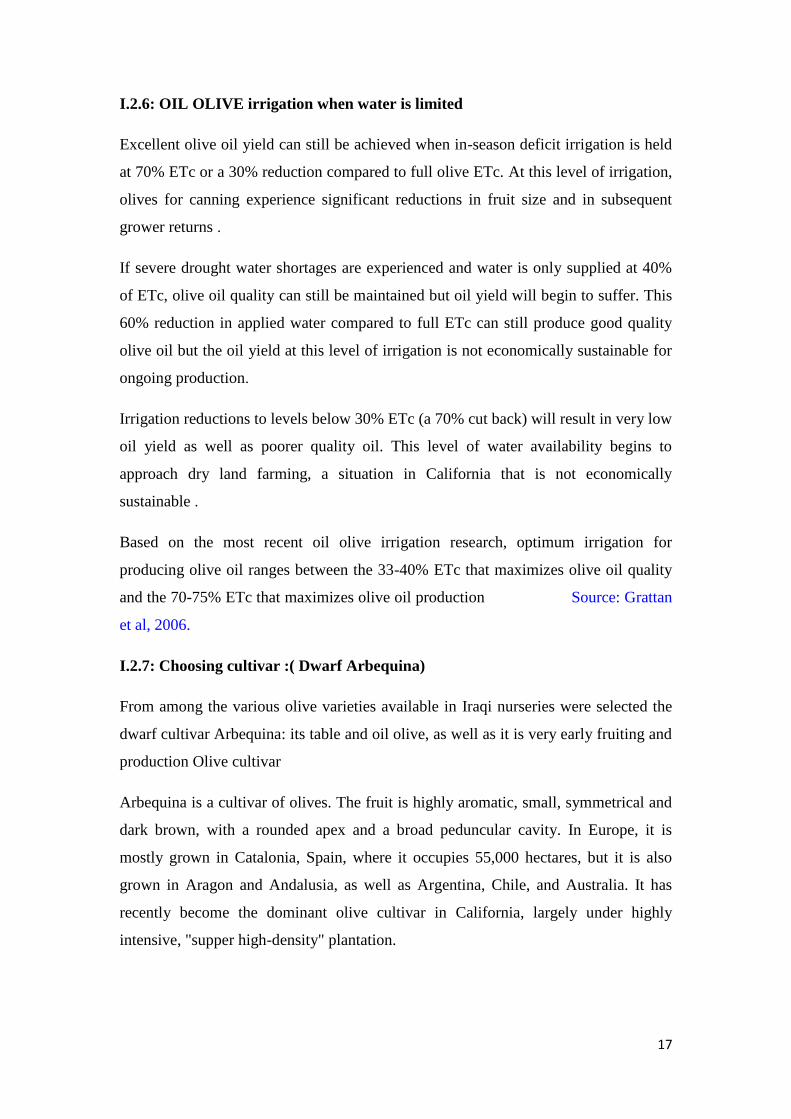
I.2.6: OIL OLIVE irrigation when water is limited
Excellent olive oil yield can still be achieved when in-season deficit irrigation is held
at 70% ETc or a 30% reduction compared to full olive ETc. At this level of irrigation,
olives for canning experience significant reductions in fruit size and in subsequent
grower returns .
If severe drought water shortages are experienced and water is only supplied at 40%
of ETc, olive oil quality can still be maintained but oil yield will begin to suffer. This
60% reduction in applied water compared to full ETc can still produce good quality
olive oil but the oil yield at this level of irrigation is not economically sustainable for
ongoing production.
Irrigation reductions to levels below 30% ETc (a 70% cut back) will result in very low
oil yield as well as poorer quality oil. This level of water availability begins to
approach dry land farming, a situation in California that is not economically
sustainable .
Based on the most recent oil olive irrigation research, optimum irrigation for
producing olive oil ranges between the 33-40% ETc that maximizes olive oil quality
and the 70-75% ETc that maximizes olive oil production Source: Grattan
et al, 2006.
I.2.7: Choosing cultivar :( Dwarf Arbequina)
From among the various olive varieties available in Iraqi nurseries were selected the
dwarf cultivar Arbequina: its table and oil olive, as well as it is very early fruiting and
production Olive cultivar
Arbequina is a cultivar of olives. The fruit is highly aromatic, small, symmetrical and
dark brown, with a rounded apex and a broad peduncular cavity. In Europe, it is
mostly grown in Catalonia, Spain, where it occupies 55,000 hectares, but it is also
grown in Aragon and Andalusia, as well as Argentina, Chile, and Australia. It has
recently become the dominant olive cultivar in California, largely under highly
intensive, "supper high-density" plantation.

18
The name comes from the village of Arbeca in the comarca of the Les Garrigues,
where it was first introduced to Europe from Palestine in the seventeenth century by
the Duke of Medina EliS
Arbequina trees are adaptable to different conditions of climate and soil, although it
does best in alkaline soils; it thrives in long, hot, dry summers, but is frost-hardy and
pest-resistant. Its relatively small cup, allows it to be cultivated under more intense,
high-density conditions than other plantation olives. The variety is very productive
and enters early into production (from the first half of November). The fruit does not
ripen simultaneously, and has an average resistance to detachment. Unlike most
varieties, Arbequina has a high germination percentage and that makes rootstocks.
The crop is costly due to the small fruit size. It is not very well suited to mechanize
harvesting, as a consequence of low weight of the oil and the abundance of pendulous
branches, but the performance in manual harvesting is much higher than the other
varieties raised in Catalonia.
Although sold as a table olive, Arbequina olives have one of the highest
concentrations of oil [20-22%] and are therefore mostly used for olive oil production.
Harvesting is easy since the trees are typically low to the ground and allow for easy
hand picking. Oils made from Arbequina are generally buttery, fruity, and very mild
in flavor, being low in polyphenols. The combination of low polyphenol levels and
high levels of polyunsaturated fat as compared with other olive cultivars means that it
has relatively low stability and short shelf-life.

19
CHAPTER II: METHODOLOGY AND WORK STYLE
II: 1:1: About the selected area: Review Of Selected Area (Wadi Almany)
Wady almany is a part of Anbar government far western Iraq near Syrian boarding . It
is arid or semi-arid area , although it is not far from the bank Euphrates river ,because
a rise undulating of surface area
However, this region has great under-ground water, and In recent years, farmers
began digging artesian wells depth of 100 - 120 and installing sprinkler systems and
special irrigation pivot for seasonal planting of the wheat crop
Anbar province is part of the plateau of the Arabian Peninsula, the surface is wavy
show him some small hills and a large number of valleys such as Wadi Horan due to
the decline of its territory and its natural plant poverty are prone to severe erosion.
Work surface and underground water and wind to diversify its surface, where
reaching the highest elevation of the western plateau near the Jordanian border to
more than 800 meters above sea level goes down in the areas of Habbaniyah to 75
meters above sea level. Cut the Euphrates River way in the western plateau and that
descend gradually towards the rocks Jabber and depressions Habbaniya and Razzazah,
and in some areas along the Euphrates River and rugged and therefore appear
limestone and gypsum on the road to the river.
II.1.2: Climate in study area (Wadi Almany )
Characterized by semi-desert climate and low rainfall and great variation between
day and night temperature and low humidity. Temperature rises in the summer to 52
degrees Celsius, winter and fall is up to 9 degrees Celsius. Wind northwest and
southwest sometimes reach a maximum speed of 21 m / sec. The average rainfall in
the winter to 115 mm.
20
Month
Min
Temp.
Max
Temp. Humidity Wind Sun Rad Eto Rain
Eff
rain
ᵒc ᵒc % km/day hours mj/m²/day mm mm Mm
January 2.5 11.9 72 225 5.2 9.5 1.47 44.3 41.2
February 3.4 13.9 64 268 5.9 12.3 2.2 33.7 31.9
March 5.5 17.7 54 311 6.7 15.9 3.47 27.7 25.8
April 9.1 22.9 44 337 7.2 19.1 5.13 14.5 14.2
May 12.8 28.9 36 337 8.7 22.6 7.03 5.6 5.5
June 16.1 33.2 32 389 10.8 26.1 9.06 0.4 0.4
July 17.6 35.5 34 389 11.1 26.2 9.48 0 0
August 17.4 35.6 37 328 10.4 24 8.4 0 0ss
September 15.6 32.4 39 325 9.5 20.3 6.1 0.2 0.2
October 12.5 26.6 45 199 7.4 14.7 4.12 11 10.8
November 7.7 20 57 173 6.3 11 2.45 26.6 25.5
December 3.8 13.8 71 199 5.6 9.2 1.53 39.9 37.4
Average 10.3 24.4 49 282 7.9 17.6 5.04
Total
203.2
Total
192.8
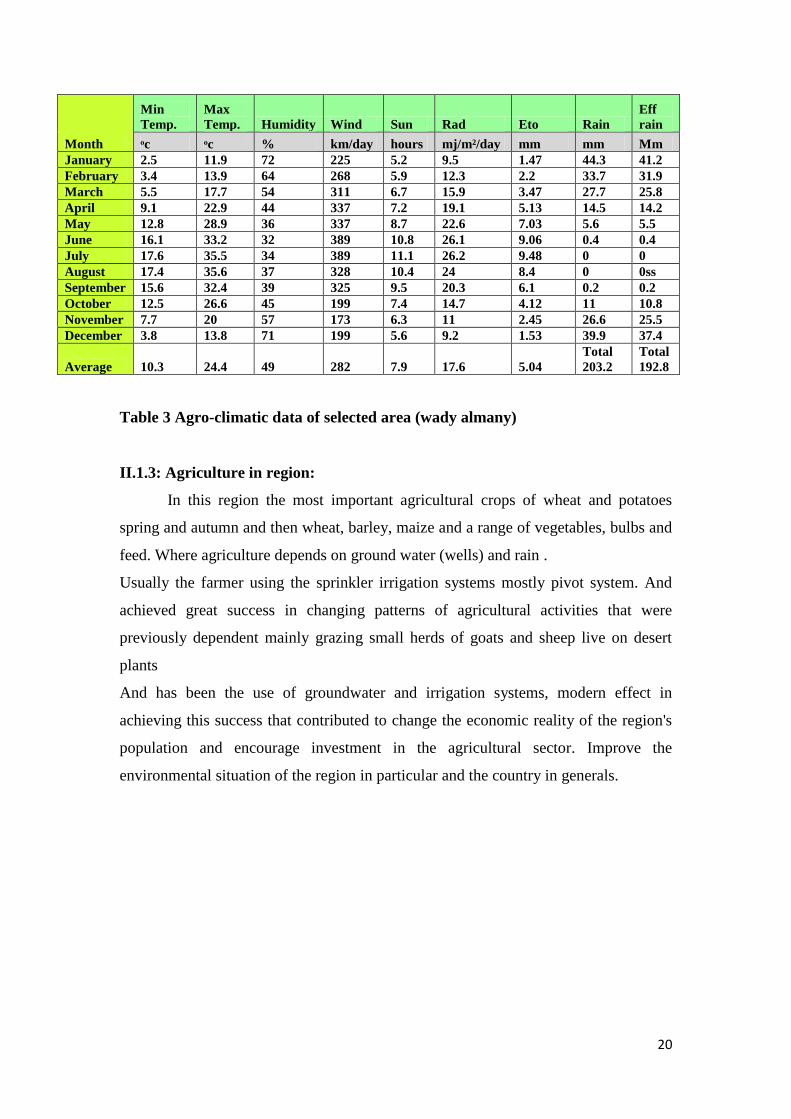
Table 3 Agro-climatic data of selected area (wady almany)
II.1.3: Agriculture in region:
In this region the most important agricultural crops of wheat and potatoes
spring and autumn and then wheat, barley, maize and a range of vegetables, bulbs and
feed. Where agriculture depends on ground water (wells) and rain .
Usually the farmer using the sprinkler irrigation systems mostly pivot system. And
achieved great success in changing patterns of agricultural activities that were
previously dependent mainly grazing small herds of goats and sheep live on desert
plants
And has been the use of groundwater and irrigation systems, modern effect in
achieving this success that contributed to change the economic reality of the region's
population and encourage investment in the agricultural sector. Improve the
environmental situation of the region in particular and the country in generals.
21
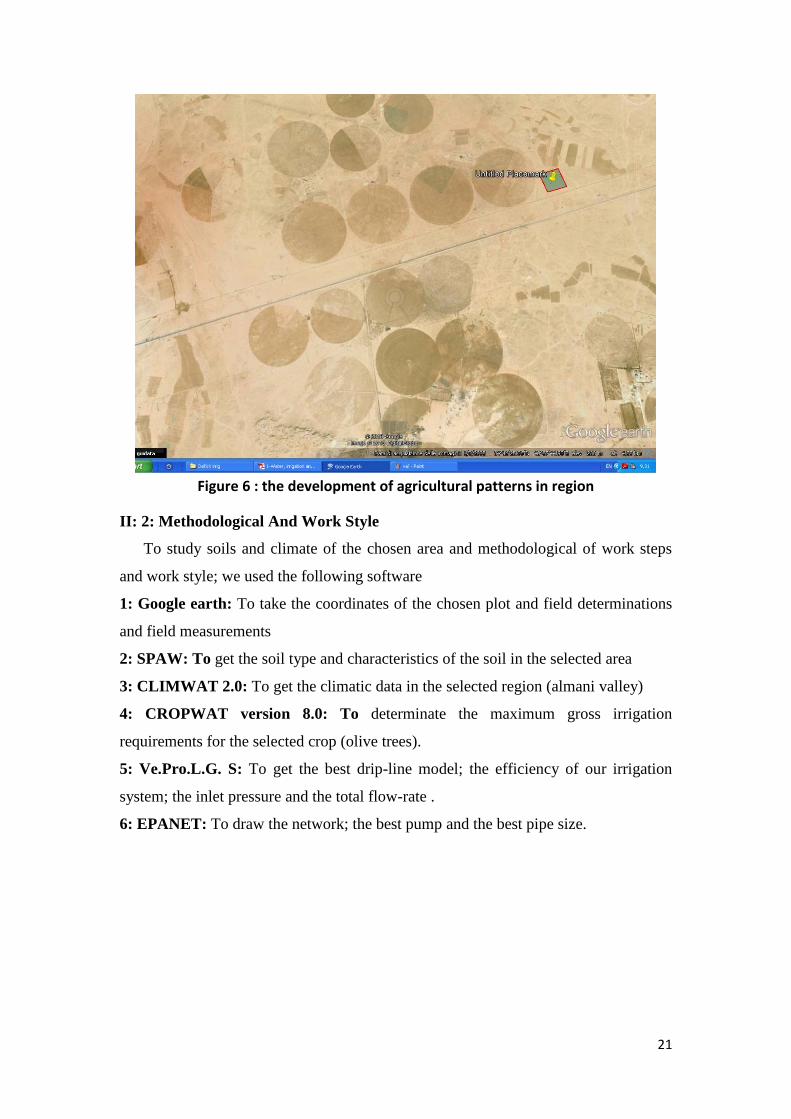
Figure 6 : the development of agricultural patterns in region
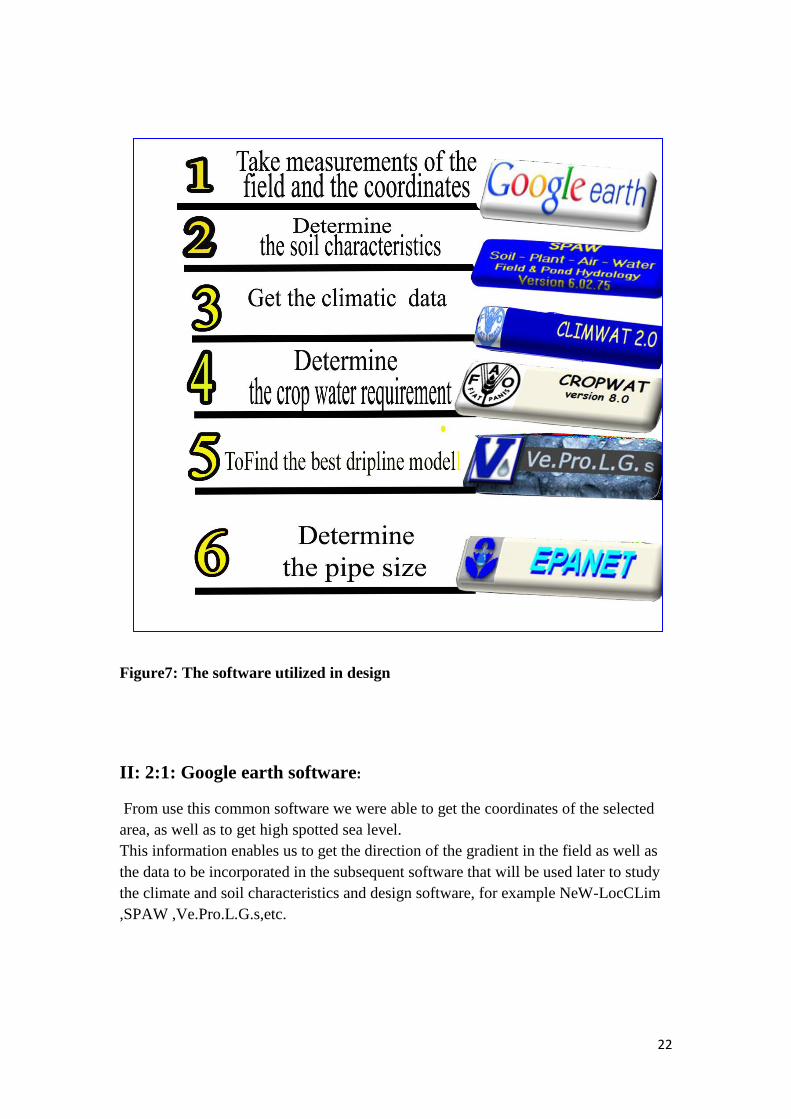
II: 2: Methodological And Work Style
To study soils and climate of the chosen area and methodological of work steps
and work style; we used the following software
1: Google earth: To take the coordinates of the chosen plot and field determinations
and field measurements
2: SPAW: To get the soil type and characteristics of the soil in the selected area
3: CLIMWAT 2.0: To get the climatic data in the selected region (almani valley)
4: CROPWAT version 8.0: To determinate the maximum gross irrigation
requirements for the selected crop (olive trees).
5: Ve.Pro.L.G. S: To get the best drip-line model; the efficiency of our irrigation
system; the inlet pressure and the total flow-rate .
6: EPANET: To draw the network; the best pump and the best pipe size.
22
Figure7: The software utilized in design
II: 2:1: Google earth software:
From use this common software we were able to get the coordinates of the selected
area, as well as to get high spotted sea level.
This information enables us to get the direction of the gradient in the field as well as
the data to be incorporated in the subsequent software that will be used later to study
the climate and soil characteristics and design software, for example NeW-LocCLim
,SPAW ,Ve.Pro.L.G.s,etc.

23
Figure 8: The field location on the region.
II: 2:2: HWSD Software:
For their knowledge of the properties of the soil and nature installed in the area of the
implementation of the work we used HWSD software. Where indicate the area that
we want to know the characteristics of and texture soil by maps of HWSD software
and checking the zone by coordinate data recorded and obtained by the use of Google
earth software before.
24
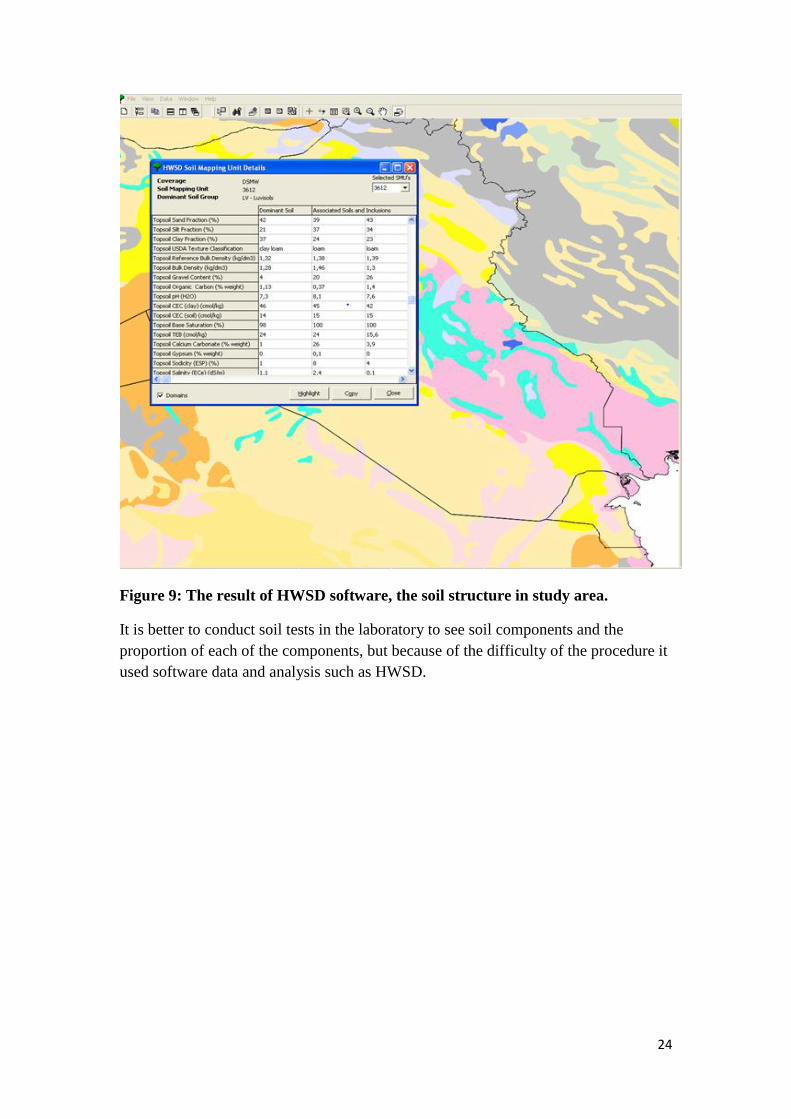
Figure 9: The result of HWSD software, the soil structure in study area.
It is better to conduct soil tests in the laboratory to see soil components and the
proportion of each of the components, but because of the difficulty of the procedure it
used software data and analysis such as HWSD.
25
II:2:3:SPAW Software s
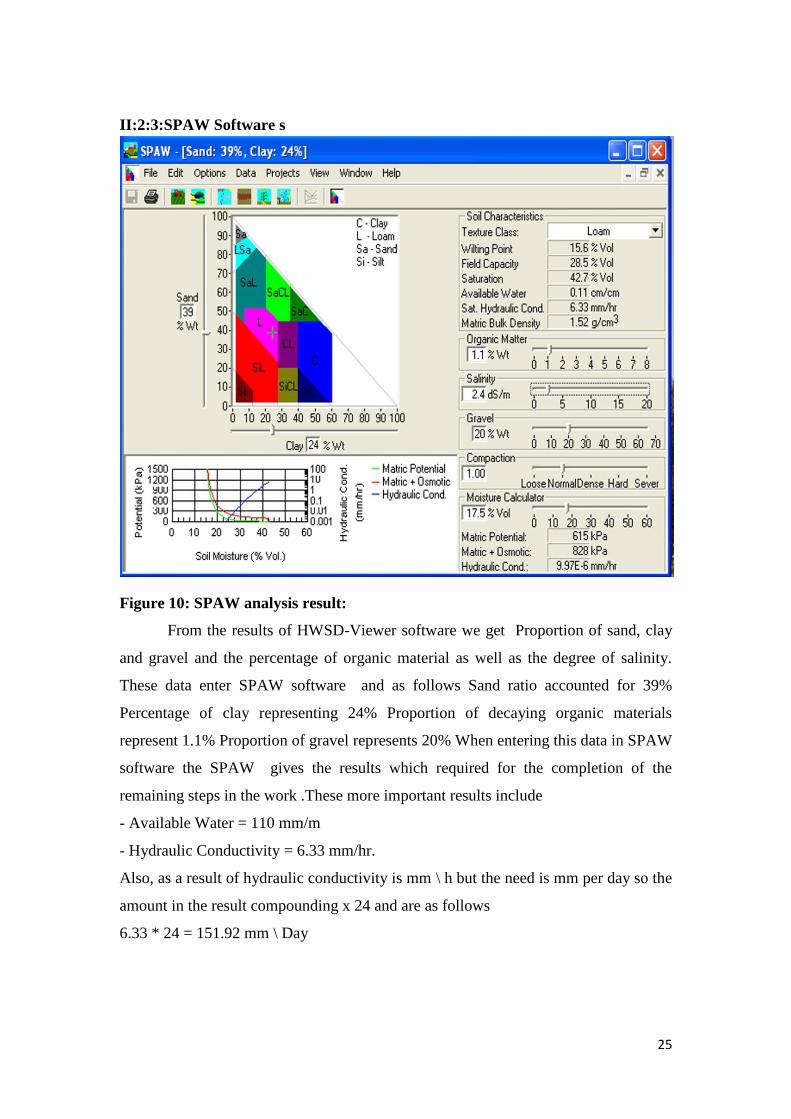
Figure 10: SPAW analysis result:
From the results of HWSD-Viewer software we get Proportion of sand, clay
and gravel and the percentage of organic material as well as the degree of salinity.
These data enter SPAW software and as follows Sand ratio accounted for 39%
Percentage of clay representing 24% Proportion of decaying organic materials
represent 1.1% Proportion of gravel represents 20% When entering this data in SPAW
software the SPAW gives the results which required for the completion of the
remaining steps in the work .These more important results include
- Available Water = 110 mm/m
- Hydraulic Conductivity = 6.33 mm/hr.
Also, as a result of hydraulic conductivity is mm \ h but the need is mm per day so the
amount in the result compounding x 24 and are as follows
6.33 * 24 = 151.92 mm \ Day

26
II:2: 4: CLIMWAT 2.0 software
To get the annual data of climatic factors in the chosen region which include (annual
rainfall, maximum and minimum temperature , wind speed ,radiation, sun hours
,humidity, and Eto ) were obtained with the data were generated by the software
CLIMWAT 2.0 from the interpolation done on the basis of data from meteorological
station (ABU-KAMAL) nearby the chosen field.
ABU-KAMAL meteorological Station is located on the Iraqi border - Syrian distance
from the chosen field of about 14 km and the Latitude 34 and the height above sea
level for 235 m and field Meteorological Station 210 m.
Sharing between CLIMWAT 2.0 and CROWAT version 8.0 ,export the CLIMWAT
2.O results and data to CROPWAT software to be able to estimate the water
requirement for olive trees or olive groves .
II:2 : 5: CROPWAT version 8.0:
CROPWAT is meant as a practical tool to help agro-meteorologists, agronomists and
irrigation engineers to carry out standard calculations for evapotranspiration and crop
water use studies, and more specifically the design and management of irrigation
schemes. It allows the development of recommendations for improved irrigation
practices, the planning of irrigation schedules under varying water supply conditions,
and the assessment of production under rainfed conditions or deficit irrigation.
Calculations of crop water requirements and irrigation requirements are carried out
with inputs of climatic and crop data. Standard crop data are included in the program
and climatic data can be obtained for 144 countries through the CLIMWAT- database.
The development of irrigation schedules and evaluation of rainfed and irrigation
practices are based on a daily soil-water balance using various options for water
supply and irrigation management conditions. Scheme water supply is calculated
according to the cropping pattern provided. Procedures for calculation of the crop
water requirements and irrigation requirements are based on methodologies presented
in FAO Irrigation and Drainage Papers No. 24 "Crop water requirements" and No. 33
"Yield response to water".
To determine the annual total gross irrigation and net total and scheme supplying .
Here we can see the total gross irrigation units as an mm/m ,we need m3/hectare ,so
we use this calculation
( 715.5/1000)m * 10000m2 =7155 m
3/hectare

27
While the total net irrigation requirement 643.9 mm
So(643.9/1000)m * 10000 = 6439 m3/hectare
DESIGN SOFTWARE
There are two software using here to design the irrigation system.
II:2 :6: Ve.pro.L.G.s
The test and design of drip lines and system units to save water and energy .
The software can also estimate the working performance of any other model of drip
lines as long as the characteristics are known and use for test the potential working
performance of existing drip system , compare options for the new design based on set
performance or costs of water and energy
Ve.pro.L.G.s need input data of specific field situation such a time , season irrigation ,
water supply, pressure at the inlet ,distance between the lines, and distance between
two plants on same line.. etc. , to give the results we need including , drip line models
matching farmer requirements like max uniformity. Etc.
Ve.pro.L.G.s software is hydraulics of each lateral is constructed according to
laboratory test not by general formula. the software is already equipped with the
operating characteristics of the many models of drip line was tested before by the
National Laboratory of irrigation within a Convention between ARSIA and university
of Pisa ,is the direct refrence to these ,after choosing from the menu pull-down .Also
this soft ware allows to checking the operation of any other kind of the line drip line
dripping ,provided us know the parameters of functional skills
whene using the full potential of the Ve.pro.L.G.s software ,must first provide details
on the specific situation in which we act. The software having these informations
through its operational instruments,produces acompplete picture of the technical and
economic evaluations . In particular on existing system,spacifying the model used
drip-line,the slop of the terrain,the length and pressure lines ,the operation tools test
lines on the header of unilateral (l/h.m) and verify lines bilaterally on the head (l / h.m
)reconstruct the operation in terms of proper maintenance and adequate water
filtration,and provide for individual lines or optionally the entire industry , the value
of the following parameters or meassurements
Estimating the unifermity of the water delivery EU %.-
The energy requirement forwater delivery (wh / m3).-

28
-Water ammaunt ,maximum,minimum,and the average of liters hour per meter in the
line (l /h.m )
- The maximum, minimum ,and average of pressure (water column height )H .
- The average of the intensity of irrigation (mm/h ).
- Water losses and waste water inseeoage ,deep perculation,and low EU%, to avoid
sxcessive portions of crops irrigated in deficit ,that expressed both in percentage ters
than in m3/ha on m
3/year .
-The total energy per year and cost of energy per year or season .
Annual incidence of the purchase cost of the drip lines in eoro/ha or optionally in euro
for the entire industry .
II : 2:7: EPANET 2.0
The software EPANET is a public-domain, water distribution system modeling
software package developed by the United States Environmental Protection Agency's
(EPA) Water Supply and Water Resources Division. It performs extended-period
simulation of hydraulic and water-quality behavior within pressurized pipe networks
and is designed to be "a research tool that improves our understanding of the
movement and fate of drinking-water constituents within distribution systems".[1]
EPANET first appeared in 1993.
EPANET 2 is available both as a standalone program and as an open-source toolkit
(Application Programming Interface in C). Its computational engine is used by many
software companies that developed more powerful, proprietary packages, often GIS-
centric. The EPANET ".inp" input file format,[3] which represents network topology,
water consumption, and control rules, is supported by many free and commercial
modeling packages. Therefore, it is arguably considered as the industry standard.
EPANET provides an integrated environment for editing network input data, running
hydraulic and water quality simulations, and viewing the results in a variety of
formats. EPANET provides a fully equipped and extended period of hydraulic
analysis that can handle systems of any size. The package also supports the simulation
of spatially and temporally varying water demand, constant or variable speed pumps,
and the minor head losses for bends and fitting. The modeling provides information
such as flows in pipes, pressures at junctions, propagation of a contaminant, chlorine
EPANET was developed by the Water Supply and Water Resouurces Division
formely the Drinking Water Research Division of theU.S. Environmental Protection
Agencys National Risk Management Research Labrotory.

29
This software contains a state more important in hydraulic analysis engine that
contain the following capabilities:
-Computes fruction head loos using either Hazen-Williams, Darcy-Weisbach,or
Chezy-Manning equations.
- Places on limit on the size of network that can be analyzed.
- Contains the minor head losses for bends, fittings,..etc.
- The model constant or variable speed pumps .
-The software can compute the pumping energy and cost .
- Various types of the valves including shutoff, check ,pressure regulating ,and flow
control valves .
- Models pressure dependent flow issuing from dripper or sprinkler head .
- Allows storage tanks to have any shape(dimeter can vary with height)
- Considers multiple demand categories at nodes,each with its own pattern of time
variation .
- EPANET can based the system operation on both simple tank level or timer controls
and on complex rule based controls .
II :2:8: The Field Plot:
The selected piece of land is a rectangle with an area of four hectares along the
rectangle 250 m and 160 m wide. Ground longitudinally divided into two equal pieces
in the form and size (2 hectares each). This land planted with olive trees and spaces 2
x 5 m ,that’s mean we have 1000 trees per hectare,4000 trees in four hectares irrigated
by drip irrigation system and on this basis we design the irrigation network where two
pieces alternately irrigated so as to provide the necessary energy to run as well as
reduce the cost of the pump.

30
Figure11 the map of the orchard 2 x 80m x 250m.
From the figure above you can see the orchard division into two parts and the water
source (the well )

31
CHAPTER III:RESLTS AND DISCUSSION
III :1:Crop Water Requirement (CROPWAT)
Table 4 :Crop water requirement,from CROPWAT software
Table5 The scheme supply

32
Table6 crop irrigation schedule
III:1:1 :Result of CROPWAT:
From the table can see the total net irrigation is equal 643.9 mm/year, can also
observe the highest requirements for water within the year is equal to 4.4 mm /day
and that in the month of July, where the highest degree of heat and lack of rain during
the summer months usually
III :1:2 : The Discussion ;
From the table of scame supply ,the maximum water requirement is 4.4mm/day
,therefore the drip irrigation must be able to fill this requirement, Therefore, the
design will be built on this basis
III:2: THE DRIP LINE DESINE:
Drip line design one of important results given from theVe.pro.l.g .s software .Drip
line design is the design of the irrigation system at field level .It is consists in
choosing on the characteristics of the field ,the drip line that provides better
uniformity while having a look at the investment cost of the irrigation system.

33
III:2:1: Results
Ranking of drip lines according to uniformity (one of Ve.pro.L.G.s resolts )
According the data that has been entered into the software, such as the dimensions of
the field and slope the earth's surface, as well as information on the crop that will be
grown, for example, the distance between the lines and the distance between plants on
the same line and water required by the crop chosen (olive trees) software gave us the
following tablefor the best drip lines according to the distribution uniformity gives the
result shown in the table .
Table 7: Ranking of drip line according to the uniformity .
From these ten drip line I choose the first item because it is give a good uniformity
and it is available in Iraqi markets (StreamlineSL80 d.16q.0.98s0.4(1998) ) and its
uniformity 94.2%.

34
Figure12: checking under (StreamlineSL80 d.16q.0.98s0.4 (1998)) chosen drip-
line
From the figure above the drip line provides uniformity 94.2%, available water 94%,
the inlet pressure 6.8m, and irrigation intensity 0.48mm/hour.
Mean Q =6.7 m3 /h meter at pressure 5.30 m
Max Q =7.6 m3 /h meter at pressure 6.87 m
Mini Q = 6.5 m3/h meter at pressure 4.84 m
35
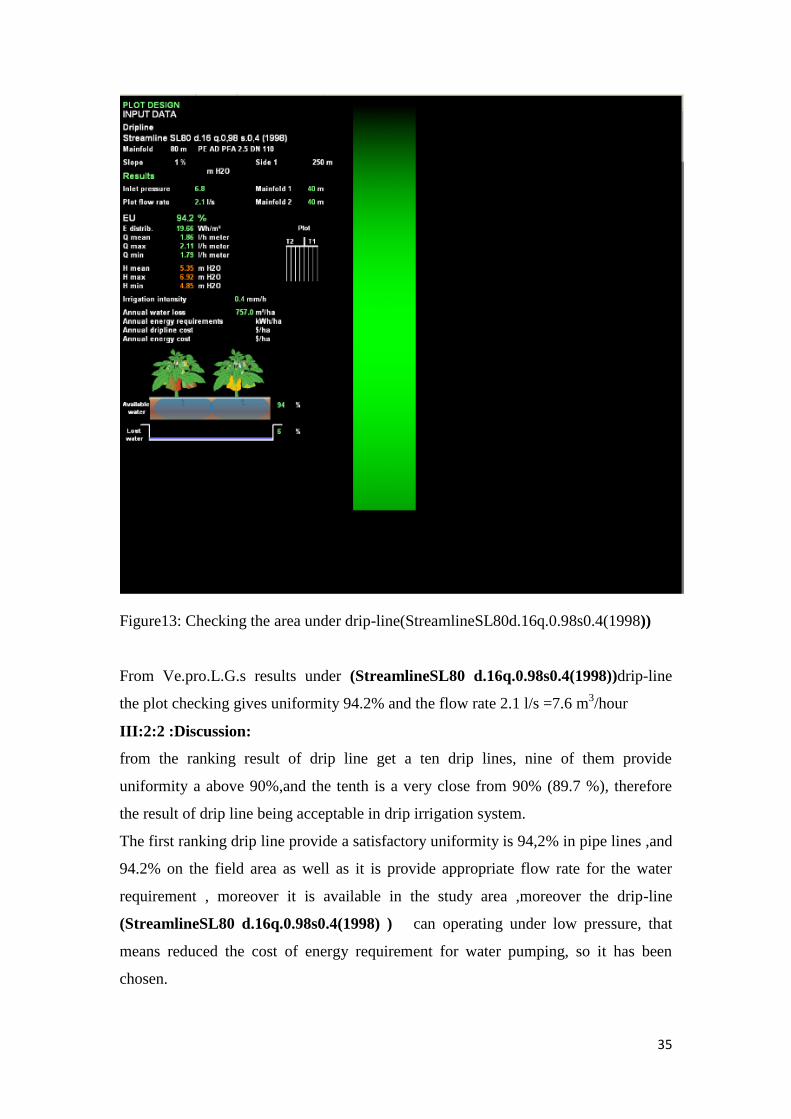
Figure13: Checking the area under drip-line(StreamlineSL80d.16q.0.98s0.4(1998))
From Ve.pro.L.G.s results under (StreamlineSL80 d.16q.0.98s0.4(1998))drip-line
the plot checking gives uniformity 94.2% and the flow rate 2.1 l/s =7.6 m3/hour
III:2:2 :Discussion:
from the ranking result of drip line get a ten drip lines, nine of them provide
uniformity a above 90%,and the tenth is a very close from 90% (89.7 %), therefore
the result of drip line being acceptable in drip irrigation system.
The first ranking drip line provide a satisfactory uniformity is 94,2% in pipe lines ,and
94.2% on the field area as well as it is provide appropriate flow rate for the water
requirement , moreover it is available in the study area ,moreover the drip-line
(StreamlineSL80 d.16q.0.98s0.4(1998) ) can operating under low pressure, that
means reduced the cost of energy requirement for water pumping, so it has been
chosen.

36
plot ,and the drip line delivers 7.6 m3/h/sub-plot (20000m2). Therefore, the pump that
give 7.6 m3/h, will be able to cover the systems water requirement. If the max run
hours is 12—12.5 in the maximum water requirement during the year days 4.4mm/m
= 176 m3/plot. But the uniformity 94.2, Therefore the calculation become 4.4/0.942
=4.7mm/m = 188 m3/plot. 188 m
3/2=94 m
3for one sub-plot .The system flow
rate is 7.6 m3/h, that’s mean the duration to irrigate one sub plot = 94 m
3/7.6 m
3,/h=
12 hour and 20 minutes. But, in another days will be less than 12 hours of course
This means that the irrigation system is able to provide the amount of water during 23
hours and 10 minutes that’s lead to reduce waste of energy and manpower (labor) and
thus reduce the cost of the product
III: 3: 1: The Pipe Line Design Result:
The pipeline design means the important part of the system design which start from
the water intake (the well) to the beginning of each of the two sub-plots
The use of design software such as EPANET provided the possibility of design and
monitoring of pressure, flow rate and flow velocity as well as the relevant pump,
which gives the requirements of the flow velocity and flow rate and pressure within
the range that does not cause damage or wastage of energy irrigation network taking
into consideration the costs. To select the appropriate pump was hired impacts the
website (www.grondfuost.com ) who gave several types of pumps and their respective
characteristics in terms of pressure and flow rate and energy crisis to run.
By EPANET can run the system and read the result of uniformity distribution of
water and the flow velocity and pressure, etc. in every part of the system, and give
results below.
Pressure = 6.95m into the system
Velocity= 0 < V<1,2 m/s into the systems parts
Flow rate = 7.6 m3/h
III:3:2: Discussion:
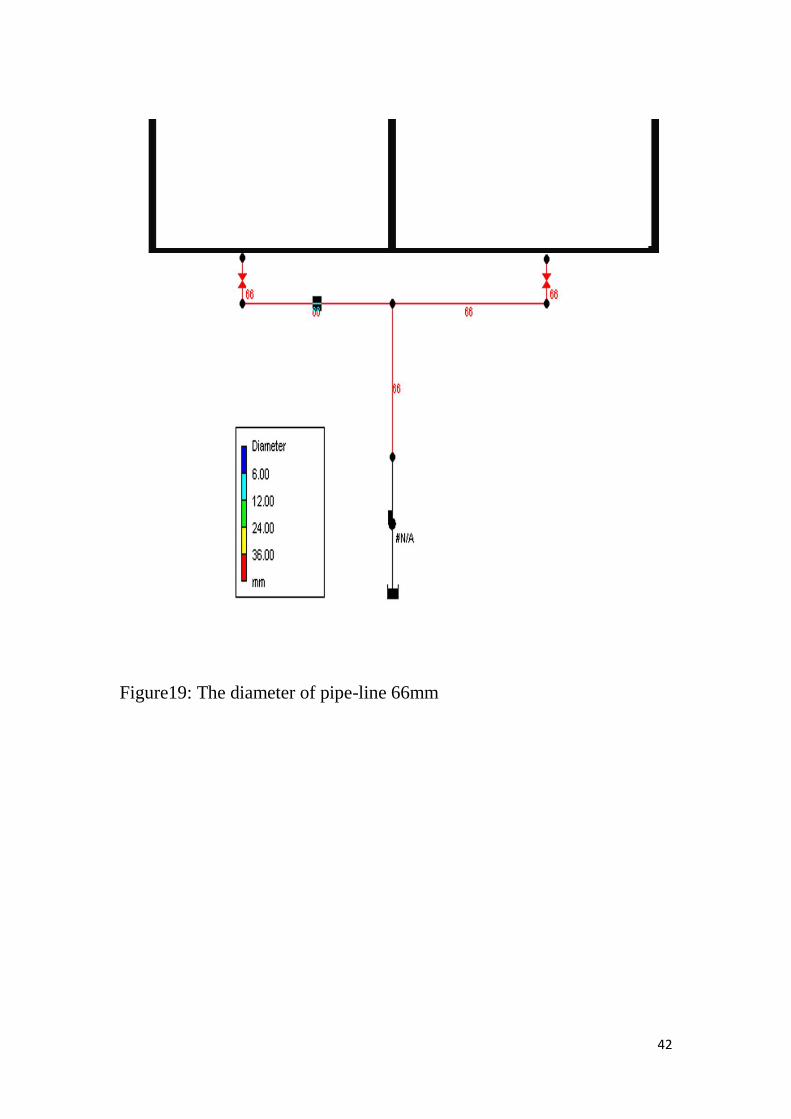
The pipeline system was fully design with diameter 66 mm that pipe diameter
provide a velocity lower than 1,2 m/s while maintaining the system pressure about to
6.66 m as the Vepro.L.G.s analysis result .This correspond with operation pressure of
(StreamlineSL80 d.16q.0.98s0.4(1998) ). Drip-line, the diameter of the pipe was still
constant because the delivery system will be by rotation between the two sub-plots .
That’s mean all the water from the pump will be using by one sub-plot. This mean the

37
flow rate 8.28 m3/h will be conveyed from the pump to each sub-plot alone
.Therefore, is very important of having a uniform diameters pipe-line to maintaining
the velocity constant , it about 0.67 m/s in all system. The pump with low operating
pressure 10 m.w.c has been used in the system design and the pipe line
(StreamlineSL80 d.16q.0.98s0.4(1998) ) works with operating pressure 6.95m
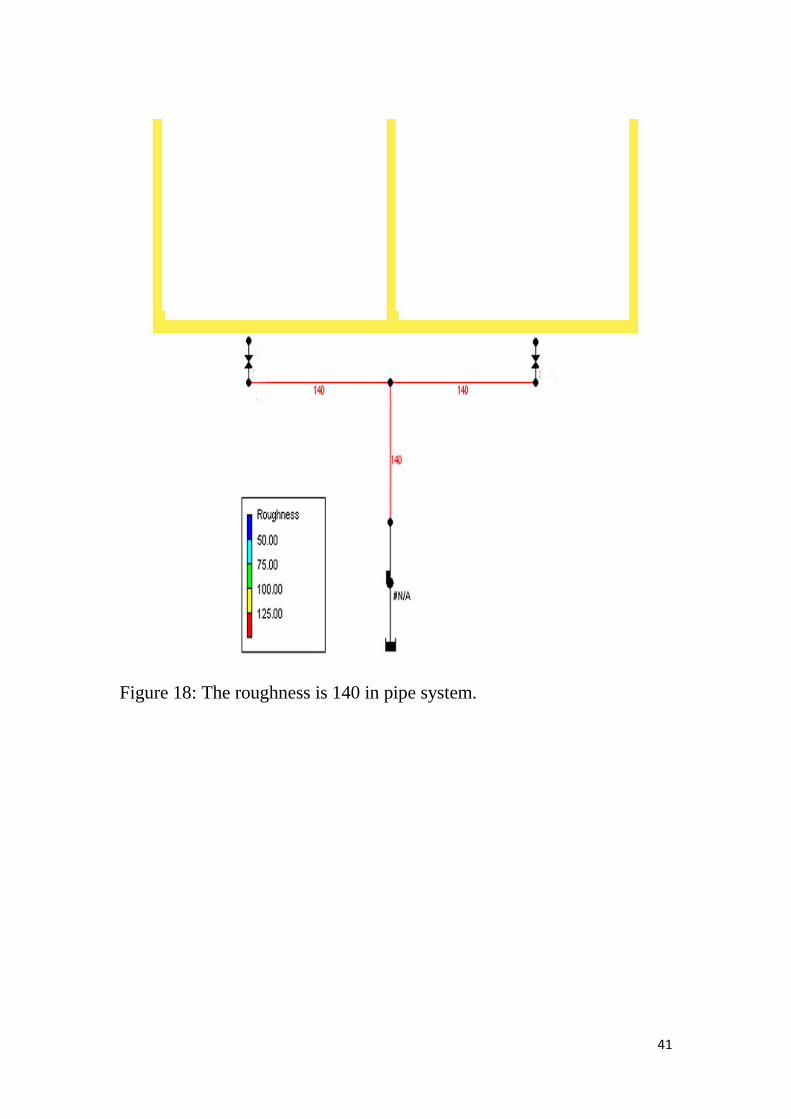
Taking into account the loss that occurs inside the pipeline as a result of friction
where the friction coefficient 140. As well as the use of filter lead to a loss in
pressure.
So it was needed to be the use of the pump provides a higher pressure than the output
of the pressure in the Ve.pro.L.G.s analysis
The maximum water requirement 167 m3/day/plot in July, our target discharge 8.28,
the sub plot water requirement is 88 m3.that’s mean we need just 10 hour to irrigate
one sub-plot and 20 hour to irrigate the plot completely.
Figure14: The pump curve

38
Figure15: Pressure in the system as shown outlet 6.95m, its consistent
with the Ve.pro.L.G.s. Analysis.

39
Figure16: Velocity in pipe-line 0<V<1.2m/s.

40
Figure 17: The flow rate in pipe line outlet 7.6 m3/h, its consistent with
the Ve.pro.L.G.s. Analysis.
41
Figure 18: The roughness is 140 in pipe system.
42
Figure19: The diameter of pipe-line 66mm

43
III:4 : CONCLUSION
From the serial use software such as, CLIMWAT 2.0 , SPAW,and
CROPWAT be able to calculate total gross irrigation and total net irrigation Knowing
these quantities enabled us to successfully use design software. Designing software
Ve.pro.L.G.s and EPANET ,gives the ability to design a completely drip irrigation
system as well as provide such software running in the computer system and monitor
the basic physical elements of the system are included; pressure and speed of the
water flow rate and now we have a complete design of drip irrigation system.
The efficiency of the final system 94% ,and water loss 6% this means best saving to
the well water , the system work with low presser and saving energy ,This system
designed for four hectares so can be design more or less than, this system will using
for olive cultivate ,but the same approach might be applied for another trees such as
date palms with another dimensions of course .Planting orchards in this region of the
desert climate may encourage investment in this area, leading to environmental
change the reality of the province.
The Maximum water requirements and maximum working hours system will be in a
specified period, and irrigation requirement in other days it will become less than that
in water requirements and running hours of course ,as well as in CROPWAT results
tables .

44
References
1. FAO Irrigation Manual Module 9.2007 Localized Irrigation System: Planning
,Design , Operating , and Maintenance .
2. Burt C.M., Stuart S.W.(1999) Drip and micro irrigation for trees ,vines , and row
crops.
3. Keller J.,Bliesner R.D (1990) Sprinkler and trickle irrigation,AVI Book ,New York
4. Frenken K, 2009. Irrigation in the Middle East Region in Figures. AQUASTAT
Survey 2008.
5. http://www.scribd.com/doc/12851870/National-Irrigation-Guide
6 .en.wikipedia.org/wiki/Geoghaphy_of_Iraq:
7. en.wikipedia.org/wiki/Arbequina
Recommended