DRAINAGE WATER MANAGEMENT
MAKING IT WORK


WESTERN LAKE ERIE BASIN SEDIMENT AND NUTRIENT LOADING

HARMFUL AND NUSISANCE ALGAE BLOOMS (HAB)

WESTERN LAKE ERIE BASIN
• WATER QUALITY ISSUES
• Nuisance and (HAB) Harmful Algae Blooms are causing problems in the western basin.
• Excess nitrates and phosphorus in surface waters seems to be what is causing the problem.
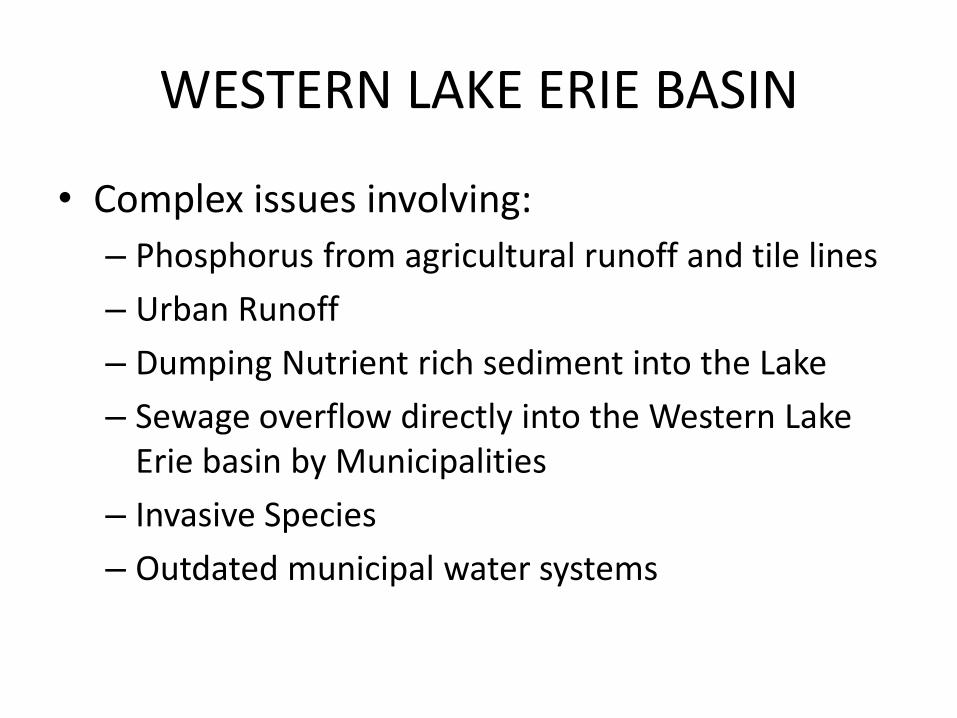
WESTERN LAKE ERIE BASIN
• Complex issues involving:
– Phosphorus from agricultural runoff and tile lines
– Urban Runoff
– Dumping Nutrient rich sediment into the Lake
– Sewage overflow directly into the Western Lake Erie basin by Municipalities
– Invasive Species
– Outdated municipal water systems

DISSOLVED REACTIVE PHOSPHORUS
• What we are being told:
– 35% of the total phosphorus entering the basin is dissolved reactive and the other 65% is attached to sediment.
– 70% of dissolved reactive phosphorus is coming from agricultural runoff
– 50% of the agricultural runoff is from tile line discharges
– Sediment attached phosphorus becomes dissolved reactive with time due to filtering of invasive species

Average Annual P-PO4 Concentrations by Drainage Management, DARA Site
Year Avg of P-PO4 ppm
Controlled Drained Free Drainage
2007 0.03 0.02
2008 0.35 0.35
2009 0.23 0.15
2010 0.09 0.16
2011 0.16 0.18
2012 0.18 0.12
2013 0.40 0.42
Average 0.21 0.20

Average annual drain volume (mm), Nitrate-N concentration (mg/L), and load (kg/ha) 1999-2003.
(Fausey, 2004)
Treatment Volume Concentration Load
Free Drainage – Soy 166 a 15.9 a b 26.4
Free Drainage –
Corn
146 b 16.4 a 24.0
Controlled Drainage-
Corn
92 c 14.4 b 13.3
Controlled Drainage-
Soybean
91 c 15.5 a b 14.1
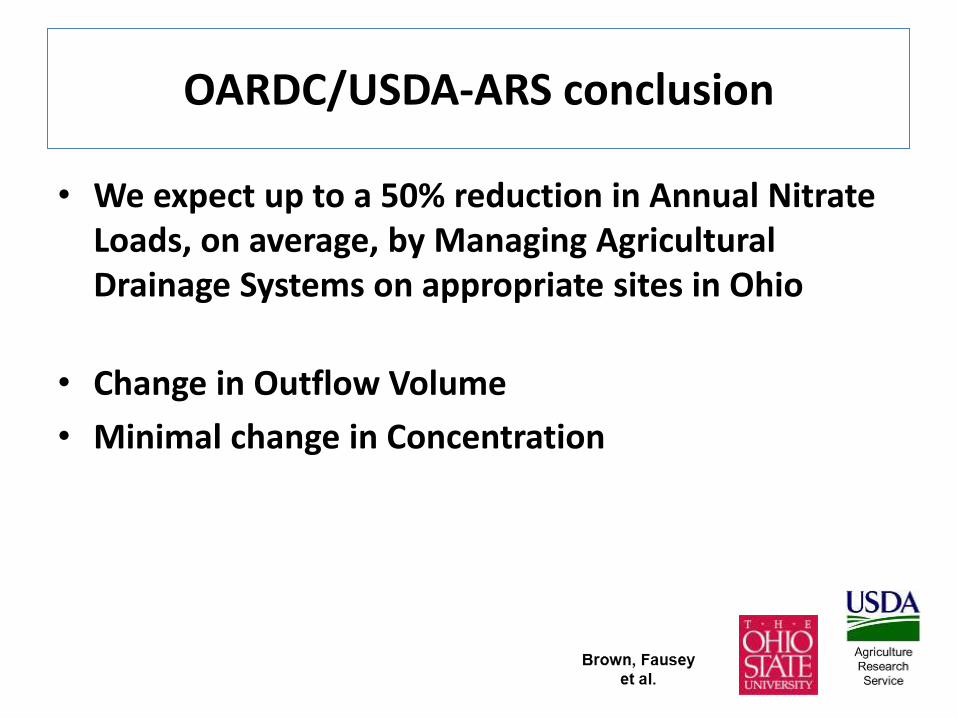
OARDC/USDA-ARS conclusion
• We expect up to a 50% reduction in Annual Nitrate Loads, on average, by Managing Agricultural Drainage Systems on appropriate sites in Ohio
• Change in Outflow Volume
• Minimal change in Concentration

Drainage area: B2 = 14 ha; B4 = 15 ha
Tile depth: 0.9 - 1.0 m
Soil type: Bennington silt loam Pewamo clay loam
Soil test P concentration: 60 mg/kg (0-20 cm)
2006-2008: Both sites were free draining 2009-2012: DWM was implemented at B4
B2
B4
0 90 180 m
Ditch
Legend
Tile outlet
Drainage area
Upper Big Walnut Creek
Watershed
Ohio
DWM - Case Study

0.00
0.05
0.10
0.15
0.20
0.25
0.30
2005.520062006.520072007.520082008.520092009.520102010.520112011.520122012.5
Me
an D
RP
co
nc.
(m
g L-1
)
Year
B2
B4
0.00
0.30
0.60
0.90
1.20
2006 2007 2008 2009 2010 2011 2012
Year
An
nu
al D
RP
load
(kg
/ha)
DWM did not significantly affect DRP concentration
65-74% reduction in annual DRP load with DWM
DWM - Case Study

Drainage Water Management
What and Why

Why use DWM?
• Improve water quality – Less tile flow means less nitrate leaving your field
• Improve crop yield – Less tile flow means more water is left in your field
• It just makes sense!
• Other benefits – Reduce subsidence in muck soils
– Reduce plugging from iron ochre
– Create wildlife habitat

MANAGING DRAINAGE WATER IN 24 INCH ZONES

Drainage Water Management After harvest Before planting After planting
•Only drain what you need, when you need it
DWM – How it works

DWM – How it affects water quality
• Promotes de-nitrification – Natural process of converting nitrate into nitrogen
gas
• Prevents short-circuiting from surface to tile lines through cracks
After harvest Before planting After planting

Drainage Water Management
System Design

Design – Management Zones
• They are based on topography and the layout of your tile system
• Each zone has a maximum of 2.0’ elevation change
• Ideally, each zone is 15 acres or more

Design – Retrofitting current systems
Example 2

Design – Retrofitting current systems
Example 2

Design – Retrofitting current systems
Example 2

Design – Retrofitting current systems
Example 2

Design – Planning a new installation

Installation – Above ground structures
• Place structure on solid, level surface
• 20’ of non-perf pipe upstream and backfill around the structure
• Keep structure away from ditch bank
• Take precautions for seepage upstream of structure

Installation – Water Gates
• Place every 1.0’ change in elevation
– Pipe or ground surface, whichever comes first
• 20’ of non-perf pipe upstream of structure

Surveys
• Laser and a Stick
• Lidar
• Drone Technology
• Driving the Topography

As Driven
Topo Terrain
Analysis


Plan Elevation


Plan vs Real

Drainage Water Management
Managing your system

Management – Winter Season
• Insert stop logs immediately after finishing fieldwork in the fall
• Manage water table to be within 6” of the soil surface
• Remove the stop logs a couple weeks before you anticipate starting fieldwork
– Actual time depends on your tile system
• Not all the stop logs need to be removed

Management – Growing Season
• Insert stop logs as soon as you finish fieldwork
• Manage the water table 24” below the soil surface
– Encourages good root development
• System can be managed more aggressively
Why manage after harvest?
• Water Quality
– Most tile flow occurs between harvest and planting
– Most nitrate loss occurs during this time period
• Wildlife habitat
– Shallow flooding

Why manage after planting?
• Water Quality
• Yield Benefit
– Can vary from year to year
Location Yield increase, Corn Yield increase, Soybeans
Ontario 3% 4%
Ohio 3% 2%
Indiana 6% - 10%

LENAWEE COUNTY
• 487,000 ACRES OF LAND
• 325,000 ACRES OF CROPLAND
– 73,000 ACRES ARE GOOD TO EXCELLENT CANDIDATES FOR DRAINAGE WATER MANAMGNET
– 40,000 ACRES OF LAND THAT COULD BE DONE WITH RIGHT DESIGN AND RETRO FIT

LENAWEE CONSERVATION DISTRICT PROGRAM GRANT
750,000 GRANT GOAL: Install as many drainage structures within the River Raisin Watershed at appropriate sites. • Engage producers, contractors to understand the
short and long term benefits of drainage water management
• Work with producers on appropriate management of the structures to maximize water quality benefits and economic advantages

LENAWEE CONSERVATION DISTRICT PROGRAM GRANT
• Currently have 450 plus structures installed
• Retro fit Mains on twenty different sites: 62,000 feet of Underground Outlet (main tile)
• Opportunity for drainage water management on 5000-6000 acres of cropland
• Project ends December 2016
– Plan to Install additional 100 drainage structures on some 1500-2000 acres of cropland

LENAWEE CONSERVATION DISTRICT PROGRAM GRANT
• WE HAVE JUST SCRATCHED THE SURFACE
– Acres and acres of potential drainage water management in Southeast Michigan, Saginaw Bay, Northwest Ohio
• Contractors are the key
– When new system are being installed this is the time to install system by zones with drainage structures.
Recommended