
Strategic Management JournalStrat. Mgmt. J.,22: 1–23 (2001)
DOES CORPORATE STRATEGY MATTER?
EDWARD H. BOWMAN1 and CONSTANCE E. HELFAT2*1The Wharton School, University of Pennsylvania, Philadelphia, Pennsylvania,U.S.A.2The Amos Tuck School, Dartmouth College, Hanover, New Hampshire, U.S.A.
A revisionist view that corporate strategy does not matter has gained considerable influencein recent years. This view largely stems from empirical results of early variance decompositionstudies that found negligible corporate effects associated with profitability differences betweenbusinesses. Our analysis of the variance decomposition literature shows this view to be incorrect.Not only do the studies as a group show that factors at the corporate level of organizationscontribute to profitability differences, but also evidence suggests that factors specificallyassociated with corporate strategy contribute to corporate effects. Corporate strategy in factdoes matter.Copyright 2001 John Wiley & Sons, Ltd.
INTRODUCTION
Literature on strategic management typicallydistinguishes between business and corporatestrategy. Business strategy deals with the waysin which a single-business firm or an individualbusiness unit of a larger firm competes within aparticular industry or market. Corporate strategydeals with the ways in which a corporation man-ages a set of businesses together (Grant, 1995).In the past several years, researchers have soughtto assess the relative importance of industry, busi-ness, and corporate factors in determining prof-itability differences between firms. Perhaps thebest known of these works in the field of strategy(Rumelt, 1991) finds that effects specific to indi-vidual businesses explain the largest portion ofthe variance of business-level profitability, fol-lowed by much smaller industry effects. Rumeltalso finds that corporate effects explain almost
Key words: corporate effects; corporate strategy; firmperformance; variance decomposition*Correspondence to: Constance E. Helfat, The Amos TuckSchool, 100 Tuck Hall, Dartmouth College, Hanover, NH03755, U.S.A.
Copyright 2001 John Wiley & Sons, Ltd. Received 13 July 1998Final revision received 16 June 2000
none of the variance of profitability. Based inpart on Rumelt’s work, a number of scholars havesuggested that industry effects on profitability aresmall and that corporate effects do not exist (e.g.,Carroll, 1993; Ghemawat, 1994; Ghemawat andRicart i Costa, 1993; Hoskisson, Hill and Kim,1993). By implication, the large amount ofresearch, teaching, and consulting related tocorporatestrategy may be a waste of time. In thisarticle, we ask: does corporate strategy matter?
To answer this question, we focus on empiricalstudies that use variance decomposition tech-niques, because these studies incorporate the roleof entire classes of effects in explaining differ-ences in profitability. Although we are parti-cularly interested in corporate effects, many ofthe variance decomposition studies emphasize theimportance of industry effects (e.g., Schmalensee,1985; McGahan and Porter, 1997), especiallyrelative to business-level effects (Rumelt, 1991).The emphasis on industry reflects a continuingdebate in the literature about the relative impor-tance of the market (looking through the window)vs. the company itself (looking in the mirror)(Bowman, 1990). This debate has centered largelyon issues of business rather than corporate strat-
2 E. H. Bowman and C. E. Helfat
egy. In the economics literature, for example,Demsetz (1973) argued that the efficiency ofindividual businesses rather than industry struc-ture (Bain, 1956) determined profitability. Dis-cussions of the resource-based view in strategyhave made similar arguments that business-levelresources are at least as important as industry-level factors in determining competitive advantagewithin a market (e.g., Barney, 1991). Theresource-based view, however, also contains asignificant role for corporate strategy based onutilization of common resources by related busi-nesses within a firm (Peteraf, 1993).
Until recently, the variance decomposition stud-ies have placed less emphasis on the issue ofcorporate effects on profitability (with the notableexception of Wernerfelt and Montgomery, 1988).Some recent studies, however, focus directly onthe corporate effect (Bercerra, 1997; Brush andBromiley, 1997; Chang and Singh, 1997). Theseand some other newer studies (Roquebert, Phil-lips, and Westfall, 1996; McGahan, 1997; McGa-han and Porter, 1999) contain noticeably largerestimates of corporate effects than do Rumelt(1991) and Schmalensee (1985) (as well asMcGahan and Porter, 1997). We provide a com-prehensive analysis and critique of what the vari-ance decomposition studies as a group tell usabout the importance of corporate strategy.
Our analysis begins with a brief introductionto variance decomposition techniques. Next weexamine corporate-level factors that in theoryinfluence profitability, and the extent to whichthese corporate influences reflect corporate strat-egy. Then we discuss some conceptual issuesregarding the use of variance decomposition tomeasure corporate influence on profitability, andexplain what the findings of these studies poten-tially can or cannot tell us about the usefulness ofcorporate strategy. We also provide an integrativesummary of the results of the various studiesregarding corporate, business, and industryeffects, and show that the studies encompass amuch larger range of estimated corporate effectsthan is commonly thought. This summaryincludes a completely separate literature in man-agement that asks some similar questions, usessome similar techniques, and predates Rumelt(1991) by almost 20 years, but which none ofthe current authors discuss. Our analysis thenturns to a non-technical and intuitive discussionof some of the data and statistical issues that
Copyright 2001 John Wiley & Sons, Ltd. Strat. Mgmt. J.,22: 1–23 (2001)
affect interpretation of the findings in the variancedecomposition studies regarding the importanceof corporate effects.
Based on analysis of the evidence, we thenanswer our original question. Yes, corporate strat-egy matters. Contrary to common perception,many of the studies contain sizeable estimates ofcorporate effects. Moreover, the methodology andsample composition in many of the studies tendto produce estimates of corporate effects that donot fully reflect the influence of corporate strategyon profitability. Some of the sample selection andmethodological issues can be easily remedied andsome cannot. Despite these issues, a preponder-ance of the evidence from these studies showsthat corporate effects are non-negligible.Additional evidence that we bring to bear sug-gests that corporate strategy contributes to theestimated corporate effects. We also makesuggestions for future research on the questionof whether corporate strategy matters.
VARIANCE DECOMPOSITION
The current empirical debate about the importanceof industry, business, and corporate effects beganwith a study by Schmalensee (1985), followedby studies by Kessides (1987), Wernerfelt andMontgomery (1988), Kessides (1990), Rumelt(1991), Roquebertet al. (1996), McGahan andPorter (1997, 1998), McGahan (1997), Brush andBromiley (1997), Bercerra (1997), Chang andSingh (1997), and Fox, Srinivasan, and Vaaler(1997). All of these studies decompose the vari-ance of business or firm returns (or businessmarket share in one study) into componentsassociated with industry, business, and corporateeffects, and some studies include year effectsand interaction terms as well. Other studies haveanalyzed the importance of industry effects only(Powell, 1996), of industry and firm effects(Cubbin and Geroski, 1987; Mauri and Michaels,1998), and of industry and organizational effects(Hansen and Wernerfelt, 1989). Only the variancedecomposition studies examined here, however,separate corporate from business and industryeffects on profitability (even though the earlystudies focused more on industry and businessthan on corporate effects).
The variance decomposition studies use twomethods to estimate corporate, business, and
Does Corporate Strategy Matter? 3
industry effects on the variance of profitability:analysis of variance and variance components.Both techniques utilize the average of returns toindividual corporations, industries, and businessesin the estimation procedures for decomposing thevariance of returns.1 Corporate effects, forexample, generally derive from differencesbetween multiple-business firms in the averageof returns to individual businesses within eachcorporation. Industry effects derive from differ-ences between industries in the average of returnsto individual businesses within each industry.Finally, business effects typically derive fromdifferences between businesses in the average ofannual returns to each business.
As noted previously, scholars have made infer-ences about the importance of corporate strategybased on estimates of corporate effects in thevariance decomposition studies. In order to evalu-ate such inferences, we first ask: whatin theoryare the corporate-level factors that influence firmor business profitability, and to what extent dothese factors reflect corporate strategy? Theanswer to this theoretical question can then helpus to understand the extent to which empiricalestimates of corporate effects may inform usabout corporate strategy.
CORPORATE INFLUENCE ANDCORPORATE STRATEGY
Corporate influence on profitability results fromfactors associated with membership of multiplebusinesses within individual corporations. Of themany corporate-level factors that theoreticallyaffect profitability, much research has focused onscope of the firm, including selection of industriesin which to operate. Building on the work ofRumelt (1974), research has analyzed the linkbetween relatedness in diversification and firmperformance. A large amount of research also hasinvestigated the consequences of vertical inte-gration for firms, including the seminal work ofWilliamson (1975, 1985), who pointed to theadvantages of vertical integration when trans-actions costs are high.
1 Schmalensee (1985) and Rumelt (1991) make clear thatvariance components estimation utilizes average returns. Stan-dard analysis of variance techniques also utilize averagereturns (see, for example, Bowman and Fetter, 1967).
Copyright 2001 John Wiley & Sons, Ltd. Strat. Mgmt. J.,22: 1–23 (2001)
As another well-known example of corporate-level factors thought to affect profitability, Pra-halad and Hamel (1990) point to the importancefor corporate success ofcore competenciesthatspan businesses within a corporation. With regardto corporations, Chandler (1962, 1977) and Willi-amson (1975) have emphasized the advantage ofthe multidivisional (M-form) organization overthe functional organization of multiple-businessfirms. In analyzing the advantages of particularorganizational structures for multiple-businessfirms, both Chandler and Williamson argue forthe importance of the corporation, as distinct fromindividual lines of business within the company.Additional research related to firm organizationhas shown thatorganizational climate affectscorporate profitability (Hansen and Wernerfelt,1989). Other research has dealt with systems ofplanning and control, including the use of stra-tegic versus financial control (e.g., Goold andCampbell, 1987). With regard to financial controland financing of investments, Williamson (1975)has argued for the benefits of internal capitalmarkets in corporations, followed by much sub-sequent research (see Liebeskind, 2000).
Additionally, profitability may be influenced bycorporate management, which includes managerialability, and manifests itself concretely in mana-gerial plans, decisions, directives, advice, and goalsetting for the company as a whole and for indi-vidual businesses within the corporation (e.g.,Andrews, 1987; Hambrick and Mason, 1984).
Which, if any, of the foregoing corporateinfluences on profitability stem from corporatestrategy? To answer this question, we first requirea working definition of corporate strategy. Grant(1995: 396–397), for example, identifies the fivefollowing concerns of corporate-level strategicmanagement (to which we have added items initalics from the aforementioned corporate influ-ences on profitability): composition of businesses(scope of the firm); resource allocation betweenbusinesses (planning and control); formulation ofbusiness unit strategies (planning and control,corporate management); control of business unitperformance (planning and control); coordinationof business units and creation of company cohe-siveness and direction (core competencies,organizational structure, organizational climate,corporate management).
As another example, Jack Welch, the highlyregarded CEO of General Electric, has described
4 E. H. Bowman and C. E. Helfat
important corporate goals and activities at GE (towhich we again have added items in italics):require each business to be number one or twoin its industry (planning and control); reducethe number of management levels (organizationalstructure); seek managerial self-confidence, sim-plicity, and speed (organizational climate); utilizefree-form ‘workout’ discussions among managersat many levels and functional responsibilitiesto resolve business problems (corporatemanagement); select managers with attention tostyle and performance (planning and control,corporate management); provide in-house execu-tive education focused on active rather than pas-sive (i.e., book) learning (corporate management);share best practices across divisions and also lookto other companies and countries (core com-petencies and resources); set stretch goals formargins, inventory turnover (planning and con-trol, corporate management); provide stock com-pensation to 20,000 employees (planning andcontrol) (General Electric, 1995).
The Grant and Welch examples touch on manycorporate-level factors thought to influence prof-itability, as indicated by the terms in italics.Additionally, in these examples, corporate man-agement has at least some impact on all othercorporate-level factors that influence profitability.Grant’s representative typology, for example,describes strategicmanagementand covers factorslargely under management control (e.g., allocationof resources). Jack Welch’s list reflects the goalsof GE’s top managers and the activities they putin place (e.g., workout sessions). Research in thefield of strategic management commonly usesthe terms ‘strategy’ and ‘strategic management’interchangeably. Similarly, we use the termcorporate strategyas synonymous withcorporatestrategic management, to reflect the contributionof corporate management to corporate-level fac-tors that affect profitability.
Given the foregoing working definition ofcorporate strategy, we suggest that as atheo-retical matter, corporate management has someimpact on, but not complete control of, corporate-level factors that influence profitability. Forexample, corporate management by itself cannotbuild core competencies, which generally residewithin an organization and consist in part oforganizational routines (Nelson and Winter,1982). Top management, however, may have animportant role in targeting and helping to develop
Copyright 2001 John Wiley & Sons, Ltd. Strat. Mgmt. J.,22: 1–23 (2001)
and sustain organizational capabilities (Castaniasand Helfat, 1991, 1992). Thus, in theory corporatemanagement and corporate strategy have animpact on but do not fully determine corporateinfluence on profitability.
Implications for variance decomposition
Based on our discussion thus far, we draw someimplications for the variance decomposition stud-ies. First, since in theory corporate strategy is asubset of total corporate influence on profitability,in order to draw conclusions from the variancedecomposition studies about corporate strategy, itis important to first determine the accuracy withwhich estimated corporate effects measure corpo-rate influence. In what follows, we show thatestimated corporate effects do not fully capturecorporate influence on profitability in general, andthe impact of corporate strategy in particular.Therefore, even low estimates of corporate effectsmay be consistent with a positive influence ofcorporate strategy on the variability of profitability.
Secondly, if estimated corporate effects aresignificant rather than nil, then we would like toknow if corporate strategy contributes to corpo-rate effects. The variance decomposition studiesdo not provide evidence related to this issue. Thatis, the studies do not estimate the contributionof corporate strategicmanagementto corporateeffects. We therefore introduce evidence from adifferent and earlier set of ‘leadership’ studiesthat estimate the effect of top management, inthe form of different CEOs, on the varianceof profitability.
THE VARIANCE OF PROFITABILITY
As a foundation for our analysis, we next addresssome fundamental issues regarding the variancedecomposition studies, before summarizing theresults of the studies and presenting more detailedanalysis of the methods and data. To begin, it isuseful to note that the variance decompositionstudies treat as similar entities both single-business firms and businesses in larger corpo-rations that are wholly contained within individualindustries.2 The studies also use different terms
2 Two studies (Bercerra, 1997; Roquebertet al., 1996) includeonly multiple-business firms.
Does Corporate Strategy Matter? 5
to denote these entities. To prevent confusion,we use the termbusinessto refer to companyoperations contained within an industry, whetherin a single-business or a multiple-business firm.
Variance of returns
The variance decomposition studies measure thecorporate effect as a percent of the total varianceof the dependent variable.3 This use ofvarianceas a measure provides information about differ-ences between multiple-business firms. A negli-gible estimate of the corporate effect suggeststhat even if corporate influence has an impacton the level of profitability of individual firms,differencesbetween firms in corporate influenceare zero. Thus,the finding of a negligible corpo-rate effect combined with a large business effect(e.g., Rumelt, 1991) implies the elimination ofdifferences in profitability at the corporate levelbut not at the business level.Consider how thisimplication affects the resource-based view, forexample. Large business effects but zero corpo-rate effects together suggest equalization ofreturns to corporate-level resources across corpo-rations, but not to business-level resources acrossbusinesses. Such a stark difference in the vari-ation of returns to resources at different levels ofthe organization obviously would requireadditional explanation.
In addition to using variance to measure effectson profitability, the studies measure the ‘impor-tance’ of each effect by its magnitude. That is,the larger the percentage of profitability varianceassociated with an effect, the greater is the pre-sumed importance of the effect.4 The studies alsogenerally compare the percent of the total vari-ance of profitability associated with the corporateeffect to the percentages of the varianceassociated with business and industry effects.Such a comparison, however, doesnot provide auseful answer to the question of whether corpo-
3 In general, the minimum corporate effect is zero in thesestudies. A small negative value is usually interpreted as zero(Rumelt, 1991).4 Brush and Bromiley (1997) argue that the size of an effectis more properly interpreted as the square root of the percentof profitability variance for that effect. Our point here insteadhas to do with comparisons between the sizes of differenteffects, and the difficulty of using such comparisons to makeinferences about strategy.
Copyright 2001 John Wiley & Sons, Ltd. Strat. Mgmt. J.,22: 1–23 (2001)
rate strategy matters in explaining profitabilitydifferences between firms, for two reasons.
First, just as corporate influence on profitabilityin theory may reflect factors in addition to corpo-rate strategy, business and industry influences onprofitability in theory may reflect factors otherthan business and industry-level strategy. Forexample, business effects may include substantialinfluence of the histories of individual businessesunrelated to strategic management, such as idio-syncratic and difficult-to-change organizationallearning paths (Nelson and Winter, 1982). There-fore, even if estimated business effects comprisea larger portion of the total variance of prof-itability than do corporate effects, it does notnecessarily follow that corporate strategy is lessimportant than business strategy. Business as wellas industry effects may reflect difficult-to-changeand idiosyncratic factors unrelated to strategy.Hence, the relative size of each effect—corporate,business, or industry—does not allow us to makeinferences about the importance of any type ofstrategy, corporate or otherwise. Instead, it isappropriate to ask whether the corporate effect isnon-negligible, i.e., differs statistically signifi-cantly from zero.5
Second, as analyzed in detail later, empiricalestimates of corporate effects may not fully andaccurately capture the influence of corporate strat-egy on the variance of profitability. As oneexample, consider the way in which a companysuch as Disney uses its cartoon characters inmultiple businesses as an important element ofcorporate strategy. Suppose that use of the Disneycharacters greatly improves the performance ofthe theme-park business relative to theme-parkbusinesses in other companies, but only slightlyimproves the performance of Disney’s filmbusiness relative to film businesses in othercompanies. The estimated corporate effect wouldcapture only the average improvement across Dis-ney’s two businesses. The analysis further would
5 Of the statistical techniques used in the variance decomposi-tion studies, analysis of variance and some variance compo-nents techniques produce standard errors that can be used toevaluate statistical significance. Rumelt (1991) also showshow approximate standard errors can be estimated for othervariance components techniques. Statistical significance ofcorporate effects in variance decomposition studies, however,is complicated by the fact that variance components techniquesin general have low power (Brush and Bromiley, 1997), asdoes analysis of variance when firms operate in only a fewindustries (Kessides, 1987).
6 E. H. Bowman and C. E. Helfat
attribute the additional improvement in the theme-park business to the business effect rather thanthe corporate effect.6 Thus, while as a theoreticalmatter, corporate strategy is a subset of corporateinfluence on profitability, as an empirical matter,estimated corporate effects may leave outimportant elements of corporate strategy. As aresult, comparison of corporate and other effectsmay provide incomplete information regarding theimportance of corporate strategy.
In sum, contrary to common perception, thesizes of estimated effects other than the corporateeffect do not provide a relevant standard forassessing the importance of corporatestrategy.
Average returns
As noted earlier, in decomposing the variance ofreturns, the studies use average returns in theestimation procedures. Therefore, only theaver-age of the returns to all of the businesses withina corporation has an impact on the estimatedcorporate effect.As a result, individual corpo-rations do not have to have an impact onallbusinesses in which they participate in order toproduce a corporate effect.Corporations musthave an impact on only enough of their busi-nesses to produce a statistical effect. Empiricalconfirmation of this comes from the results ofBrush and Bromiley (1997), which show thatmeasurable corporate effects are possible if eachcorporation has an impact on only half of itsbusinesses.7 Furthermore, the use of averagereturns within each firm implies that individualcorporations need not have an identical impacton each of their businesses in order for studiesto find a corporate effect.
Additionally, individual corporate-level factorsthat contribute to corporate effects do not neces-sarily have the same impact on all of the busi-nesses in a firm. Some corporate-level factorsmay increase returns to some businesses butdecrease returns to others—the average effect ofsuch factors within each multiple-business firmcontributes to the estimated corporate effect. Assuggested by our earlier discussion of corporate-level factors that may influence profitability, anynumber of empirical studies have found that indi-
6 We are grateful to an anonymous reviewer for this example.7 Brush and Bromiley (1997), however, used this result tomake a different point than we make here.
Copyright 2001 John Wiley & Sons, Ltd. Strat. Mgmt. J.,22: 1–23 (2001)
vidual sorts of corporate-level factors statistically‘explain’ the variability of at least a portion ofthe profitability of multiple-business firms, e.g.,strategic planning (Miller and Cardinal, 1994),diversification (Montgomery, 1994), vertical inte-gration (Rumelt, 1974), organizational climate(Hansen and Wernerfelt, 1989), organizationalstructure (Teece, 1981), and international activity(Hitt, Hoskisson, and Kim, 1997). These findingsdo not preclude the possibility that some corpo-rate-level factors may raise firm profitability over-all and others may lower it. Again, the net impactof all corporate-level factors on the average returnwithin each multiple-business firm contributes toestimated corporate effects.
EMPIRICAL STUDIES
The foregoing overarching considerations regard-ing the structure of variance decomposition stud-ies affect interpretation of the results with regardto the importance of corporate strategy, as do anumber of more detailed issues related to dataselection and statistical methods. To provide abasis for further analysis of these issues, we nextpresent a summary of the results of the variousstudies. We also summarize the results of theempirical ‘leadership’ studies that estimate topmanagement effects on the variance of prof-itability.
Variance decomposition studies
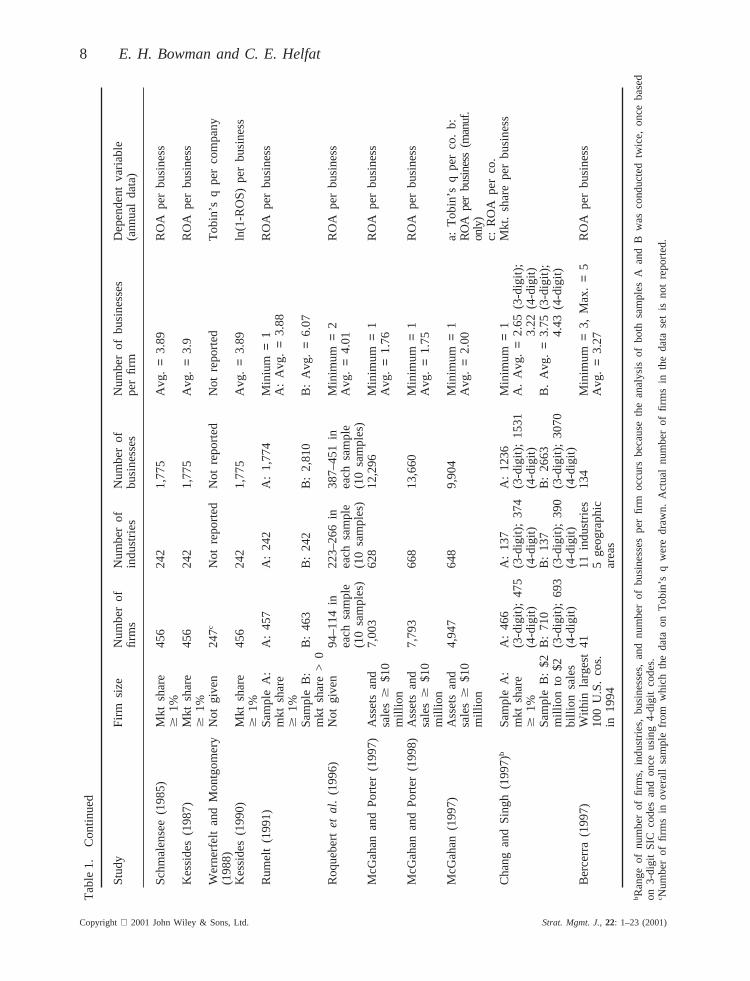
Table 1 provides a comprehensive summary ofthe data, empirical techniques, and results of thevariance decomposition studies that includecorporate effects. Of the variance decompositionstudies cited in the prior section, the table omitsthe studies by Brush and Bromiley (1997) andFox et al. (1997), because the results includesimulations. The table includes not only well-known studies, but also less well-known yet pub-lished studies and research in circulation as work-ing papers.
Table 1 denotes each study by author in theleft-hand column of each page of the table, andfor each study the table reports: data sources;years included; definition of an industry; types ofindustries included; definition of a business; sizesof firms; number of firms, businesses, and busi-nesses per firm; dependent variable; statistical

Does Corporate Strategy Matter? 7
Tab
le1.
Var
ianc
ede
com
posi
tion
stud
ies
Stu
dyD
ata
base
Yea
rsin
clud
edIn
dust
ryde
finiti
onT
ypes
ofD
efini
tion
ofa
busi
ness
indu
strie
s
Sch
mal
ense
e(1
985)
FT
CLO
Ba
1975
LOB
>3
1/2-
digi
tS
ICM
anuf
actu
ring
All
co.
busi
ness
inea
chLO
Bon
lyca
tego
ryK
essi
des
(198
7)F
TC
LOB
Sam
ple
A:
1975
LOB>3
1/2-
digi
tS
ICM
anuf
actu
ring
All
co.
busi
ness
inea
chLO
BS
ampl
eB
:19
74–
only
cate
gory
1976
Wer
nerf
elt
and
Mon
tgom
ery
Trin
et/E
IS;
FT
C;
1976
2-di
git
SIC
Indu
stria
lan
dA
llco
.bu
sine
ssin
each
LOB
(198
8)ot
her
sour
ces
utili
tyco
s.ca
tego
ryK
essi
des
(199
0)F
TC
LOB
1975
LOB>
31/
2-di
git
SIC
Man
ufac
turin
gA
llco
.bu
sine
ssin
each
LOB
only
cate
gory
Rum
elt
(199
1)F
TC
LOB
1974
–197
7LO
B>3
1/2-
digi
tS
ICM
anuf
actu
ring
All
co.
busi
ness
inea
chLO
Bon
lyca
tego
ryR
oque
berte
ta
l.(1
996)
Com
pust
at19
85–1
991
4-di
git
SIC
(bro
adly
defin
ed)
Man
ufac
turin
gA
llco
.bu
sine
ssin
each
SIC
only
code
McG
ahan
and
Por
ter
(199
7)C
ompu
stat
1981
–199
44-
digi
tS
IC(b
road
lyde
fined
)N
on-fi
nanc
ial
All
co.
busi
ness
inea
chS
ICco
deM
cGah
anan
dP
orte
r(1
998)
Com
pust
at19
81–1
994
4-di
git
SIC
(bro
adly
defin
ed)
Non
-fina
ncia
lA
llco
.bu
sine
ssin
each
SIC
code
McG
ahan
(199
7)C
ompu
stat
1981
–199
44-
digi
tS
IC(b
road
lyde
fined
)N
on-fi
nanc
ial
All
co.
busi
ness
inea
chS
ICco
deC
hang
and
Sin
gh(1
997)
Trin
et/E
IS19
81,
1983
,i)
4-di
git
SIC
(nar
row
lyde
fined
)M
anuf
actu
ring
All
co.
busi
ness
inea
ch:
i)4
1985
,19
87,
ii)3-
digi
tS
ICon
lydi
git
SIC
code
;ii)
3di
git
SIC
1989
code
Ber
cerr
a(1
997)
Com
pust
at19
91–1
994
4-di
git
SIC
(bro
adly
defin
ed):
Non
eex
clud
edA
llco
.bu
sine
ssin
broa
dw
orld
stud
yal
soin
clud
escl
assi
ficat
ion
geog
raph
icar
ea(m
ultin
atio
nal
bybr
oad
wor
ldge
ogra
phic
area
cos.
only
)
a LO
Bis
anab
brev
iatio
nfo
r‘li
neof
busi
ness
,’w
hich
isan
indu
stry
clas
sific
atio
n(R
umel
t,19
91).
Copyright 2001 John Wiley & Sons, Ltd. Strat. Mgmt. J.,22: 1–23 (2001)
8 E. H. Bowman and C. E. Helfat
Tab
le1.
Con
tinue
d
Stu
dyF
irmsi
zeN
umbe
rof
Num
ber
ofN
umbe
rof
Num
ber
ofbu
sine
sses
Dep
ende
ntva
riabl
efir
ms
indu
strie
sbu
sine
sses
per
firm
(ann
ual
data
)
Sch
mal
ense
e(1
985)
Mkt
shar
e45
624
21,
775
Avg
.=
3.89
RO
Ape
rbu
sine
ss$
1%K
essi
des
(198
7)M
ktsh
are
456
242
1,77
5A
vg.
=3.
9R
OA
per
busi
ness
$1%
Wer
nerf
elt
and
Mon
tgom
ery
Not
give
n24
7c
Not
repo
rted
Not
repo
rted
Not
repo
rted
Tob
in’s
qpe
rco
mpa
ny(1
988)
Kes
side
s(1
990)
Mkt
shar
e45
624
21,
775
Avg
.=
3.89
ln(1
-RO
S)
per
busi
ness
$1%
Rum
elt
(199
1)S
ampl
eA
:A
:45
7A
:24
2A
:1,
774
Min
ium=
1R
OA
per
busi
ness
mkt
shar
eA
:A
vg.=
3.88
$1%
Sam
ple
B:
B:
463
B:
242
B:
2,81
0B
:A
vg.=
6.07
mkt
shar
e>
0R
oque
berte
ta
l.(1
996)
Not
give
n94
–114
in22
3–26
6in
387–
451
inM
inim
um=2
RO
Ape
rbu
sine
ssea
chsa
mpl
eea
chsa
mpl
eea
chsa
mpl
eA
vg.
=4.
01(1
0sa
mpl
es)
(10
sam
ples
)(1
0sa
mpl
es)
McG
ahan
and
Por
ter
(199
7)A
sset
san
d7,
003
628
12,2
96M
inim
um=
1R
OA
per
busi
ness
sale
s$$1
0A
vg.=
1.76
mill
ion
McG
ahan
and
Por
ter
(199
8)A
sset
san
d7,
793
668
13,6
60M
inim
um=
1R
OA
per
busi
ness
sale
s$$1
0A
vg.=
1.75
mill
ion
McG
ahan
(199
7)A
sset
san
d4,
947
648
9,90
4M
inim
um=1
a:T
obin
’sq
per
co.
b:sa
les$
$10
Avg
.=2.
00R
OA
per
busi
ness
(man
uf.
mill
ion
only
)c:
RO
Ape
rco
.C
hang
and
Sin
gh(1
997)b
Sam
ple
A:
A:
466
A:
137
A:
1236
Min
imum
=1
Mkt
.sh
are
per
busi
ness
mkt
shar
e(3
-dig
it);
475
(3-d
igit)
;37
4(3
-dig
it);
1531
A.
Avg
.=2.
65(3
-dig
it);
$1%
(4-d
igit)
(4-d
igit)
(4-d
igit)
3.22
(4-d
igit)
Sam
ple
B:
$2B
:71
0B
:13
7B
:26
63B
.A
vg.=
3.75
(3-d
igit)
;m
illio
nto
$2(3
-dig
it);
693
(3-d
igit)
;39
0(3
-dig
it);
3070
4.43
(4-d
igit)
billi
onsa
les
(4-d
igit)
(4-d
igit)
(4-d
igit)
Ber
cerr
a(1
997)
With
inla
rges
t41
11in
dust
ries
134
Min
imum=
3,M
ax.=
5R
OA
per
busi
ness
100
U.S
.co
s.5
geog
raph
icA
vg.=3.
27in
1994
area
s
bR
ange
ofnu
mbe
rof
firm
s,in
dust
ries,
busi
ness
es,
and
num
ber
ofbu
sine
sses
per
firm
occu
rsbe
caus
eth
ean
alys
isof
both
sam
ples
Aan
dB
was
cond
ucte
dtw
ice,
once
base
don
3-di
git
SIC
code
san
don
ceus
ing
4-di
git
code
s.c N
umbe
rof
firm
sin
over
all
sam
ple
from
whi
chth
eda
taon
Tob
in’s
qw
ere
draw
n.A
ctua
lnu
mbe
rof
firm
sin
the
data
set
isno
tre
port
ed.
Copyright 2001 John Wiley & Sons, Ltd. Strat. Mgmt. J.,22: 1–23 (2001)
Does Corporate Strategy Matter? 9
Tab
le1.
Con
tinue
d
Stu
dyS
tatis
tical
tech
niqu
ed
Cor
pora
teef
fect
Bus
ines
sef
fect
Indu
stry
effe
ctY
ear
effe
ctIn
dust
ry3
Oth
erin
tera
ctio
nsY
ear
Sch
mal
ense
e(1
985)
i)O
LShi
erar
chic
alre
gres
sion
i)ze
roM
ktsh
are
effe
ct:
i)18
.8to
Not
incl
uded
Not
incl
uded
i)ne
gativ
eco
v.(A
NO
VA
)i)
0.2
to0.
6%19
.3%
bus.
&in
d.ii)
varia
nce
com
pone
nts
ii)no
tin
clud
edii)
0.6%
ii)19
.5%
sugg
este
dii)
cov.
bus.
&in
d:2
0.6%
Kes
side
s(1
987)
OLS
hier
arch
ical
regr
essi
onA
:1
to8%
eM
ktsh
are
effe
ct:
A:
not
Not
incl
uded
Not
incl
uded
Not
incl
uded
(AN
OV
A)
B:
11to
54%
fA
:no
tre
port
edre
port
edB
:5
to39
%f
B:
9to
45%
f
Wer
nerf
elt
and
OLS
hier
arch
ical
regr
essi
onC
orp.
focu
sM
ktsh
are
effe
ct:
10.9
to20
.1%
Not
incl
uded
Not
incl
uded
Not
incl
uded
Mon
tgom
ery
(198
8)(A
NO
VA
)(r
elat
edne
ss):
0.2
0to
2.3%
to3.
7%K
essi
des
(199
0)W
eigh
ted
leas
tsq
uare
sw
itha
5.1
to9.
8%M
ktsh
are
effe
ct:
4.7
to25
.2%
Not
incl
uded
Not
incl
uded
Not
incl
uded
mix
offix
edan
dra
ndom
6.6
to27
.5%f
effe
cts—
hier
arch
ical
regr
essi
ong
Rum
elt
(199
1)i)
sequ
entia
lan
alys
isof
i)A
:14
.8to
i)A
:33
.9to
i)A
:15
.3to
i)A
:0%
i)A
:9.
6to
i)N
otin
clud
edva
rianc
e17
.6%
34.0
%17
.9%
B:
0.1%
9.8%
ii)co
v.in
d.&
B:
10.9
toB
:41
.3to
B:
9.8
toB
:6.
8to
corp
orat
ion;
11.6
%41
.4%
10.3
%7.
1%ii)
varia
nce
com
pone
nts
hii)
A:
0%ii)
A:
47.2
%ii)
A:
7.3%
ii)A
:0%
ii)A
:8.
9%A
:0.
76%
B:
1.6%
B:
44.2
%B
:4.
0%B
:0%
B:
5.3%
B:
0%R
oque
berte
ta
l.V
aria
nce
com
pone
nts
17.9
%(a
vg.
37.1
%(a
vg.
10.1
%(a
vg.
0.4%
(avg
.2.
3%(a
vg.
(199
6)ac
ross
sam
ples
)ac
ross
sam
ples
)ac
ross
acro
ssac
ross
sam
ples
)sa
mpl
es)
sam
ples
)
dF
oran
alys
isof
varia
nce,
size
sof
estim
ated
effe
cts
may
have
ara
nge
depe
ndin
gon
varia
ble
orde
rof
entr
y.e K
essi
des
(198
7)pr
ogre
ssiv
ely
elim
inat
edfir
ms
with
less
than
2,3,
or4
busi
ness
es.
f Kes
side
s(1
987)
allo
wed
the
coef
ficie
nton
mar
ket
shar
eto
vary
byin
dust
ry.
Thi
saf
fect
sal
lth
ees
timat
edef
fect
s.gK
essi
des
(199
0)el
imin
ated
outli
ers,
soth
atre
sults
repo
rted
here
are
base
don
1711
obse
rvat
ions
.K
essi
des
also
allo
wed
the
coef
ficie
nton
mar
ket
shar
eto
vary
byin
dust
ry.
hR
esul
tsar
efr
omT
able
1in
Rum
elt
(199
1).
Copyright 2001 John Wiley & Sons, Ltd. Strat. Mgmt. J.,22: 1–23 (2001)

10 E. H. Bowman and C. E. Helfat
Tab
le1.
Con
tinue
d
Stu
dyS
tatis
tical
tech
niqu
eC
orpo
rate
effe
ctB
usin
ess
effe
ctIn
dust
ryef
fect
Yea
ref
fect
Indu
stry
3O
ther
inte
ract
ions
Yea
r
McG
ahan
and
i)se
quen
tial
anal
ysis
ofi)
9.1
to11
.9%
i)34
.9to
35.1
%i)
6.8
to9.
4%N
otin
clud
edN
otin
clud
edi)
Not
incl
uded
Por
ter
(199
7)va
rianc
eii)
varia
nce
com
pone
nts
ii)4.
3%ii)
31.7
%ii)
18.7
%ii)
cov.
ind.
and
corp
.:−5
.5%
McG
ahan
and
OLS
hier
arch
ical
8.8
to23
.7%
32.5
to59
.1%
6.9
to16
.3%
0.2
to1.
1%N
otin
clud
edN
otin
clud
edP
orte
r(1
998)
regr
essi
oni(A
NO
VA
)M
cGah
anS
eque
ntia
lan
alys
isof
a:co
rp.
focu
s=
Ass
etsh
are
effe
ct:
a:21
.6to
29.4
%a:
0to
2.9%
Not
incl
uded
Not
incl
uded
(199
7)va
rianc
ei0
to1%
b:8.
3%a:
35.3
to66
.0%
b:7.
6%b:
1.2%
c:co
rp.
focu
s=b:
28.7
%c:
8.6
to10
.6%
c:1.
7to
2.1%
0to
0.1%
c:14
.8to
31.2
%C
hang
and
Var
ianc
eco
mpo
nent
s3-
digi
tS
IC:
3-di
git
SIC
:3-
digi
tS
IC:
3-di
git
SIC
:3-
digi
tS
IC:
Not
incl
uded
Sin
gh(1
997)
A:0
%B
:1.6
%A
:15.
2%B
:13.
7%A
:1.6
%B
:3.1
%A
:2.4
%B
:1.0
%A
:6.2
%B
:11.
4%4-
digi
tS
IC:
4-di
git
SIC
:4-
digi
tS
IC:
4-di
git
SIC
:4-
digi
tS
IC:
A:4
.3%
B:8
.5%
A:5
2.7%
B:4
6.8%
A:1
9.4%
B:2
5.4%
A:0
.9%
B:0
.3%
A:0
.9%
B:1
.8%
Sam
ple
BS
ampl
eB
Sam
ple
BS
ampl
eB
Sam
ple
BN
otin
clud
ed(4
-dig
itS
IC)
(4-d
igit
SIC
)(4
-dig
itS
IC)
(4-d
igit
SIC
)(4
-dig
itS
IC)
Firm
size
Firm
size
Firm
size
Firm
size
Firm
size
larg
e:10
.9%
larg
e:44
.4%
larg
e:24
.1%
larg
e:0.
7%la
rge:
1.3%
med
ium
:25
.7%
med
ium
:15
.8%
med
ium
:40
%m
ediu
m:
0%m
ediu
m:
6.9%
smal
l:6.
3%sm
all:
15.6
%sm
all:
59.4
%sm
all:
0%sm
all:
12.5
%
Ber
cerr
ai)
hier
arch
ical
i)12
%i)
not
repo
rted
i)no
tgi
ven
i)no
tre
port
edi)
not
incl
i)no
tin
clud
ed(1
997)
regr
essi
on(AN
OV
A)
ii)4.
71%
ii)27
.2%
ii)In
dust
ry:
ii)no
tin
clii)
not
incl
ii)no
neii)
varia
nce
com
pone
nts
iii)
3.05
toiii
)no
tin
clud
ed30
.4%
Geo
gr.
iii)
not
sign
ifica
ntiii
)si
gnifi
cant
iii)
year
3co
rp.
iii)
repe
ated
mea
sure
s10
.95%
area
:6.
9%si
gnifi
cant
rand
omfa
ctor
siii
)In
dust
ry:
41.9
%(A
NO
VA
)to
46.8
%G
eogr
.ar
ea:
0to
1%
i The
rang
eof
resu
ltsre
port
edhe
rein
clud
esal
lof
the
estim
ates
give
nin
the
stud
y,in
clud
ing
for
subs
ampl
esof
the
data
.
Copyright 2001 John Wiley & Sons, Ltd. Strat. Mgmt. J.,22: 1–23 (2001)

Does Corporate Strategy Matter? 11
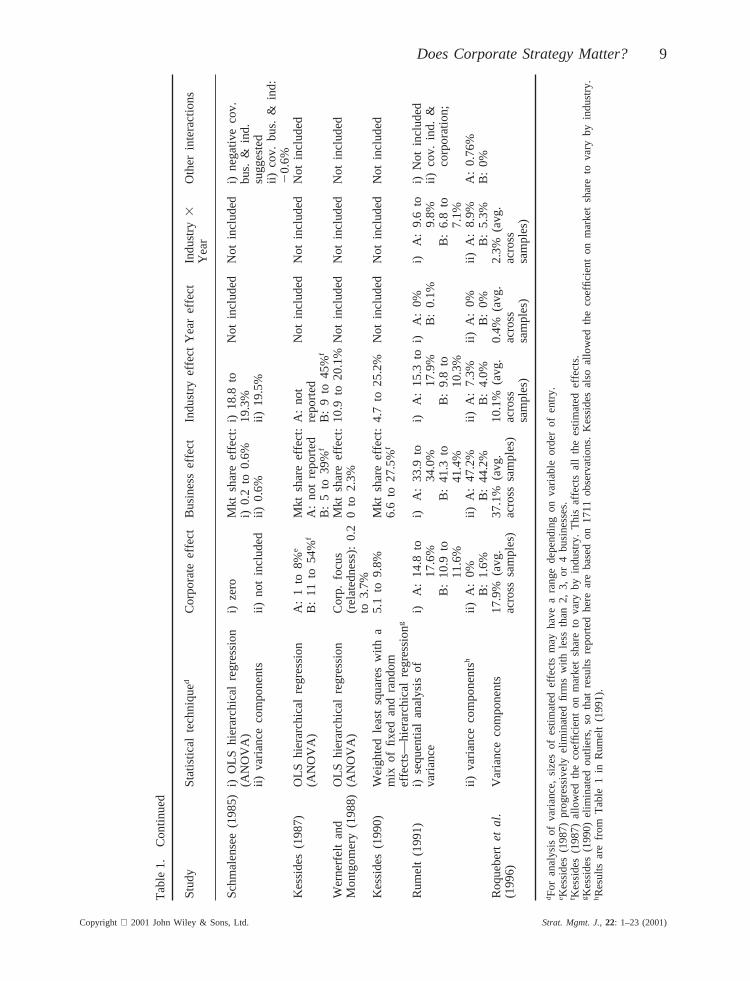
techniques employed; estimated corporate, busi-ness, industry, year, and interaction or covarianceeffects. Several of the studies use more than onestatistical technique. For each study, the tabledenotes each technique by number, and in thecolumns that report the various estimated effects,each technique number denotes estimates obtainedusing that particular technique. For each studythat uses analysis of variance, the table alsoreports a range of estimates, due to differentorderings of variable entry. Additionally, somestudies contain two main samples, denoted A andB in the columns that describe either the yearsincluded in the sample or firm size, and in thecolumns that report estimated effects. Sample Busually includes all of sample A plus additionalfirms. One study (McGahan, 1997) also uses threedifferent dependent variables, which are denotedwith different lower case letters in the columnsthat list the different dependent variables and thatreport estimated effects.
Table 1 shows that the studies as a groupinclude three sorts of dependent variables—individual business profitability using account-ing measures, firm-level return measured as Tob-in’s q (market value of the firm divided byreplacement cost of firm assets), and individualbusiness market share. These three measuresof firm performance incorporate differentinformation and in general are imperfectly corre-lated. Accounting profitability reflects historicalprofits relative to sales or book value of assets;Tobin’s q reflects investor expectations about firmvalue relative to asset replacement cost; marketshare reflects business revenues relative to rev-enues of other businesses in the same industry(McGahan, 1997). The studies use two main tech-niques: variance components and analysis of vari-ance. Some studies include only manufacturingindustries, and some studies include other indus-tries as well. The studies also differ in theinclusion or exclusion of single-business firms,the definition of a business and an industry, thenumber of years included, the sizes of firmsin the sample, and the number of businessesper corporation.
Importantly, the studies in Table 1 show awide range of estimated corporate effects. Inmany of these studies, corporate effects are farfrom nil—sometimes on the order of 18 percentor more, for the full sample or subsamples ofthe data.
Copyright 2001 John Wiley & Sons, Ltd. Strat. Mgmt. J.,22: 1–23 (2001)
Leadership studies
In addition to the variance decomposition studiesin Table 1, a separate and earlier set of studiesuses similar techniques to estimate top man-agement effects on profitability. The studiesdecompose the variance of profitability into year,industry, company, and ‘leadership’ effects, whereleadership effects result from differences betweenindividual chief executives in firm performance.(Strictly speaking, a ‘leadership’ effect can resultfrom any factor at the firm level associated withthe terms in office of chief executives.) Thedependent variables used in the leadership studiesare substantially the same as those in the variancedecomposition studies.
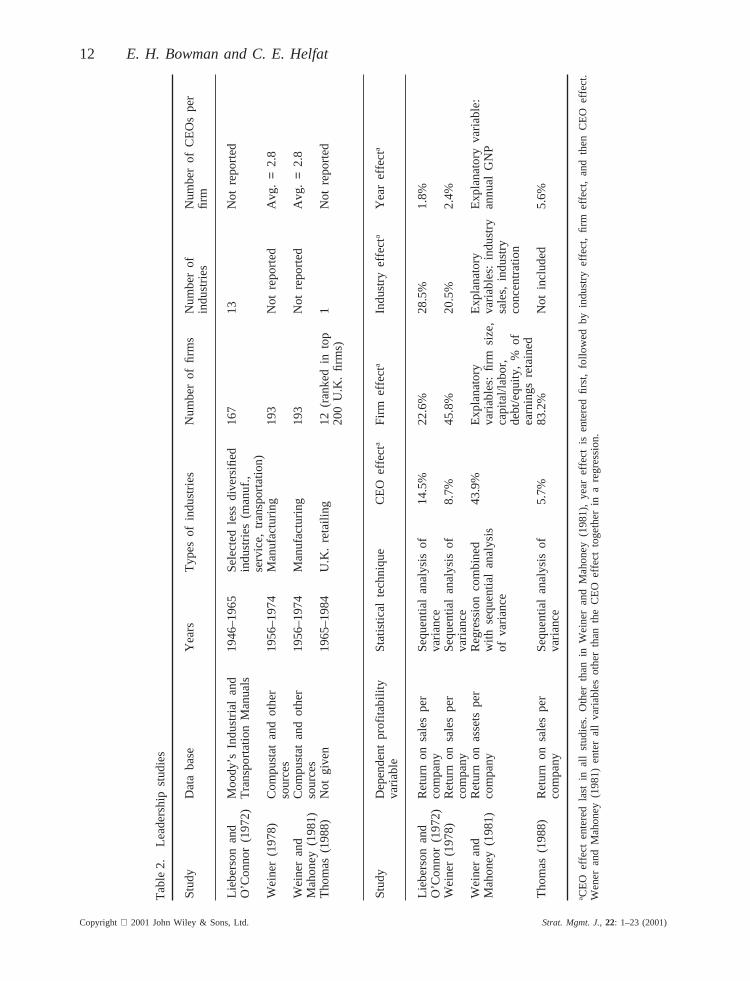
Table 2 summarizes the results of the leader-ship studies.8 The table lists each study by author,and for each study reports: data sources; yearsincluded; types of industries included; number offirms, industries, and CEOs per firm; dependentvariable; statistical technique; estimated CEO(i.e., leadership), firm, industry, and year effects.The studies include multiple-business as well assingle-business firms (except perhaps the studyby Thomas, 1988), and assign each firm to abroadly defined primary industry.9 Using analysisof variance, the studies first estimate year effects,then primary industry effects, and then firmeffects. These firm and industry effects are fixed(or ‘stable’) effects that reflect differencesbetween firms (or industries) in the average ofeach firm’s (or industry’s) annual returns overthe time period of a study. The firm effects inparticular capture differences in average prof-itability between firms due to corporate-level fac-tors (for multiple-business firms), business-levelfactors, and industry-level factors other than thoseassociated with the primary industry. After esti-mating year, industry, and firm effects, the analy-ses then estimate the leadership effect.10 The latterreflects differences between CEOs in the averageannual return per CEO during his term in office,
8 Table 2 omits one empirical study in this literature bySalancik and Pfeffer (1977), which deals with mayors andcity budgets rather than with for-profit companies of interesthere. In addition, for purposes of comparability with thevariance decomposition studies in Table 1, Table 2 omitsresults for dependent variables such as total sales or profitsthat do not reflect rates of return.9 Even the Thomas (1988) study may include diversified firmswhose primary business is retailing.10 Weiner (1978) also varies the order of variable entry.
12 E. H. Bowman and C. E. Helfat
Tab
le2.
Lead
ersh
ipst
udie
s
Stu
dyD
ata
base
Yea
rsT
ypes
ofin
dust
ries
Num
ber
offir
ms
Num
ber
ofN
umbe
rof
CE
Os
per
indu
strie
sfir
m
Lieb
erso
nan
dM
oody
’sIn
dust
rial
and
1946
–196
5S
elec
ted
less
dive
rsifi
ed16
713
Not
repo
rted
O’C
onno
r(1
972)
Tra
nspo
rtat
ion
Man
uals
indu
strie
s(m
anuf
.,se
rvic
e,tr
ansp
orta
tion)
Wei
ner
(197
8)C
ompu
stat
and
othe
r19
56–1
974
Man
ufac
turin
g19
3N
otre
port
edA
vg.
=2.
8so
urce
sW
eine
ran
dC
ompu
stat
and
othe
r19
56–1
974
Man
ufac
turin
g19
3N
otre
port
edA
vg.
=2.
8M
ahon
ey(1
981)
sour
ces
Tho
mas
(198
8)N
otgi
ven
1965
–198
4U
.K.
reta
iling
12(r
anke
din
top
1N
otre
port
ed20
0U
.K.
firm
s)
Stu
dyD
epen
dent
prof
itabi
lity
Sta
tistic
alte
chni
que
CE
Oef
fect
aF
irmef
fect
aIn
dust
ryef
fecta
Yea
ref
fecta
varia
ble
Lieb
erso
nan
dR
etur
non
sale
spe
rS
eque
ntia
lan
alys
isof
14.5
%22
.6%
28.5
%1.
8%O
’Con
nor
(197
2)co
mpa
nyva
rianc
eW
eine
r(1
978)
Ret
urn
onsa
les
per
Seq
uent
ial
anal
ysis
of8.
7%45
.8%
20.5
%2.
4%co
mpa
nyva
rianc
eW
eine
ran
dR
etur
non
asse
tspe
rR
egre
ssio
nco
mbi
ned
43.9
%E
xpla
nato
ryE
xpla
nato
ryE
xpla
nato
ryva
riabl
e:M
ahon
ey(1
981)
com
pany
with
sequ
entia
lan
alys
isva
riabl
es:
firm
size
,va
riabl
es:
indu
stry
annu
alG
NP
ofva
rianc
eca
pita
l/lab
or,
sale
s,in
dust
ryde
bt/e
quity
,%
ofco
ncen
trat
ion
earn
ings
reta
ined
Tho
mas
(198
8)R
etur
non
sale
spe
rS
eque
ntia
lan
alys
isof
5.7%
83.2
%N
otin
clud
ed5.
6%co
mpa
nyva
rianc
e
a CE
Oef
fect
ente
red
last
inal
lst
udie
s.O
ther
than
inW
eine
ran
dM
ahon
ey(1
981)
,ye
aref
fect
isen
tere
dfir
st,
follo
wed
byin
dust
ryef
fect
,fir
mef
fect
,a
ndth
enC
EO
effe
ct.
Wen
eran
dM
ahon
ey(1
981)
ente
ral
lva
riabl
esot
her
than
the
CE
Oef
fect
toge
ther
ina
regr
essi
on.
Copyright 2001 John Wiley & Sons, Ltd. Strat. Mgmt. J.,22: 1–23 (2001)

Does Corporate Strategy Matter? 13
once the mean effects of year, industry, and firmhave been accounted for.
The leadership effect represents a transient firm-level effect, in that the leadership effect is esti-mated based on average annual firm returns perCEO. Each of the firms included in these studieshas multiple CEOs. Although estimated corporateeffects in some of the variance decompositionstudies in Table 1 include transient effects(Schmalensee, 1985; Wernerfelt and Montgomery,1988; Kessides, 1990),11 many other studies esti-mate only stable corporate effects (e.g., Rumelt,1991; Roquebertet al., 1996; McGahan and Porter,1997, 1998; McGahan, 1997; Chang and Singh,1997). The latter reflect any effects of top man-agement only onaverage profitability over thetime period of a study. Top management effects inthe leadership studies capture additional transitoryeffects, based on variation in average firm prof-itability per CEO (Lieberson and O’Connor, 1972;Weiner and Mahoney, 1981).12 The firm effects inthe leadership studies are roughly equivalent to thesum of stable business and corporate effects inthe variance decomposition studies,13 whereas theleadership effect captures one type of transientfirm effect for both single-business and multiple-business firms.
Table 2 shows a range of leadership effects.The well-known initial study by Lieberson andO’Connor (1972) estimated substantial leadershipeffects of 14.5 percent of the total variance of
11 Bercerra (1997) includes an interaction term between yearand corporation in one part of the study, to capture corporateeffects that vary through time. The studies that include onlyone year of data (Schmalensee, 1985; Wernerfelt andMontgomery, 1988; Kessides, 1990) capture both stable effectsand transient effects for that year (Rumelt, 1991).12 Studies that cover multiple years will have some turnoverin top management. Most studies have found that the averagetenure for a CEO in a large U.S. company is 8–10 years,which suggests that on average 1/8 to 1/10 of all CEOs leaveoffice each year. Thus, even in a study of short duration(e.g., the 4-year period in Rumelt, 1991), executive turnovercan be substantial.13 The firm effects in the leadership studies are not identicalto the sum of the business and corporate effects in thevariance decomposition studies, because the leadership studiesassign eachfirm to a single industry, whereas the variancedecomposition studies generally assign eachbusinessto asingle industry. The firm effects in the leadership studies maypick up some residual industry-level effects due to individualcompany participation in more than one industry that businesseffects in the variance decomposition studies may or may notpick up, depending on the particular study in question.
Copyright 2001 John Wiley & Sons, Ltd. Strat. Mgmt. J.,22: 1–23 (2001)
profitability.14 The estimated leadership effects onthe variance of profitability in the other studiesrange from 6 to 44 percent. Since the studies(except perhaps Thomas, 1988) include somemultiple-business firms, the leadership effectshould include at least a portion of the transientcorporate effect. Surprisingly, none of the studieslisted in Table 1 refer to this earlier literature.
A simple look at Tables 1 and 2 suggests thatthe view that corporate effects are nil is notnecessarily correct. Instead, if we were to looksimply at the large range of estimates in thetables, we might conclude that we don’t knowwhat to think. As we explain in the next sections,however, a more detailed look at the data andmethods employed in the individual studies sug-gests that corporate effects are substantial. Inwhat follows, we first discuss the variancedecomposition studies shown in Table 1, and thenreturn to the leadership studies in Table 2.
SAMPLE SELECTION AND DATAISSUES
Table 1 shows that the variance decompositionstudies employ different dependent variables,explanatory variables, and data, and cover differ-ent time periods. The studies also differ in theirdefinitions of individual variables and utilize dif-ferent statistical techniques. Given the sensitivityof statistical analysis in general to all of thesesorts of factors, they are likely to account formany of the differences in the findings of thestudies. In what follows, we discuss some system-atic ways in which differences in the studiesproduce different estimates of corporate effects.We begin with a discussion of issues related toconstruction of the data samples that apply toboth the analysis of variance and variance compo-nents techniques used in the studies. Then weturn to issues related to the use of each sta-tistical technique.
Inclusion and exclusion of single-business firms
One of the most important factors that has animpact on the size of the estimated corporate
14 This study also estimated smaller leadership effectsassociated with the dollar value of sales and profits (7.5%and 6.5% respectively).
14 E. H. Bowman and C. E. Helfat
effect has to do with the inclusion or exclusionof single-business firms, which is reflected inTable 1 in the number of businesses per firm.Statistically, corporate effects derive from multi-ple-business firms. Many of the variancedecomposition studies that include single-businessfirms define corporate effects as zero in thosefirms (McGahan, 1997), because otherwise corpo-rate effects are difficult to distinguish from busi-ness effects.Thus, inclusion of single-businessfirms masks the corporate effect: the larger theproportion of single-business firms in a sample,the smaller is the estimated corporate effect. Con-versely, when a study excludes single-businessfirms, the estimated corporate effect rises.
As empirical confirmation, we point to thelarger corporate effect of 18 percent found byRoquebertet al. (1996), who excluded single-business firms,15 as compared with a corporateeffect of 4.3 percent estimated by McGahan andPorter (1997). Both of these studies used Compu-stat data, but McGahan and Porter (1997)included single-business firms, which compriseda majority of the businesses in their sample.Additional evidence comes from a separate andlater study by McGahan and Porter (1998) thatexcluded single-business firms from one of manysubsamples of data, for purposes of comparisonwith the results of Roquebertet al. (1996). McGa-han and Porter (1998) found that exclusion ofsingle-business firms increased the estimatedcorporate effect by 10 percentage points, from13.7 to 23.7 percent (with a drop in the estimatedbusiness effect of similar magnitude and littlechange in the estimated industry effect).16
Thus, an estimated corporate effect in a samplethat has a large proportion of single-business
15 The only other study to include only multiple-businessfirms also found non-negligible corporate effects of between5 and 11 percent (Bercerra, 1997). Since the study definedbusinesses very broadly as large geographic areas of theworld, as discussed in the following section, these numbersmay understate corporate influence on profitability.16 The number of businesses in a firm also may affect theestimated corporate effect in another way: the greater thenumber of businesses within a single firm, the lower thelikely effect of a corporation on any single business (perhapsbeyond some small number of businesses). A corporationthat has a large number of businesses may delegate moreresponsibility to individual businesses than does a firm thathas fewer businesses. Roquebertet al. (1996) and McGahanand Porter (1998) provide evidence that the estimated corpo-rate effect falls as the average number of businesses in asample increases beyond two or three.
Copyright 2001 John Wiley & Sons, Ltd. Strat. Mgmt. J.,22: 1–23 (2001)
firms may tell us little about whether corporateinfluence and corporate strategy matter to firmsfor which this is relevant, i.e., for multiple-business firms. In studies that include single-business firms, a negligible or small corporateeffect may reflect the proportion of single-business firms in the sample.
Definition of industry and business
The inclusion or exclusion of single-businessfirms has implications for a second issue thataffects estimation of the corporate effect: breadthof industry definition. In the variance decomposi-tion studies, the definition of a business dependson the definition of an industry, because thestudies identify each business in a firm as belong-ing to one particular industry.17 A broad definitionof an industry in terms of product scope thereforeimplies a broad definition of an individual busi-ness within a firm. Additionally, many of thestudies utilize data that define a business asallof the operations of a company in a single indus-try. As a result, the more broadly a study definesan industry and a business, the fewer the numberof businesses per firm, and the larger the numberof single-business firms in the sample than wouldresult with a narrower industry definition.Thus,a broad definition of industry makes it moredifficult to discern corporate effects, in partbecause the sample contains a greater proportionof single-business firms that dampen the estimatedcorporate effect.
Most of the variance decomposition studiesdefine an industry based on 4-digit StandardIndustrial Classification (SIC) codes in the Com-pustat business segment or Trinet/EIS data, orbased on line of business classifications in theFederal Trade Commission (FTC) data. SIC codesinclude broad 2-digit classifications of productmarkets, more narrow 3-digit classifications, andeven narrower 4-digit classifications. TheTrinet/EIS data contain the most precise infor-mation about the industries in which firms oper-ate, since the data include 4-digit SIC codesassigned to individual plants within companies.The Compustat business segment data containless precise information, since firms often identify
17 Bercerra (1997) instead defines a business as all of acompany’s operations in a broadly defined geographic areaof the world.
Does Corporate Strategy Matter? 15
operations in several 4-digit SIC code industriesas a single business (McGahan and Porter, 1997).Variance decomposition studies that rely on Com-pustat data generally use the primary SIC codefor each business.
In the FTC data, the individual line of businessclassifications vary between approximately the 3-digit and the 4-digit SIC code level (Ravenscraft,1983). Because the FTC data define a singlebusiness as all company operations in one lineof business, these data combine into one businessall business units within a firm that participate ina single industry (e.g., GM’s several autodivisions). In contrast, Compustat allows a com-pany to report more than one business in the sameSIC code industry (although many companies inCompustat do equate one set of SIC codes witha single company business).
Chang and Singh (1997) point out that whena variance decomposition study defines industriesand businesses broadly, some cross-businessinfluences that occur within a broadly definedbusiness will be attributed to business rather thancorporate effects. Only two studies have empiri-cally examined the sensitivity of results to pre-cision in industry definition. Chang and Singh(1997) used the Trinet data to show that definitionof industry and business at the narrower 4-digitSIC code level yields corporate effects that are 4–7 percentage points greater than corporate effectsestimated using broader 3-digit SIC codes. As analternative approach, using the FTC data, Foxetal. (1997) applied simulation techniques to con-struct industries defined more narrowly than theFTC lines of business. Foxet al. (1997) foundthat incorporating more narrowly defined indus-tries into a variance components analysis causedthe corporate effect to increase from 1.5 to 8.2percent in the final run of the simulation.Byimplication, studies that contain broadly definedindustries and businesses, for example based onthe Compustat and FTC data, underestimatecorporate influence on profitability.
STATISTICAL APPROACHES
The variance decomposition studies in Table 1use two main statistical techniques to decomposethe variance of profitability or market share:sequential analysis of variance (often usingregression methods) and variance components
Copyright 2001 John Wiley & Sons, Ltd. Strat. Mgmt. J.,22: 1–23 (2001)
analysis. Some studies employ both techniquesand others use just one, the choice of whichvaries. Next we discuss issues specific to eachmethodology (with supplementary technicalfootnotes).
Analysis of variance
In analysis of variance, a researcher typicallyestimates a null regression model of no effectson the dependent variable other than a constantterm, and then progressively adds variables thatrepresent each effect in the model. (Some of thestudies have large numbers of observations, andtherefore use alternate methods to derive least-squares estimates.) After adding each set of vari-ables, the researcher calculates the increment tothe adjustedR2 of the regression, as an unbiasedestimate of the fraction of variance ‘explained’(Schmalensee, 1985). The models often includedummy variables for each industry, each business,and each corporation. Some of the studies replacethe individual business dummy variables withmarket (or asset) shares for individual businesses(Schmalensee, 1985; Kessides, 1987; Wernerfeltand Montgomery, 1988: Kessides, 1990; McGa-han, 1997), or replace the corporate dummy vari-ables with a measure of corporate focus designedto capture the extent of relatedness in diversifi-cation (Wernerfelt and Montgomery, 1988;McGahan, 1997).
As in all hierarchical regression, the order ofentry of the sets of dummy variables can havea large impact on the results (Kennedy, 1985).Furthermore, the business-level dummy variablesare completely collinear with the corporate-leveldummy variables, since each corporation has adummy variable for every business within thefirm. As a result, if a regression that includesboth sets of dummy variables enters the business-level variables first, these variables will captureall of the corporate effect. In recognition of thisfact, analysis of variance models that include bothbusiness and corporate-level dummy variables(rather than share or focus variables) enter thecorporate dummy variables prior to the business-level dummy variables.
The latter approach creates an opposite problemthat the corporate dummy variables may pick upsome of the variability associated with the busi-ness dummy variables. For example, althoughRumelt (1991) finds in his analysis of variance
16 E. H. Bowman and C. E. Helfat
(estimated using an approach analogous to stan-dard regression techniques) that the incrementalcontribution to adjustedR2 for the corporationranges from about 11 to 17.5 percent (dependingon the sample of firms and the order of variableentry), he discounts these estimates because theymight arise from business effects not yet enteredinto the model. This conservative approach toreporting results, however, neglects useful infor-mation contained in analysis of variance estimatesof corporate effects.All else equal, a corporateeffect which is entered before the business effectand after year, industry, and industry-year inter-action effects provides an upper-bound estimateof the corporate effect, in that the estimate doesnot also reflect year and industry effects.18
Variance components
The alternative methodology of variance compo-nents estimation, sometimes termed a ‘randommodel’ of analysis of variance (e.g., Bowman andFetter, 1967), utilizes statistical techniques forestimating random effects rather than fixed (or‘stable’) effects estimated in standard analysis ofvariance. Estimation of random effects incorpo-rates the assumption that each effect represents arandom sample of the true population effect, andthat each effect (whether a main or an interactioneffect) is independent of the other effects in themodel. Schmalensee (1985) used this techniqueto decompose the variance of business prof-itability into separate classes of effects (i.e.,components of variance), followed by Rumelt(1991) and others.
In a comprehensive critique of the approach,Brush and Bromiley (1997) show that differentdraws from the same underlying distribution ofeffects produce very different estimates. Brushand Bromiley (1997) further note that accurateestimation of variance components of profitabilityrequires adjustment for the number of industries,number of corporations per industry, and numberof businesses per corporation in each sample ofdata. With regard to the number of businesses
18 Note that this upper bound may be affected by factorsdiscussed earlier, such as inclusion or exclusion of single-business firms and broad definition of industries and busi-nesses. Additionally, as noted in a subsequent section oninteraction effects, the estimate generally will not reflectcorporate choices of industries in which to operate or corpo-rate influence on industry returns.
Copyright 2001 John Wiley & Sons, Ltd. Strat. Mgmt. J.,22: 1–23 (2001)
per firm, for different reasons we have previouslynoted the sensitivity of variance decompositionestimates of corporate effects (for both analysisof variance and variance components) to theinclusion or exclusion of single-business firms.
Interaction effects
The final statistical issue that we raise has to dowith interaction or covariance effects. FollowingRumelt (1991), most of the studies that havemultiple years of data include an effect for theinteraction between industry and year, to capturetransient industry effects that vary from year toyear.19 Of greater importance for our discussionof corporate effects, few studies include inter-action or covariance effects between corporationsand years or industries.20 We examine each ofthese possible interactions in turn.
First, few variance decomposition studies pro-vide estimates of corporate effects that fluctuatethrough time, for example by using a corporate-year interaction term.21 Most studies estimate only‘stable’ (i.e., fixed) corporate effects, whichreflect differences between corporations only inthe average of their returns over time. As a result,if corporations differ in the pattern of their returnsthrough time but nevertheless have the same aver-age return over time, a study that estimates onlythe stable portion of the corporate effect will findno corporate effect.
With regard to corporate–industry interactioneffects, only Schmalensee (1985), Rumelt (1991),and McGahan and Porter (1997) include a covari-ance term in their variance component analyses.(It often is difficult to include a corporate–indus-try interaction term separate from the businesseffect in studies that rely on analysis ofvariance.22) Schmalensee (1985) and Rumelt
19 McGahan and Porter (1997) use a somewhat differentapproach to remove transient industry effects, as well astransient business and corporate effects, from their estimates.20 Brush and Bromiley (1997) also suggest that it is importantto account for covariance of corporate and business effects,a complicated issue that is beyond the scope of this analysis.21 In Table 1, the exception is Bercerra (1997). Foxet al.(1997) and McGahan and Porter (1999) also estimate bothstable and transitory corporate effects.22 For example, the studies that use analysis of variance, havemultiple years of data, and rely on dummy variables (or anequivalent technique) for businesses and corporations, essen-tially estimate business effects as the corporate–industry inter-action (i.e., the intersection of industries within corporations)(see, for example, DeGroot, 1975; Bowman and Fetter, 1967).
Does Corporate Strategy Matter? 17
(1991) note that corporations that have greaterinfluence on their businesses also may have iden-tified and entered industries that are either moreprofitable or less profitable than the average;McGahan and Porter (1997) note that some indus-tries may have greater opportunities for corporateinfluence than others. Thus, the corporate–industry covariance term may reflect importantaspects of corporatestrategy. Although Schma-lensee (1985) and Rumelt (1991) found almostno effect of covariance between corporation andindustry, McGahan and Porter (1997) found anegative and non-negligible covariance effect ofa similar magnitude to their estimated corporateeffect. McGahan and Porter (1997) suggest thatthe negative covariance indicates that corporationshave a more positive influence in less profitableindustries, and by implication, a less positive (oreven negative) influence in more profitable indus-tries.
In sum, many of the analyses in Table 1 cannotor do not separately account for the covarianceor interaction effects of corporations with indus-tries or years. The corporate-year interaction cap-tures variation in corporate influence over time,and the covariance effect between industry andcorporation may reflect corporate choices ofindustries.As a result, omission of covariance orinteraction effects leads to an incomplete descrip-tion of the influence of corporations, and ofcorporate strategy in particular, on the varianceof profitability.
DISCUSSION
We began this paper with the assertion that thevariance decomposition studies as a group suggestthat corporate strategy in fact matters. As thenext step in our analysis, we draw on the dis-cussion thus far to argue that corporate effectsare substantial rather than negligible. Then weexamine statistical evidence which suggests thatthe corporate strategy portion of corporate effectsalso is non-negligible.
It therefore is difficult to include a corporate–industry inter-action term in the analysis. (Analysis of variance studies thathave a single year of data use market share to measurebusiness effects.)
Copyright 2001 John Wiley & Sons, Ltd. Strat. Mgmt. J.,22: 1–23 (2001)
Estimates of corporate effects
Our discussion of data and statistical issues haspointed to several factors that affect the size ofestimated corporate effects. First and foremost,inclusion of single-business firms masks corporateeffects in multiple-business firms. Secondly, broaddefinitions of industries and businesses producelower estimates of corporate effects than do nar-rower definitions, in part due to a greater pro-portion of single-business firms in the sample, andin part because some cross-business influences areestimated as business rather than corporateeffects. More generally, as noted earlier in theDisney example, variance decomposition mayattribute some elements of corporate strategy tobusiness effects rather than to corporate effects.Third, analysis of variance provides useful upper-bound estimates of corporate effects that can behelpful in comparing subsamples of firms withdiffering characteristics (see, for example, McGa-han and Porter, 1998). And fourth, studies thatlack interaction or covariance effects betweencorporations and years or industries do not fullyaccount for the influence of corporate strategy onthe variance of profitability.
Non-negligible corporate effects
Despite the shortcomings of these studies, theycontain a good deal of information about corpo-rate effects. All of the studies in Table 1 exceptSchmalensee (1985) estimated non-negligiblecorporate effects based on analysis of variance.23
Of the studies that used variance components,only Schmalensee (1985) and Rumelt (1991) esti-mated negligible corporate effects.24 In short,despite the many issues we have raised, the vari-ance decomposition studies as a group show non-negligible and often substantial corporate effects.
Two recent variance decomposition studieshave suggested that corporate effects are substan-
23 Wernerfelt and Montgomery (1988) report a small butsignificant corporate effect. This effect includes only thatportion of the corporate effect associated with corporate focus.McGahan (1997) reports a negligible corporate effect using acorporate focus variable, but a substantial corporate effectotherwise.24 McGahan and Porter (1997) report a small but non-negligible corporate effect of 4.3 percent. Chang and Singh(1997) report negligible corporate effects only when industriesand businesses are defined broadly, and in the rest of thestudy report often substantial corporate effects.
18 E. H. Bowman and C. E. Helfat
tial primarily for non-manufacturing companies(McGahan and Porter, 1997) or for medium-sizedfirms (Chang and Singh, 1997), but not for largeU.S. manufacturing firms analyzed by Rumelt(1991) and Schmalensee (1985). Further consider-ation of the results reported in Table 1 andof statistical issues raised previously, however,suggests that corporate effects are substantial evenin large manufacturing companies.
First, when the analysis of large manufacturingcompanies includes only firms in which we wouldexpect to find corporate effects—namely, multi-ple-business firms—estimated corporate effectsare substantial. For large multiple-business manu-facturing firms only, Roquebertet al. (1996) esti-mated an average corporate effect of 18 percent,and McGahan and Porter (1998) estimated acorporate effect of 23.7 percent (as comparedwith an estimated corporate effect of 13.7 percentwhen the analysis included single-business firmsas well). Both of these studies used Compustatdata, which define industries and businessesbroadly and therefore may reduce the estimatedcorporate effect even when single-business firmsare excluded. As noted earlier, two other studiesdefined manufacturing industries and businessesmore narrowly than in the Compustat and FTCdata (although the analyses included single-business firms). Chang and Singh (1997) esti-mated a corporate effect of 11 percent usingvariance components analysis for the largest firmsin their sample of U.S. manufacturing firms, whenindustries and businesses were defined at the 4-digit SIC code level. And using the same datasource as did Schmalensee (1985) and Rumelt(1991), when Foxet al. (1997) defined industriesnarrowly, a corporate effect of 8.2 percentresulted in the final simulation run.
Given the foregoing evidence that corporateeffects are non-negligible even in large manufac-turing firms, it makes sense to ask why Rumelt(1991) might have obtained a negligible corporateeffect for his sample of U.S. manufacturers.Although Rumelt did find substantial corporateeffects on the order of 11–17 percent using analy-sis of variance, variance components estimationresulted in a negligible corporate effect. The FTCLine of Business data used by Rumelt (1991),however, contain some single-business firms.25 As
25 Kessides (1987) reports that 25 percent of the firms inSchmalensee’s (1985) sample of FTC data operated in only
Copyright 2001 John Wiley & Sons, Ltd. Strat. Mgmt. J.,22: 1–23 (2001)
Rumelt (1991) himself noted, Kessides (1987)reanalyzed one year of the FTC data for firmswith three or more businesses, and found a sta-tistically significant corporate effect—on the orderof 4 percent, after accounting for industry andmarket share effects.26 The FTC data also maycontain too broad a categorization of businessesand industries to accurately measure corporateinfluence on profitability.
To provide a sense of the importance of corpo-rate effects as measured by variance decomposi-tion, an example may help. Consider a businesswith 500 million dollars in assets, which is oneof several businesses in a corporation. If thecorporate effect amounts to even 10 percent ofthe variance of business profitability, this cantranslate into substantial profitability differencesbetween businesses in different corporations. Forexample, based on the distribution of returns inRumelt’s (1991) sample A (mean return on assetsof 13.92% and standard deviation of 16.71%),average profits for a 500 million dollar assetbusiness would equal 67.7 million dollars (witha standard deviation of 83.55 dollars). If weassume a normal distribution of returns, a corpo-rate effect of 10 percent in this example translatesinto a difference of 16.71 million dollars in prof-its—1/4 of the value of the mean return—betweena business at the edge of the upper sixth of thedistribution of profits and a business at the edgeof the lower sixth of the distribution.27 As thissimple example shows, a corporate effect mayinvolve a substantial sum of money, both inabsolute value and as a percentage of mean prof-its.
Implications for the importance of corporatestrategy
We noted previously that the influence on prof-itability of corporate strategy stems from corpo-
one line of business, comprising 6 percent of the businessesin the sample; 42 percent of the firms operated in at mosttwo lines of business, comprising 15 percent of the businessesin the sample.26 Kessides (1987) also found that, using 3 years of FTCdata, when the market share effect was allowed to vary byindustry, the incremental corporate effect (entered last, afterindustry and market share effects) was 11 percent.27 Approximately 2/3 of a normal distribution lies betweenthe point in the distribution which is one standard deviationabove the mean and the point which is one standard deviationbelow the mean. In this example, the difference between the

Does Corporate Strategy Matter? 19
rate management. Although the variancedecomposition studies do not provide direct evi-dence about the effects of corporate strategicmanagement, the leadership studies shown inTable 2 estimate top management effects on prof-itability. As Hambrick and Mason (1984) pointout, the discretion of top managers often is lim-ited by factors not under their control. Given thisobservation, even the lowest estimated leadershipeffect in Table 2 of 6 percent suggests thatindividual leaders (or more correctly, factorsassociated with the terms of individual leaders,such as the entire top management team) matter—and by implication, strategic management at thetop of the firm matters as well.
As noted earlier, the estimated top managementeffects reflect variation through time. Althoughnone of the variance decomposition studies inTable 1 explicitly estimate transitory top man-agement effects, a study by McGahan and Porter(1999) provides evidence regarding the magnitudeof transitory versus stable corporate, business,and industry effects. Using sequential weightedleast-squares where the corporate effect wasentered after year and industry effects but beforethe business effect, McGahan and Porter (1999)found that the average transitory (i.e.,incremental) corporate effect approximatelyequaled the average stable (i.e., fixed) corporateeffect in magnitude. The estimated fraction of theincremental component in one year that arose inthe following year was 0.72—a substantial rateof persistence.
Both the incremental corporate effect in McGa-han and Porter (1999) and the CEO effects inthe leadership studies capture aspects of variationthrough time in the corporate effect.28 McGahanand Porter (1999) show that a substantial fractionof corporate effects vary through time; the leader-ship studies show that transitory CEO effectscomprise a non-negligible portion of the totalvariance of firm profitability. Taken together, this
two points (twice the standard deviation) is 167.1 (83.5532), 10 percent of which is 16.71.28 Although the estimates of top management effects includesingle-business as well as multiple-business firms, factors suchas selection of key personnel, determination of compensationsystems, and managerial style may all form the purview oftop management in single-business as well as multiple-business firms. Therefore, the estimated CEO effect derivedfrom single-business firms should have some (but obviouslynot complete) similarity to the CEO effect derived frommultiple-business firms.
Copyright 2001 John Wiley & Sons, Ltd. Strat. Mgmt. J.,22: 1–23 (2001)
evidence suggests that transitory corporate effectsmatter, and that top management and thus corpo-rate strategy contribute to these effects. Further-more, given that the leadership studies provideevidence that CEOs matter, we can infer thatstable corporate effects also may reflect effectsof CEOs and corporate strategy on average prof-itability over time.
In sum, the leadership studies suggest thatcorporate management and corporate strategycontribute to corporate effects. Studies that esti-mateonly stable corporate effects, however, cap-ture only the impact of corporate managementon average profitability over the time period ofa study—which may exclude many influences ofcorporate strategy on profitability, includingchanges in corporate managers.
CONCLUSION
We have argued that contrary to a revisionistview of strategic management, the variancedecomposition studies suggest that corporate strat-egy matters. To conclude our discussion, we high-light key points of the analysis and evaluate theincremental addition to our knowledge that thesestudies provide about the importance of corporatestrategy. We also make suggestions for futureresearch.
Key issues
First, we have argued that the relevant criterionin the variance decomposition studies forassessing the importance of corporate strategyis whether estimated corporate effects are non-negligible. Comparison with other effects in themodel does not provide an appropriate standard.Without knowledge of the strategy portion ofeach type of estimated effect, we cannot drawdefinitive conclusions about the importance ofcorporate strategy relative to business-level orindustry-level strategy.
Second, many of the studies produce substan-tially lower estimates of corporate effects thanwould occur if the studies did not include single-business firms in the sample, or broadly defineindustries and businesses, which also increasesthe proportion of single-business firms in a sam-ple. Studies that exclude single-business firms, orthat define businesses narrowly, estimate mark-

20 E. H. Bowman and C. E. Helfat
edly higher corporate effects. Additionally, vari-ance component analyses that omit the covariancebetween corporation and industry may insuf-ficiently account for an important effect of corpo-rate strategy, since the covariance in part reflectscorporate choices of industries in which to partici-pate. As a result, even low estimates of corporateeffects may be consistent with an importantimpact of corporate strategy on profitability.
Third, despite these drawbacks, all of the stud-ies in Table 1 except Schmalensee (1985) andRumelt (1991) contain non-negligible estimatesof corporate effects. This empirical evidence thatcorporate effects are non-trivial suggests, in con-trast to the revisionist view, that firm resourcesaffect competitive advantage and disadvantage notonly at the business level but also at the corporatelevel. Additionally, the earlier leadership studiesprovide evidence of substantial effects of topmanagement on the variance of profitability. Byimplication, corporate strategic management mat-ters in explaining the variance of profitability.
Finally, the variance decomposition studiesmeasure the corporate effect as a percent of thevariance of profitability. Most of the studies donot directly address the issue of whether corpo-rations make businesses ‘better off’ (Porter, 1987)in terms of earning larger returns than stand-alone businesses.29 Nevertheless, a few of thestudies contain evidence relevant to the better-off issue. For example, the negative covariancebetween corporation and industry found byMcGahan and Porter (1997) suggests that corpo-rations may make businesses better off when thebusinesses are in poorly performing industries. Arelated study by McGahan (1999) also suggeststhat a steady increase in the extent of relatednessin diversification between 1981 and 1994 mayhave resulted from changes that favored the useof arms-lengths relationships such as alliances,rather than from any detrimental effects of corpo-rations on the level of profitability. Thus, therelationship between corporate strategy and firmperformance in diversified firms may be morecomplex than that suggested by studies showing
29 Although the data in the variance decomposition studiesmight be used to compare the average level of individualbusiness performance in multiple-business vs. single-businessfirms, the studies neither conduct such analyses nor publishdata that enable the reader to make clear inferences aboutlevels of return.
Copyright 2001 John Wiley & Sons, Ltd. Strat. Mgmt. J.,22: 1–23 (2001)
that diversified firms perform less well than sin-gle-business firms (e.g., Lang and Stulz, 1994).
Future research
Where do we go from here? We suggest threecomplementary approaches. First, insofar as pos-sible, estimate corporate effects using variancedecomposition such that the estimates more accu-rately reflect these effects in multiple-businessfirms. Second, add top management effects andvariables that reflect explicit changes over timein corporate strategy to variance decompositionstudies. Third, decompose the corporate effectinto its underlying sources using regression tech-niques. An explanation of each approach follows.
With regard to estimation ofcorporate effectsusing variance decomposition, we recommendthat studies exclude single-business firms. Indus-try and business effects estimated in this mannerof course apply only to multiple-business firms,rather than to the economy as a whole.30 It seemsreasonable, however, to ask whether corporateinfluence matters in firms in which it could pos-sibly matter, i.e., in multiple-business firms.
Additionally, the broad definition of industriesand businesses inherent in a large, accessible database like Compustat poses a difficult problem.One alternative is to obtain other data. Forexample, more detailed data on particular indus-tries that scholars or consultants may haveacquired in the course of their research, perhapsvia surveys, might allow for an accurate break-down of returns within more narrowly definedindustry segments. We also advocate inclusion invariance components studies of the covariancebetween corporate and industry effects, but notethat this may be difficult to accomplish usingstandard statistical packages.31
30 Exclusion of single-business firms from the analysis maychange the composition of industries in the sample, andtherefore may alter the estimated industry effect from thatestimated for the overall population of firms (McGahan andPorter, 1998). As noted earlier, however, the relevant standardfor assessing the importance of corporate strategy is whetheror not the corporate effect is non-negligible, rather than therelative sizes of corporate versus industry and businesseffects.31 Estimation of this covariance utilizes industry averagereturns for all firms in the sample. Analyses that excludesingle-business firms in estimating the corporate effect, as wehave advocated, therefore require data on industry averagereturns derived from a sample of both single- and multiple-business firms in order to properly estimate the corporate–industry covariance effect.
Does Corporate Strategy Matter? 21
In addition to the foregoing steps, variancedecomposition studies that include multiple yearsof data could gain additional information aboutthe effects of corporate strategy by estimating notonly stable corporate effects, but also the effectsof differences over time in top management, asin the leadership studies. Studies also couldincorporate the effects of specific changes incorporate strategy initiated by corporate man-agement, such as changes in organizational struc-ture.
Finally, regressions that decompose the corpo-rate effect into variables which represent differentpossible underlying sources of the corporate effectwould serve as a useful complement to variancedecomposition studies. James (1997) takes thisapproach, and finds large corporate and largebusiness effects.
Although a careful analysis of the variancedecomposition studies as a group suggests thatcorporate effects are non-negligible, these studiesraise complex statistical issues. We haveaddressed only some of these here. Many of thestudies discussed previously deal in detail withnuances of technique and data analysis, to whichwe refer the interested reader. In addition, ouranalysis has focused primarily on corporateeffects. The variance decomposition studies alsodeal with industry and business effects, a detailedanalysis of which is beyond the scope of thisarticle.32 In fact, the early studies by Rumelt(1991) and Schmalensee (1985) emphasized thedebate about the relative importance of industryand business. Our arguments instead have aimedto dispel the view that corporations don’t matter.To the contrary, managers, consultants, and aca-demics that deal with corporate strategy are notwasting their time.
ACKNOWLEDGEMENTS
We have benefited greatly from the comments ofand discussions with: Ron Adner, Philip Bromi-ley, Geoff Brooks, Ioannis Kessides, BruceKogut, Dan Levinthal, Anita McGahan, Cynthia
32 See McGahan and Porter (1998) for a comparison of thefindings of Schmalensee (1985), Rumelt (1991), Roquebertetal. (1996) and McGahan and Porter (1997) regarding theseother effects.
Copyright 2001 John Wiley & Sons, Ltd. Strat. Mgmt. J.,22: 1–23 (2001)
Montgomery, Yiorgos Mylonadis, Robert Phillips,Jan Rivkin, Gabriel Szulanski, Sid Winter, andparticipants in the Wharton School Jones Centerbrown bag lunch seminar. This paper also ben-efited from a presentation at the annual Academyof Management meeting. We thank the ReginaldH. Jones Center for Management Policy, Strategyand Organization at the Wharton School for par-tial financial support.
REFERENCES
Andrews KR. 1987.The Concept of Corporate Strategy,3rd edn, Richard D. Irwin: Homewood, IL.
Bain JS. 1956.Barriers to New Competition. HarvardUniversity Press: Cambridge, MA.
Barney JB. 1991. Firm resources and sustainedcompetitive advantage.Journal of Management17:99–120.
Bercerra M. 1997. How much do MNC corporate head-quarters matter? Working paper, Michigan State Uni-versity.
Bowman EH. 1990. Strategy changes: possible worldsand actual minds. InPerspectives on Strategic Man-agement, Fredrickson JW (ed.). Harper & Row: NewYork; 9–37.
Bowman EH, Fetter RB. 1967.Analysis for Productionand Operations Management. Richard D. Irwin:Homewood, IL.
Brush TH, Bromiley P. 1997. What does a smallcorporate effect mean? A variance components simu-lation of corporate and business effects.StrategicManagement Journal18(10): 825–835.
Carroll GR. 1993. A sociological view on why firmsdiffer. Strategic Management Journal14(4): 237–249.
Castanias RP, Helfat CE. 1991. Managerial resourcesand rents.Journal of Management17: 155–171.
Castanias RP, Helfat CE. 1992. Managerial and wind-fall rents in the market for corporate control.Journalof Economic Behavior and Organization18: 153–184.
Chandler A. 1962.Strategy and Structure: Chapters inthe History of American Industrial Enterprise. MITPress: Cambridge, MA.
Chandler A. 1977.The Visible Hand: The ManagerialRevolution in American Business. Harvard Univer-sity Press: Cambridge, MA.
Chang S, Singh H. 1997. Corporate and industry effectson business unit competitive position. Working pa-per, University of Pennsylvania.
Cubbin J, Geroski P. 1987. The convergence of profitsin the long run: inter-firm and inter-industry com-parisons. Journal of Industrial Economics35:427–442.
DeGroot MH. 1975. Probability and Statistics.Addison-Wesley: Reading, MA.

22 E. H. Bowman and C. E. Helfat
Demsetz H. 1973. Industry structure, market rivalry,and public policy.Journal of Law and Economics16: 1–9.
Fox I, Srinivasan S, Vaaler P. 1997. Some construc-tive skepticism about the origins of profit. UnitedStates Federal Trade Commission, Bureau ofEconomics Line of Business Paper Series, Wash-ington, DC.
General Electric. 1995. Annual Report to Shareholders.Ghemawat P. 1994. Nucor at a crossroads: teaching
note. Harvard Business School, Boston, MA.Ghemawat P, Ricart i Costa JE. 1993. The organi-
zational tension between static and dynamicefficiency. Strategic Management Journal, WinterSpecial Issue14: 59–73.
Goold M, Campbell A. 1987.Strategies and Style.Basil Blackwell: Oxford.
Grant RM. 1995.Contemporary Strategy Analysis, 2ndedn, Basil Blackwell: Oxford.
Hambrick DC, Mason PA. 1984. Upper echelons: theorganization as a reflection of its top managers.Academy of Management Review9: 193–206.
Hansen GS, Wernerfelt B. 1989. Determinants of firmperformance: the relative importance of economicand organizational factors.Strategic ManagementJournal 10(5): 399–411.
Hitt MA, Hoskisson RE, Kim H. 1997. Internationaldiversification: effects on innovation and firm per-formance in product-diversified firms.Academy ofManagement Journal40: 767–798.
Hoskission RE, Hill CWL, Kim H. 1993. Themultidivisional structure: organizational fossil orsource of value?Journal of Management19: 269–298.
James CR. 1997. Unbundling corporate effects: doesthe corporate general office matter? Working paper,University of California, Los Angeles.
Kennedy P. 1985.A Guide to Econometrics, 2nd edn,MIT Press: Cambridge, MA.
Kessides IN. 1987. Do firms differ much? Someadditional evidence. Working paper, University ofMaryland.
Kessides IN. 1990. Internal versus external marketconditions and firm profitability: an exploratorymodel. The Economic Journal100: 773–792.
Lang LHP, Stulz RM. 1994. Tobin’s q, corporate diver-sification, and firm performance.Journal of PoliticalEconomy102: 1248–1280.
Lieberson S, O’Connor JF. 1972. Leadership andorganizational performance: a study of large corpo-rations.American Sociological Review37: 117–130.
Liebeskind J. 2000. Internal capital markets: benefits,costs, and organizational arrangements.OrganizationScience11: 58–76.
Mauri AJ, Michaels MP. 1998. Firm and industryeffects within strategic management: an empiricalexamination.Strategic Management Journal19(3):211–220.
McGahan AM. 1997. The influence of competitiveposition on corporate performance. Working paper,Harvard Business School.
McGahan AM. 1999. The performance of U.S. corpo-
Copyright 2001 John Wiley & Sons, Ltd. Strat. Mgmt. J.,22: 1–23 (2001)
rations: 1981–1994.Journal of Industrial Economics47(4): 373–398.
McGahan AM, Porter ME. 1997. How much doesindustry matter really?Strategic Management Jour-nal, Summer Special Issue18: 15–30.
McGahan AM, Porter ME. 1998. What do we knowabout variance in accounting profitability? Workingpaper, Harvard Business School.
McGahan AM, Porter ME. 1999. The persistence ofshocks to profitability.Review of Economics andStatistics81(1): 143–153.
Miller CC, Cardinal LB. 1994. Strategic planning andfirm performance: a synthesis of more than twodecades of research.Academy of Management Jour-nal 37: 1649–1665.
Montgomery CA. 1994. Corporate diversification.Jour-nal of Economic Perspectives8: 163–178.
Nelson RR, Winter SG. 1982.An Evolutionary Theoryof Economic Change. Belknap Press of HarvardUniversity Press: Cambridge, MA.
Peteraf MA. 1993. The cornerstones of competitiveadvantage: a resource–based view.Strategic Man-agement Journal14(3): 179–191.
Porter ME. 1987. From competitive advantage to corpo-rate strategy. Harvard Business Review65(3):43–59.
Powell TC. 1996. How much does industry matter?An alternative empirical test.Strategic ManagementJournal 17(4): 323–334.
Prahalad CK, Hamel G. 1990. The core competence ofthe corporation.Harvard Business Review68(3):79–91.
Ravenscraft DJ. 1983. Structure–profit relationships atthe line of business and industry level.Review ofEconomics and Statistics65: 22–31.
Roquebert JA, Phillips RL, Westfall PA. 1996. Marketsvs. management: what drives profitability?StrategicManagement Journal17(8): 653–664.
Rumelt RR. 1974.Strategy, Structure, and EconomicPerformance. Harvard Business School Press: Bos-ton, MA.
Rumelt RR. 1991. How much does industry matter?Strategic Management Journal12(3): 167–185.
Salancik GR, Pfeffer J. 1977. Constraints on adminis-trator discretion: the limited influence of mayors oncity budgets.Urban Affairs Quarterly12: 475–498.
Schmalensee R. 1985. Do markets differ much?Amer-ican Economic Review75: 341–351.
Teece DJ. 1981. Internal organization and economicperformance.Journal of Industrial Economics30:173–199.
Thomas AB. 1988. Does leadership make a differenceto organizational performance?AdministrativeScience Quarterly33: 388–400.
Weiner N. 1978. Situational and leadership influenceon organization performance.Proceedings of theAcademy of Management230–234.
Weiner N, Mahoney TA. 1981. A model of corporateperformance as a function of environmental, organi-zational, and leadership influences.Academy of Man-agement Journal24: 453–470.
Wernerfelt B, Montgomery CA. 1988. Tobin’s q and

Does Corporate Strategy Matter? 23
the importance of focus in firm performance.Amer-ican Economic Review78: 246–250.
Williamson OE. 1975.Markets and Hierarchies: Analy-sis and Antitrust Implications. Free Press: New
Copyright 2001 John Wiley & Sons, Ltd. Strat. Mgmt. J.,22: 1–23 (2001)
York.Williamson OE. 1985.The Economic Institutions of
Capitalism. Free Press: New York.
Recommended


